Article

Microwave-Assisted Hydrothermal Carbonization of Pomegranate Peels into Hydrochar for Environmental Applications

Department of Chemistry, College of Science, King Faisal University, P.O. Box 400, Alahsa 31982, Saudi Arabia
Energies 2022, 15(10), 3629; https://doi.org/10.3390/en15103629
Submission received: 25 April 2022 / Revised: 11 May 2022 / Accepted: 11 May 2022 / Published: 16 May 2022

Abstract

:
Several studies have reported that the hydrothermal carbonization method (HTC) of agricultural waste is able to produce a solid residue with interesting properties for the adsorption of organic pollutants from contaminated water. This work represents a facile method to prepare hydrochar (HC) from pomegranate peels’ waste using the microwave-assisted hydrothermal carbonization method (MHTC) at 200 °C for 1 h with a mass ratio of peel to water = 1:10. Activated hydrochar (AHC) was prepared by in situ chemical activation using ZnCl2 and MHTC. Several techniques have been applied to characterize the prepared samples as FTIR, XRD, TEM and SEM. The samples were investigated for their possible use as adsorbents of methylene blue (MB) dye. The results confirm the formation of amorphous hydrochar with a porous structure. The pH of zero point charge (pHzpc) is 4.3 and 4.6 for HC and AHC samples, respectively. The maximum adsorption capacity of HC and AHC samples are 194.9 and 12.55 mg/g (i.e., mg of adsorbate/g of adsorbent), respectively.

Graphical Abstract

1. Introduction

The word “hydrothermal” was coined by Sir R. Murchison to describe how high-temperature water affects the crust of the earth [1]. The hydrothermal method is a wet synthesis route in which the precursors are held in vessels under high pressure and at a temperature higher than the boiling point of water. This energy-efficient method utilizes temperatures lower than those employed in conventional synthesis routes [1,2,3]. When the hydrothermal method is applied to agricultural waste to produce hydrochar, the method is named the hydrothermal carbonization method (HTC). Recently, the microwave-assisted hydrothermal carbonization method (MHTC) has been applied to prepare hydrochar [4]. It is known that microwave heating is more efficient and time-saving due to molecular level heating [5]. The MHTC method provides several advantages, such as saving time and energy, which increases the value of this method environmentally and economically [4,6,7,8,9,10]. Hydrochar is an emerging adsorbent of organic pollutants from contaminated water, and it resembles double benefits for the environment; the first is recycling the waste, and the second is its application to remove the pollutants. Additionally, biochar is used as an adsorbent, which is prepared through thermal decomposition of biomass in the absence of oxygen (i.e., pyrolysis) [11]. The pyrolysis process is executed at a higher temperature (500–700 °C) than the temperature used in the HTC method (180–250 °C). It is reported that the hydrochar derived through the HTC method contains more oxygen-containing functional groups (OFGs) than biochar derived through pyrolysis, which contains more aromatic structures [12]. OFGs as carboxylic, hydroxyl and carbonyl groups provide surface complexation, which improves the chemical reactivity and increases its adsorption capacity [13,14,15,16].
Hydrochar is formed as a result of various reactions, such as hydrolysis, dehydration, decarboxylation, condensation, polymerization and aromatization. The application of hydrochar in adsorption is based on the surface oxygen-containing functional groups, surface area and pore structure [15]. Hydrochar can be thermally activated at high temperatures or chemically activated [17,18]. In the chemical activation, corrosive materials are applied on hydrochar feedstock to remove any unwanted residuals and to enrich surface functional groups [19]. The most common activating agents are citric acid [18], HCl [20], KOH [18,21], H3PO4, NaOH, Na2CO3 and ZnCl2 [22,23]. Moreover, it has been reported that ZnCl2 prohibited the formation of tars by facilitating polycyclic aromatization and polycondensation [24].
Char-based materials have been synthesized from many agricultural waste feedstock, such as sugarcane bagasse [21], hickory [25], bamboo [25,26], cassava root husk [27], camellia oleifera shells [28], sunflower husk [29], date stone [18] and pomelo peel [30]. Moreover, bovine bone [11], cattle manure [31] and egg white [32] have been used as waste feedstock for char-based materials. M. Siddiqui et al. prepared biochar through slow pyrolysis from pomegranate peel at temperatures between 300 and 600 °C and a time between 20 and 60 min. [33].
The world production of pomegranate (Punica granatum) is reported to be about 2.84 million tons [22,34]. Pomegranate fruits are commercially used in products such as juices, jams and jellies. When pomegranate is pressed, about 34% of its content produces juice, and the remaining is food-waste, which is mainly composed of lignin, cellulose and hemicellulose [35,36]. In 2017, worldwide waste of pomegranate peel was estimated to be ~1.9 million tons [34]. Recently, pomegranate peels have been applied as natural antioxidants to prevent meat oxidation instead of synthetic antioxidants [37,38], biodegradable films [39] and adsorbents of RhodamineB dye [40].
Water pollution has become a global challenge with the increasing population and industrial civilization. Many techniques are used in water treatment such as advanced oxidation processes (AOPs), photocatalysis and adsorption [41]. AOPs provide a faster reaction rate, but their cost is expensive, and some chemicals are used that may cause secondary pollution [42]. Photocatalysis is a well-established method with drawbacks, e.g., the products of photocatalysis may cause pollution. Adsorption is considered one of the most attractive techniques for the remediation of organic dyes from water systems. This is mainly due to its simplicity, high efficiency, low cost, low maintenance requirements and the convenience of various adsorbents that can be utilized for this purpose. Many researchers reported the successful removal of water pollutants by adsorption using char-based materials. P. Pauletto et al. prepared bone-based biochar and avocado-based hydrochar and applied both samples in the adsorption of 2-nitrophenol with high adsorption capacities of 761 and 562 mg/g, respectively [11]. H. Li et al. prepared bamboo-based hydrochar with a high adsorption capacity of methylene blue dye [43]. M. Costa et al. prepared corn-stove-based hydrochar by hydrothermal carbonization and applied it in the adsorption of acetic acid with high efficiency [20]. S. Wang et al. prepared Willow-wood-based biochar via pyrolysis and applied it for the adsorption of Ni(II), Cu(II) and Cd(II) [31]. F. Tomul et al. prepared peanut-shell-based biochar and applied it for the adsorption of naproxen [44]. N. Saha et al. prepared hydrochar from the wastes of grape skin and orange peel through the HTC method. They applied the prepared hydrochar samples in the adsorption of MB dye with a maximum adsorption capacity of 66.23 and 22.83 mg/g at 4 °C for orange-peel-based hydrochar and grape-skin-based hydrochar, respectively [13]. M. Ahmad et al. prepared char (PP char) through the pyrolysis of pomegranate peels at 700 °C under N2 flow, followed by microwave-induced KOH activation, which resulted in activated carbon (PPAC). The surface area was 115 m2/g and 941 m2/g of PP char and PPAC, respectively. They applied PPAC for the adsorption of Remazol brilliant blue R dye with a maximum adsorption capacity of 199 mg/g at 30 °C [45].
In this study, we, for the first time, reported the use of the MHTC method to prepare pomegranate-peel-based hydrochar (HC). Moreover, the effect of ZnCl2 as an activating agent to prepare activated hydrochar (AHC) with the MHTC method was studied. Finally, the main objective was to evaluate the efficiency of HC and AHC samples as adsorbents for MB dye at different concentrations. The surface functionality, morphology and pH of zero point charge (pHzpc) were investigated. This study allows us to save time using the MHTC method and evaluate the maximum adsorption capacity.

2. Materials and Methods

All chemicals were used as received without further purification. Methylene Blue (C16H18ClN3S), ZnCl2, KOH, NaOH, ammonia (25% NH3), HCl (37%) and NaCl were purchased from Sigma-Aldrich. Double-distilled water was used to prepare all solutions used for synthesis and degradation tests.
An Orion 2 Star pH meter (Thermo Fisher Scientific, Waltham, MA, USA) was used for the pH adjustment. The Cary 630 FTIR spectrophotometer was used to execute the FTIR analysis. The Bruker D8 X-ray Diffractometer was used to execute the XRD analysis with Cu-Kα radiation and λ = 1.5418 Å. TEM photos were taken with a JEOL JEM-1011 transmission electron microscope. SEM photos were taken with a Philips XL30 scanning electron microscope with an accelerating voltage of 30 kV. The MHTC was executed in the PerkinElmer-microwave sample preparation system- Titan MPS (magnetron frequency 2450 MHz; magnetron power 1200 W).

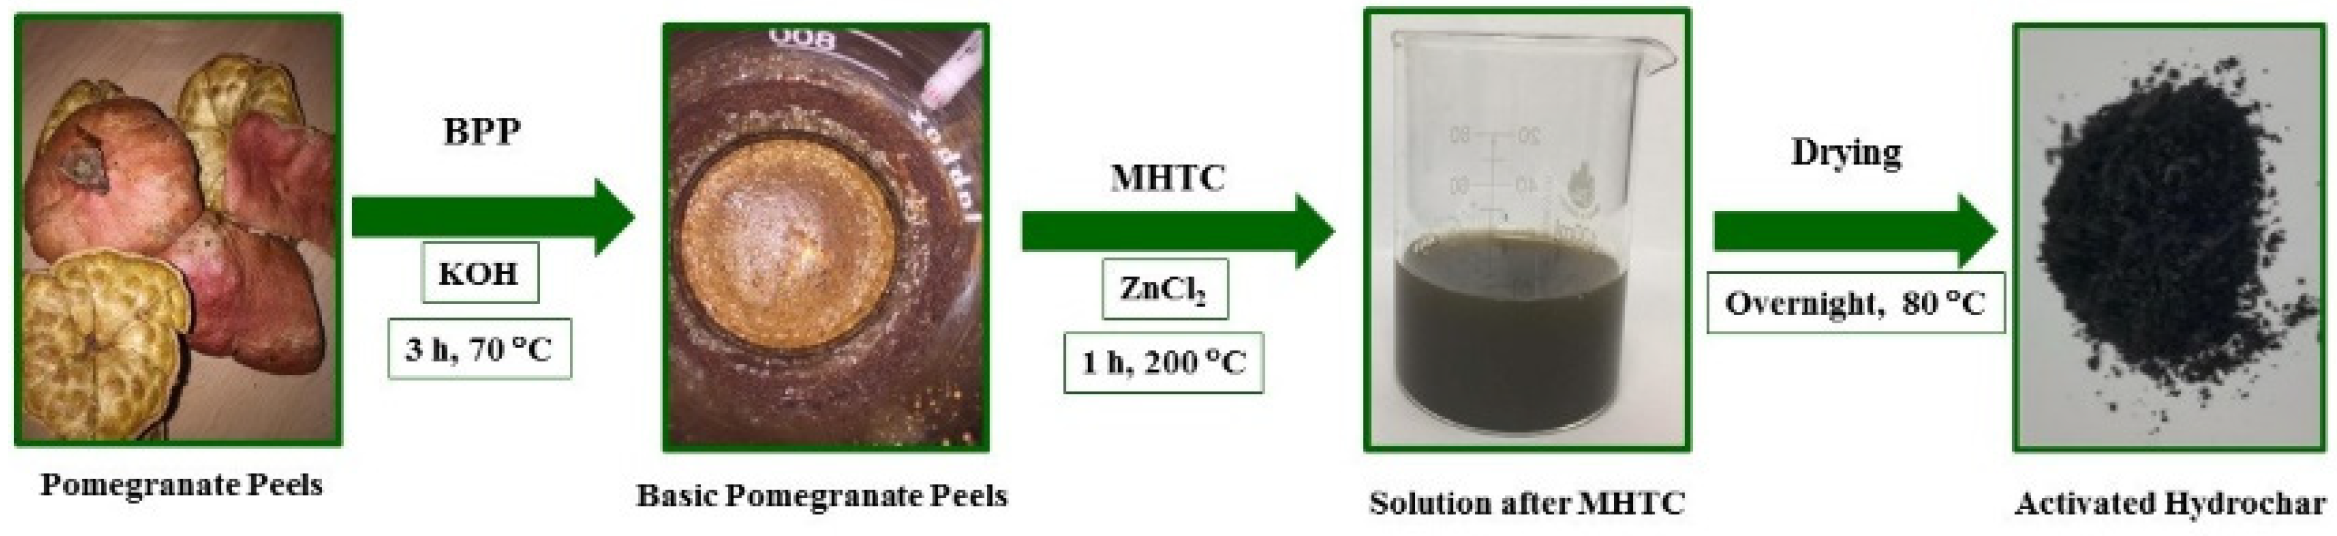
2.1. Basic Pre-Treatment of Pomegranate Peels (BPPs)

Pomegranate peels (PPs) were thoroughly washed with tap water to remove any contamination and then with distilled water before drying at room temperature for several days. Then, the dried peels were cut and ground in a kitchen grinder, followed by thieving through 1 mm mesh. A basic treatment with 0.1 M KOH was applied to remove any waxy residual. In a typical treatment, 100 g of ground peels were mixed with 1 L of 0.1 M KOH and heated for 3 h at 70 °C [46]. This sample is named basic pomegranate peels (BPPs).

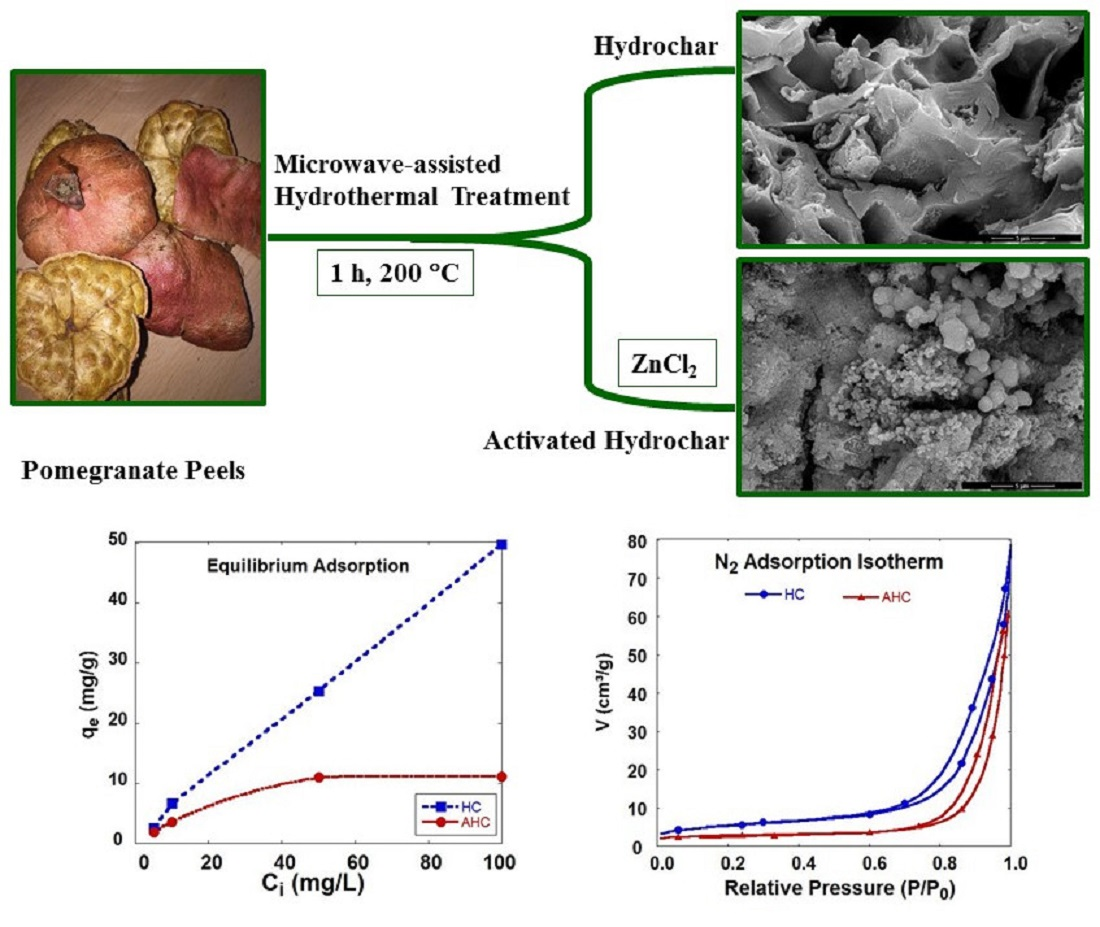
2.2. Synthesis of Hydrochar (HC)

Six grams of BPPs were mixed with 60 mL of deionized water and transferred to a Teflon-lined autoclave. The hydrothermal carbonization method (HTC) was executed at 200 °C for 24 h, and this sample is called HTC-HC [46]. Applying the HTC method for a longer time is preferable for producing solid hydrochar rather than liquid or gas products [47]. On the other hand, the microwave-assisted hydrothermal carbonization method (MHTC) was executed at 200 °C for 1 h only, and this sample is called HC. It is known that microwave heating is more efficient and time-saving as the heat is transferred from the center to the surface of the heated biomass [5]. The sample was washed and dried at 80 °C overnight.

2.3. Synthesis of Activated Hydrochar (AHC)

Six grams of BPPs were mixed with 50 mL of deionized water in addition to 10 mL of 6 M ZnCl2 as an activating agent. The MHTC method was executed at 200 °C for 1 h, and this sample is called AHC [6]. The sample was washed and dried at 80 °C overnight. Scheme 1 represents steps of the synthesis.

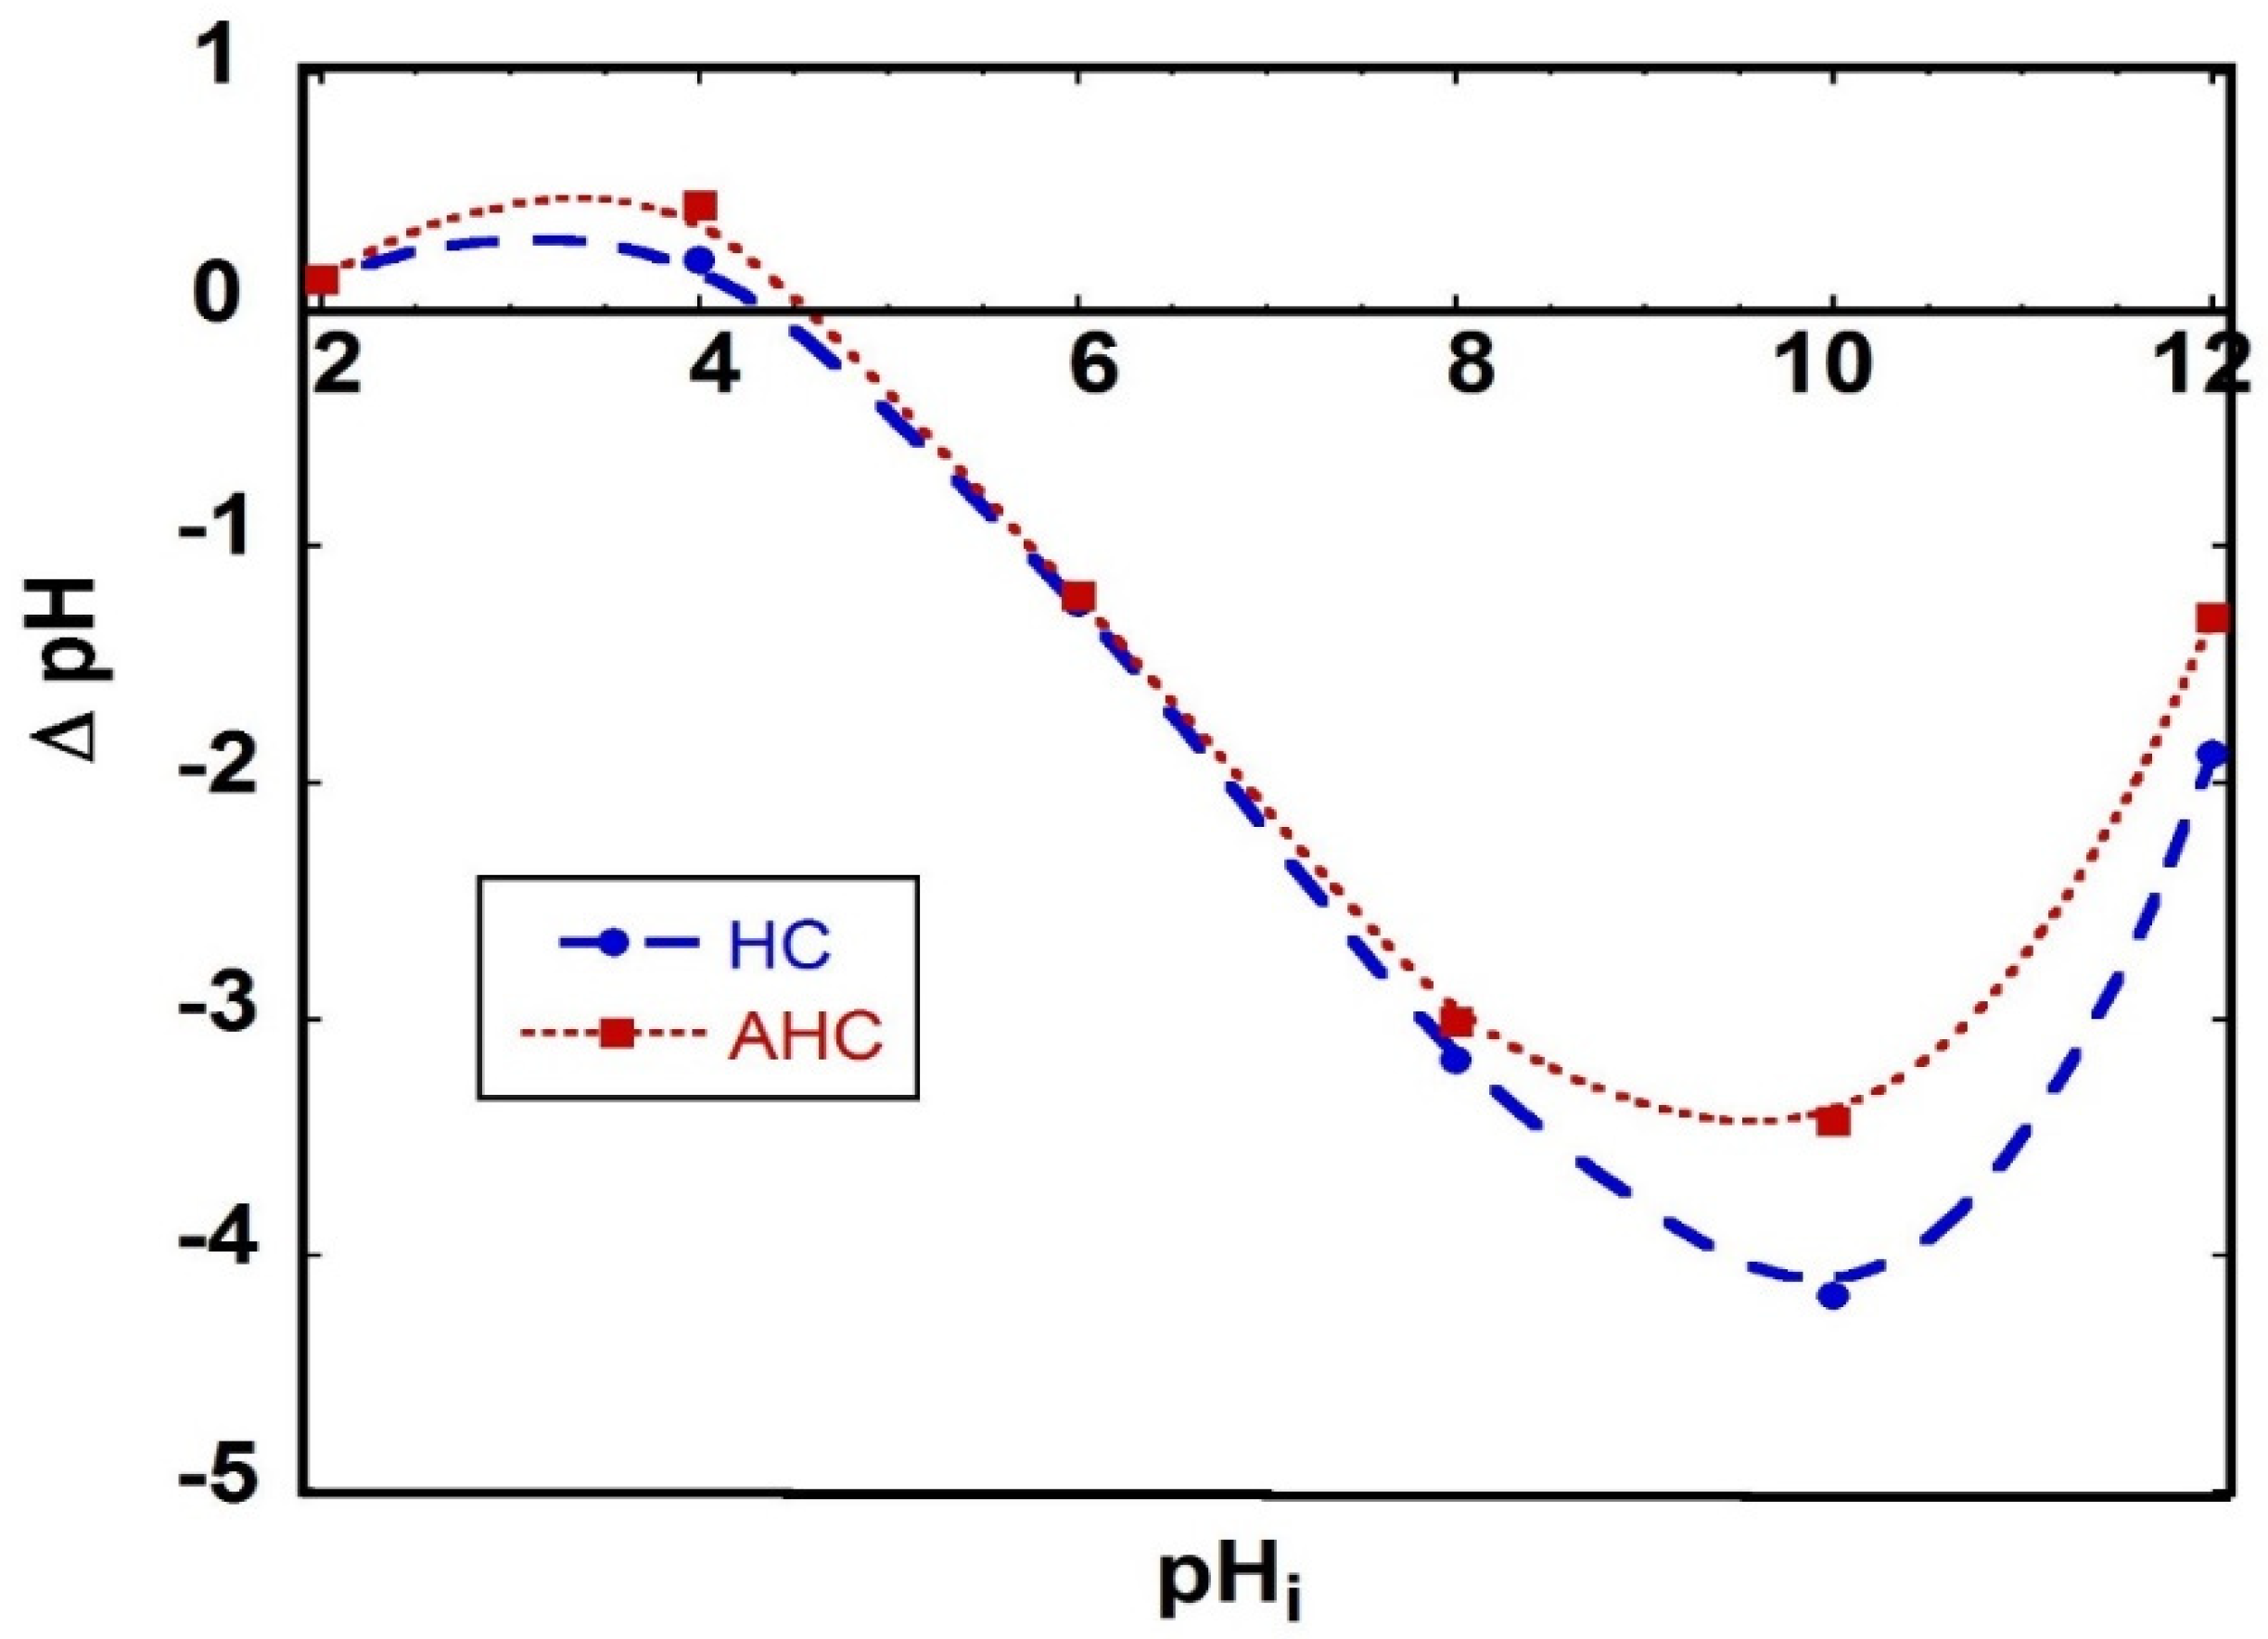
2.4. Determining the pH of the Zero Point Charge (pHzpc)

A series of 0.1 M NaCl solutions with different initial pH levels (pHi) in the range of 2–12 was adjusted by 0.1 M NaOH or 0.1 M HNO3. Then, 0.2 g of each sample was mixed with about 200 mL of the prepared solutions with different pH levels. The pH at equilibrium (pHe) is measured after leaving mixtures for 24 h while being stirred at 350 rpm and a temperature of 25 °C.

2.5. Equilibrium Adsorption of Methylene Blue Dye

Three different concentrations (5, 10 and 50 ppm) of the MB dye solution were prepared by consecutive dilutions of the 100 ppm solution. To prepare the 100 ppm MB dye solution, one hundred mg of MB dye was mixed with one liter of double distilled water. The pH of the MB dye is ~6.
About 100 mg of each sample was added to a glass containing 50 mL of the MB dye solutions with Ci equal to 5, 10, 50 or 100 ppm. The conditions of the experiment were set: temperature of 25 °C; pH 8; shaking rate of 350 rpm; and equilibrium time of 24 h. After 24 h, the sample was separated by centrifuge, and a UV spectrophotometer was used to measure the equilibrium concentration (Ce) at λmax of the MB dye (i.e., 664 nm). The amount of MB dye adsorbed ( q e ) was calculated using Equation (1), and the removal efficiency (R%) was calculated using Equation (2):
q e = ( Ci Ce ) m   V
R % = ( Ci Ce ) Ci   100
where:
  • qe = the equilibrium adsorption capacity in mg/g (i.e., mg of adsorbate/g of adsorbent);
  • Ci = the initial concentrations (ppm);
  • Ce = the equilibrium concentrations (ppm);
  • V = the volume of the dye solution in L;
  • M = the mass of adsorbent used in g;
  • R% = the removal efficiency.
Langmuir and Freundlich adsorption isotherms were used to fit the experimental data by nonlinear regression with the aid of the CAVS—adsorption evaluation 2.0 program using Equations (3) and (5), respectively.
q e = q l K l C e / ( 1 + K l C e )
where:
  • qL = the Langmuir monolayer sorption capacity (mg/g);
  • KL = the Langmuir constant.
RL is a separation factor or equilibrium parameter from the Langmuir isotherm and can be calculated using Equation (4). It is a dimensionless factor and gives an indication about the progression of the adsorption. If its value equals 0, the adsorption is reversible; if its value is less than 1 and larger than zero, the adsorption is favorable; and if its value is larger than 1, the adsorption is unfavorable.
R L = 1 / ( 1 + k l C i )
q e = K fr Ce 1 / n fr
where:
  • Kfr = the Freundlich constant ((mg/g) (L/mg));
  • Nfr = the Freundlich exponent.
The parameter 1/n is related to the surface heterogeneity. When it is <1, the surface is more heterogeneous, and when it reaches 1, the surface is more homogeneous.

3. Results and Discussion

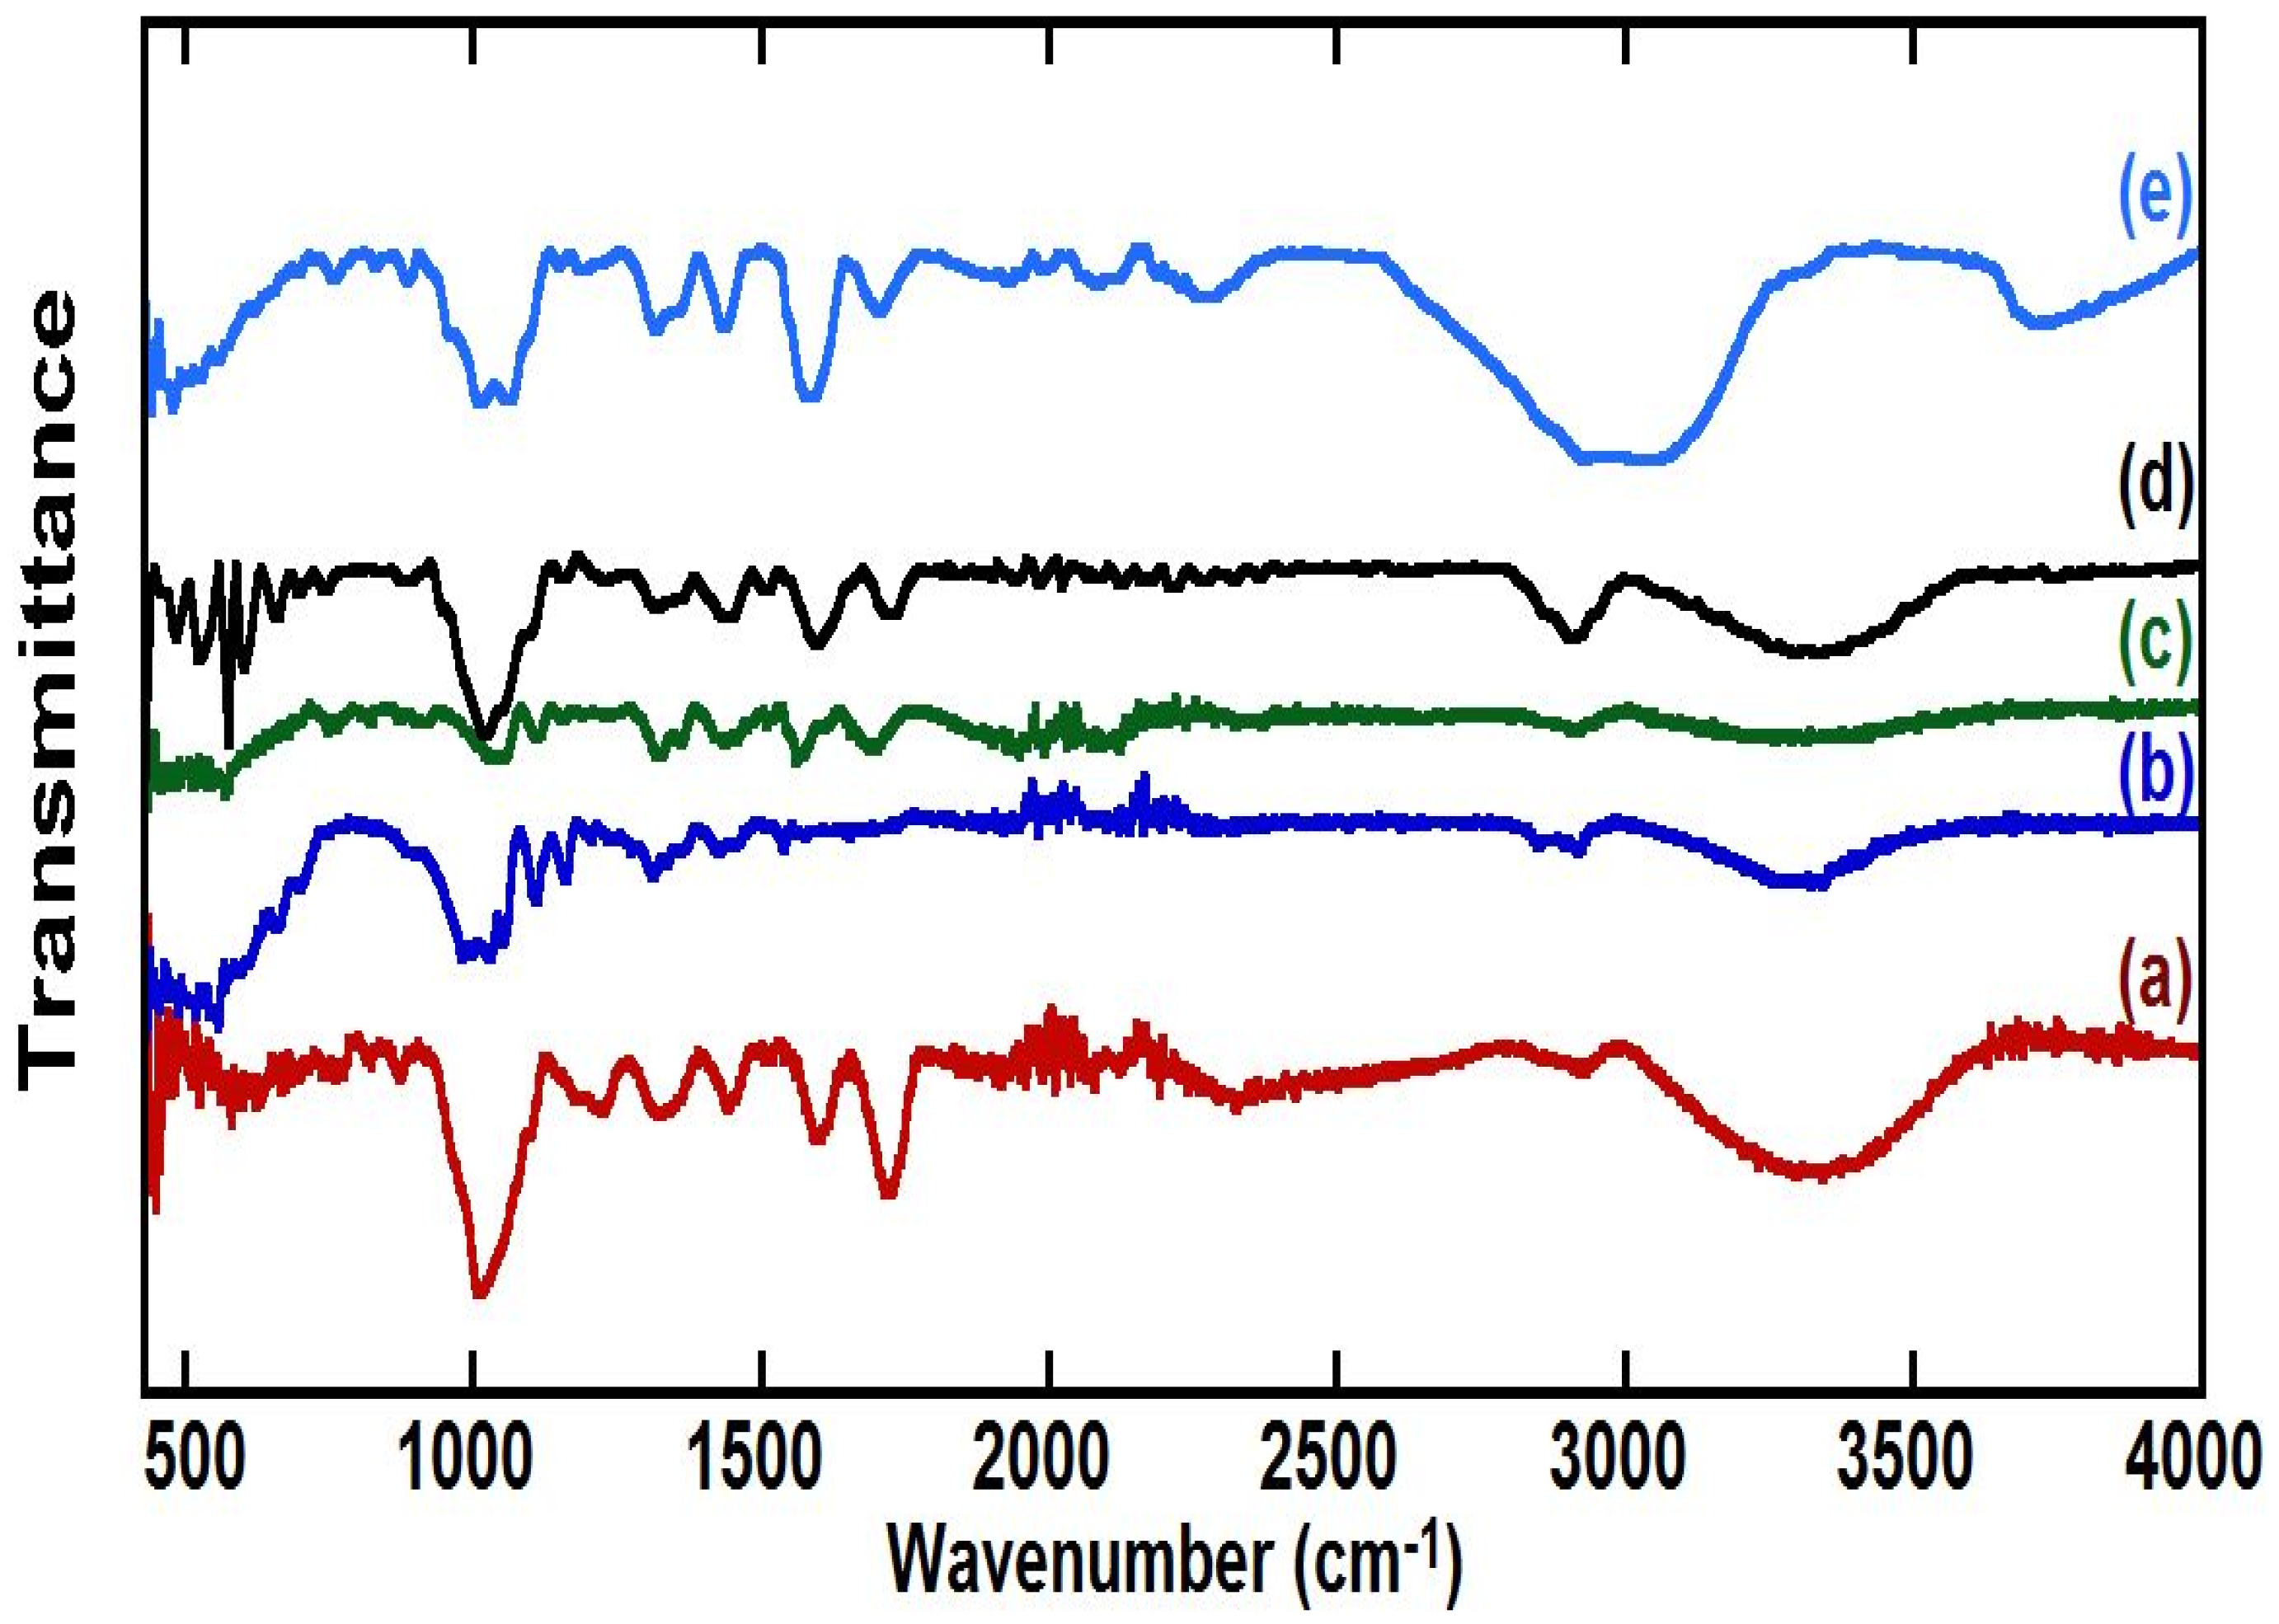
3.1. FTIR Characterization

Figure 1a represents the FTIR spectra of dried and ground pomegranate peels (PPs). The broad band centered at about 3400 cm−1 is related to the stretching mode of the O-H band involved in the hydrogen bridging bonding, while the peaks at 3000–2900 cm−1 should be assigned to the C-H stretching mode of aliphatic and unsaturated. A sharp peak at 1700 cm−1 stands for carbonyl groups, and another sharp one at about 1600 cm−1 stands for aromatic ring stretching. Peaks at 1450 cm−1 and 1330 cm−1 may stand for asymmetric bending and symmetric bending of methyl groups. Peaks at 1224 cm−1 and 875 cm−1 represent in-plane and out-of-plane bending of –CH aromatic of the lignin of peels. A broad band at 1022 cm−1 may refer to the bending of aromatic C-H or C-O-C groups. Figure 1b represents the pomegranate peels after basic pre-treatment with KOH for 3 h at 70 °C. The FTIR spectrum is similar to the FTIR spectrum of peels with more intensive peaks for aliphatic C-H bonds (~2900 cm−1), C=C stretching vibration (~1540 cm−1) and CH groups (~1030 cm−1).
Figure 1c shows the FTIR spectra of the HTC-HC sample prepared by hydrothermal carbonization at 200 °C for 24 h, and Figure 1d shows the FTIR spectra of HC after the MHTC method for 1 h. Both samples have a broad peak at 3000–3600 cm−1, which may correspond to the stretching vibration of OH groups and stretching vibration of aromatic and aliphatic C-H the stretching vibration of aromatic and aliphatic C-H (3000–3100 cm−1). A small peak around 2900 cm−1 may stand for symmetric stretching and a shoulder at 2850 cm−1 for asymmetric stretching of methyl groups. A peak at ~1690–1725 cm−1 stands for carbonyl groups. Sharp peaks at ~1560−1590 cm−1 and ~1440 cm−1 stand for aromatic ring stretching. Peaks at 1330 cm−1 may stand for asymmetric and symmetric bending of methyl groups. Peaks at 1224 cm−1 and 875 cm−1 in-plane and out-of-plane bending of –CH aromatic. A broad band at 1022–1050 cm−1 may refer to the bending of aromatic C-H or C-O-C groups. The HC sample shows more intense peaks in the 700–500 cm−1 region, which stands for the aromatic skeleton, indicating that the MHTC method helped in more aromatization of pomegranate peels. Both spectra show similar peaks, indicating that both treatments produce similar products with time-saving in the case of microwave treatment [11,29,44].
Figure 1e shows the FTIR spectrum of the AHC sample through in situ chemical activation with ZnCl2 and the MHTC method. The FTIR spectrum of the AHC sample shows a peak at 3500–3700 cm−1, which is for the stretching vibration of OH groups that has been shifted to a higher wavenumber compared to the peak of the hydroxyl group in the HC sample. Moreover, at 2800–3200 cm−1, the symmetric and asymmetric stretching of aromatic CH is more intense than the one observed for the HC sample. The AHC sample shows a medium peak at 2090 cm−1, which is characteristic of stretching allene (C=C=C). The peak at ~1710 cm−1 is for C=O, which has been shifted to a lower value compared to the HC sample. This shift may indicate the formation of quinone through the crosslinking of small molecules formed by ZnCl2 activation. The peaks observed at ~1590 cm−1 is for C=C group, at ~1440 cm−1 is for –COOH group, at 1315 cm−1 is for quinonic OH group, and at ~1000 cm−1 is for C-O group in aromatic phenol or ether. The observed peaks at ~1060 cm−1, 955 cm−1 and 890 cm−1 are for aromatic CH. This comparison indicates the effect of chemical activation by ZnCl2 resulted in a higher content of aromaticity (intense peak of CH at 2800–3200 cm−1), as has been reported in a previous study, which stated that ZnCl2 accelerates biomass decomposition and polymerization [23]. Moreover, ZnCl2 accelerates dehydration, leading to a decrease in the intensity of the OH peak.

3.2. XRD Characterization
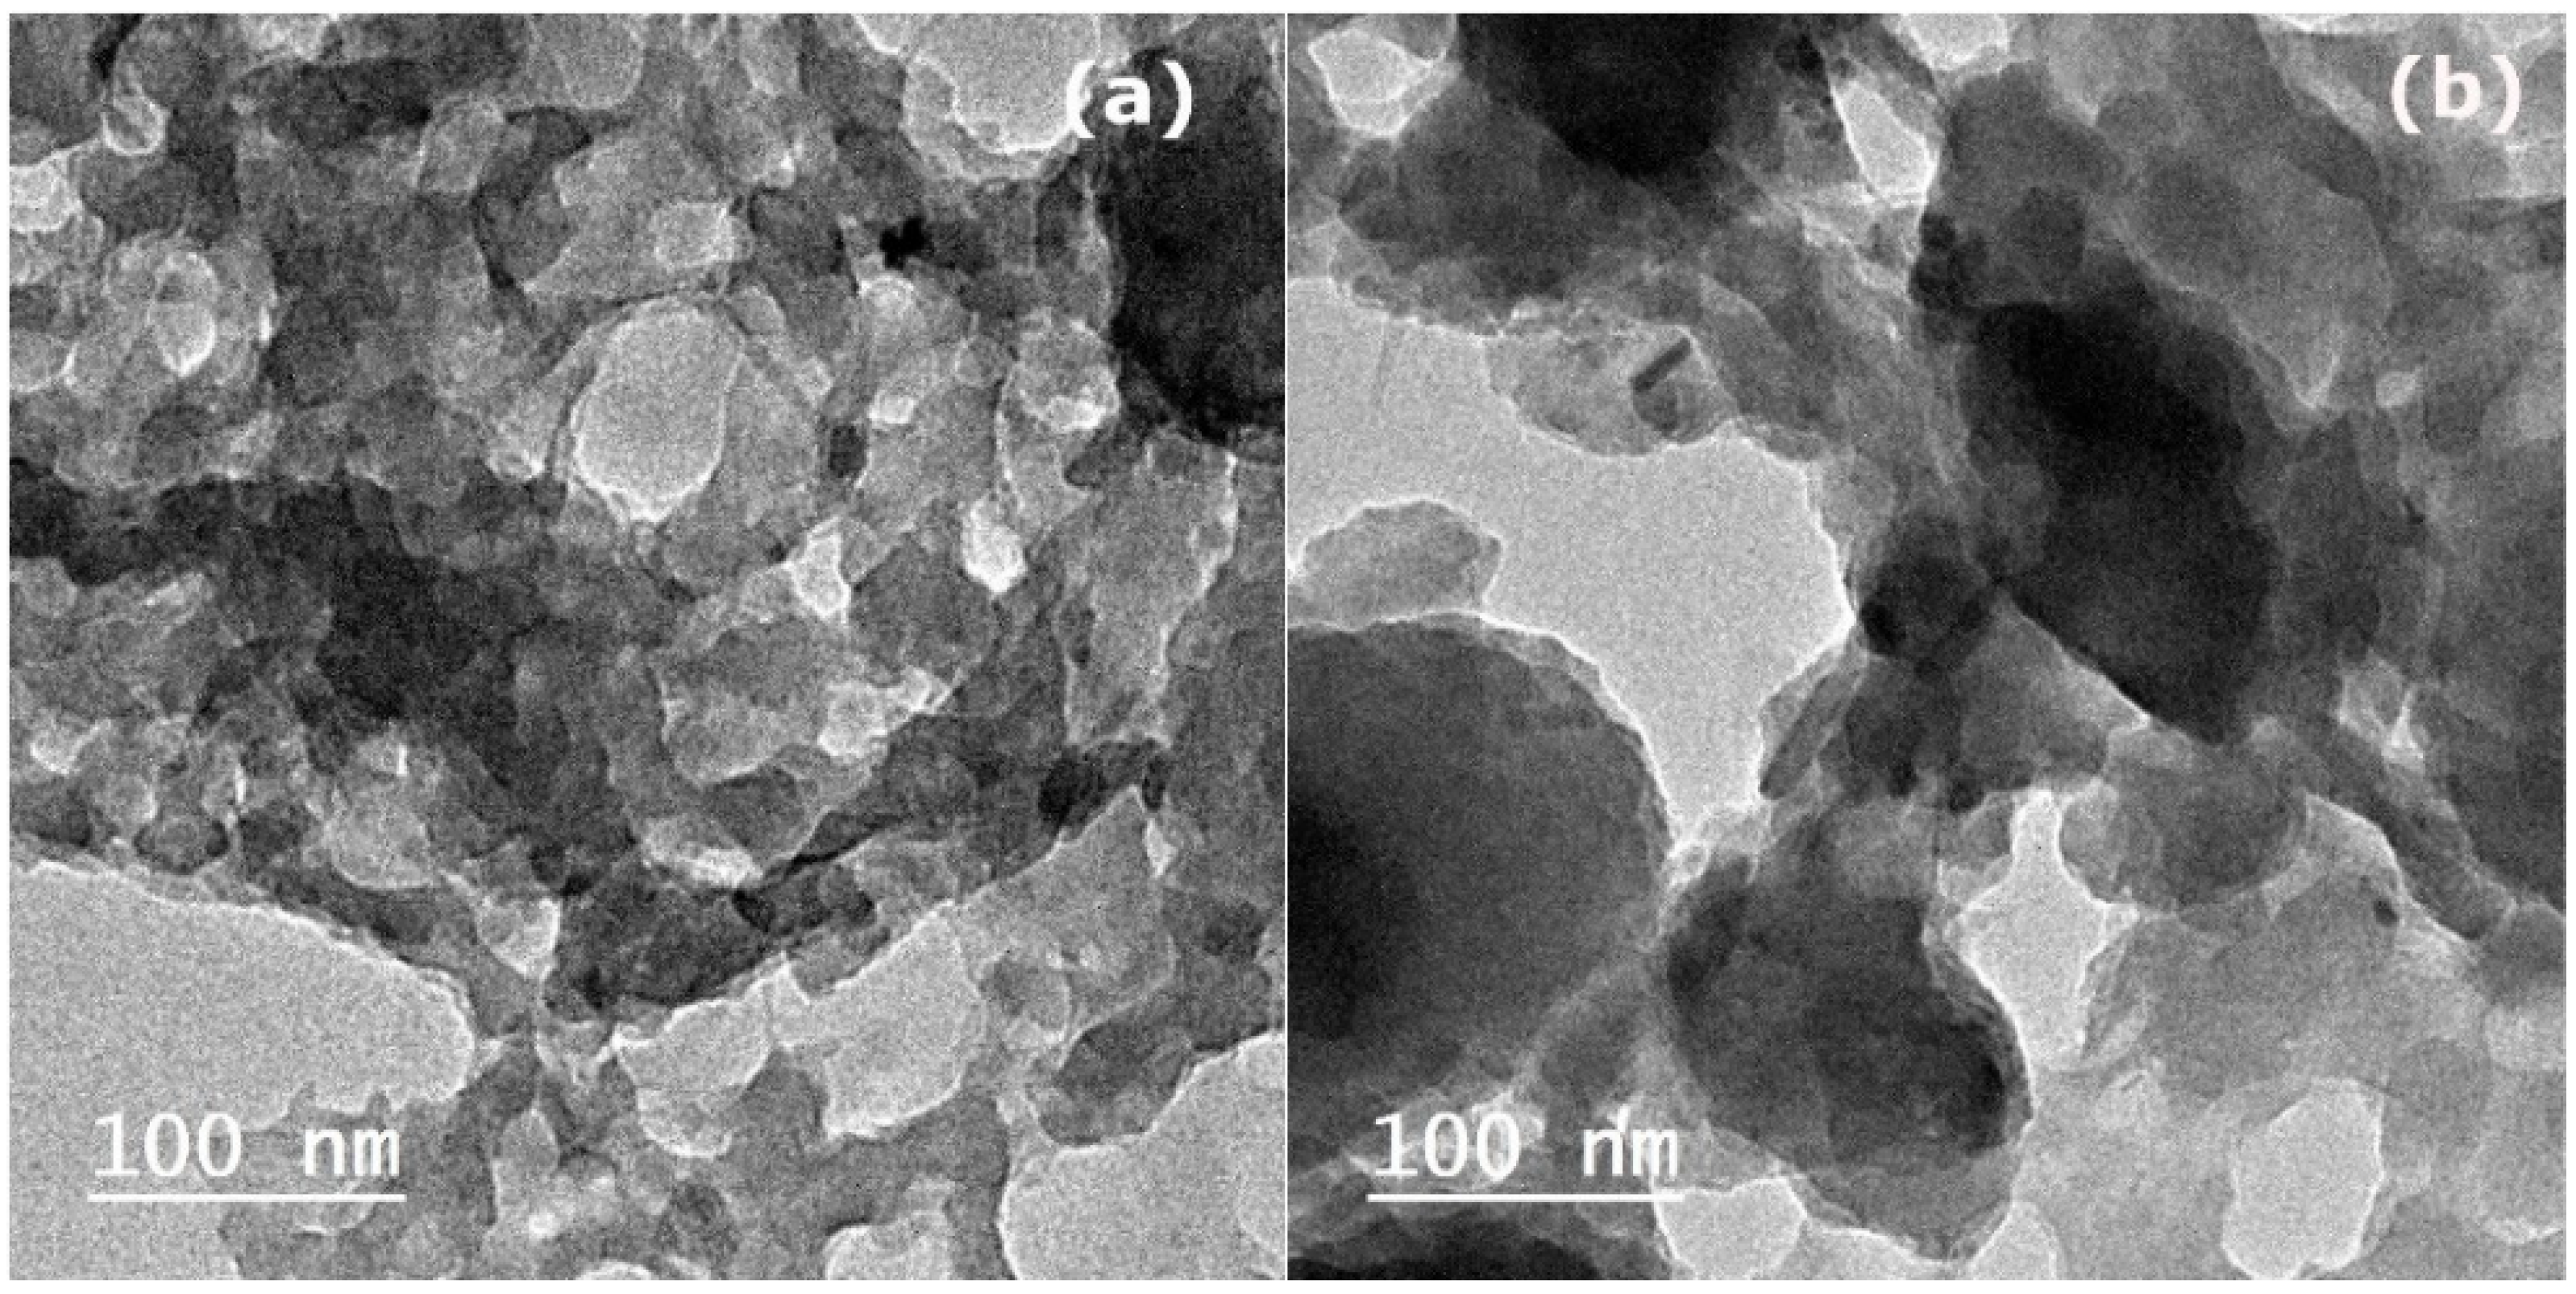
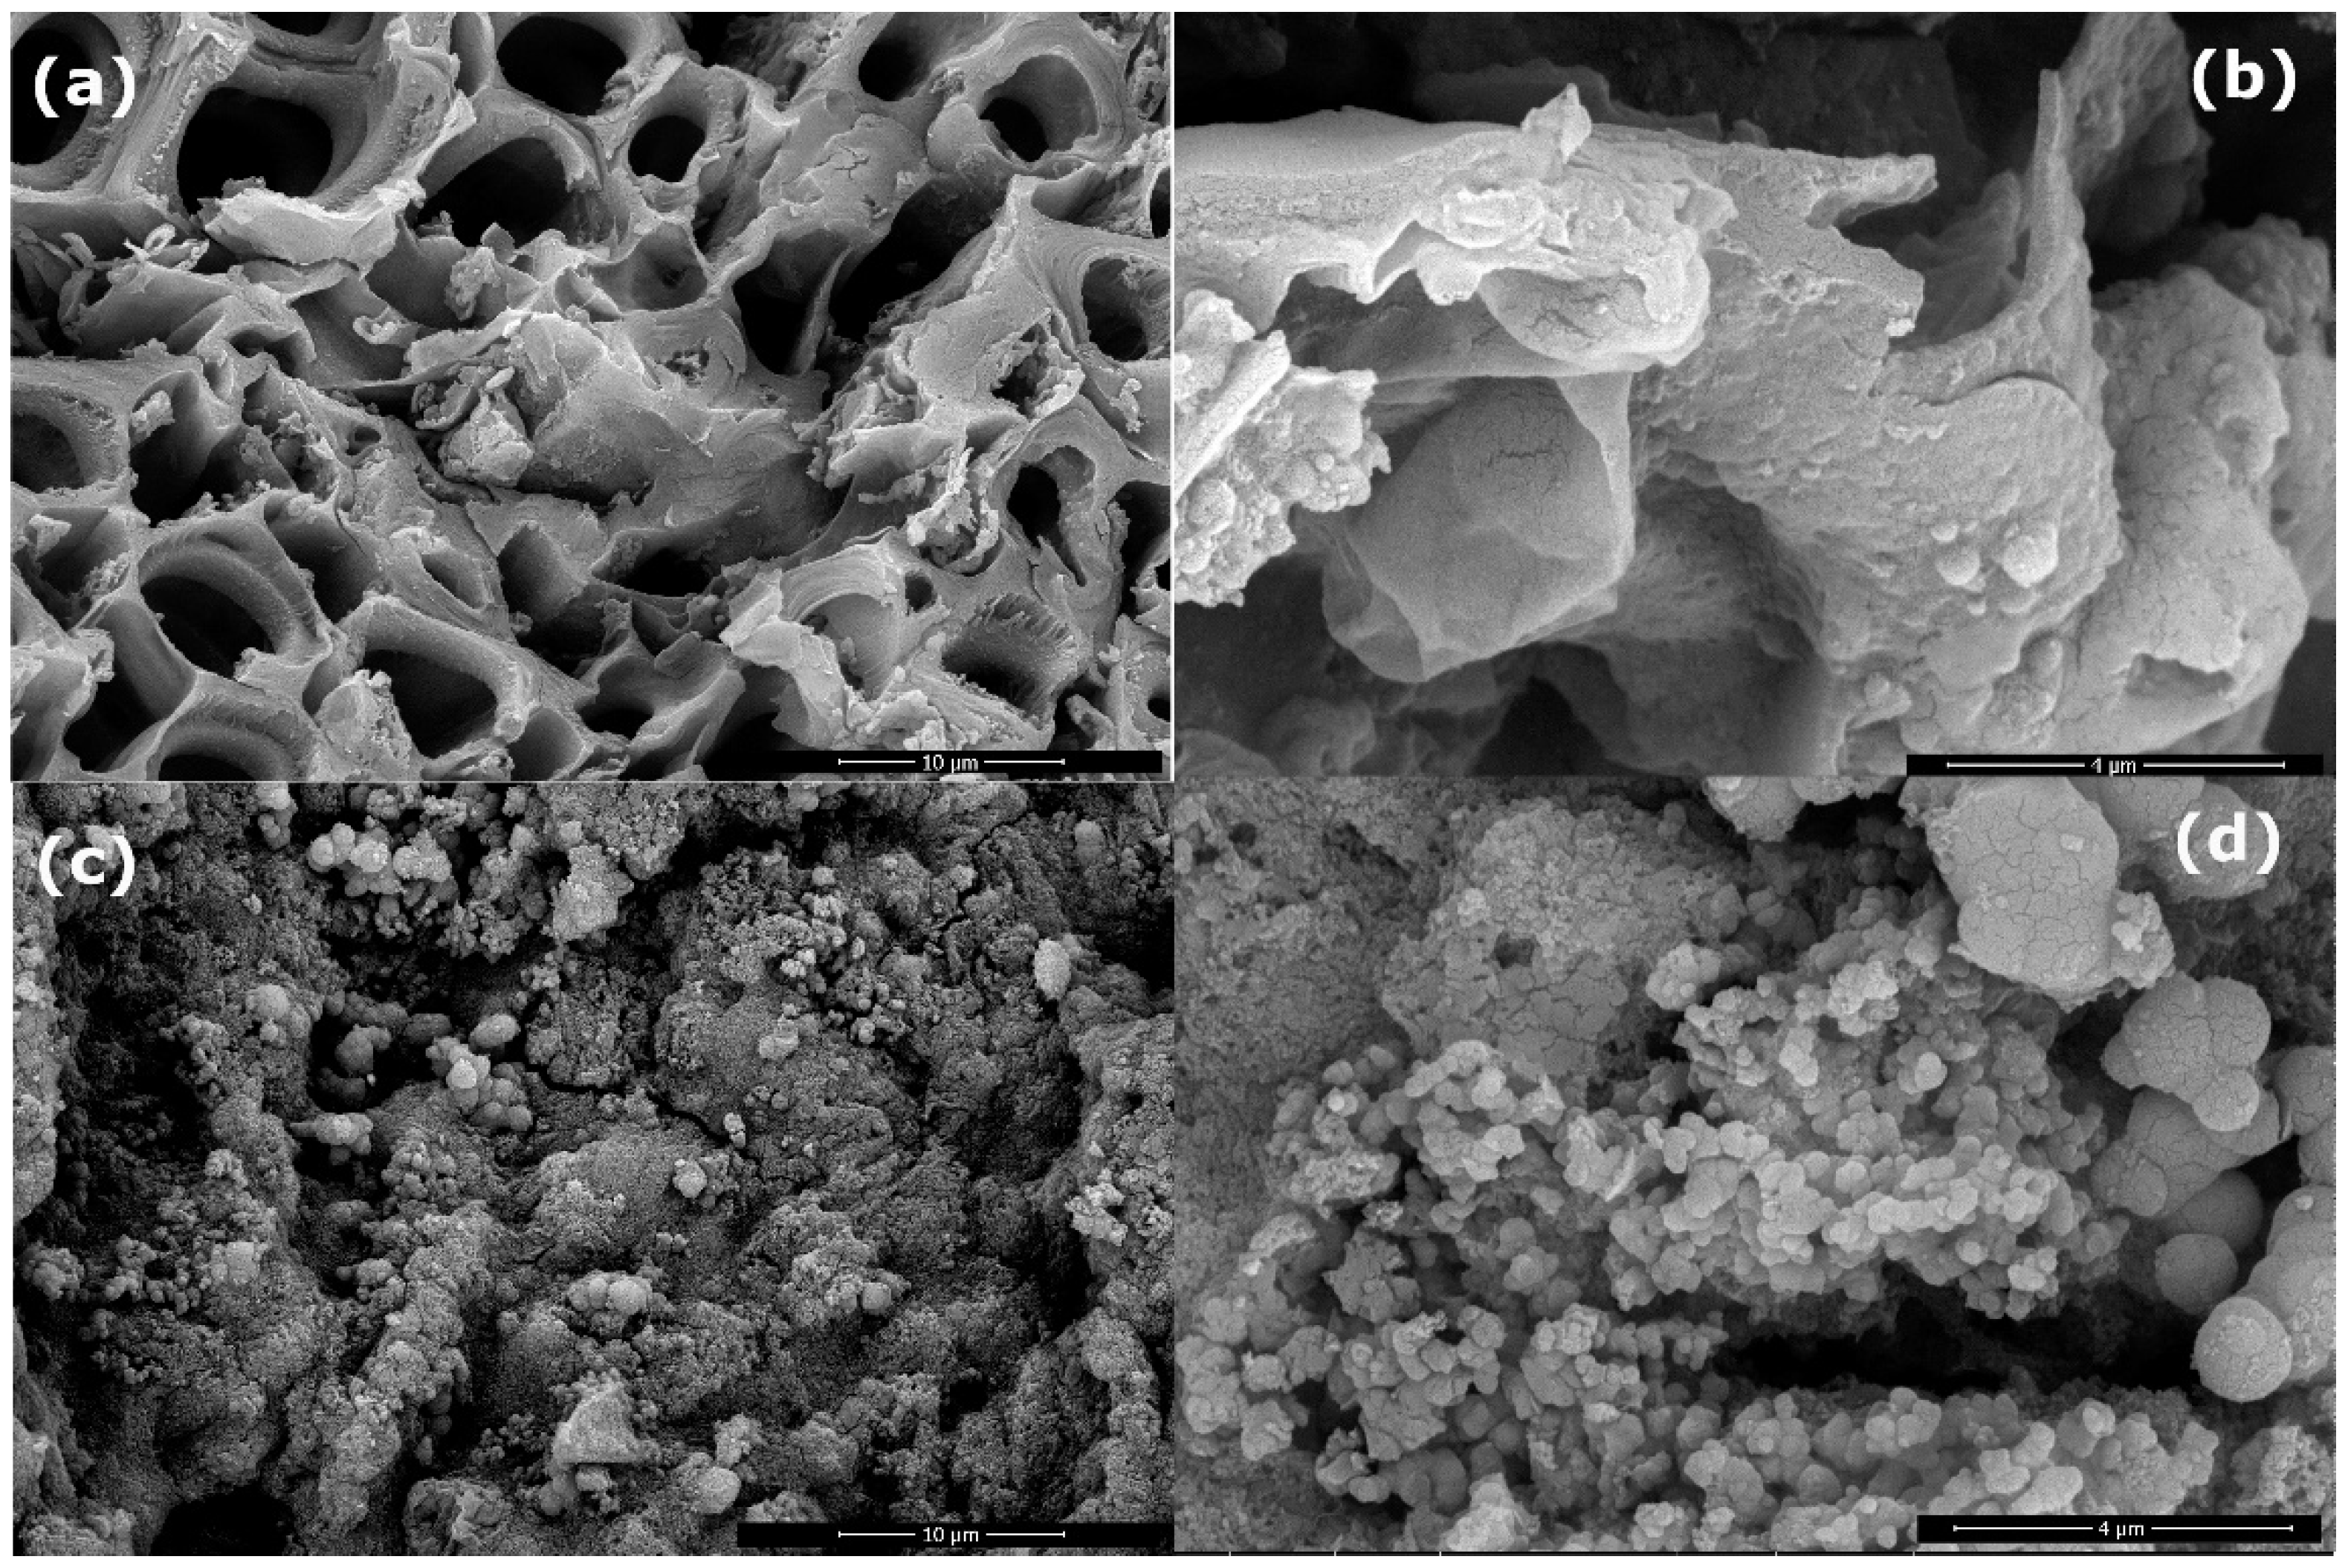
Figure S1 depicts the XRD diffractograms of the HC and AHC samples. The HC sample only shows a peak around 2θ = 22, which indicates the formation of amorphous carbon. The AHC sample shows a peak around 2θ = 22°, which indicates the formation of amorphous carbon [11,29,48]. Moreover, there is another narrower peak at 2θ = 43°, which may be attributed to graphite formation as a result of ZnCl2 activation [18].

3.3. Morphology

Figure 2 represents the TEM photos of HC and AHC samples, which reflect a porous structure with a smaller particle size in the HC sample than in the AHC sample. Moreover, more pores are observed in the HC sample than in the AHC sample. Figure 3 shows the SEM of HC and AHC samples. The SEM photos show the porous structure of the HC sample, which is inherited from the structure of pomegranate peels with uniformly ordered pores. When the formed hydrochar maintains the original structure of agricultural waste, it is known as primary char [49,50]. The SEM of the AHC sample shows agglomerated spherical particles, also known as secondary char, on the rough surface of primary char [50,51]. The secondary char on the surface may be attributed to the polymerization of hydrolyzed intermediates of peels’ components due to the chemical activation by ZnCl2 [48,52].

3.4. The pH of the Zero Point Charge (pHzpc)

Figure 4 shows the results of the equilibrium technique used to measure the pH of the zero point charge (pHzpc) for HC and AHC samples. These points represent the x-intercept of the ∆pH versus pHi. From the figure, it is apparent that the pHZPC of HC and AHC samples are 4.3 and 4.6, respectively. When the samples are placed in a solution with a pH under 4.3, the surface of the HC and AHC samples are positively charged as the surface functional groups are protonated. On the other hand, when the samples are placed in a solution with a pH over 4.6, the surface of the HC and AHC samples are negatively charged as the surface functional groups are deprotonated owing to the dissociation of hydroxyl and carboxyl functional groups [53]. As the first step in the adsorption is expected to be the diffusion of the target molecule, which is MB dye, to reach the active sites on the adsorbent, and since MB dye is known to be a cationic dye that forms cations in aqueous solutions, it is expected that increasing the pH of the solution to a higher value than the pHZPC would enhance the adsorption process by increasing the rate of the MB dye reaching the surface under the effect of electrical attraction. Accordingly, all the adsorption tests were performed at a pH of 8. It is reported in the literature that the pHpzc of hydrochar prepared by the HTC method from rattan is 4.7 [16]. The pHpzc of hydrochar and activated hydrochar are 6 and 6.2, respectively, when prepared by the HTC method with orange peels [17].

3.5. Equilibrium Adsorption of Methylene Blue Dye

Figure 5a shows the effect of the initial concentration of MB dye (Ci) on the equilibrium adsorption capacity (qe) after 24 h under continuous stirring to reach equilibrium. The HC sample has a qe of 2.58, 6.63, 25.40 and 49.80 mg/g, while the AHC sample has a qe of 1.88, 3.53, 10.99 and 11.77 mg/g when the initial concentrations of MB dye were 5, 10, 50 and 100 mg/L, respectively. The HC sample shows higher equilibrium adsorption capacities than the AHC sample. The qe of MB dye on the HC sample increases as the initial concentration increases. On the other hand, the qe of MB dye on the AHC sample increases quickly at a lower initial concentration, and then the qe slows at higher initial concentrations. As the initial concentration of MB dye increases, the diffusion of MB molecules increases as well. Then, the adsorption process would continue until the accessible sites on the adsorbent surface are used, resulting in a higher qe.
Figure 5b shows the effect of increasing the initial concentration of MB dye (Ci) on the removal efficiency (R%). R% values were 91%, 87%, 83% and 82% for the HC sample and 82%, 86%, 45% and 23% for the AHC sample when the initial concentrations of MB were 5, 10, 50 and 100 mg/L, respectively. In both samples, as the initial concentration of MB dye increases, the removal efficiency decreases, which may be related to the saturation of the adsorbent surface with MB dye. In addition, the removal efficiency observed by the HC sample is always higher than the AHC sample.
Figure 5c shows the experimental data of adsorption isotherm (points), Langmuir fitting and Freundlich fitting (dashed lines) of the HC sample, and the adsorption isotherm parameters are summarized in Table 1. The adsorption isotherm of MB dye on the HC sample can be fitted with both models as R2 = 0.997, which may infer that the surface of the HC sample did not reach maximum coverage with molecules of MB dye. Langmuir’s model usually suggests monolayer adsorption on a homogenous surface of adsorbent with a higher chance of chemical rather than physical adsorption; there is only a fixed number of sorption sites where adjacent adsorbed molecules do not interfere. The estimated values of qL (i.e., maximum adsorption capacity) and KL (i.e., Langmuir constant) from the Langmuir model are 195.9 mg/g and 0.019, respectively. The Langmuir constant indicates the extent of interaction between the MB dye and the adsorbent. The average RL for the HC sample is 0.665, as it lies between 0–1, which means that it is favorable adsorption. The separation factor RL decreases from 0.912 to 0.342 as the initial concentration increases from 5 ppm to 100 ppm, as summarized in Table 2.
The HC sample is fitted with Freundlich, inferring that the system can be effectively described by a heterogeneous surface with a nonuniform distribution of sorption as well as multilayer sorption. Regarding the values of Freundlich model, the relative adsorption capacity Kf is 4.64. The value of 1/n of (0. 0.823) suggests that the HC sample is more likely to have homogenous surface. Additionally, the value of n is 1.215 for the HC sample, which confirms that the sorption is favorable [54].
Figure 5d shows the experimental data of adsorption isotherm (points), Langmuir fitting and Freundlich fitting (dashed lines) of the AHC sample. The AHC sample is fitted with the Langmuir model with R2 = 0.98 and R2 = 0.895 for the Freundlich model. The maximum adsorption capacity (qL) of the AHC sample estimated by the Langmuir model is 12.55 mg/g C, which is much less than the qL of the HC sample (195.9 mg/g). The Langmuir constant (KL) is 0. 167 for the AHC sample, which is much higher than the KL of the HC sample, indicating a stronger interaction between the MB dye and the AHC sample. The separation factor (RL) of the AHC sample is 0.263, which indicates favorable adsorption. The separation factor RL decreases from 0.545 to 0.056 as the initial concentration increases from 5 ppm to 100 ppm, as summarized in Table 2. Regarding the values of the Freundlich model, the relative adsorption capacity Kf is 2.94. The value of 1/n of (0.329) suggests that the AHC sample has a heterogeneous surface structure that is less heterogenous than the HC sample (1/n = 0.823). This point is supported by the better fitting values of the Langmuir model and AHS’ more homogenous surface. Additionally, the value of n is 3.034 for the AHC sample, which confirms that the sorption is favorable.
Overall, comparing the fitting values of both models (Table 1) indicates that the adsorption of MB dyes is more efficient in the HC sample than in the AHC sample. It seems that chemical activation by ZnCl2 resulted in extensive hydrolysis and polymerization, which led to the formation of a secondary char. In addition, it is reported that the secondary char is characterized by a high aromatic character [50]. The formation of secondary char may lead to aggregations and pore blockage, resulting in less adsorption capacity. OFGs, such as carboxylic, hydroxyl and carbonyl groups, provide surface complexation that improves the chemical reactivity and increases its adsorption capacity [13,14,15,16]. Y. Shao mentioned that the MHTC method resulted in dehydration more than the HTC method [7]. Moreover, it is reported that excessive polymerization resulted in a decrease in OFGs [51,55]. It seems that the MHTC method is efficient and does not need additional activation, as chemical activation results in the deterioration of the expected characteristics. This was supported by the less-intense OH peak observed in the AHC sample than in the HC sample, as observed in FTIR. Moreover, TEM reflects that the HC sample has smaller particles and more pores, which enhances the adsorption of MB dye. Finally, the results were supported by the nitrogen adsorption–desorption curves of HC and AHC samples, as presented in Figure S2. The two samples have Type-IV isotherms with H3-type hysteresis, which is characteristic of mesoporous materials [56]. The specific surface area of the HC and AHC samples are 18 m2/g and 9.5 m2/g, respectively. The BJH average pore diameter of the HC and AHC samples are 25.8 nm and 33.9 nm, respectively.
M. Islam et al. prepared activated hydrochar from rattan furniture waste using the HTC method followed by NaOH activation. They applied the activated hydrochar to remove MB dye, and the removal efficiency was 96% at an MB dye concentration of 25 mg/L [16]. The data were fitted with a Langmuir isotherm with a maximum monolayer adsorption capacity of 359 mg/g. In another publication, they prepared the activated hydrochar from coconut shell waste using the HTC method and NaOH activation. They applied the activated hydrochar to remove MB dye, and the removal efficiency was 98% at an MB dye concentration of 100 mg/L. The data were fitted with a Langmuir isotherm with a maximum monolayer adsorption capacity of 200 mg/g. It seems that the source of feedstock has an important impact on the adsorption capacity of prepared hydrochar [57].

4. Conclusions

In this work, a time and energy-saving method—the MHTC method—was successfully used in the preparation of hydrochar and activated hydrochar under the effect of chemical activation by ZnCl2. The chemical activation resulted in the formation of a secondary char due to the excessive hydrolysis of macromolecules and the polymerization of small molecules. The MHTC method succeeded in the synthesis of amorphous carbon-porous hydrochar rich with oxygen-containing functional groups. FTIR proved the presence of hydroxyl and carbonyl groups, and XRD proved the formation of amorphous carbon. TEM proved a porous structure for both samples with smaller particles and more pores in the HC sample. The HC sample has shown a maximum adsorption capacity achieved in this work of 195.9 mg/g. On the other hand, the HC sample has shown less adsorption capacity of 12.6 mg/g as a result of secondary char formation and fewer OFGs. The HC sample achieved 92% removal of MB dye from 5 ppm. Therefore, this time- and energy-saving method is able to compete with other methods to prepare highly efficient adsorbent in terms of eco-friendliness, safety, simplicity and cost.

Supplementary Materials

The following supporting information can be downloaded at: https://www.mdpi.com/article/10.3390/en15103629/s1, Figure S1: XRD diffractograms of (HC) Hydrochar after microwave-assisted hydrothermal carbonization treatment, and (AHC) Activated Hydrochar after microwave-assisted hydrothermal carbonization treatment and chemical activation by ZnCl2. Figure S2: Nitrogen adsorption-desorption isotherms (a) and pore size distributions (b) of HC and AHC.

Funding

This work was supported through the Annual Funding track by the Deanship of Scientific Research, Vice Presidency for Graduate Studies and Scientific Research, King Faisal University, Saudi Arabia (Project No. AN000556). The APC was funded by the Deanship of Scientific Research at King Faisal University.

Data Availability Statement

Data available upon request from the corresponding author.

Conflicts of Interest

The author declares no conflict of interest.

References

  1. Shandilya, M.; Rai, R.; Singh, J. Review: Hydrothermal technology for smart materials. Adv. Appl. Ceram. 2016, 115, 354–376. [Google Scholar] [CrossRef]
  2. Shandilya, M.; Rai, R.; Zeb, A.; Kumar, S. Modification of structural and electrical properties of Ca element on barium titanate nano-material synthesized by hydrothermal method. Ferroelectrics 2017, 520, 93–109. [Google Scholar] [CrossRef]
  3. Shandilya, M.; Kaur, G.A. Low temperature crystal growth of lead-free complex perovskite nano-structure by using sol-gel hydrothermal process. J. Solid State Chem. 2019, 280, 120988. [Google Scholar] [CrossRef]
  4. Gao, Y.; Remón, J.; Matharu, A.S. Microwave-assisted hydrothermal treatments for biomass valorisation: A critical review. Green Chem. 2021, 23, 3502–3525. [Google Scholar] [CrossRef]
  5. He, C.; Tang, C.; Li, C.; Yuan, J.; Tran, K.Q.; Bach, Q.V.; Qiu, R.; Yang, Y. Wet torrefaction of biomass for high quality solid fuel production: A review. Renew. Sustain. Energy Rev. 2018, 91, 259–271. [Google Scholar] [CrossRef]
  6. Lei, Q.; Kannan, S.; Raghavan, V. Uncatalyzed and acid-aided microwave hydrothermal carbonization of orange peel waste. Waste Manag. 2021, 126, 106–118. [Google Scholar] [CrossRef]
  7. Shao, Y.; Tan, H.; Shen, D.; Zhou, Y.; Jin, Z.; Zhou, D.; Lu, W.; Long, Y. Synthesis of improved hydrochar by microwave hydrothermal carbonization of green waste. Fuel 2020, 266, 117146. [Google Scholar] [CrossRef]
  8. Deng, C.; Kang, X.; Lin, R.; Murphy, J.D. Microwave assisted low-temperature hydrothermal treatment of solid anaerobic digestate for optimising hydrochar and energy recovery. Chem. Eng. J. 2020, 395, 124999. [Google Scholar] [CrossRef]
  9. Shao, Y.; Long, Y.; Wang, H.; Liu, D.; Shen, D.; Chen, T. Hydrochar derived from green waste by microwave hydrothermal carbonization. Renew. Energy 2019, 135, 1327–1334. [Google Scholar] [CrossRef]
  10. Nizamuddin, S.; Qureshi, S.S.; Baloch, H.A.; Siddiqui, M.T.H.; Takkalkar, P.; Mubarak, N.M.; Dumbre, D.K.; Griffin, G.J.; Madapusi, S.; Tanksale, A. Microwave Hydrothermal Carbonization of Rice Straw: Optimization of Process Parameters and Upgrading of Chemical, Fuel, Structural and Thermal Properties. Materials 2019, 12, 403. [Google Scholar] [CrossRef] [Green Version]
  11. Pauletto, P.S.; Moreno-Pérez, J.; Hernández-Hernández, L.E.; Bonilla-Petriciolet, A.; Dotto, G.L.; Salau, N.P.G. Novel biochar and hydrochar for the adsorption of 2-nitrophenol from aqueous solutions: An approach using the PVSDM model. Chemosphere 2021, 269, 128748. [Google Scholar] [CrossRef] [PubMed]
  12. Li, B.; Guo, J.; Lv, K.; Fan, J. Adsorption of methylene blue and Cd(II) onto maleylated modified hydrochar from water. Environ. Pollut. 2019, 254, 113014. [Google Scholar] [CrossRef] [PubMed]
  13. Saha, N.; Volpe, M.; Fiori, L.; Volpe, R.; Messineo, A.; Reza, M.T. Cationic Dye Adsorption on Hydrochars of Winery and Citrus Juice Industries Residues: Performance, Mechanism, and Thermodynamics. Energies 2020, 13, 4686. [Google Scholar] [CrossRef]
  14. Saha, N.; Saba, A.; Reza, M.T. Effect of hydrothermal carbonization temperature on pH, dissociation constants, and acidic functional groups on hydrochar from cellulose and wood. J. Anal. Appl. Pyrolysis 2019, 137, 138–145. [Google Scholar] [CrossRef]
  15. Xiao, K.; Liu, H.; Li, Y.; Yi, L.; Zhang, X.; Hu, H.; Yao, H. Correlations between hydrochar properties and chemical constitution of orange peel waste during hydrothermal carbonization. Bioresour. Technol. 2018, 265, 432–436. [Google Scholar] [CrossRef] [PubMed]
  16. Islam, M.A.; Ahmed, M.J.; Khanday, W.A.; Asif, M.; Hameed, B.H. Mesoporous activated carbon prepared from NaOH activation of rattan (Lacosperma secundiflorum) hydrochar for methylene blue removal. Ecotoxicol. Environ. Saf. 2017, 138, 279–285. [Google Scholar] [CrossRef]
  17. Fernandez, M.E.; Ledesma, B.; Román, S.; Bonelli, P.R.; Cukierman, A.L. Development and characterization of activated hydrochars from orange peels as potential adsorbents for emerging organic contaminants. Bioresour. Technol. 2015, 183, 221–228. [Google Scholar] [CrossRef]
  18. El Ouadrhiri, F.; Elyemni, M.; Lahkimi, A.; Lhassani, A.; Chaouch, M.; Taleb, M.; Zbair, M. Mesoporous Carbon from Optimized Date Stone Hydrochar by Catalytic Hydrothermal Carbonization Using Response Surface Methodology: Application to Dyes Adsorption. Int. J. Chem. Eng. 2021, 2021, 5555406. [Google Scholar] [CrossRef]
  19. Xiang, W.; Zhang, X.; Chen, J.; Zou, W.; He, F.; Hu, X.; Tsang, D.C.W.; Ok, Y.S.; Gao, B. Biochar technology in wastewater treatment: A critical review. Chemosphere 2020, 252, 126539. [Google Scholar] [CrossRef]
  20. Costa, M.E.G.; Assunção, F.P.D.C.; Teribele, T.; Pereira, L.M.; de Castro, D.A.R.; Santo, M.C.; da Costa, C.E.F.; Shultze, M.; Hofmann, T.; Machado, N.T. Characterization of Bio-Adsorbents Produced by Hydrothermal Carbonization of Corn Stover: Application on the Adsorption of Acetic Acid from Aqueous Solutions. Energies 2021, 14, 8154. [Google Scholar] [CrossRef]
  21. Zhou, F.; Li, K.; Hang, F.; Zhang, Z.; Chen, P.; Wei, L.; Xie, C. Efficient removal of methylene blue by activated hydrochar prepared by hydrothermal carbonization and NaOH activation of sugarcane bagasse and phosphoric acid. RSC Adv. 2022, 12, 1885–1896. [Google Scholar] [CrossRef] [PubMed]
  22. Saadi, W.; Rodríguez-Sánchez, S.; Ruiz, B.; Najar-Souissi, S.; Ouederni, A.; Fuente, E. From pomegranate peels waste to one-step alkaline carbonate activated carbons. Prospect as sustainable adsorbent for the renewable energy production. J. Environ. Chem. Eng. 2022, 10, 107010. [Google Scholar] [CrossRef]
  23. Li, F.; Zimmerman, A.R.; Hu, X.; Yu, Z.; Huang, J.; Gao, B. One-pot synthesis and characterization of engineered hydrochar by hydrothermal carbonization of biomass with ZnCl2. Chemosphere 2020, 254, 126866. [Google Scholar] [CrossRef] [PubMed]
  24. Zhang, S.; Zhu, S.; Zhang, H.; Liu, X.; Xiong, Y. Synthesis and characterization of rice husk-based magnetic porous carbon by pyrolysis of pretreated rice husk with FeCl3 and ZnCl2. J. Anal. Appl. Pyrolysis 2020, 147, 104806. [Google Scholar] [CrossRef]
  25. Zou, H.; Zhao, J.; He, F.; Zhong, Z.; Huang, J.; Zheng, Y.; Zhang, Y.; Yang, Y.; Yu, F.; Bashir, M.A.; et al. Ball milling biochar iron oxide composites for the removal of chromium (Cr(VI)) from water: Performance and mechanisms. J. Hazard. Mater. 2021, 413, 125252. [Google Scholar] [CrossRef]
  26. Yu, F.; Tian, F.; Zou, H.; Ye, Z.; Peng, C.; Huang, J.; Zheng, Y.; Zhang, Y.; Yang, Y.; Wei, X.; et al. ZnO/biochar nanocomposites via solvent free ball milling for enhanced adsorption and photocatalytic degradation of methylene blue. J. Hazard. Mater. 2021, 415, 125511. [Google Scholar] [CrossRef]
  27. Tho, P.T.; Van, H.T.; Nguyen, L.H.; Hoang, T.K.; Tran, T.N.H.; Nguyen, T.T.; Nguyen, V.Q.; Le Sy, H.; Thai, V.N.; Tran, Q.B.; et al. Enhanced simultaneous adsorption of As(iii), Cd(ii), Pb(ii) and Cr(vi) ions from aqueous solution using cassava root husk-derived biochar loaded with ZnO nanoparticles. RSC Adv. 2021, 11, 18881–18897. [Google Scholar] [CrossRef]
  28. SSun, S.; Zeng, X.; Gao, Y.; Zhang, W.; Zhou, L.; Zeng, X.; Liu, W.; Jiang, Q.; Jiang, C.; Wang, S. Iron oxide loaded biochar/attapulgite composites derived camellia oleifera shells as a novel bio-adsorbent for highly efficient removal of Cr(VI). J. Clean. Prod. 2021, 317, 128412. [Google Scholar] [CrossRef]
  29. Patiño, A.A.B.; Lassalle, V.L.; Horst, M.F. Magnetic hydrochar nanocomposite obtained from sunflower husk: A potential material for environmental remediation. J. Mol. Struct. 2021, 1239, 130509. [Google Scholar] [CrossRef]
  30. Min, L.; Zhang, P.; Fan, M.; Xu, X.; Wang, C.; Tang, J.; Sun, H. Efficient degradation of p-nitrophenol by Fe@pomelo peel-derived biochar composites and its mechanism of simultaneous reduction and oxidation process. Chemosphere 2020, 267, 129213. [Google Scholar] [CrossRef]
  31. Wang, S.; Kwak, J.-H.; Islam, S.; Naeth, M.A.; El-Din, M.G.; Chang, S.X. Biochar surface complexation and Ni(II), Cu(II), and Cd(II) adsorption in aqueous solutions depend on feedstock type. Sci. Total Environ. 2020, 712, 136538. [Google Scholar] [CrossRef] [PubMed]
  32. Vahdati-Khajeh, S.; Zirak, M.; Tejrag, R.Z.; Fathi, A.; Lamei, K.; Eftekhari-Sis, B. Biocompatible magnetic N-rich activated carbon from egg white biomass and sucrose: Preparation, characterization and investigation of dye adsorption capacity from aqueous solution. Surfaces Interfaces 2019, 15, 157–165. [Google Scholar] [CrossRef]
  33. Siddiqui, M.T.H.; Nizamuddin, S.; Mubarak, N.M.; Shirin, K.; Aijaz, M.; Hussain, M.; Baloch, H.A. Characterization and Process Optimization of Biochar Produced Using Novel Biomass, Waste Pomegranate Peel: A Response Surface Methodology Approach. Waste Biomass Valoriz. 2017, 10, 521–532. [Google Scholar] [CrossRef]
  34. El Barnossi, A.; Moussaid, F.; Housseini, A.I. Tangerine, banana and pomegranate peels valorisation for sustainable environment: A review. Biotechnol. Rep. 2020, 29, e00574. [Google Scholar] [CrossRef]
  35. Yang, B.; Kealey, K.; Chen, J.; Solval, K.M. Developing microencapsulated powders containing polyphenols and pectin extracted from Georgia-grown pomegranate peels. LWT 2021, 154, 112644. [Google Scholar] [CrossRef]
  36. Talekar, S.; Patti, A.; VijayRaghavan, R.; Arora, A. An integrated green biorefinery approach towards simultaneous recovery of pectin and polyphenols coupled with bioethanol production from waste pomegranate peels. Bioresour. Technol. 2018, 266, 322–334. [Google Scholar] [CrossRef]
  37. Ghimire, A.; Paudel, N.; Poudel, R. Effect of pomegranate peel extract on the storage stability of ground buffalo (Bubalus bubalis) meat. LWT 2021, 154, 112690. [Google Scholar] [CrossRef]
  38. Al-Ghamdi, F.A.M. Pomegranate peel extracts effects to reduce mono sodium glutamate toxic effects on chicken embryos: Morphological studies. Saudi J. Biol. Sci. 2022, 29, 975–983. [Google Scholar] [CrossRef]
  39. Fidelis, J.C.F.; Marchi, L.B.; Scapim, M.R.; Gobetti, N.D.; Yamashita, F.; Monteiro, A.R.G. Development of biodegradable films containing pomegranate peel extract and potassium sorbate. LWT 2022, 160, 113302. [Google Scholar] [CrossRef]
  40. Ghibate, R.; Senhaji, O.; Taouil, R. Kinetic and thermodynamic approaches on Rhodamine B adsorption onto pomegranate peel. Case Stud. Chem. Environ. Eng. 2020, 3, 100078. [Google Scholar] [CrossRef]
  41. Zhu, Z.; Rao, R.; Zhao, Z.; Chen, J.; Jiang, W.; Bi, F.; Yang, Y.; Zhang, X. Research progress on removal of phthalates pollutants from environment. J. Mol. Liq. 2022, 355, 118930. [Google Scholar] [CrossRef]
  42. Remya, N.; Lin, J.-G. Current status of microwave application in wastewater treatment—A review. Chem. Eng. J. 2011, 166, 797–813. [Google Scholar] [CrossRef]
  43. Li, H.-Z.; Zhang, Y.-N.; Guo, J.-Z.; Lv, J.-Q.; Huan, W.-W.; Li, B. Preparation of hydrochar with high adsorption performance for methylene blue by co-hydrothermal carbonization of polyvinyl chloride and bamboo. Bioresour. Technol. 2021, 337, 125442. [Google Scholar] [CrossRef]
  44. Tomul, F.; Arslan, Y.; Kabak, B.; Trak, D.; Kendüzler, E.; Lima, E.C.; Tran, H.N. Peanut shells-derived biochars prepared from different carbonization processes: Comparison of characterization and mechanism of naproxen adsorption in water. Sci. Total Environ. 2020, 726, 137828. [Google Scholar] [CrossRef]
  45. Ahmad, M.A.; Puad, N.A.A.; Bello, O.S. Kinetic, equilibrium and thermodynamic studies of synthetic dye removal using pomegranate peel activated carbon prepared by microwave-induced KOH activation. Water Resour. Ind. 2014, 6, 18–35. [Google Scholar] [CrossRef] [Green Version]
  46. Rattanachueskul, N.; Saning, A.; Kaowphong, S.; Chumha, N.; Chuenchom, L. Magnetic carbon composites with a hierarchical structure for adsorption of tetracycline, prepared from sugarcane bagasse via hydrothermal carbonization coupled with simple heat treatment process. Bioresour. Technol. 2017, 226, 164–172. [Google Scholar] [CrossRef]
  47. Siddiqui, M.T.H.; Nizamuddin, S.; Baloch, H.A.; Mubarak, N.M.; Dumbre, D.K.; Inamuddin; Asiri, A.M.; Bhutto, A.W.; Srinivasan, M.; Griffin, G.J. Synthesis of magnetic carbon nanocomposites by hydrothermal carbonization and pyrolysis. Environ. Chem. Lett. 2018, 16, 821–844. [Google Scholar] [CrossRef]
  48. Li, H.; Shi, Y.; Bai, L.; Chi, M.; Xu, X.; Liu, Y. Low Temperature One-Pot Hydrothermal Carbonization of Corn Straw into Hydrochar for Adsorbing Cadmium (II) in Wastewater. Energies 2021, 14, 8503. [Google Scholar] [CrossRef]
  49. Volpe, M.; Goldfarb, J.L.; Fiori, L. Hydrothermal carbonization of Opuntia ficus-indica cladodes: Role of process parameters on hydrochar properties. Bioresour. Technol. 2018, 247, 310–318. [Google Scholar] [CrossRef]
  50. Volpe, M.; Fiori, L. From olive waste to solid biofuel through hydrothermal carbonisation: The role of temperature and solid load on secondary char formation and hydrochar energy properties. J. Anal. Appl. Pyrolysis 2017, 124, 63–72. [Google Scholar] [CrossRef]
  51. Jain, A.; Balasubramanian, R.; Srinivasan, M. Hydrothermal conversion of biomass waste to activated carbon with high porosity: A review. Chem. Eng. J. 2016, 283, 789–805. [Google Scholar] [CrossRef]
  52. Wilk, M.; Magdziarz, A.; Kalemba-Rec, I.; Szymańska-Chargot, M. Upgrading of green waste into carbon-rich solid biofuel by hydrothermal carbonization: The effect of process parameters on hydrochar derived from acacia. Energy 2020, 202, 117717. [Google Scholar] [CrossRef]
  53. Li, B.; Lv, J.-Q.; Guo, J.-Z.; Fu, S.-Y.; Guo, M.; Yang, P. The polyaminocarboxylated modified hydrochar for efficient capturing methylene blue and Cu(II) from water. Bioresour. Technol. 2018, 275, 360–367. [Google Scholar] [CrossRef]
  54. Samarghandi, M.R.; Hadi, M.; Moayedi, S.; Barjesteh, A.F. Two-Parameter Isotherms Of Methyl Orange Sorption By Pinecone Derived Activated Carbon. Iran. J. Environ. Health. Sci. Eng. 2009, 6, 285. [Google Scholar]
  55. Fang, J.; Zhan, L.; Ok, Y.S.; Gao, B. Minireview of potential applications of hydrochar derived from hydrothermal carbonization of biomass. J. Ind. Eng. Chem. 2018, 57, 15–21. [Google Scholar] [CrossRef]
  56. Zhang, X.; Xiang, S.; Du, Q.; Bi, F.; Xie, K.; Wang, L. Effect of calcination temperature on the structure and performance of rod-like MnCeOx derived from MOFs catalysts. Mol. Catal. 2022, 522, 112226. [Google Scholar] [CrossRef]
  57. Islam, M.A.; Ahmed, M.J.; Khanday, W.A.; Asif, M.; Hameed, B.H. Mesoporous activated coconut shell-derived hydrochar prepared via hydrothermal carbonization-NaOH activation for methylene blue adsorption. J. Environ. Manag. 2017, 203, 237–244. [Google Scholar] [CrossRef]
Scheme 1. The synthesis steps of activated hydrochar (AHC) prepared by the microwave-assisted hydrothermal carbonization method using wasted pomegranate peel.
Energies 15 03629 sch001
Figure 1. FTIR of (a) dried and ground pomegranate peels (PPs), (b) pomegranate peels after basic treatment (BPPs), (c) after hydrothermal carbonization treatment (HTC-HC), (d) after microwave-assisted hydrothermal carbonization treatment (HC) and (e) after microwave-assisted hydrothermal carbonization treatment in the presence of ZnCl2 (AHC).
Energies 15 03629 g001
Figure 2. (a) TEM images of hydrochar (HC) after the microwave-assisted hydrothermal carbonization treatment and (b) activated hydrochar (AHC) after the microwave-assisted hydrothermal carbonization treatment and chemical activation by ZnCl2.
Energies 15 03629 g002
Figure 3. (a,b) SEM images of hydrochar (HC) after the microwave-assisted hydrothermal carbonization treatment and (c,d) SEM images of activated hydrochar (AHC) after the microwave-assisted hydrothermal carbonization treatment and chemical activation by ZnCl2.
Energies 15 03629 g003
Figure 4. ΔpH as a function of HC and AHC with a solid-to-solution ratio of 1 g/L, stirring at 350 rpm for 24 h and background electrolyte 0.1 NaCl.
Energies 15 03629 g004
Figure 5. (a) The dependence of equilibrium adsorption capacity on MB dye initial concentration, (b) removal efficiency on MB dye initial concentration, (c) experimental data and fitting models of HC and (d) experimental data and fitting models of AHC.
Energies 15 03629 g005
Table 1. Adsorption isotherm parameters for MB dye by HC and AHC samples.
LangmuirFreundlich
ql (mg/g)Kl (L/g)R2KfrnfrR2
HC194.9050.01920.99764.6431.2150.9972
AHC12.5540.1670.98672.9393.0340.8952
Table 2. Separation factors (RL) for HC and AHC samples at different initial concentrations of MB dye.
Ci (ppm)51050100Average RL
HC0.9120.8380.5090.3420.665
AHC0.5450.3750.1070.0560.263
Publisher’s Note: MDPI stays neutral with regard to jurisdictional claims in published maps and institutional affiliations.

