
Inter-Provincial Electricity Trading and Its Effects on Carbon Emissions from the Power Industry


Abstract
:1. Introduction
2. Methodology and Data Sources
2.1. Downscaling of Inter-Regional Electricity Transmission Data
2.2. Decomposition Analysis Using logarithmic Mean Divisia Method (LMDI)
2.3. Random Forest Clustering
- (i)
- The unsupervised RF algorithm was used to generate a proximity matrix which gave an estimate of the distance between observations based on the frequency of observations leading to the same leaf node.
- (ii)
- The clustering in the second step of PAM analysis was performed by assigning each observation to the nearest medoid in order to find k representative objects that minimize the sum of the dissimilarities of the observations to their closest representative object.
- (iii)
- Silhouette index (SI) was used to optimize the model to determine the relevant number of clusters [28]. The SI value is a measure of how similar an object is to its own cluster (cohesion) compared with other clusters (separation). The SI can be used to explore the separation distance between the resulting clusters. A high SI value indicates that the object is well-matched to its own cluster and poorly matched to neighboring clusters. The SI is calculated using the mean intra-cluster distance (a) and the mean nearest-cluster distance (b) for each sample. The SI is defined as follows:
2.4. Data Sources
3. Results
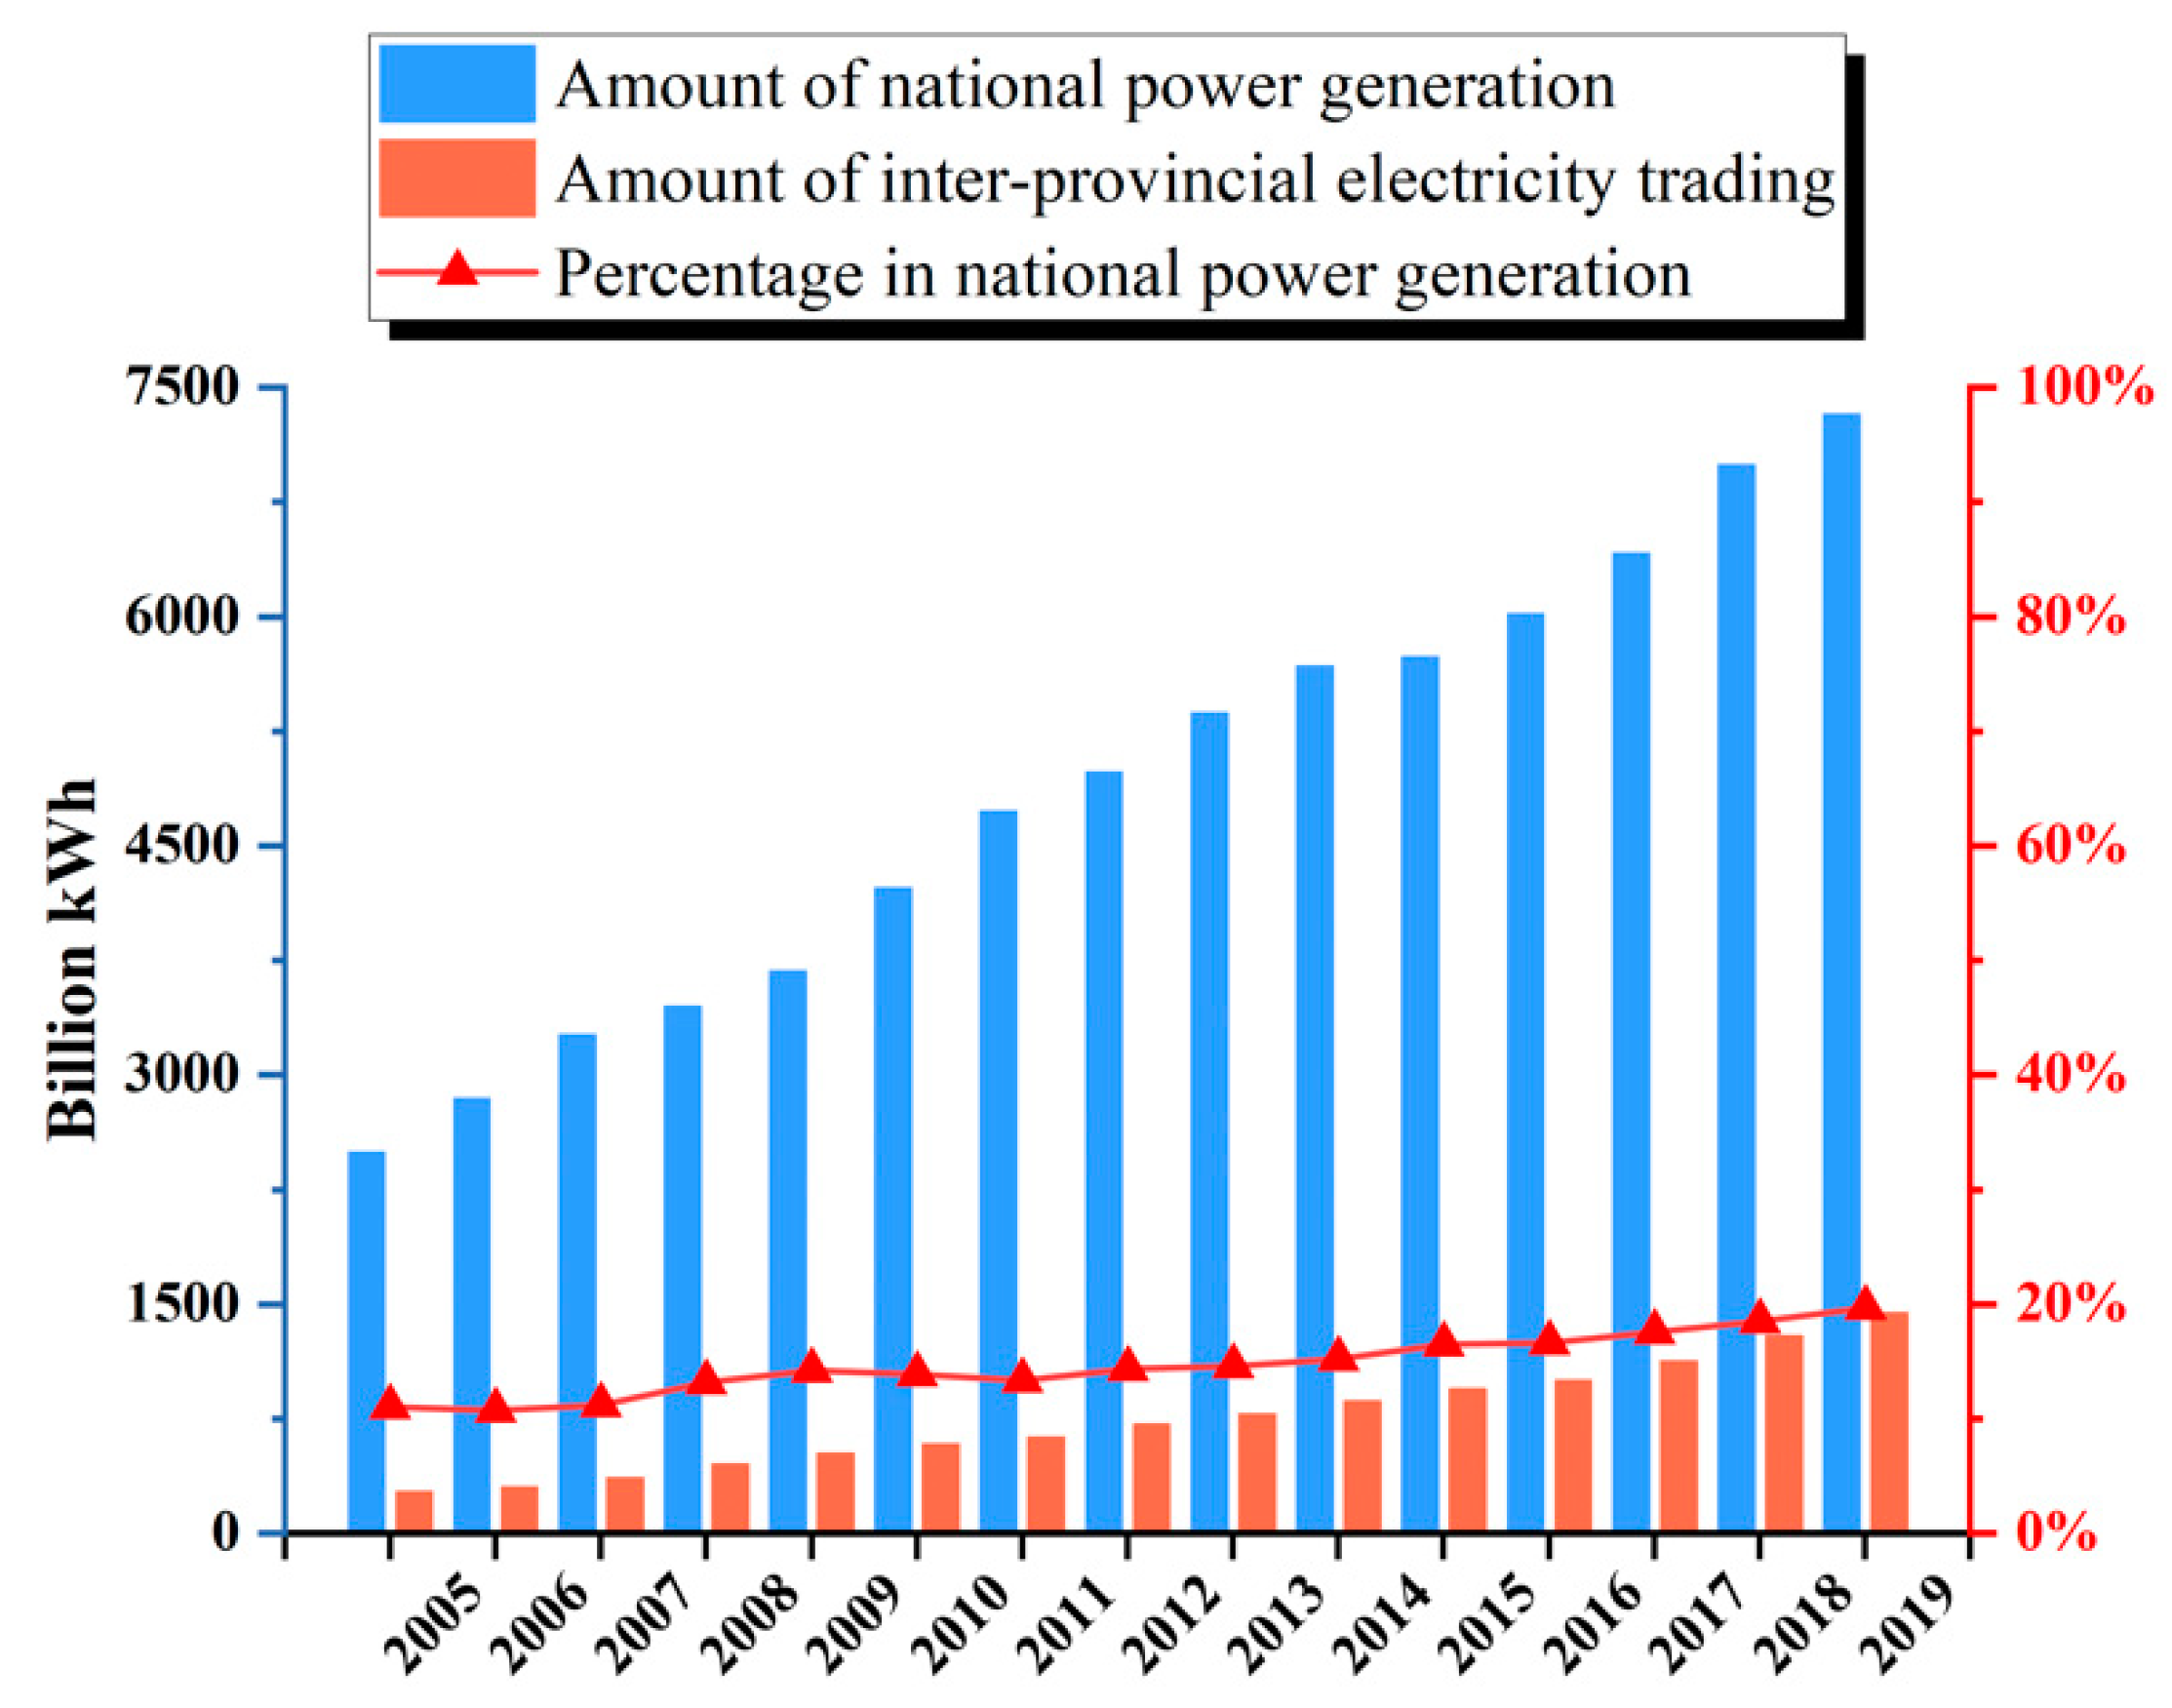
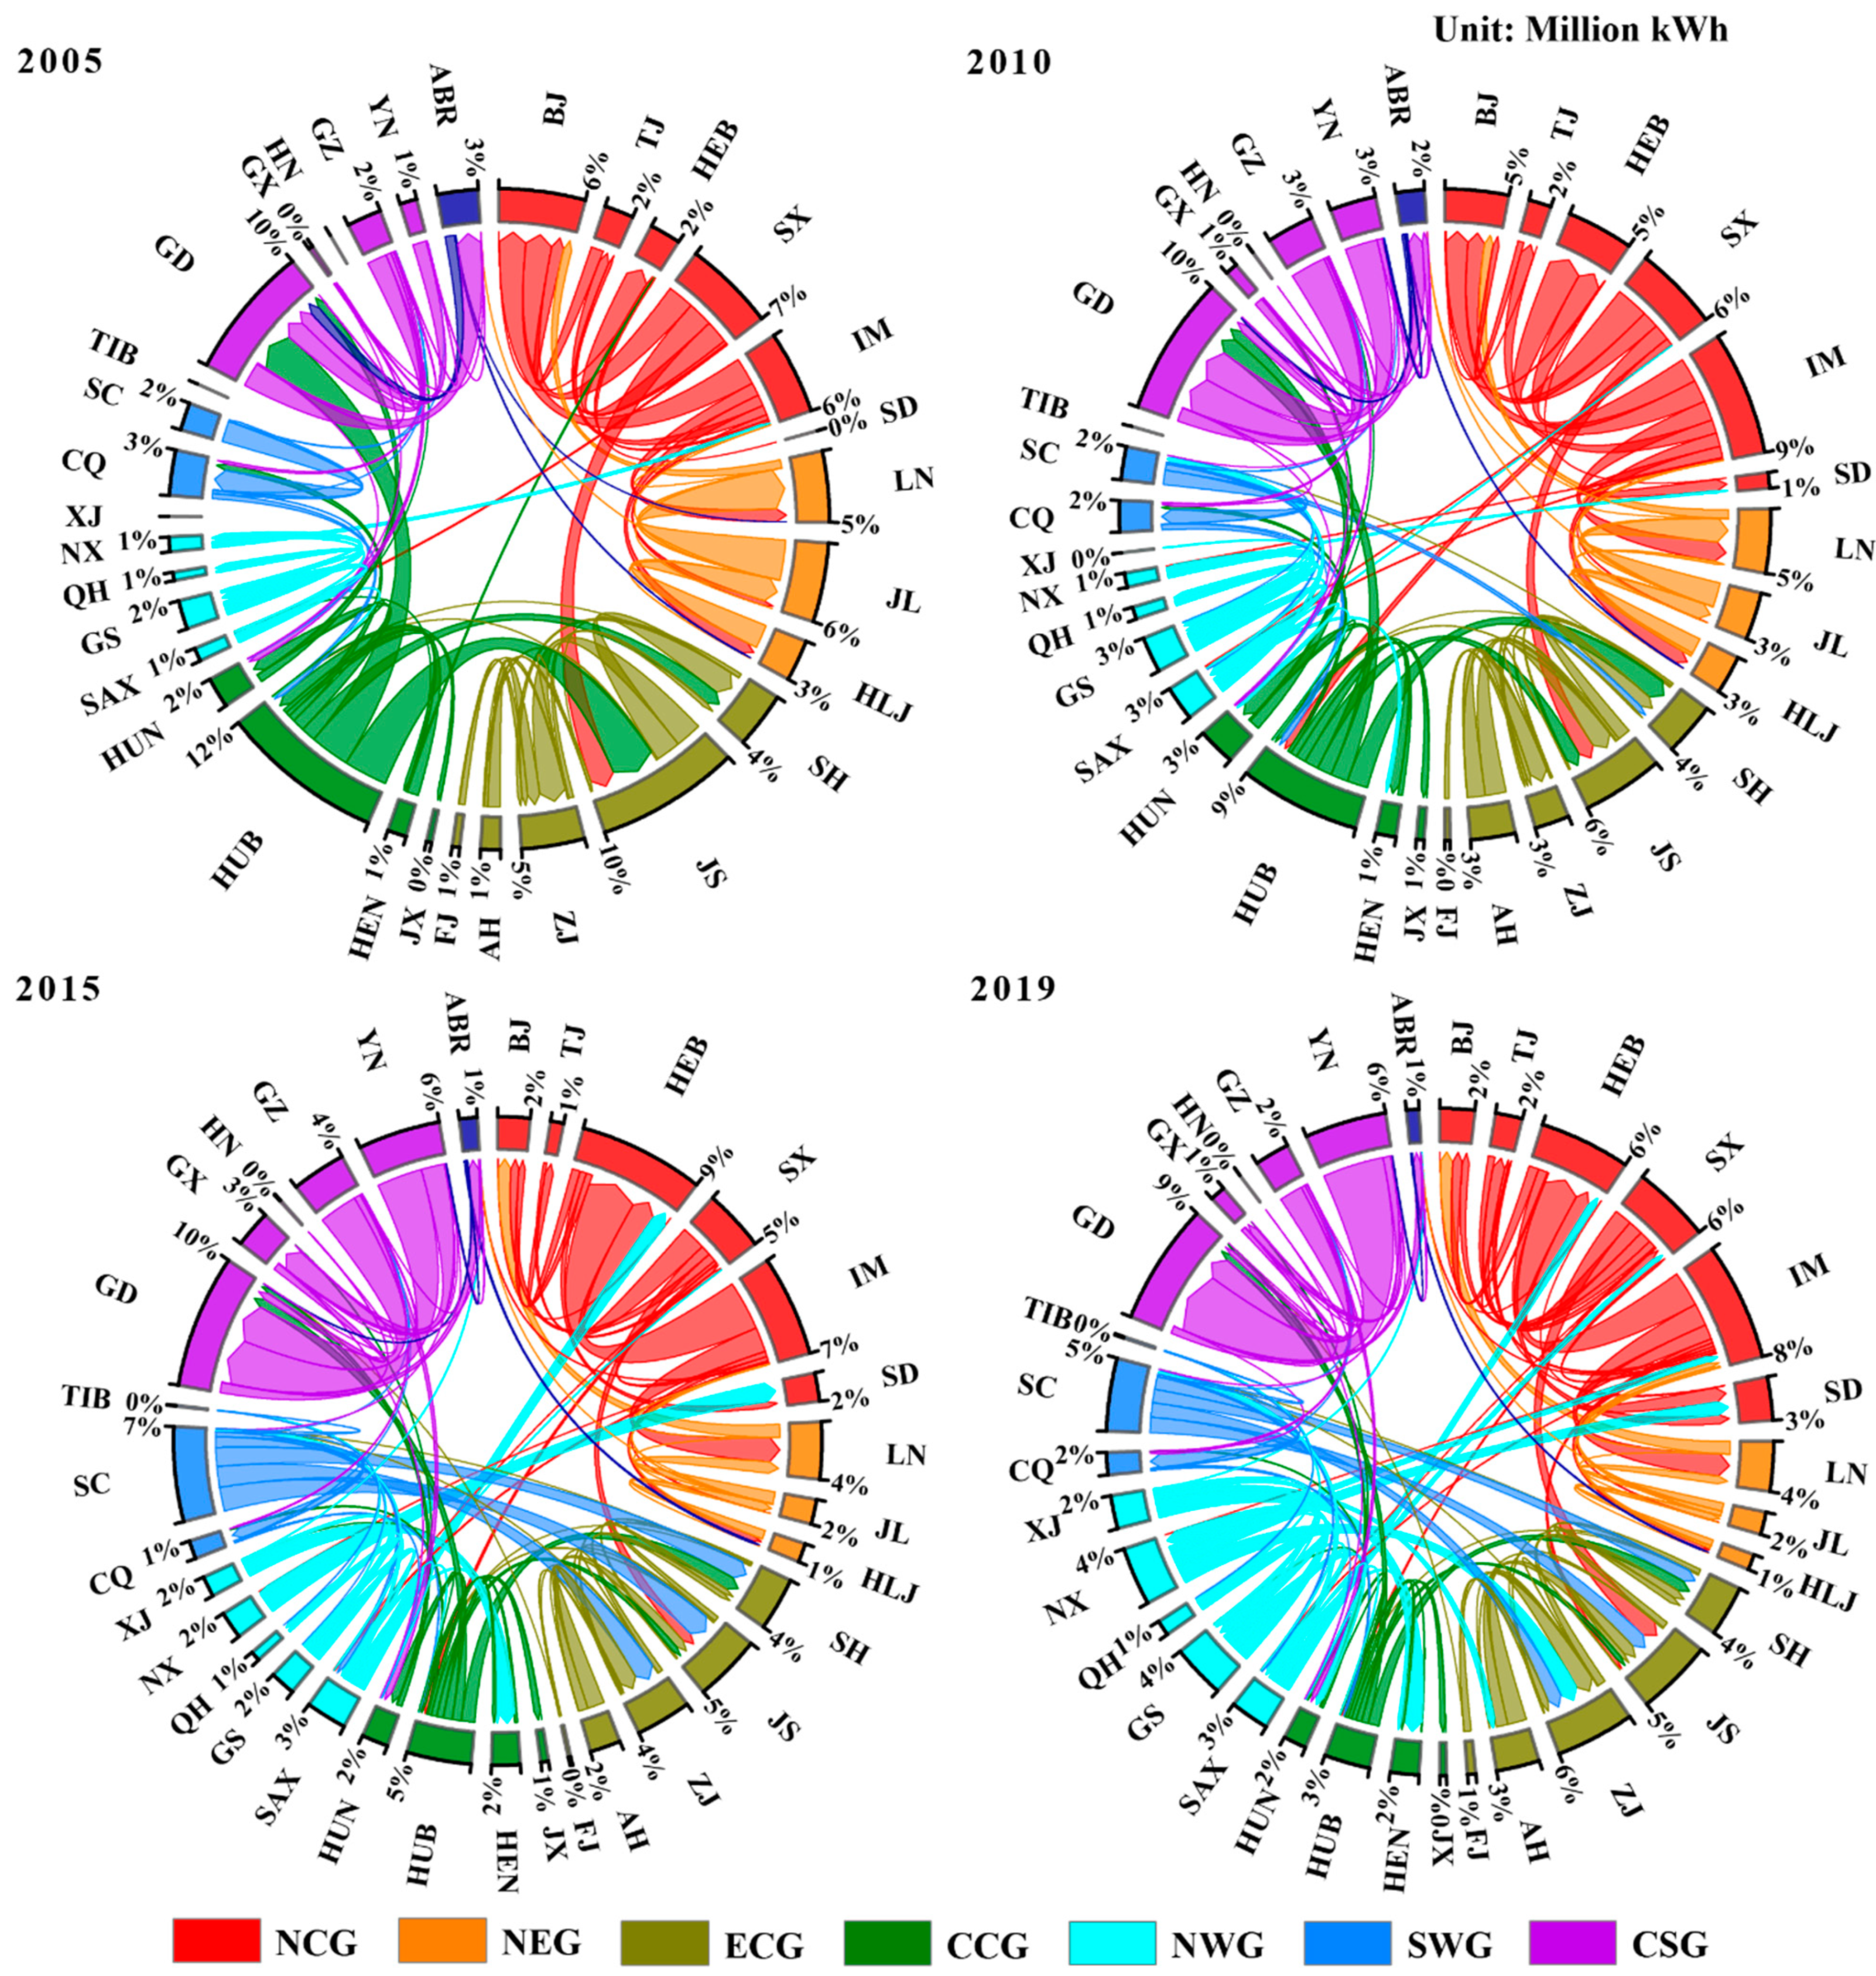
3.1. Evolution of Inter-Provincial Electricity Trading
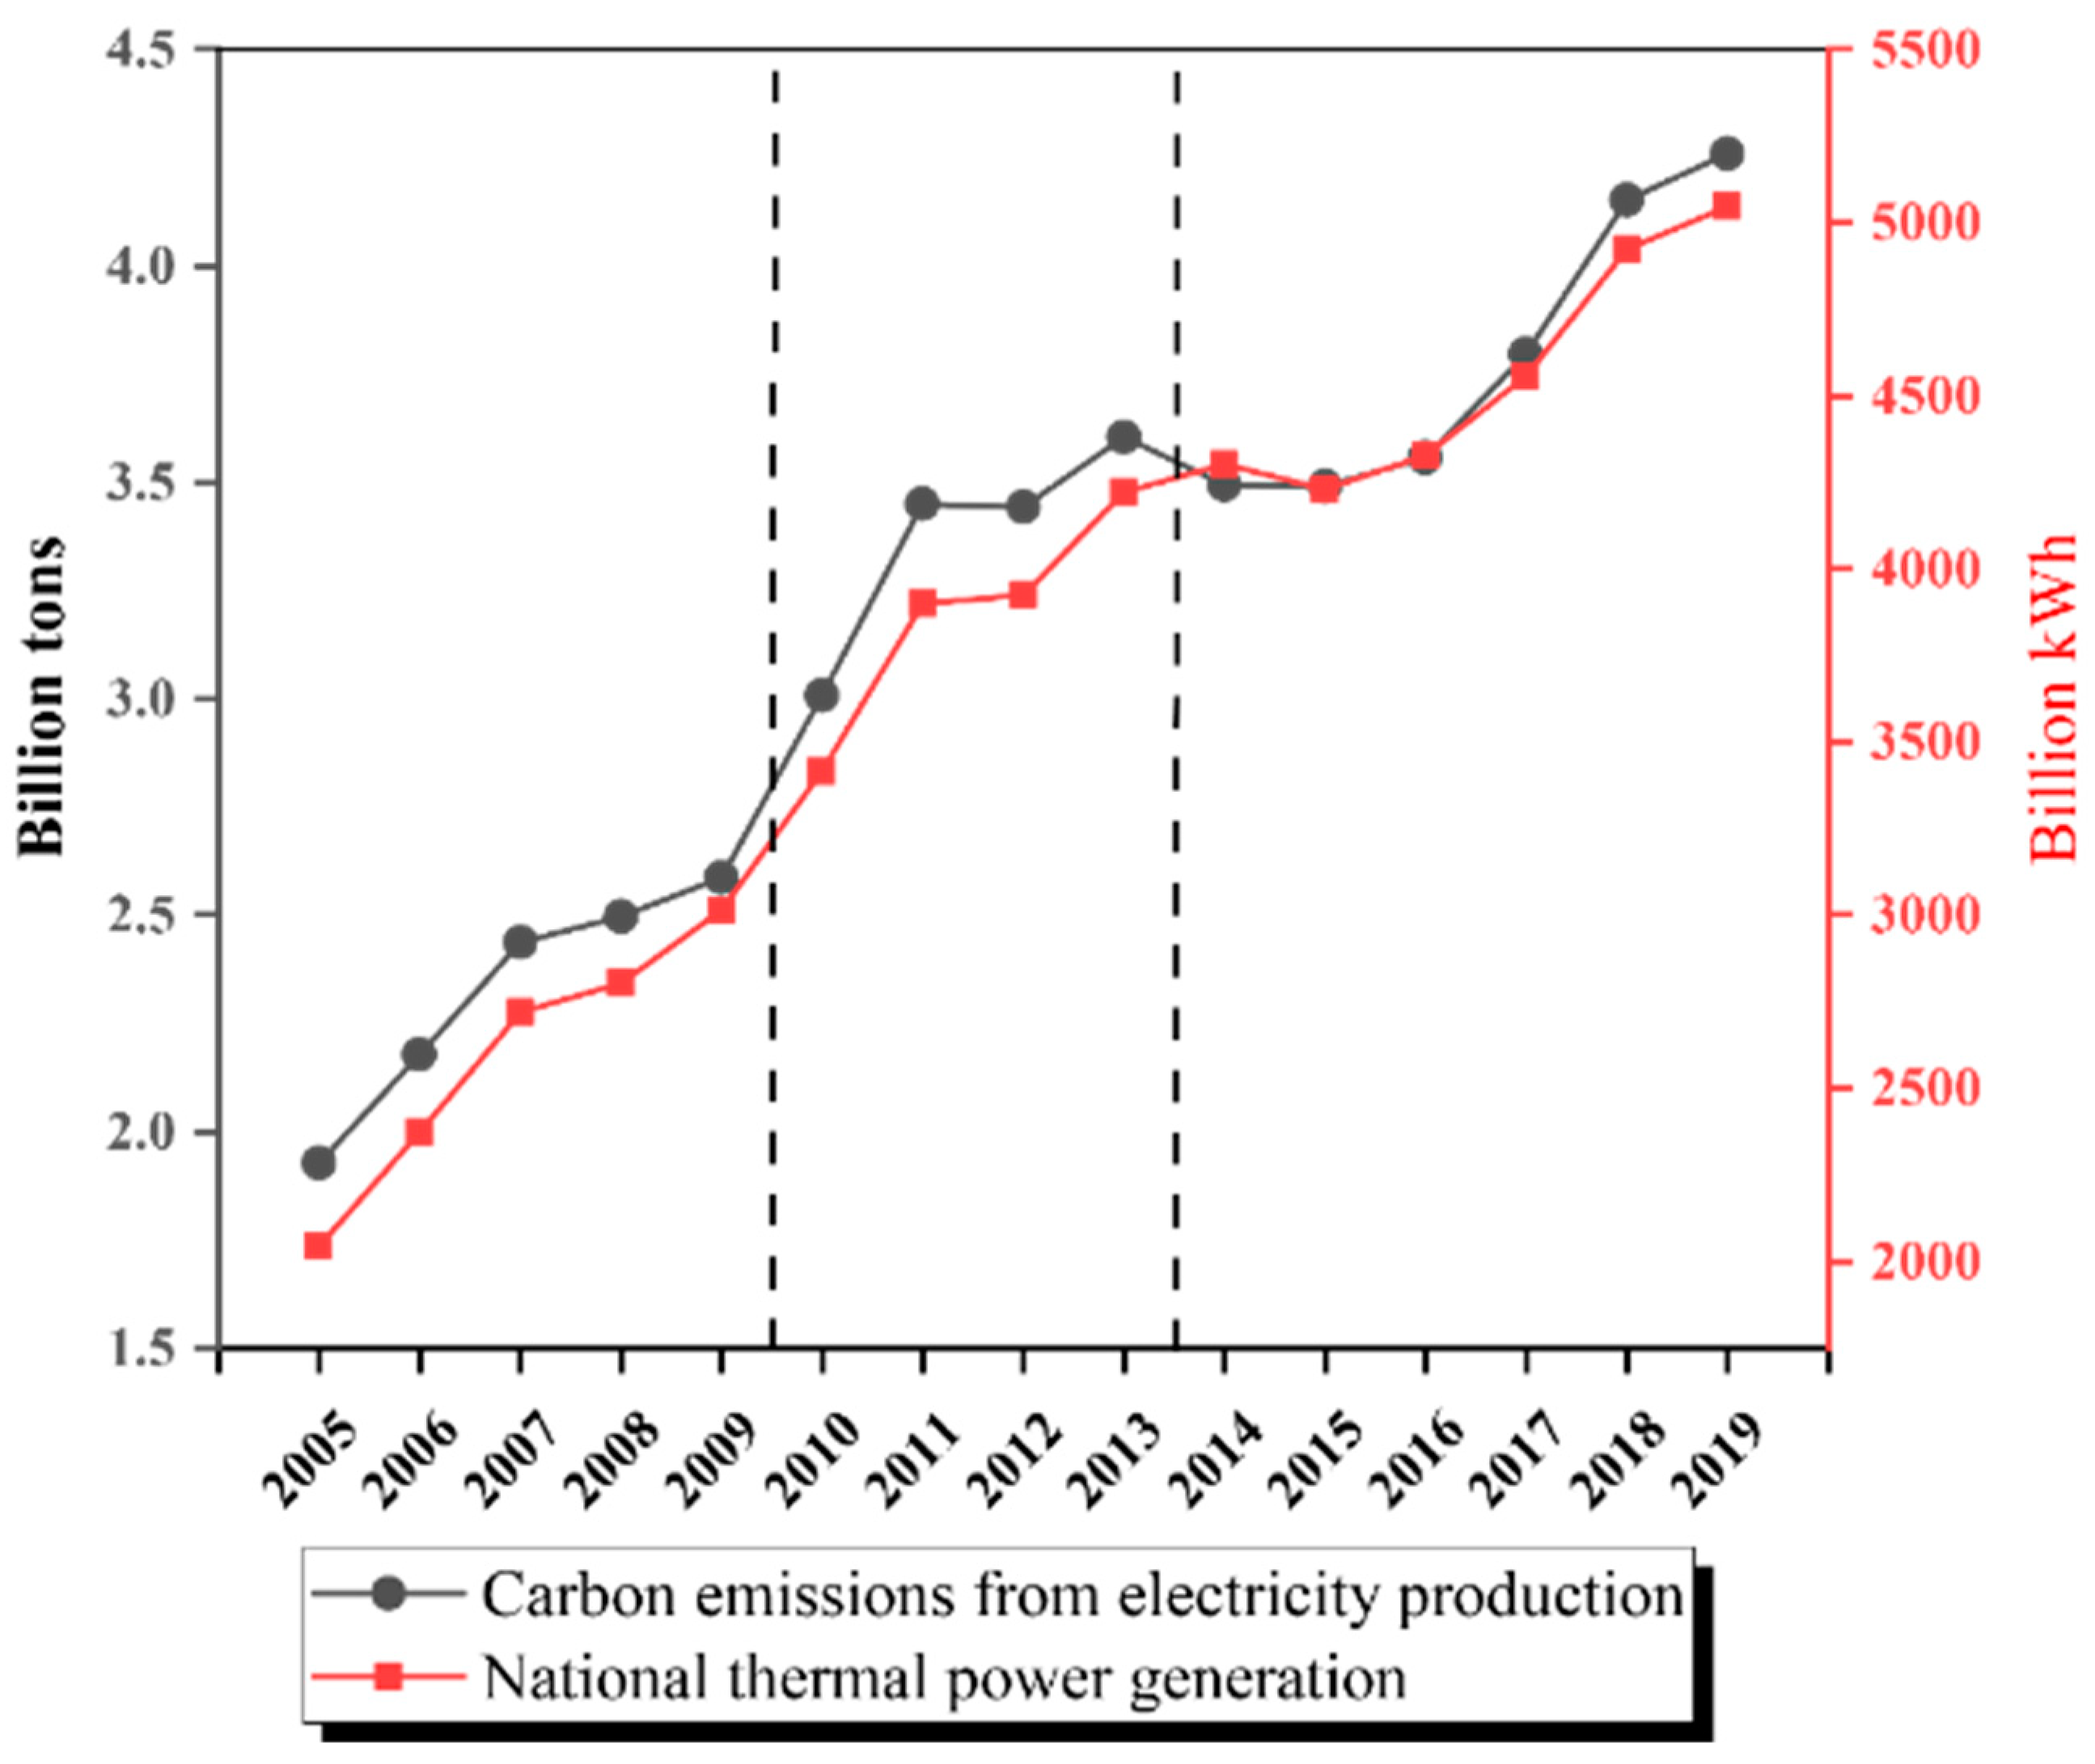
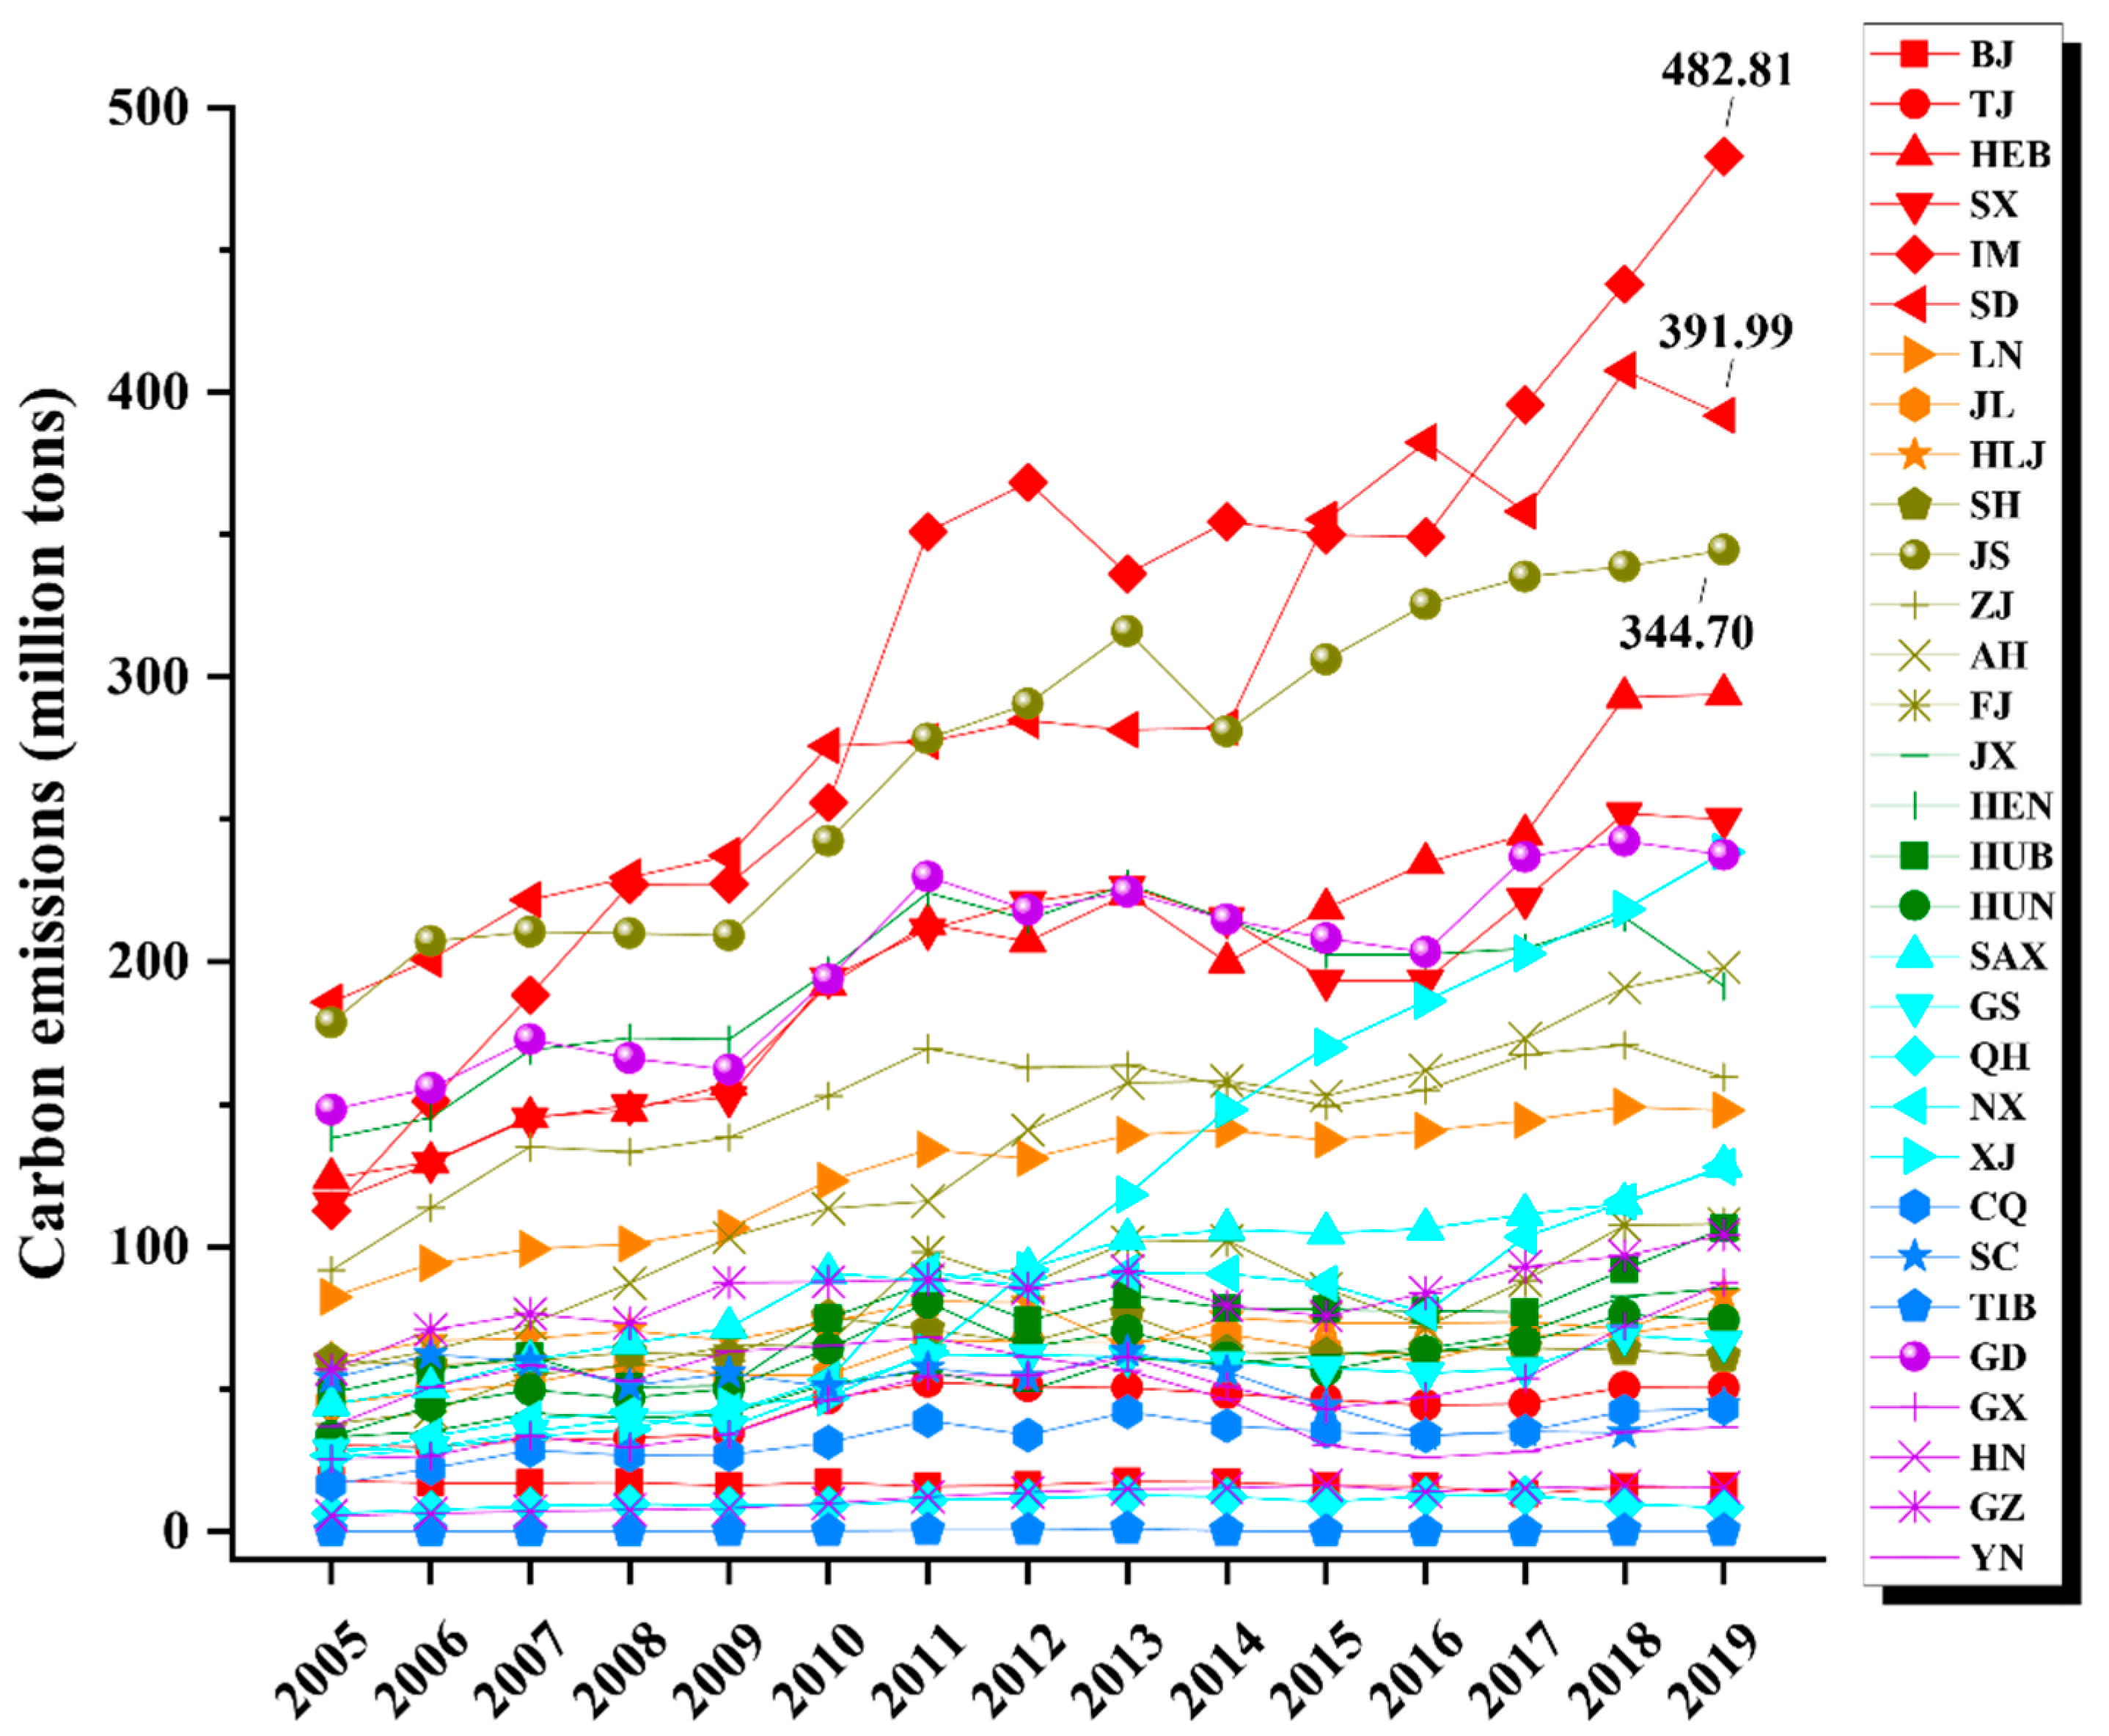
3.2. Carbon Emissions from Electricity Generation
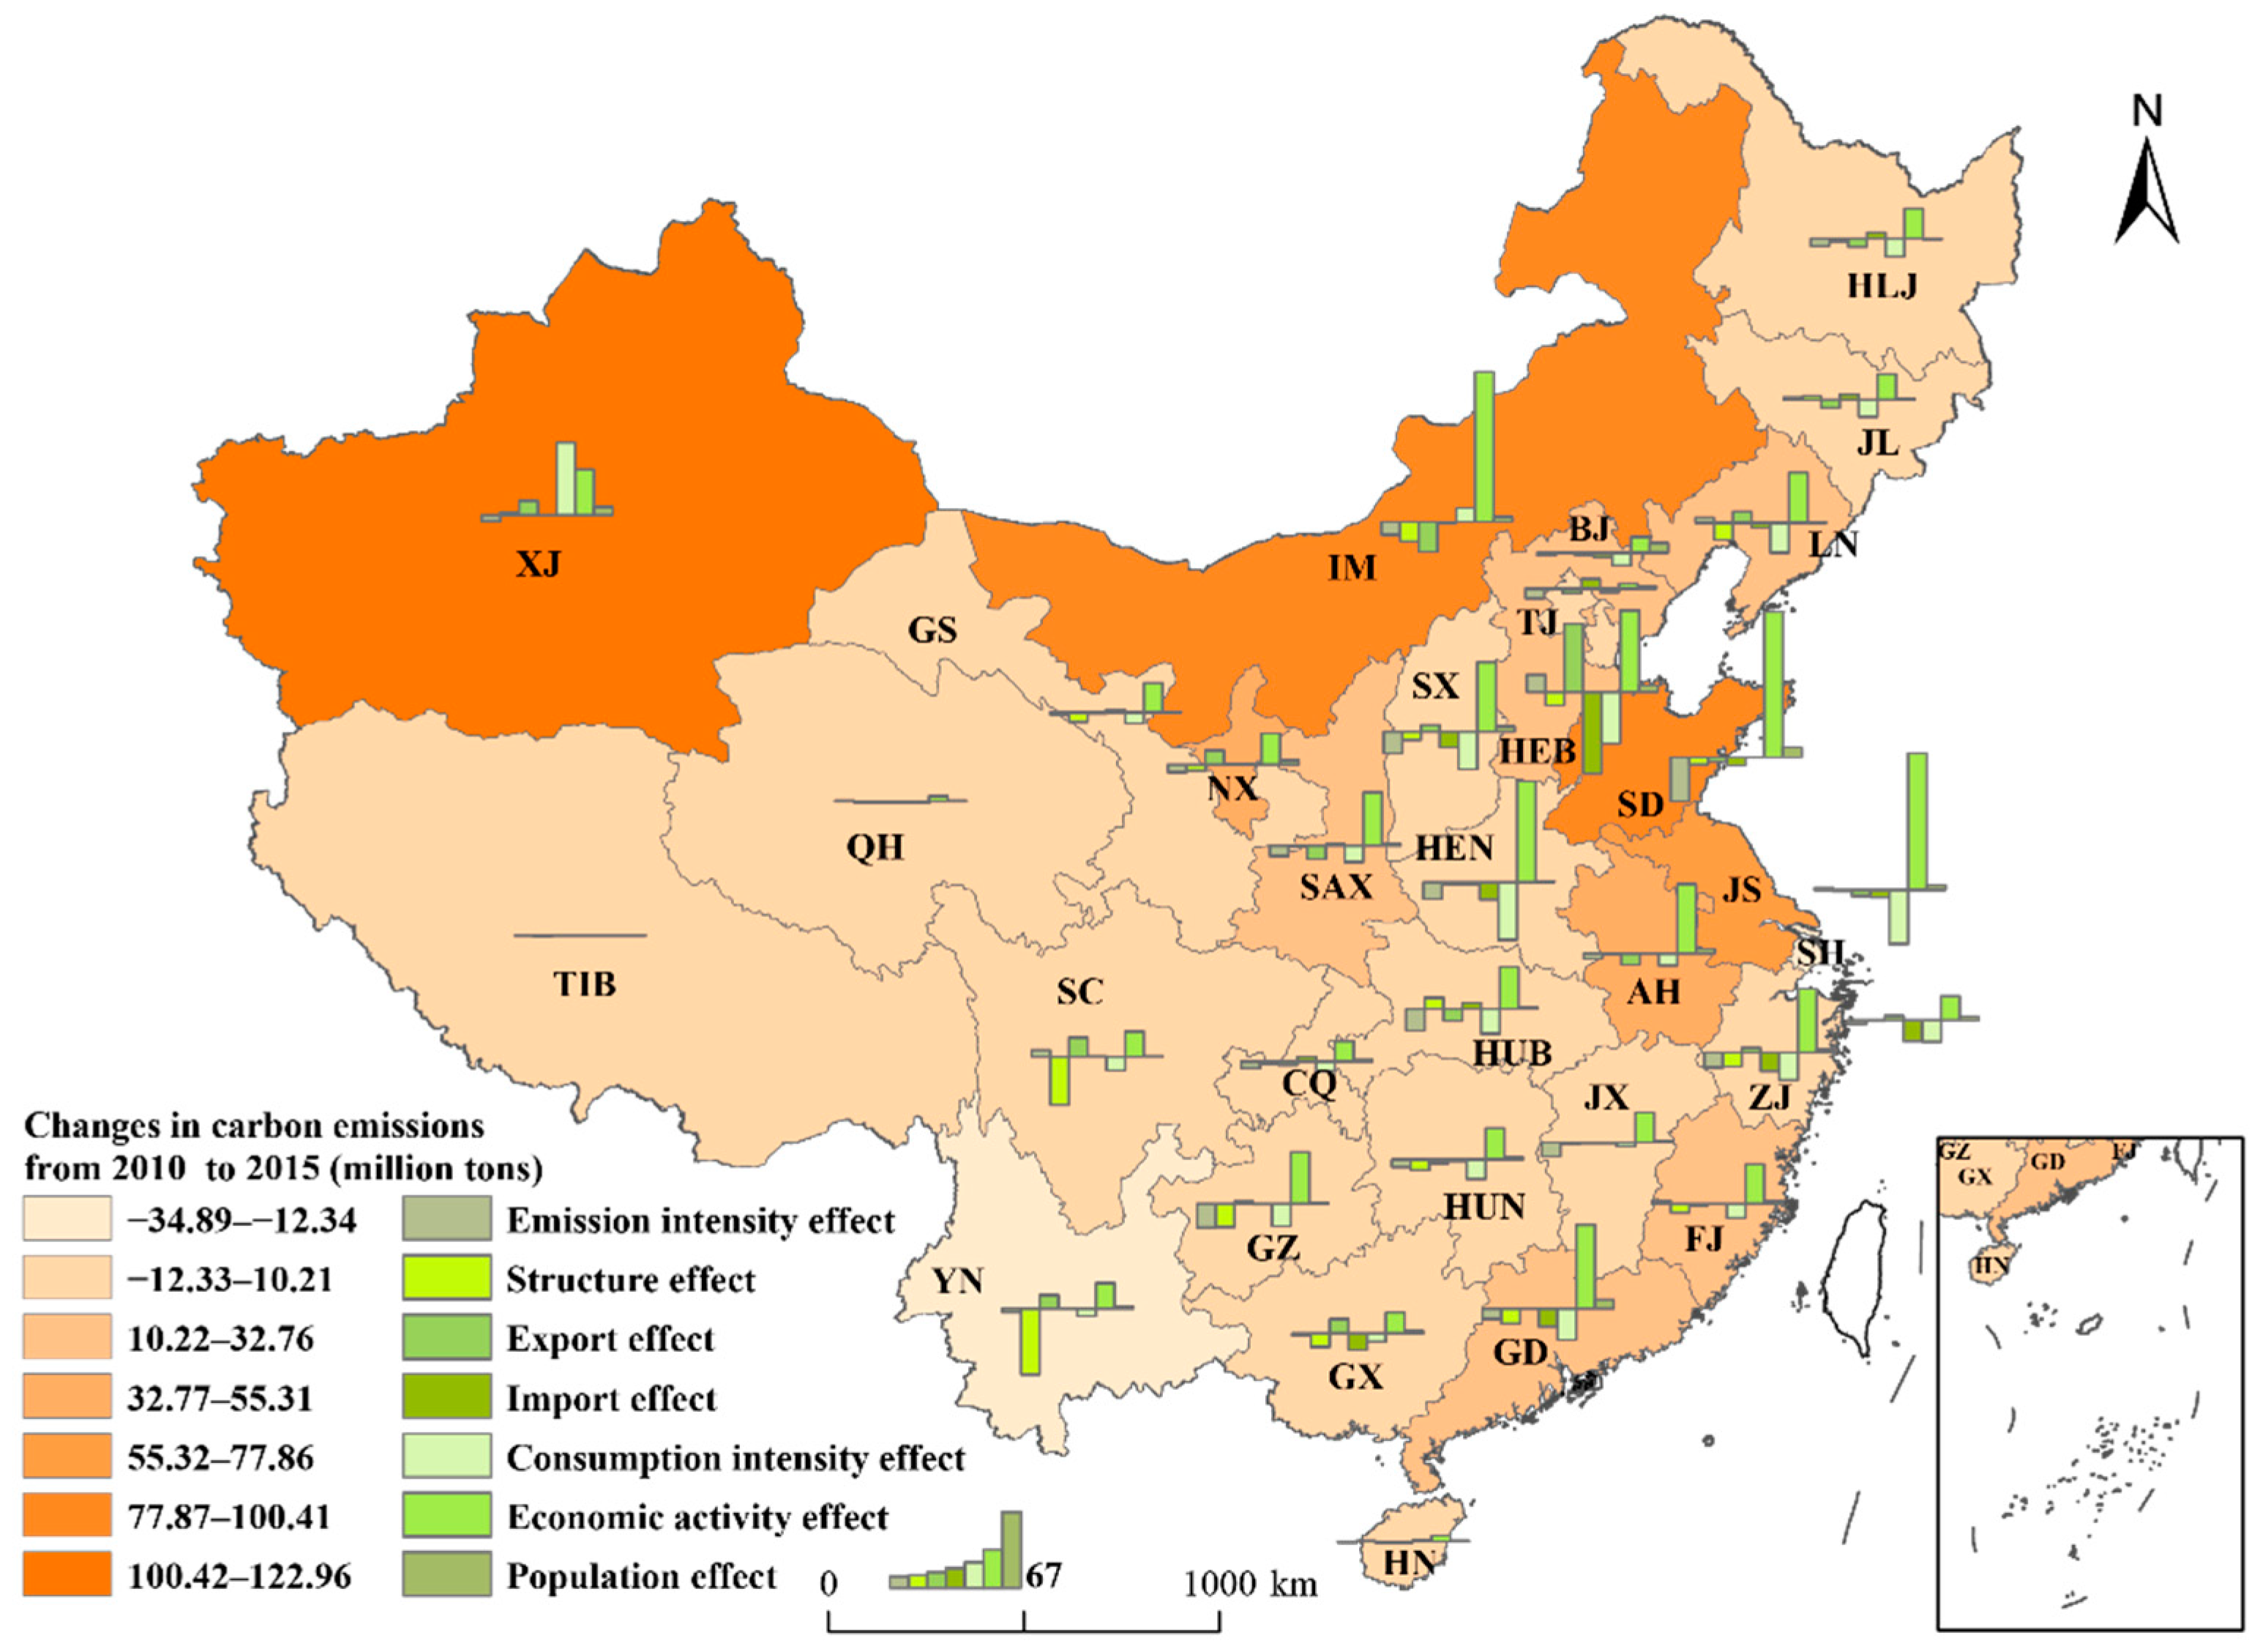
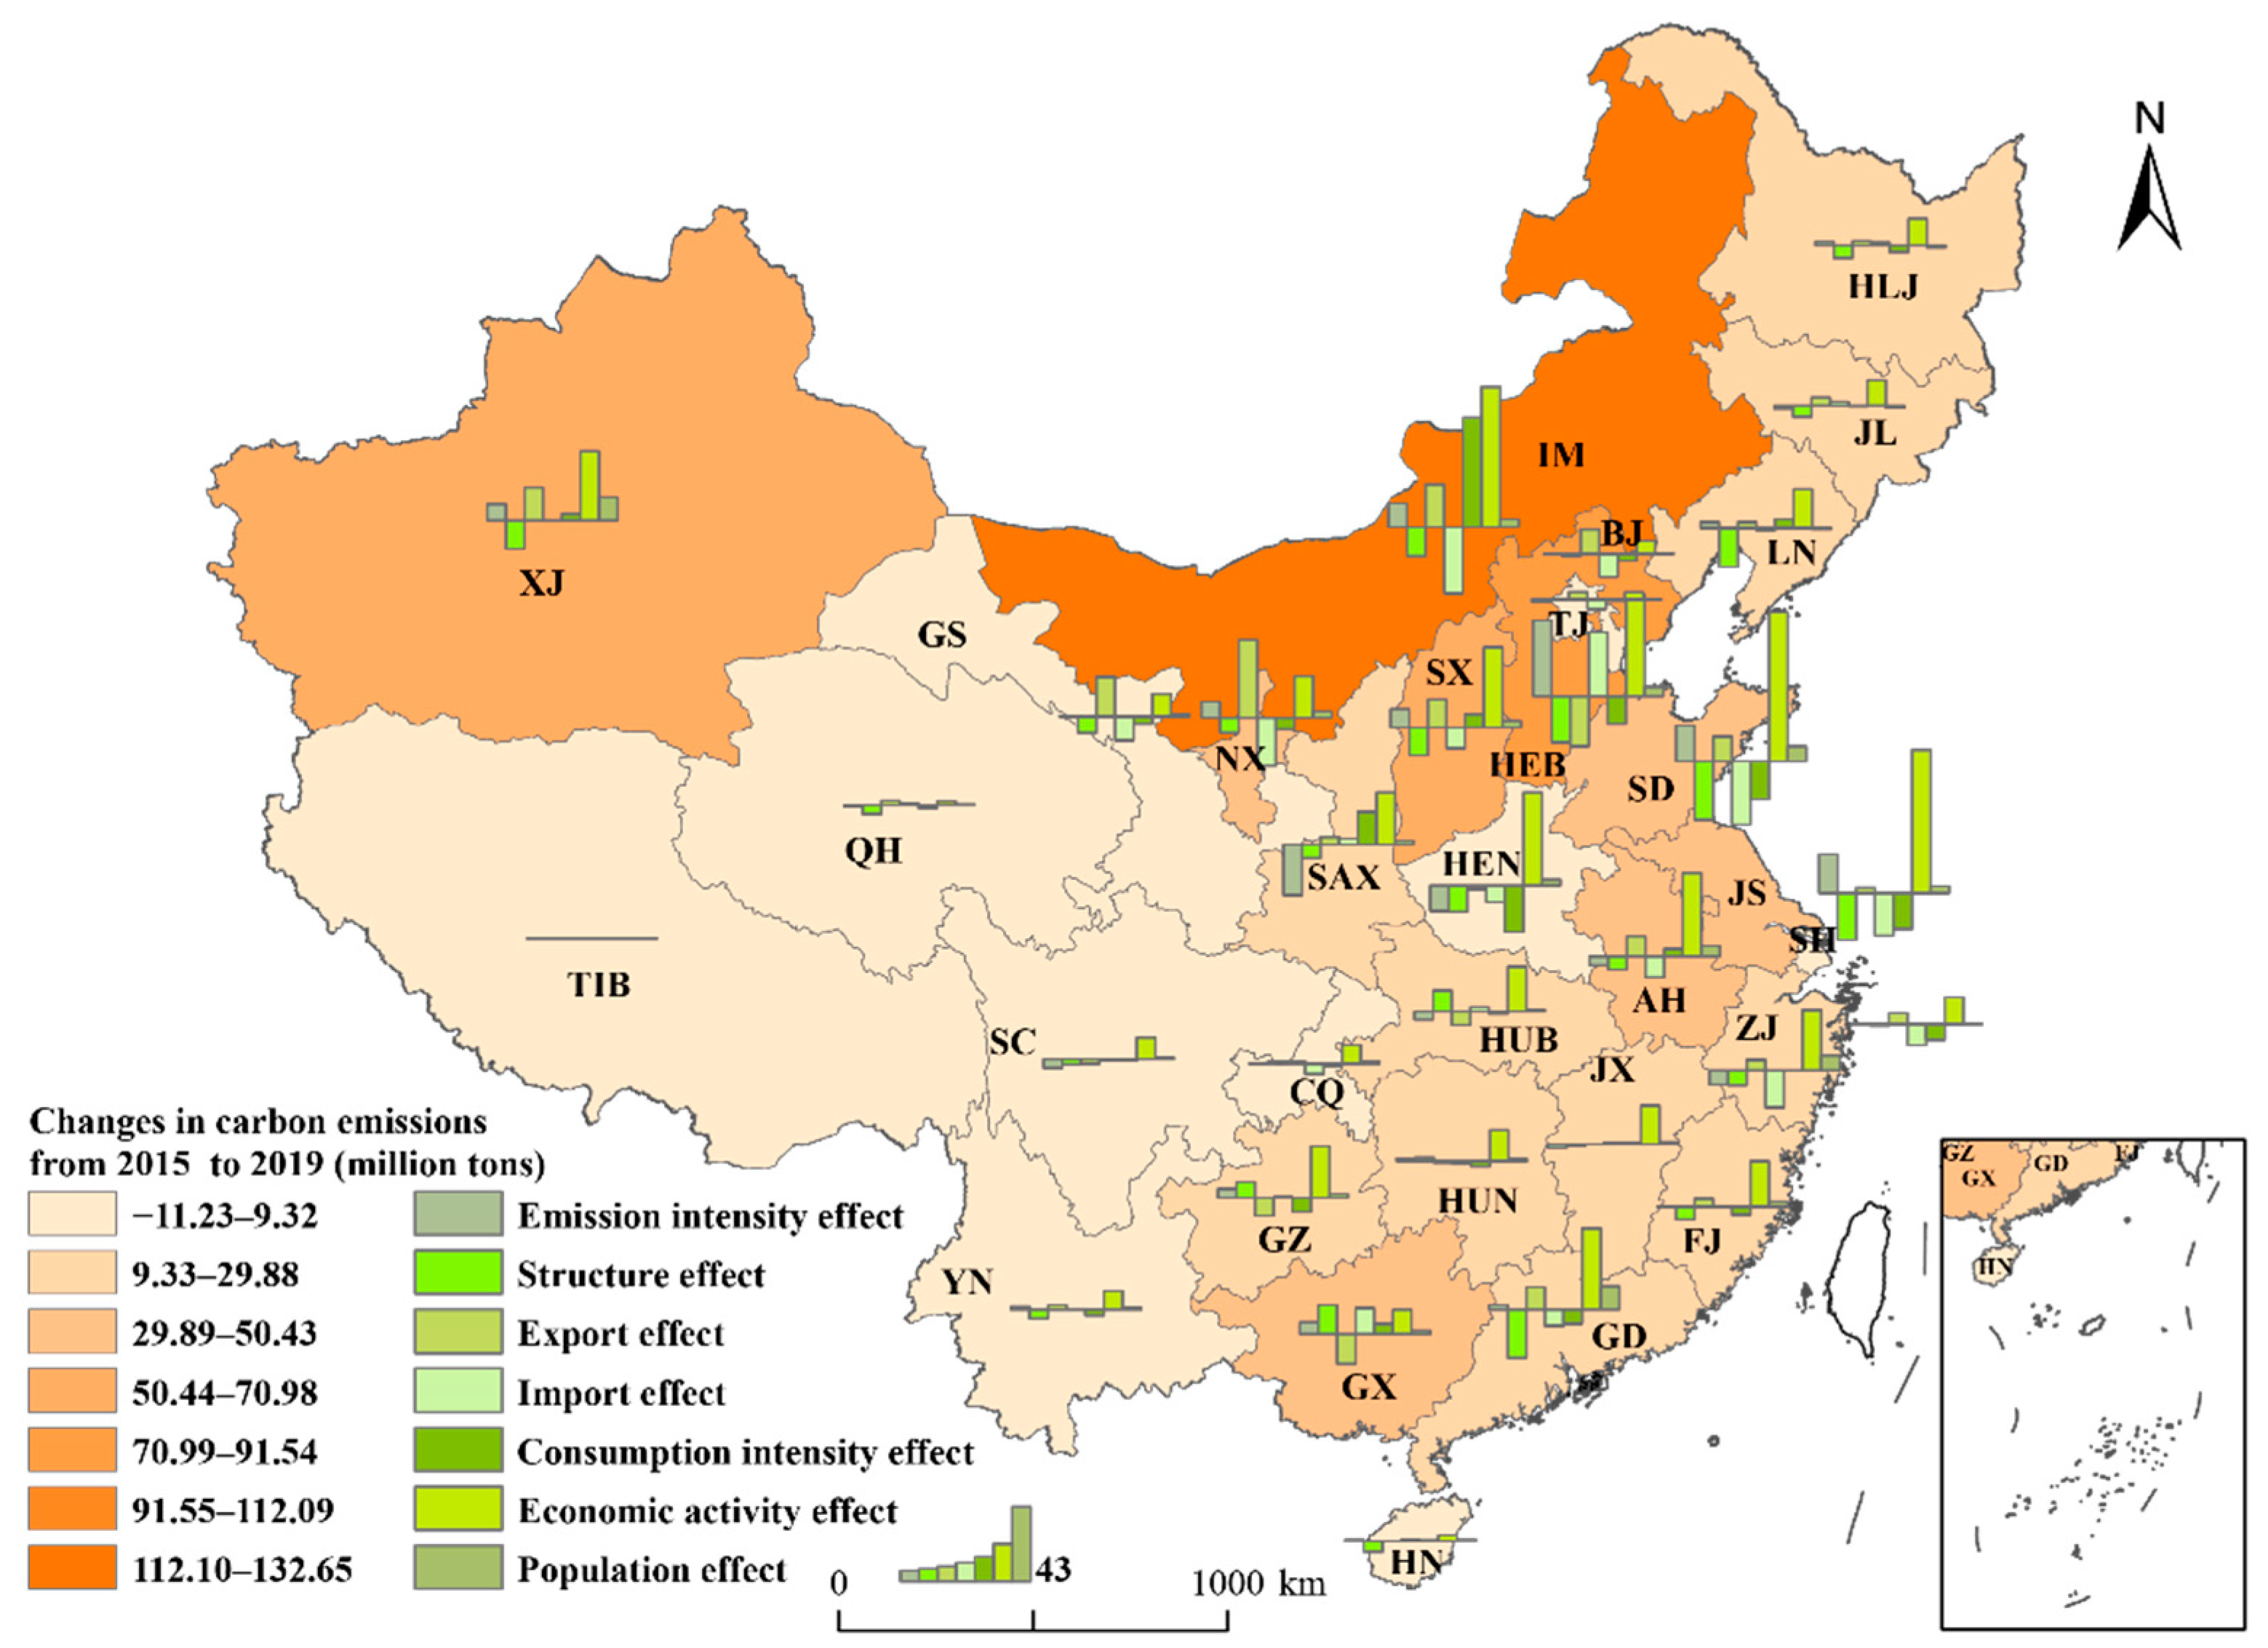
3.3. Electricity Trading and Drivers to Carbon Emissions
3.4. Provincial Clusters and Emission Reduction Strategies
4. Conclusions
Author Contributions
Funding
Institutional Review Board Statement
Informed Consent Statement
Data Availability Statement
Conflicts of Interest
References
- Ji, L.; Liang, S.; Qu, S.; Zhang, Y.; Xu, M.; Jia, X.; Jia, Y.; Niu, D.; Yuan, J.; Hou, Y.; et al. Greenhouse gas emission factors of purchased electricity from interconnected grids. Appl. Energy 2016, 184, 751–758. [Google Scholar] [CrossRef]
- Qu, S.; Liang, S.; Xu, M. CO2 Emissions Embodied in Interprovincial Electricity Transmissions in China. Environ. Sci. Technol. 2017, 51, 10893–10902. [Google Scholar] [CrossRef] [PubMed]
- Ma, S.; Liu, Q.; Zhang, W. Examining the Effects of Installed Capacity Mix and Capacity Factor on Aggregate Carbon Intensity for Electricity Generation in China. Int. J. Environ. Res. Public Health 2022, 19, 3471. [Google Scholar] [CrossRef] [PubMed]
- Ji, L.; Huang, G.H.; Niu, D.X.; Cai, Y.P.; Yin, J.G. A stochastic optimization model for carbon-emission reduction investment and sustainable energy planning under cost-risk control. J. Environ. Inform. 2020, 36, 107–118. [Google Scholar] [CrossRef]
- Kang, J.D.; Ng, T.S.; Su, B.; Yuan, R. Optimizing the Chinese Electricity Mix for CO2 Emission Reduction: An Input-Output Linear Programming Model with Endogenous Capital. Environ. Sci. Technol. 2020, 54, 697–706. [Google Scholar] [CrossRef] [PubMed]
- Li, W.; Long, R.; Zhang, L.; Cheng, X.; He, Z.; Chen, F. How the uptake of electric vehicles in China leads to emissions transfer: An Analysis from the perspective of inter-provincial electricity trading. Sustain. Prod. Consum. 2021, 28, 1006–1017. [Google Scholar] [CrossRef]
- Wang, F.; Shackman, J.; Liu, X. Carbon emission flow in the power industry and provincial CO2 emissions: Evidence from cross-provincial secondary energy trading in China. J. Clean. Prod. 2017, 159, 397–409. [Google Scholar] [CrossRef]
- China Electricity Council. Electricity Industry Statistics Compilation 2005–2019; China Electricity Council: Beijng, China, 2020. (In Chinese) [Google Scholar]
- Mei, H.; Li, Y.P.; Lv, J.; Chen, X.J.; Lu, C.; Suo, C.; Ma, Y. Development of an integrated method (Mgcms-sca-fer) for assessing the impacts of climate change—A case study of jing-jin-ji region. J. Environ. Inform. 2021, 38, 145–161. [Google Scholar] [CrossRef]
- Karmellos, M.; Kosmadakis, V.; Dimas, P.; Tsakanikas, A.; Fylaktos, N.; Taliotis, C.; Zachariadis, T. A decomposition and decoupling analysis of carbon dioxide emissions from electricity generation: Evidence from the EU-27 and the UK. Energy 2021, 231, 120861. [Google Scholar] [CrossRef]
- Zhao, Y.; Cao, Y.; Shi, X.; Zhang, Z.; Zhang, W. Structural and technological determinants of carbon intensity reduction of China’s electricity generation. Environ. Sci. Pollut. Res. 2020, 28, 13469–13486. [Google Scholar] [CrossRef]
- Wang, Y.; Yan, Q.; Li, Z.; Baležentis, T.; Zhang, Y.; Gang, L.; Streimikiene, D. Aggregate carbon intensity of China’s thermal electricity generation: The inequality analysis and nested spatial decomposition. J. Clean. Prod. 2020, 247, 119139. [Google Scholar] [CrossRef]
- Liu, N.; Ma, Z.; Kang, J. A regional analysis of carbon intensities of electricity generation in China. Energy Econ. 2017, 67, 268–277. [Google Scholar] [CrossRef]
- Jiang, J.; Ye, B.; Xie, D.; Tang, J. Provincial-level carbon emission drivers and emission reduction strategies in China: Combining multi-layer LMDI decomposition with hierarchical clustering. J. Clean. Prod. 2017, 169, 178–190. [Google Scholar] [CrossRef]
- Diakoulaki, D.; Giannakopoulos, D.; Karellas, S. The driving factors of CO2 emissions from electricity generation in Greece: An index decomposition analysis. Int. J. Glob. Warm. 2017, 13, 382–397. [Google Scholar] [CrossRef]
- Karmellos, M.; Kopidou, D.; Diakoulaki, D. A decomposition analysis of the driving factors of CO2 (Carbon dioxide) emissions from the power sector in the European Union countries. Energy 2016, 94, 680–692. [Google Scholar] [CrossRef]
- Liao, C.; Wang, S.; Fang, J.; Zheng, H.; Liu, J.; Zhang, Y. Driving forces of provincial-level CO2 emissions in China’s power sector based on LMDI method. Energy Procedia 2019, 158, 3859–3864. [Google Scholar] [CrossRef]
- Goh, T.; Ang, B.W.; Xu, X.Y. Quantifying drivers of CO2 emissions from electricity generation—Current practices and future extensions. Appl. Energy 2018, 231, 1191–1204. [Google Scholar] [CrossRef]
- Lopez, N.S.A.; Biona, J.B.M.M.; Chiu, A.S.F. Electricity trading and its effects on global carbon emissions: A decomposition analysis study. J. Clean. Prod. 2018, 195, 532–539. [Google Scholar] [CrossRef]
- Zhang, Y.; Fang, J.; Wang, S.; Yao, H. Energy-water nexus in electricity trade network: A case study of interprovincial electricity trade in China. Appl. Energy 2020, 257, 113685. [Google Scholar] [CrossRef]
- Wang, S.G.; Zhu, X.J.; Song, D.; Wen, Z.G.; Chen, B.; Feng, K.S. Drivers of CO2 emissions from power generation in China based on modified structural decomposition analysis. J. Clean. Prod. 2019, 220, 1143–1155. [Google Scholar] [CrossRef]
- Liao, C.; Wang, S.; Zhang, Y.; Song, D.; Zhang, C. Driving forces and clustering analysis of provincial-level CO2 emissions from the power sector in China from 2005 to 2015. J. Clean. Prod. 2019, 240, 118026. [Google Scholar] [CrossRef]
- He, Y.; Xing, Y.; Zeng, X.; Ji, Y.; Hou, H.; Zhang, Y.; Zhu, Z. Factors influencing carbon emissions from China’s electricity industry: Analysis using the combination of LMDI and K-means clustering. Environ. Impact Assess. Rev. 2022, 93, 106724. [Google Scholar] [CrossRef]
- Wen, L.; Li, Z. Provincial-level industrial CO2 emission drivers and emission reduction strategies in China: Combining two-layer LMDI method with spectral clustering. Sci. Total Environ. 2020, 700, 134374. [Google Scholar] [CrossRef] [PubMed]
- Wen, L.; Hao, Y. Factor decomposition and clustering analysis of CO2 emissions from China’s power industry based on Shapley value. Energy Sour. Part A Recovery Util. Environ. Eff. 2020, 1–17. [Google Scholar] [CrossRef]
- Shi, T.; Seligson, D.; Belldegrun, A.S.; Palotie, A.; Horvath, S. Tumor classification by tissue microarray profiling: Random forest clustering applied to renal cell carcinoma. Mod. Pathol. 2005, 18, 547–557. [Google Scholar] [CrossRef] [PubMed] [Green Version]
- Perbet, F.; Stenger, B.; Maki, A. Random Forest Clustering and Application to Video Segmentation; Citeseer: Princeton, NJ, USA, 2009. [Google Scholar]
- Conrad, D.J.; Bailey, B.A. Multidimensional clinical phenotyping of an adult cystic fibrosis patient population. PLoS ONE 2015, 10, e0122705. [Google Scholar] [CrossRef]
- Denaro, K.; Sato, B.; Harlow, A.; Aebersold, A.; Verma, M. Comparison of Cluster Analysis Methodologies for Characterization of Classroom Observation Protocol for Undergraduate STEM (COPUS) Data. CBE—Life Sci. Educ. 2021, 20, ar3. [Google Scholar] [CrossRef]
- Qu, S.; Wang, H.; Liang, S.; Shapiro, A.M.; Suh, S.; Sheldon, S.; Zik, O.; Fang, H.; Xu, M. A Quasi-Input-Output model to improve the estimation of emission factors for purchased electricity from interconnected grids. Appl. Energy 2017, 200, 249–259. [Google Scholar] [CrossRef]
- Lopez, N.S.A.; Mousavi, B.; Biona, J.B.M.M.; Chiu, A.S.F. Decomposition analysis of CO2 emissions with emphasis on electricity imports and exports: EU as a model for ASEAN integration. Chem. Eng. Trans. 2017, 61, 739–744. [Google Scholar] [CrossRef]
- Vitrano, A.; Musallam, K.M.; Meloni, A.; Addario Pollina, S.; Karimi, M.; El-Beshlawy, A.; Hajipour, M.; Di Marco, V.; Ansari, S.H.; Filosa, A.; et al. Random Forest Clustering Identifies Three Subgroups of β-Thalassemia with Distinct Clinical Severity. Thalass. Rep. 2022, 12, 14–23. [Google Scholar] [CrossRef]
- Wang, H.; Wang, W.; Liang, S.; Zhang, C.; Qu, S.; Liang, Y.; Li, Y.; Xu, M.; Yang, Z. Determinants of Greenhouse Gas Emissions from Interconnected Grids in China. Environ. Sci. Technol. 2019, 53, 1432–1440. [Google Scholar] [CrossRef] [PubMed]
- Intergovernmental Panel on Climate Change. Fifth Assessment Report, Working Group III, Summary for Policymakers. 2014. Available online: https://www.ipcc.ch/report/ar5/wg3/ (accessed on 23 February 2022).
- Intergovernmental Panel on Climate Change. 2006 IPCC Guidelines for National Greenhouse Gas Inventories; The Institute for Global Environmental Strategies: Hayama, Japan, 2006. Available online: https://www.ipcc.ch/report/2006-ipcc-guidelines-for-national-greenhouse-gas-inventories/ (accessed on 23 February 2022).
- National Bureau of Statistics. China Energy Statistical Yearbook 2006–2020; People’s Republic of China, China Statistics Press: Beijing, China, 2020; (In Chinese). Available online: https://data.cnki.net/Trade/yearbook/single/N2021050066?zcode=Z025 (accessed on 15 February 2022).
- Shan, Y.; Huang, Q.; Guan, D.; Hubacek, K. China CO2 emission accounts 2016–2017. Sci. Data 2020, 7, 54. [Google Scholar] [CrossRef] [PubMed] [Green Version]
- Shan, Y.; Guan, D.; Zheng, H.; Ou, J.; Li, Y.; Meng, J.; Mi, Z.; Liu, Z.; Zhang, Q. China CO2 emission accounts 1997–2015. Sci. Data 2018, 5, 170201. [Google Scholar] [CrossRef] [PubMed] [Green Version]
- Shan, Y.; Zheng, H.; Guan, D.; Li, C.; Mi, Z.; Meng, J.; Schroeder, H.; Ma, J.; Ma, Z. Energy consumption and CO2 emissions in Tibet and its cities in 2014. Earths Future 2017, 5, 854–864. [Google Scholar] [CrossRef] [Green Version]
- National Bureau of Statistics. China Statistical Yearbook 2005–2019; People’s Republic of China: Beijing, China, 2020; (In Chinese). Available online: https://data.stats.gov.cn/ (accessed on 15 February 2022).


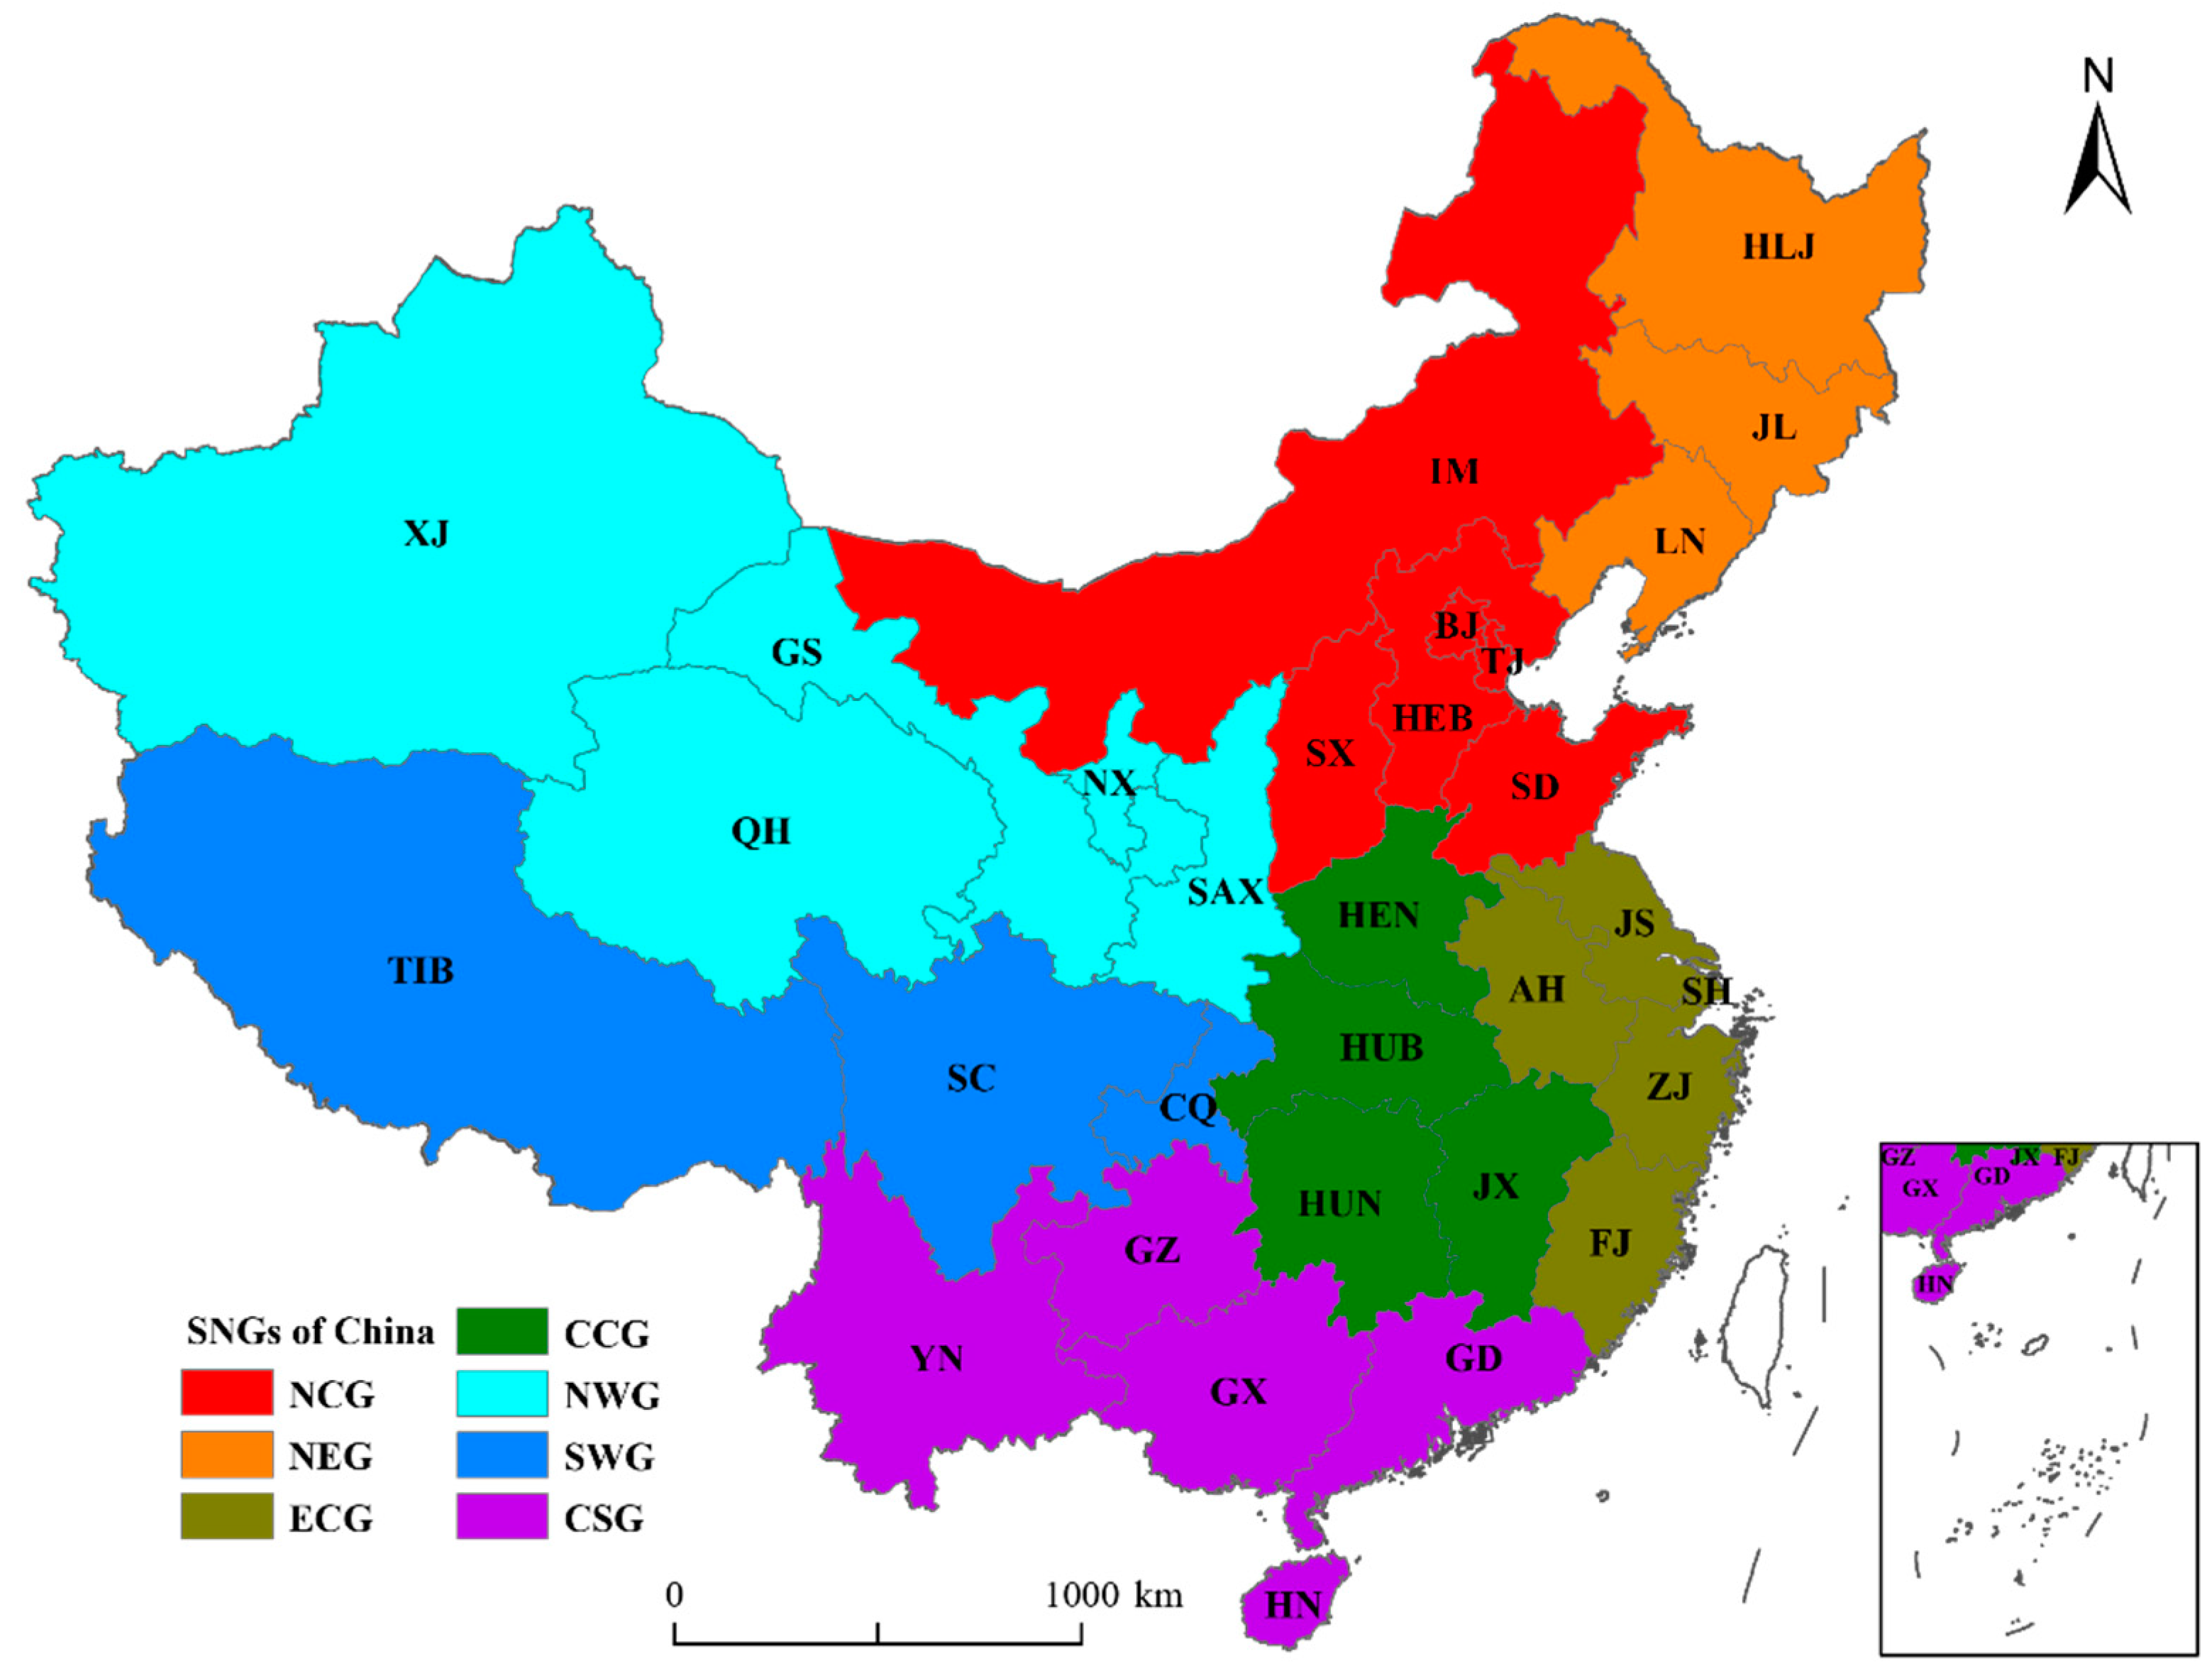
| Subnational Grids | Symbol | Provincial Grids (Abbreviations) |
|---|---|---|
| North China Grid | NCG | Beijing (BJ), Tianjin (TJ), Hebei (HEB), Shanxi (SX), Inner Mongolia (IM), Shandong (SD) |
| Northeast China grid | NEG | Liaoning (LN), Jilin (JL), Heilongjiang (HLJ) |
| East China Grid | ECG | Shanghai (SH), Jiangsu (JS), Zhejiang (ZJ), Anhui (AH), Fujian (FJ) |
| Central China Grid | CCG | Jiangxi (JX), Henan (HEN), Hubei (HUB), Hunan (HUN) |
| Northwest China grid | NWG | Shaanxi (SAX), Gansu (GS), Qinghai (QH), Ningxia (NX), Xinjiang (XJ) |
| Southwest China grid | SWG | Chongqing (CQ), Sichuan (SC), Tibet (TIB) |
| China Southern Power Grid | CSG | Guangdong (GD), Guangxi (GX), Hainan (HN), Guizhou (GZ), Yunnan (YN) |
| Clusters | PGs | ||||||||
|---|---|---|---|---|---|---|---|---|---|
| 1 | BJ | −0.31 | −1.49 | −0.28 | 4.17 | −5.93 | −0.86 | 4.21 | −0.13 |
| TJ | 4.06 | −0.09 | −1.36 | 14.48 | −13.46 | −3.84 | 7.87 | 0.47 | |
| SH | −0.54 | −0.67 | −1.03 | 6.57 | −12.20 | −9.19 | 15.64 | 0.33 | |
| GS | 8.96 | −0.03 | −9.63 | 22.78 | −13.99 | −4.21 | 12.93 | 1.11 | |
| QH | −2.12 | −0.83 | −5.29 | 2.59 | 0.63 | −1.73 | 2.21 | 0.31 | |
| SC | 0.51 | −5.12 | −3.04 | −2.79 | −0.93 | −0.95 | 12.43 | 0.91 | |
| TIB | 0.07 | 0.00 | 0.03 | 0.01 | 0.00 | 0.01 | 0.01 | 0.00 | |
| HN | −0.80 | 0.77 | −6.31 | −0.06 | 0.61 | 0.19 | 3.42 | 0.58 | |
| YN | 6.28 | 1.54 | −5.40 | 2.37 | 0.09 | −3.55 | 10.43 | 0.81 | |
| Cluster 1’s mean | 1.79 | −0.66 | −3.59 | 5.57 | −5.02 | −2.68 | 7.68 | 0.49 | |
| 2 | HEB | 75.34 | 44.50 | −26.90 | −29.12 | 37.46 | −15.89 | 59.64 | 5.66 |
| SX | 56.56 | 10.86 | −16.17 | 16.11 | −12.44 | 7.68 | 46.65 | 3.88 | |
| IM | 132.65 | 13.71 | −16.87 | 24.79 | −38.57 | 63.59 | 81.26 | 4.74 | |
| SD | 36.56 | 20.57 | −34.24 | 14.33 | −36.91 | −22.26 | 86.70 | 8.36 | |
| JS | 38.40 | 22.25 | −27.53 | 2.81 | −25.05 | −20.82 | 82.94 | 3.81 | |
| NX | 41.04 | 9.51 | −8.68 | 45.69 | −27.80 | −6.40 | 24.52 | 4.21 | |
| XJ | 68.72 | 9.57 | −16.74 | 19.01 | −0.43 | 3.69 | 40.10 | 13.52 | |
| GD | 29.31 | 2.46 | −28.16 | 13.01 | −9.59 | −8.64 | 46.86 | 13.38 | |
| Cluster 2’s mean | 59.82 | 16.68 | −21.91 | 13.33 | −14.17 | 0.12 | 58.58 | 7.19 | |
| 3 | LN | 10.52 | 3.60 | −22.55 | 3.45 | −1.11 | 5.31 | 22.81 | −0.98 |
| JL | 10.53 | −1.75 | −6.55 | 4.55 | 1.91 | −0.45 | 14.38 | −1.57 | |
| HLJ | 10.01 | 2.27 | −7.47 | 2.79 | 1.80 | −3.79 | 15.67 | −1.26 | |
| Cluster 3’s mean | 10.36 | 1.37 | −12.19 | 3.60 | 0.87 | 0.36 | 17.62 | −1.27 | |
| 4 | ZJ | 10.08 | −8.54 | −8.57 | 5.75 | −21.93 | −0.15 | 35.08 | 8.44 |
| AH | 45.26 | −5.32 | −7.76 | 11.50 | −12.28 | 4.26 | 48.67 | 6.20 | |
| FJ | 22.59 | −0.27 | −7.21 | 4.96 | 0.05 | −4.85 | 26.60 | 3.30 | |
| HN | −11.23 | −14.92 | −15.15 | −2.06 | −9.72 | −27.06 | 54.39 | 3.30 | |
| SAX | 23.74 | −29.20 | −7.56 | 4.62 | 3.80 | 19.12 | 30.45 | 2.52 | |
| Cluster 4’s mean | 18.09 | −11.65 | −9.25 | 4.95 | −8.02 | −1.74 | 39.04 | 4.75 | |
| 5 | JX | 23.41 | −1.98 | −0.68 | 0.03 | 0.82 | 1.12 | 22.52 | 1.58 |
| HB | 28.68 | −4.87 | 12.25 | −7.67 | 2.87 | −1.24 | 26.17 | 1.17 | |
| HN | 17.63 | 1.79 | 2.01 | −1.01 | −1.59 | −3.20 | 18.35 | 1.28 | |
| CQ | 8.16 | 0.03 | 1.40 | 1.47 | −5.77 | −1.10 | 10.78 | 1.37 | |
| GX | 44.41 | 7.18 | 16.87 | −17.20 | 15.22 | 6.06 | 14.17 | 2.10 | |
| GZ | 28.56 | 5.36 | 9.29 | −10.55 | 0.25 | −8.21 | 30.10 | 2.32 | |
| Cluster 5’s mean | 25.14 | 1.25 | 6.86 | −5.82 | 1.97 | −1.10 | 20.35 | 1.64 | |
Publisher’s Note: MDPI stays neutral with regard to jurisdictional claims in published maps and institutional affiliations. |
© 2022 by the authors. Licensee MDPI, Basel, Switzerland. This article is an open access article distributed under the terms and conditions of the Creative Commons Attribution (CC BY) license (https://creativecommons.org/licenses/by/4.0/).
Share and Cite
Li, Y.; Li, Y.; Huang, G.; Zheng, R. Inter-Provincial Electricity Trading and Its Effects on Carbon Emissions from the Power Industry. Energies 2022, 15, 3601. https://doi.org/10.3390/en15103601
Li Y, Li Y, Huang G, Zheng R. Inter-Provincial Electricity Trading and Its Effects on Carbon Emissions from the Power Industry. Energies. 2022; 15(10):3601. https://doi.org/10.3390/en15103601
Chicago/Turabian StyleLi, Yanfeng, Yongping Li, Guohe Huang, and Rubing Zheng. 2022. "Inter-Provincial Electricity Trading and Its Effects on Carbon Emissions from the Power Industry" Energies 15, no. 10: 3601. https://doi.org/10.3390/en15103601
APA StyleLi, Y., Li, Y., Huang, G., & Zheng, R. (2022). Inter-Provincial Electricity Trading and Its Effects on Carbon Emissions from the Power Industry. Energies, 15(10), 3601. https://doi.org/10.3390/en15103601