Article

Evaluation of Hierarchical, Multi-Agent, Community-Based, Local Energy Markets Based on Key Performance Indicators †

by
Godwin C. Okwuibe
1,2,*,
Amin Shokri Gazafroudi
2,
Sarah Hambridge
3,4,
Christopher Dietrich
3,4,
Ana Trbovich
3,4,
Miadreza Shafie-khah
5,
Peter Tzscheutschler
1 and
Thomas Hamacher
1
1
School of Engineering and Design, Technical University of Munich, Arcisstrasse 21, 80333 Munich, Germany
2
OLI Systems GmbH, Speyerer Strasse 90, 67376 Harthausen, Germany
3
Grid Singularity, Am Weinhang 9, 10965 Berlin, Germany
4
Grid Singularity, Unipessoal, Lda., Av. José Gomes Ferreira, 11-63 (Edificio Atlas II), Algés, 1495-39 Lisbon, Portugal
5
School of Technology and Innovations, University of Vaasa, 65200 Vaasa, Finland
*
Author to whom correspondence should be addressed.
This paper is an extended version of our paper published in 2021 International Conference on Smart Energy Systems and Technologies (SEST), Vaasa, Finland, 6–8 September 2021; pp. 1–6.
Energies 2022, 15(10), 3575; https://doi.org/10.3390/en15103575
Submission received: 14 April 2022 / Revised: 5 May 2022 / Accepted: 11 May 2022 / Published: 13 May 2022
(This article belongs to the Special Issue Optimal Scheduling of Flexible Resources in Modern Energy Markets)

Abstract

:
In recent years, local energy markets (LEMs) have been introduced to empower end-customers within energy communities at the distribution level of the power system, in order to be able to trade their energy locally in a competitive and fair environment. However, there is still some challenge with regard to the most efficient approach in organising the LEMs for the electricity exchange between consumers and prosumers while ensuring that they are responsible for their electricity-related choices, and concerning which LEM model is suitable for which prosumer or consumer type. This paper presents a hierarchical model for the organisation of agent-based local energy markets. According to the proposed model, prosumers and consumers are enabled to transact electricity within the local energy community and with the grid in a coordinated manner to ensure technical and economic benefits for the LEM’s agents. The model is implemented in a software tool called Grid Singularity Exchange (GSyE), and it is verified in a real German energy community case study. The simulation results demonstrate that trading electricity within the LEM offers economic and technical benefits compared to transacting with the up-stream grid. This can further lead to the decarbonization of the power system sector. Furthermore, we propose two models for LEMs consisting of multi-layer and single-layer hierarchical agent-based structures. According to our study, the multi-layer hierarchical model is more profitable for household prosumers as compared to trading within the single-layer hierarchical LEM. However, the single-layer LEM is more be beneficial for industrial prosumers.

1. Introduction

1.1. Motivation and Literature Review

Electricity markets aim to manage the increasingly complex power system and ensure that all the electricity generated within the electricity grid is accounted and paid for by the consumers. In recent years, the fast growth of distributed energy resources (DER), while supporting the energy transition, also added a high level of complexity in maintaining the power grid’s reliability and stability. This daunting challenge cannot be resolved by the conventional top-down, centralized energy management approach due to the system complexity and variable nature of renewable generation [1]. As a solution, local energy markets (LEMs) have been introduced as new trading structures for the exchange of energy between prosumers and consumers at the distribution level of the power system, thus keeping the system cost and customer electricity prices relatively feasible and ensuring that electricity is consumed close to where it is produced. Authors in [2] defined LEMs as platforms for trading among prosumers and consumers within a geographic and social neighbourhood, in which the security of supply is ensured by superimposing the LEM into the up-stream grid. In addition, LEMs provide an enabling platform for energy participants to trade their services such as electricity, flexibility, and heat at the distribution level in a competitive and economically efficient way [3]. In the literature, several structures have been proposed for energy trading and sharing in LEMs, such as the peer-to-peer (P2P), community-based or pool market, and hybrid frameworks [4,5,6,7], which are explained in the following.
In the P2P framework, a prosumer has the opportunity to choose the energy product by assigning attributes of the actors whom they are willing to sell their energy production to or buy their demand from. In a situation where prosumers are unable to provide the attributes of their proposed trading partners, they are randomly matched [8]. Additionally, the concept of federated power plants based on self-organised P2P incentives for organising the DER through a bottom-up grid approach was proposed by [9]. The proposed concept promised to reduce the economic, social, and institutional challenges facing the traditional top-down power system approach. Authors of [10] proposed a multi-agent architecture for P2P electricity trading within micro-grids (MGs) that is based on blockchain technology. In [11], the authors proposed a P2P energy market platform based on a multi-class energy management system for coordinating energy trading between prosumers, distribution grid and in the wholesale market. The multi-class model added financial, social, philanthropic, and environmental values by accounting for the individual prosumer’s preferences for their generated electricity. The P2P electricity trading platform for matching producer and consumer agents based on a two-sided market matching theory was proposed by [12]. The proposed platform was profitable and most suitable for aggregators managing prosumers with different degrees of willingness to buy or sell electricity. The authors of [13] proposed an agent-based simulation framework and evaluation index to compare the performance of P2P sharing market mechanisms.
On the other hand, a community-based local trading framework is generally defined as a centralized platform responsible for matching energy producers and consumers in the LEM with the use of an agreed market matching mechanism [5]. Optimization models (such as linear programming, mixed-integer linear programming, nonlinear programming, and mixed-integer nonlinear programming), mathematical methods (such as simplex method, branch-and-bound technique, quadratic programming, interior-point method, game theory, point estimate method, and fuzzy logic), and heuristic methods (e.g., particle swarm optimization algorithm and genetic algorithm) are used in the literature to organise trades in a community-based LEM [14,15,16,17]. The authors of [18] proposed an iterative algorithm for energy transactions between distribution network operators and the LEM’s participants in order to provide additional profit to all participants. The authors of [19] implemented the uniform pricing, pay-as-bid, generalized second-price, and Vickrey–Clark–Groves clearing methods and evaluated the benefits and the efficiencies of the mechanisms. In [20], the authors suggested that the bidding strategy of the LEM participants have more impact on the performance of community-based LEMs as compared to increasing the production-to-consumption ratio of the local community. In [21], the authors proposed the advantages of a hierarchical approach for energy and flexibility trading in the LEM considering distribution network constraints and the offering/bidding strategies of prosumers.
According to [7], a hybrid LEM is a type of market that combines the attributes of both P2P and community-based trading frameworks. In their work, the authors of [5] derived the mathematical formulation of a hybrid market framework as a combination of the P2P and community-based market frameworks. A hybrid market framework based on a decentralized blockchain was proposed by [22] for exchanging energy among local electricity traders within a distribution grid. Decentralized energy management offers a wide range of options for prosumers to exchange their electricity product/demand and can also provide a higher level of transparency. Apart from the proposed LEM models found in the literature, there are also software tools supporting the operation and implementation of LEMs. Most of these tools are still in the research and development stage but are approaching market readiness [4,5,23].

1.2. Contributions and Organisation

Whilst there are several studies proposing different structures and models for LEMs, there is still a gap in the literature concerning the organisation of community-based LEMs by prosumers and consumers. This includes questions on which LEM models are suitable for different consumer and prosumer types and an analysis of the models’ behaviour using varied market-clearing mechanisms. Consequently, in this paper, we focus on the following research question: which market structure and clearing mechanisms are most suitable for local electricity markets? In order to answer this, we propose mathematical models for the multi-layer and single-layer hierarchical organisation of agent-based local energy markets implemented on an interface and open-source code base of the Grid Singularity Exchange (GSyE, previously termed D3A) in order to model, simulate, and optimize energy trading in local communities. Furthermore, we evaluate the model using key performance indicators such as self-sufficiency, self-consumption ratio, share of market savings, and share of individual savings to analyse the model that is suitable for different types of consumers and prosumers. The prosumers and consumers are classified as household consumers, industrial consumers, commercial consumers, household prosumers, commercial prosumers, and industrial prosumers. Notably, this paper is an extended version of [24], where authors compared different market clearing mechanisms such as the one-sided pay-as-offer, the two-sided pay-as-bid, and the two-sided pay-as-clear market clearing mechanisms, and then showed the advantages of each clearing mechanism in a single-layer local electricity market. All in all, the main contributions of the paper can be summarized as follows:
  • We propose a mathematical model for the hierarchical organisation of agent-based local energy markets.
  • We implement the proposed hierarchical model in the Grid Singularity Exchange as an open-source code base software tool and show how it can be used for local electricity exchange.
  • We analyse the benefits of electricity trading in hierarchical local energy markets with the use of key performance indicators for different market structures, market-clearing mechanisms, and different consumer and prosumer types.
The remaining sections of this work are structured as follows. The proposed LEM architecture, exchange agent, and bidding strategies are described in Section 2. The LEM data, community setup, and price components are discussed in Section 3. Section 4 presents the results of our case studies and discusses the findings in details. Finally, the paper is concluded in Section 5.

2. Proposed Hierarchical, Community-Based Local Energy Market Structure
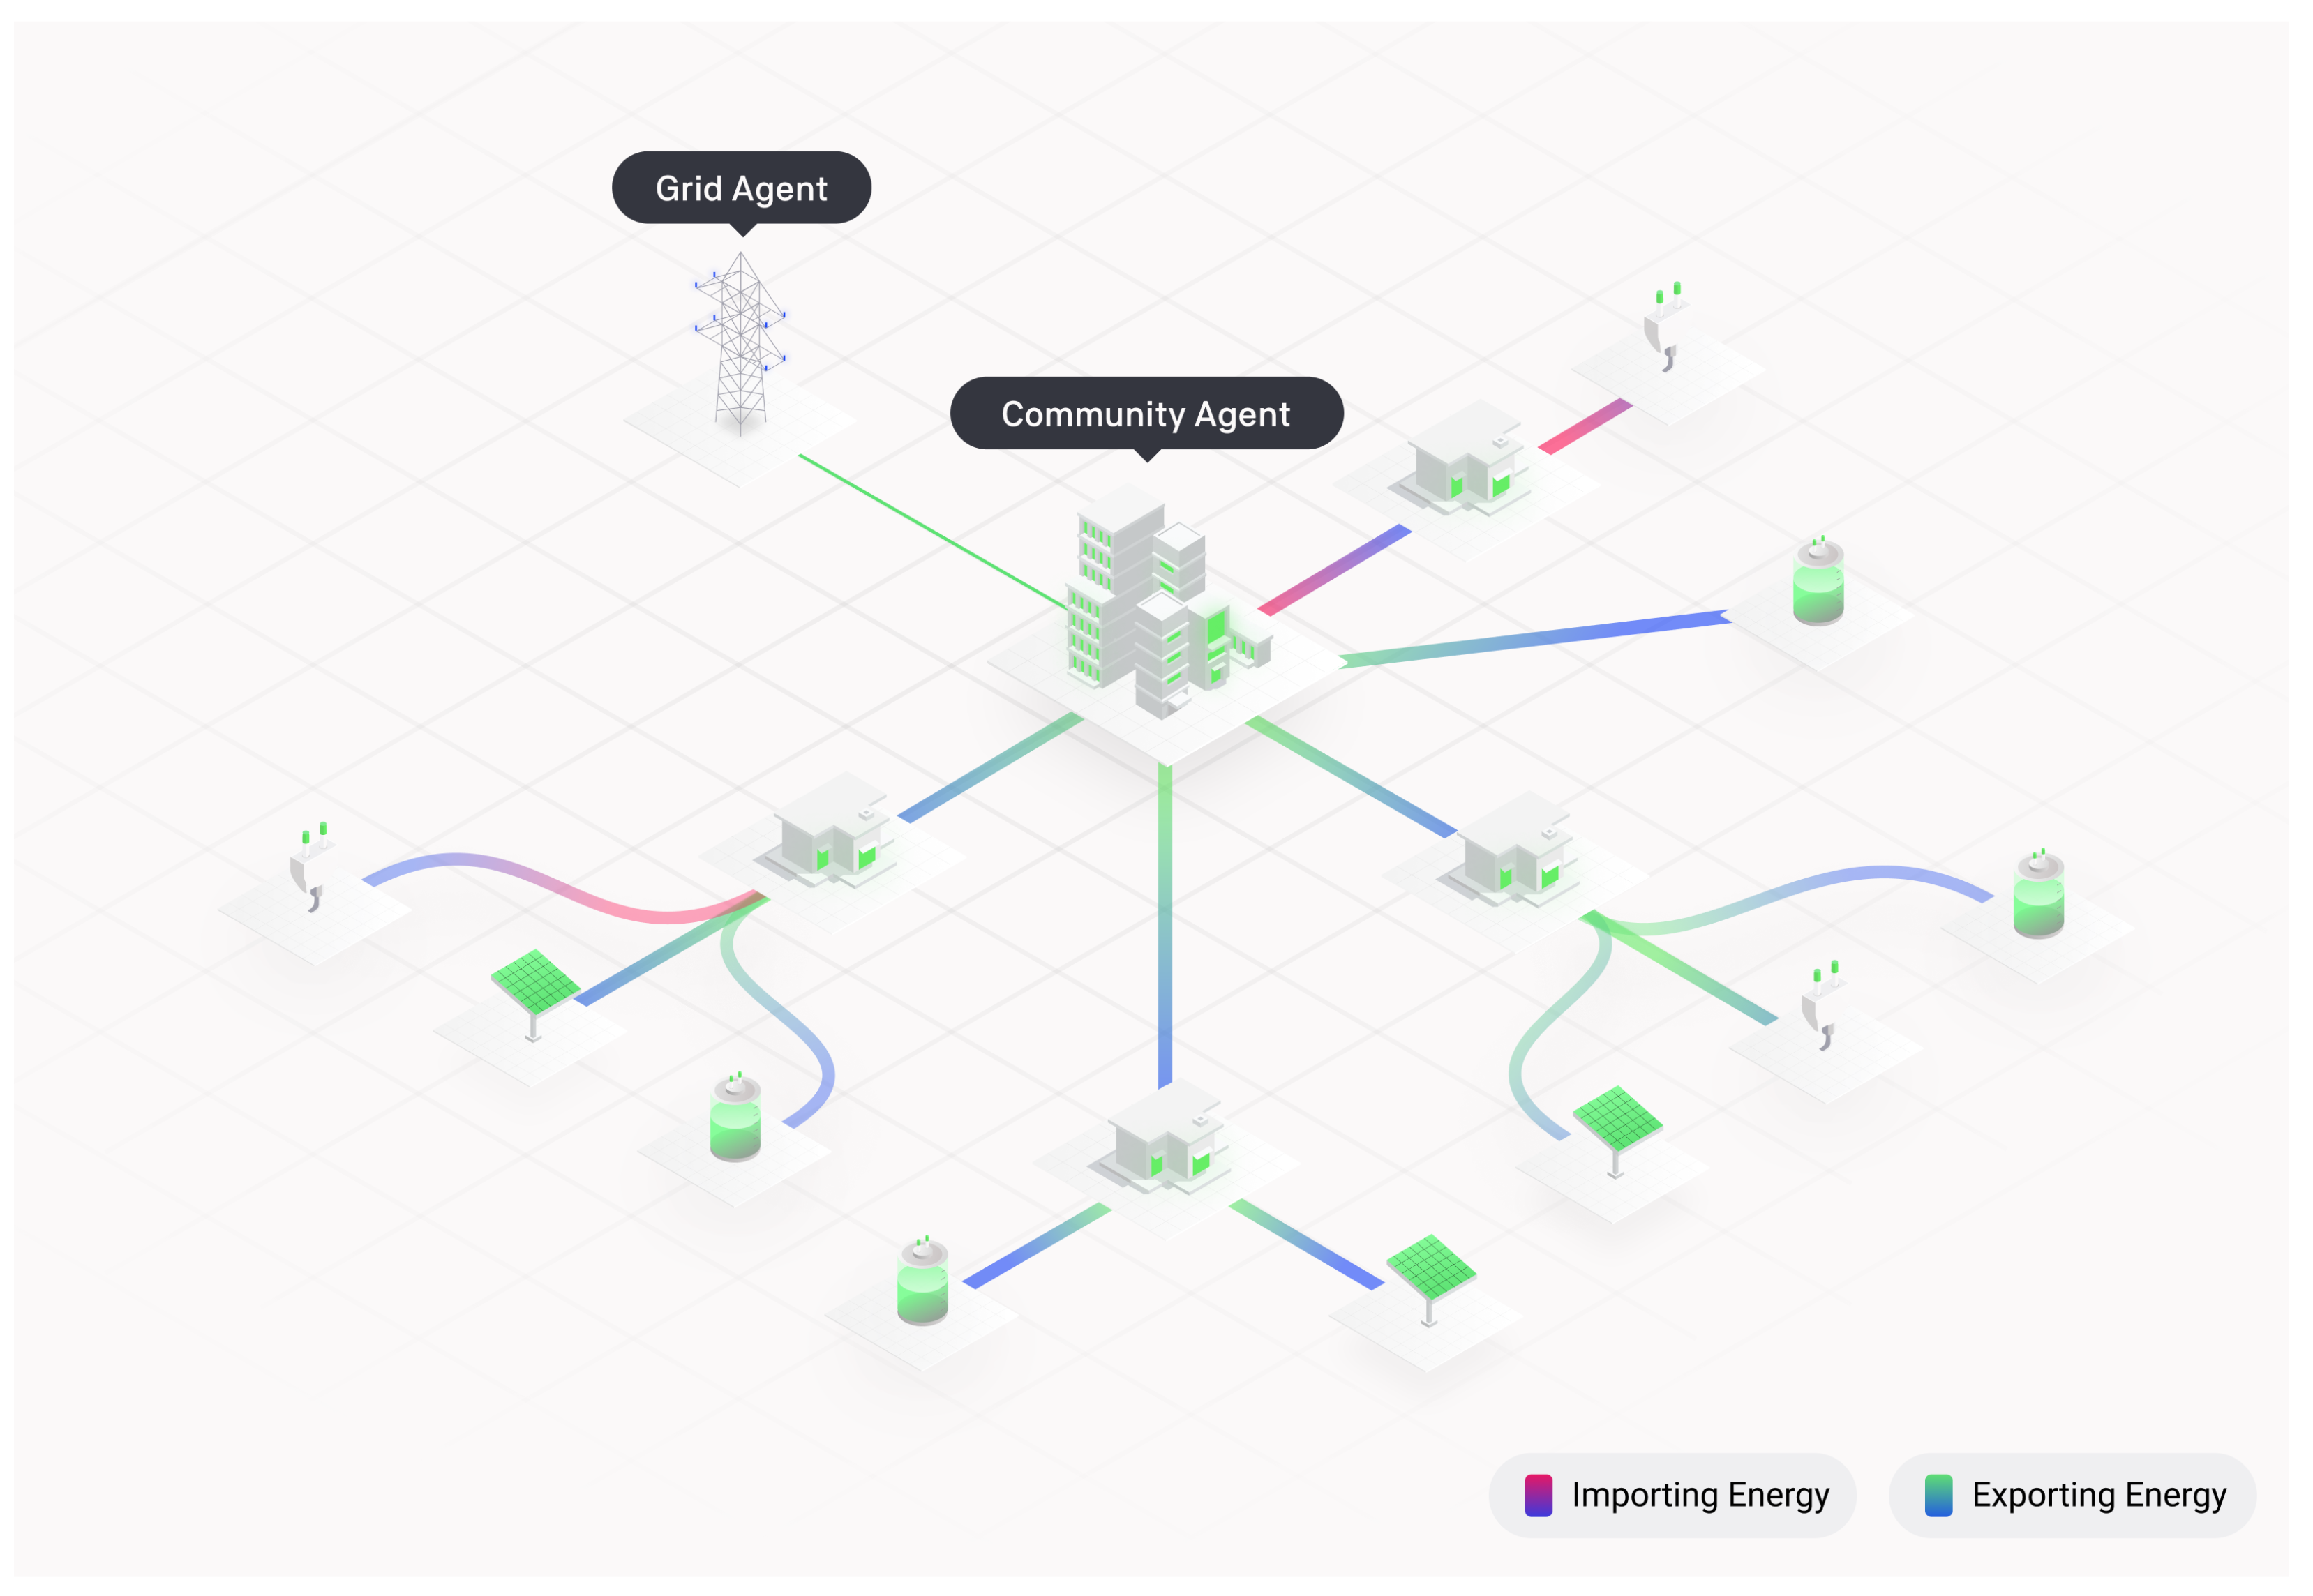
In this section, the proposed community-based LEM structure, its actors, the mathematical model as well as the offering/bidding and matching strategies are explained. In our proposed model, the smart grid architecture’s function layer is used to evaluate the market trading infrastructure of the proposed LEM design based on [25]. Furthermore, the distribution grid constraints are not considered in our proposed LEM structure because of the lack of real data for the studied local energy community.

2.1. Agents

The agents of the proposed LEM design can be classified into physical and virtual agents. The physical agents can be the distribution system operator (DSO) and the LEM’s participants consisting of consumers, prosumers, and producers. The virtual agents include the exchange agent. Moreover, the LEM consists of external agents, the so-called retailer and grid agent, to enable transactions between the local community and the up-stream grid in case the LEM participants cannot transact electricity with the local community. The functions of the LEM’s agents are explained in the following:
  • The Local Market Operator (LMO) determines the market clearing (one-sided pay-as-offer, two-sided pay-as-bid, and two sided pay-as-clear) mechanism of the LEM and provides access to the LEM’s individual participants. The LMO is responsible for maintaining the LEM exchange agent. The LMO is also in charge of providing market clearing results and market statistics to the DSO, retailer, and the LEM participants.
  • LEM participants, also known as local electricity traders (LETs), are local agents who own loads, distributed energy resources, and energy storage systems that are empowered to transact in the LEM.
  • The DSO is in charge of maintaining the distribution grid and ensuring grid stability. Moreover, the DSO expresses the state of the distribution grid (e.g., grid-connected and islanded modes based on the interaction between the distribution network and the up-stream grid) as well as assigns static and dynamic grid charges per kWh for electricity traded between LEM participants. Moreover, the grid charges are the cost of maintaining the distribution grid, which is paid per kWh of electricity transacted within the local community; this is incorporated in the process of clearing bids and offers.
  • Retailers have a contract with LETs to provide them with continuous energy if they are unable to trade electricity with the LEM.
  • The grid agent or the up-stream grid agent acts as an external agent of the LEM, and the local community is able to trade electricity with that in the case of extra local production or consumption. Moreover, the grid agent is modelled as an infinite bus on the distribution grid.
  • The exchange agent is an open-source code based on Python and other programming tools; it was developed by Grid Singularity and is called the Grid Singularity Exchange [26]. The exchange agent is responsible for receiving bids and offers, matching the orders, and sending the matched results to LETs, retailers, and the DSO. In the exchange agent, physical agents are defined as those who serve as digital twins for electricity assets such as PVs, electrical loads, and energy storage systems. In addition to electricity asset agents, there are grid and virtual organisation-based agents, including the household, block, sub-community, and community agents in the hierarchy. Thus, the virtual community agents are responsible for energy transactions and forwarding unmatched bids and offers from a lower level to a higher level in the hierarchy. Finally, the grid agent provides the LEM with the external retail electricity price for allowing energy transaction with the up-stream grid.

2.2. Hierarchical Structure for Electricity Trading in the LEM

Figure 1 shows a simple hierarchical structure of agents within the multi-agent framework. To describe the mathematical model for the physical and virtual agents, we consider load, PV, and storage devices in a local community k that participate in local electricity trading. The load, PV, and storage agents can be represented by ( L k ), ( P k ), and ( E k ), respectively. If H k represents the agent of the community k, then we have the following:
{ P k L k E k } H k .
If community k is a sub-community of community i with a set of other sub-communities, and the total number of sub-communities of community i is N, then we have:
{ H 1 H 2 H N } A i ,
where A i represents the agent of community i, and H 1 , H 2 , …, H N represent the agents of sub-communities 1 to N, respectively. Furthermore, if community i is a sub-community of community j, and there exist other sub-communities within community j and an energy storage device belonging to community j, the total number of sub-communities belonging to community j is M, and the ESS agent of the community j storage system is represented by ( E j ). Then, we have the following:
{ E j A 1 A 2 A M } R j ,
where R j is the agent of community i. Finally, from (3), a community agent is defined as a virtual agent that can consist of other agents of communities or sub-communities, and agents representing physical assets within the community. This way, the community agent creates a hierarchical organisation of agents belonging to its own local area. Section 2.3 describes the setup of the hierarchical model, and how bids and offers are forwarded by the community agents.

2.3. Hierarchical Bids and Offers Forwarding

In this paper, the analysed market clearing mechanisms in the exchange agent are the two-sided pay-as-bid (TPB) and the two-sided pay-as-clear (TPC) mechanisms. The LEM serving as a case study is a real-time market, set to 15 min time slots. Agents submit their bids and offers within the 15 min interval before the energy exchange time. Each time slot, T s l o t , is divided into 15 s tick lengths, T t i c k , as represented by (4):
N t i c k = T s l o t T t i c k ,
where N t i c k is the number of ticks per time slot. Depending on the type of market clearing mechanism, the tick length is the time before market clearing is triggered within the platform. According to the proposed LEM design, physical agents first submit their bids and offers directly to a local community in the first hierarchy. The first local community hierarchy level of the studied model is a block, the next level is a zone, and the final level is a community called the higher community. Assuming that the area of the first local community hierarchy is i, the set of bids in the community i from different physical agents at tick t is represented by B i , t , and the set of offers of physical agents from the same community at tick t is represented by S i , t . As the market has N t i c k number of ticks, physical agents are able to submit their bids and offers at any tick. The set of bids submitted to community i at tick t is represented by the following:
B i , t = { b i , 1 , t , b i , 2 , t , , b i , n , t } , t < N t i c k ,
where n is the total number of bids (physical agents) in community i at tick t. In other words, physical agent n is allowed to submit only one bid to the local community at tick t. b i , n , t is bid n of the bids in community i at tick t. Each bid ( b i , n , t ) contains the quantity of energy ( q i , n , t b ) that the agent wishes to buy and the maximum price ( p i , n , t b ) per kWh of electricity that the agent is willing to pay for, as shown in (6):
b i , n , t = ( q i , n , t b , p i , n , t b ) , t < N t i c k ,
In the same way, the set of offers submitted to community i at tick t is represented by the following:
S i , t = { s i , 1 , t , s i , 2 , t , , s i , m , t } , t < N t i c k ,
where m is the total number of offers (physical agents) in community i at tick t. Physical agent m is allowed to submit only one offer to the local community at tick t. s i , m , t is the offer m in community i at tick t. Each offer contains the quantity of energy ( q i , m , t s ) that the agent wishes to sell and the minimum price ( p i , m , t s ) per kWh of electricity that the agent is willing to receive, as represented by (8):
s i , m , t = ( q i , m , t s , p i , m , t s ) , t < N t i c k .
The set of all bids and offers submitted to community i at tick t is the union of the set of bids and offers from (5) and (7), respectively. This is presented by the following equation:
{ B i , t S i , t } = { ( q i , 1 , t b , p i , 1 , t b ) , ( q i , 1 , t s , p i , 1 , t s ) , ( q i , 2 , t b , p i , 2 , t b ) , ( q i , 2 , t s , p i , 2 , t s ) , , ( q i , n , t b , p i , n , t b ) , ( q i , m , t s , p i , m , t s ) }
Thus, Equation (9) can be simplified into (10).
{ B i , t S i , t } = { O i , 1 , t , O i , 2 , t , , O i , ( m + n ) , t } ,
where O i , ( m + n ) , t is defined as the ( m + n ) th order submitted to community i at tick t. This order can be a bid or an offer to buy or sell a defined quantity of energy at a maximum/minimum price limit in ct/kWh. The LEM is cleared at the end of every tick. Hence, the matched bids and offers at the end of tick t is represented in the following equation:
{ B i , t Π S i , t } = { O ̲ i , 1 , t , O ̲ i , 2 , t , , O ̲ i , y , t } , y n , m ,
where O ̲ i , y , t is the yth match order at tick t containing the match quantity ( q ̲ i , y , t ), price ( p ̲ i , y , t ), identity of buyer ( I b ), and identity of seller ( I s ), as represented by (12):
O ̲ i , y , t = ( q ̲ i , y , t , p ̲ i , y , t , I b , I s ) , y n , m .
At same time, the unmatched bids and offers are represented by the set containing the difference between all submitted orders and the matched orders, as expressed in (13):
{ B ¯ i , t S ¯ i , t } = { ( B i , t S i , t ) ( B i , t Π S i , t ) }
Equation (14) expresses the unmatched orders for d number of orders.
{ B ¯ i , t S ¯ i , t } = { O ¯ i , 1 , t , O ¯ i , 2 , t , , O ¯ i , d , t } , d ( n + m ) y .
Similar to Equation (9), for an f number of unmatched bids and an h number of unmatched offers, Equation (14) can be re-expressed in terms of bid and offer quantities and prices, as presented in (15):
{ B ¯ i , t S ¯ i , t } = { ( q ¯ i , 1 , t b , p ¯ i , 1 , t b ) , ( q ¯ i , 1 , t s , p ¯ i , 1 , t s ) , ( q ¯ i , 2 , t b , p ¯ i , 2 , t b ) , ( q ¯ i , 2 , t s , p ¯ i , 2 , t s ) , , ( q ¯ i , f , t b , p ¯ i , f , t b ) , ( q ¯ i , h , t s , p ¯ i , h , t s ) } , d = f + h .
Suppose community i is a sub-community of community j. The market is modelled such that the agent of community i ( A i ) will forward the unmatched bids and offers of community i to community j after two ticks. Similar to (9), the bids and offers of community j for n and m numbers of bids and offers, respectively, at the ( t + 2 )th tick is given by the following equation:
{ B j , ( t + 2 ) S j , ( t + 2 ) } = { ( q j , 1 , ( t + 2 ) b , p j , 1 , ( t + 2 ) b ) , ( q j , 1 , ( t + 2 ) s , p j , 1 , ( t + 2 ) s ) , ( q j , 2 , ( t + 2 ) b , p j , 2 , ( t + 2 ) b ) , ( q j , 2 , ( t + 2 ) s , p j , 2 , ( t + 2 ) s ) , , ( q j , n , ( t + 2 ) b , p j , n , ( t + 2 ) b ) , ( q j , m , ( t + 2 ) s , p j , m , ( t + 2 ) s ) } , ( t + 2 ) < N t i c k .
Since community j is a large community with many other sub-communities, (16) can be expressed in terms of the orders from different sub-communities. If there are w sub-communities in community j, (16) can be expressed as follows:
{ B j , ( t + 2 ) S j , ( t + 2 ) } = { ( B 1 , ( t + 2 ) S 1 , ( t + 2 ) ) , ( B 2 , ( t + 2 ) S 2 , ( t + 2 ) ) , , ( B w , ( t + 2 ) S w , ( t + 2 ) ) }
where ( B w , ( t + 2 ) S w , ( t + 2 ) ) is a set containing the bids and offers submitted to community j by the agent of community w, A w at tick ( t + 2 ) . Since i is a sub-community within community j, we have the following equation:
{ B i , ( t + 2 ) S i , ( t + 2 ) } { ( B 1 , ( t + 2 ) S 1 , ( t + 2 ) ) , ( B 2 , ( t + 2 ) S 2 , ( t + 2 ) ) , , ( B w , ( t + 2 ) S w , ( t + 2 ) ) } .
Hence, the orders submitted to community j by virtual agent ( A i ), which represent the sub-community i that exists in community j at the ( t + 2 )th tick is as follows:
{ B i , ( t + 2 ) S i , ( t + 2 ) } = { ( q ¯ i , 1 , t b , p ¯ i , 1 , t b G j ) , ( q ¯ i , 1 , t s , p ¯ i , 1 , t s ) , ( q ¯ i , 2 , t b , p ¯ i , 2 , t b G j ) , ( q ¯ i , 2 , t s , p ¯ i , 2 , t s ) , , ( q ¯ i , f , t b , p ¯ i , f , t b G j ) , ( q ¯ i , h , t s , p ¯ i , h , t s ) } ,
where G j is the grid fee for local community j at the simulation time slot. Comparing Equations (15), (16), and (19), we obtain the following:
{ B ¯ i , t S ¯ i , t } { B j , ( t + 2 ) S j , ( t + 2 ) } , L i L j .
In this way, bids and offers are forwarded from a lower community or area hierarchy to a higher one. This forwarding of bids from lower to higher hierarchies happens as far as t < N t i c k and for all lower communities whose local area ( L i ) is contained in the local area of the higher community ( L j ). At t = N t i c k , the remaining electricity quantity is traded with the up-stream grid at the grid price. Hence, for our case study, where we have three community hierarchies (blocks, zones, and higher communities), the reason for the 15 s tick length is to ensure that even the bids/offers submitted at the last minute of the 15 min market slot is forwarded in order to reach the up-stream grid agent if not traded within the LEM.

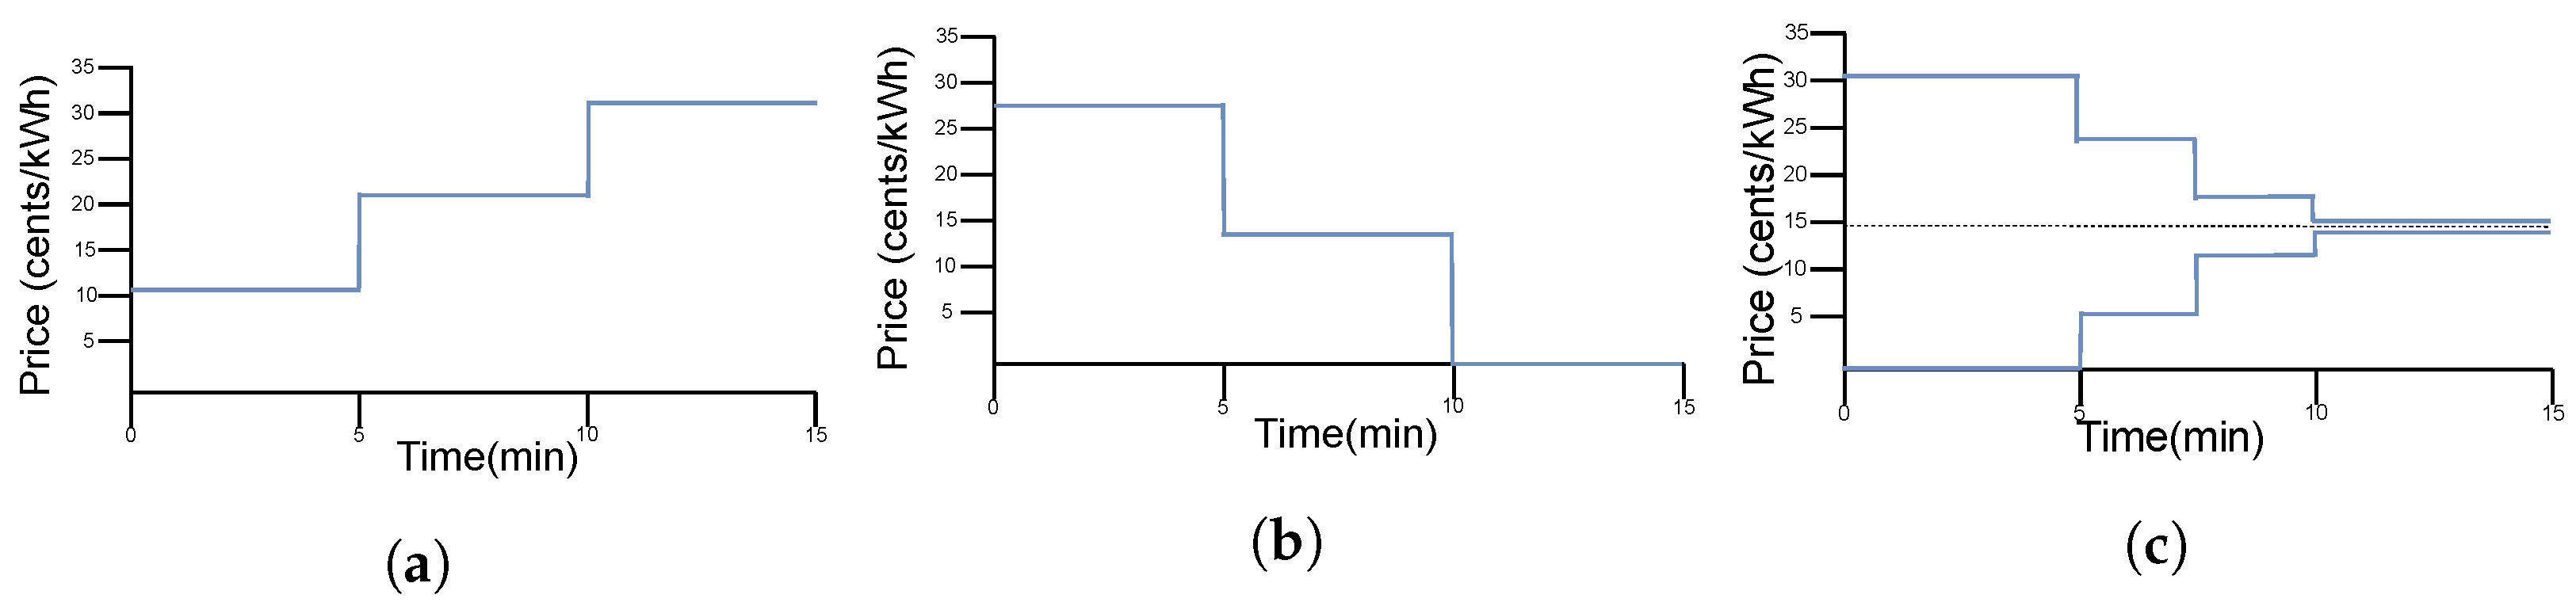
2.4. Trading Strategies for Physical Agents

The update interval is defined as how often an agent updates its bid and offer prices using the interval trading strategy. In the exchange agent, an interval-based trading strategy is defined for each physical agent, which is described in the following section.

2.4.1. EL Agents

The consumer defines the minimum and maximum rate at which they are willing to buy electricity. Equation (21) defines the algorithm for the load interval bidding strategy.
Δ r b = ( r b , f r b , i ) ( T s T i ) × T i ,
The final and initial buying rate are r s , f and r s , i , respectively. T s and T i represent the slot length and the update interval. The EL agent tries to buy electricity first at the lowest rate defined by the consumer. After a defined simulation update interval, the buying rate is increased by Δ r b if the trade is unsuccessful or partially successful. As represented in (21), the buy price is increased continuously after every update interval until all the electricity demands are provided, or until the defined maximum rate is reached, as shown in Figure 2a.

2.4.2. EP Agents

Just as the EL agent, the initial and final trade rates are defined for the EP agents. However, the EP agents first try to sell their electricity at the maximum rate. This maximum rate is known as the initial selling rate. After every update interval, the selling rate is reduced by Δ r s based on Equation (22) if the energy quantity produced by the EP is not matched or just partially matched.
Δ r s = ( r s , i r s , f ) ( T s T i ) × T i ,
where r s , i and r s , f represent the initial and final selling rates of the EP, respectively. The reduction in the EP’s selling rate continues until all the EP electricity generation is sold or the defined minimum rate is reached, as shown in Figure 2b.

2.4.3. ESS Agents

The ESS agent trading strategy is a combination of the EL and EP trading strategies, with a defined boundary for the entire range of electricity rates, as shown in Figure 2c. Hence, the ESS agent trading rate is split into the upper and lower price ranges. The upper and lower price ranges are the selling and buying price ranges, respectively. ESS agents submit two orders to the exchange at each market slot that contain a bid and an offer. The bid price is determined using the lower price range and the load bidding strategy after each update interval. Simultaneously, the offer price is determined using the upper price range. This simple strategy is used by the ESS to buy energy at a cheaper rate and sell to the community at a higher one. However, in the local community, the cost of buying electricity from the ESS is always cheaper compared to buying it from the up-stream grid.

2.5. Performance Indicators

LEM performance indicators are parameters used to access the performance of an LEM. The LEM key performance indicators we used to evaluate our model are the share of individual savings, community self-sufficiency, and the self-consumption ratio. An additional performance indicator, known as the P2P closeness index, was also used to analyse our model. The performance indicators are defined as follows:
Share of individual savings: The share of individual savings (SIS) is the percentage of savings made by an individual prosumer or consumer for trading in the LEM as compared to trading without the LEM [20]. SIS is presented in (23), where Π j , t and Π j , t * are the net costs for trading electricity without and with the LEM, respectively, for agent j at time t.
S I S j = t ( Π j , t Π j , t * ) t Π j , t × 100 ,
Community self-sufficiency: Community self-sufficiency (SS) is the percentage of electricity demanded by the local community agents that is produced within the community, as defined in [27]. The community SS is expressed by (24), where E j , i , t is the amount of energy traded between EP agent j and EL agent i at time t.
S S = j ( j i ) , i , t ( E j , i , t + | L j t P j t e p | ) j , t L j t × 100
Community share of market savings: Community share of market savings (SMS) is the sum of the shares of individual savings made by each local agent for trading within the LEM as compared to trading without the LEM [27]. The community SMS is represented in (25).
S M S = j , t ( Π j , t Π j , t * ) j , t Π j , t × 100 ,
P2P closeness index: The P2P closeness index is defined for the first time in this paper and provides information on how the total electricity exchanged within a community is geographically close, from the source of production to the point of consumption. It gives information on how close the electricity consumer is to the producer within a community where both actors exchange electricity. Equation (26) represents the P2P closeness index ( C I ):
C I = j ( j i ) , i , t E j , i , t × R f j ( j i ) , i , t E j , i , t × 100 ,
where R f is the trade index and is in the range of [0, 1] ( 0 R f 1 ), depending on how far the prosumer is from the consumer. This means that the closer the prosumer is to the consumer, the higher the trade index. Table 1 displays the trade index for different combinations of the buyers and sellers’ geographic location.

3. Simulation Setup

In this paper, several simulation scenarios are considered through different market clearing mechanisms by varying the community production-to-consumption ratio (PtC) and the number of hierarchies per local electricity market setup. To assess the performance of the hierarchical market model, we analysed the impact of different market models on an LEM. In this way, single-layer and multi-layer, hierarchical, agent-based local energy markets are studied utilising market key performance indicators to determine the most beneficial model for the LEM. The data and price components of the different simulation scenarios are described in the following sections.

3.1. Data Description

The LEM was simulated during a period of one week, with 120 LETs consisting of 68 household consumers, 4 commercial consumers, 7 commercial prosumers, 6 industrial prosumers, and 35 household prosumers in 28 simulation scenarios created by changing the combination of market clearing mechanisms, the number of hierarchy levels, and the annual PtC ratio. The load profile was a combination of profiles from [28], LoadProfile-Generator [29,30], and standard load profiles [31,32]. The varying factors, while using the LoadProfileGenerator software, were the number of occupants in each apartment, the work schedule of the occupants, types of household appliances, and age group of the occupants. The Stuttgart region was used for all the profiles. The commercial and industrial profiles used are standard load profiles from StromNetz Berlin for the year 2019 [31]. The annual consumption of the commercial profiles was between 25,000 kWh and 30,000 kWh, while for the industrial profiles, it was between 49,000 kWh and 54,500 kWh. A random error in the range of 5–30% was added to each time step of every commercial and industrial profile to ensure the uniqueness of the data for each LET. The PV production profiles were based on Ref. [33] using Renewables Ninja [34] for the Stuttgart region. The losses of the PV systems were varied between 5% and 15%. All the profiles were generated with a tilt angle of 35 of the PV. In the setup file, 14 households and one commercial prosumer were equipped with battery storage, with capacities ranging between 7.5 kWh and 13.5 kWh and maximum absolute power between 3.5 kW and 5.25 kW. Additionally, two community storage systems with a capacity of 140 kWh and 120 kWh and a maximum power of 40 kW were included in the local community. All storage systems had a minimum allowed state of charge of 10%.

3.2. Price Components

Two community configurations, namely single and multi-layer, hierarchical, agent-based local communities, were evaluated using different market clearing mechanisms. For both community models, the large community (higher community) was classified into sub-communities called zones. The zones were further classified into blocks. Table 2 shows the hierarchical arrangement of the large community, sub-communities, zones, and blocks. The prosumer and consumer types consist of household (HH), commercial (CM), and industrial (IND) types. The HHS and CMS are household and commercial prosumers with storage systems, respectively. In addition, the households were randomly assigned to different blocks, and the blocks were randomly assigned to different zones. Moreover, blocks were considered as households in the same building, and none of the blocks had more than one commercial prosumer. Since industrial prosumers and consumers have higher capacities, they were also classified separately under the zones. Thus, none of the blocks had any industrial consumers/prosumers. As zones contain LETs that are close to each other, local grid fees for trades within a zone were half of the community local grid fee. Consequently, blocks contained LETs that belong to a building block (e.g., an apartment) and could trade electricity without using the external grid. For trades within a block (blk), consumers only paid for the metering fees and VAT in addition to the energy cost.
The price component for both LEM models is shown in Table 3. The price components for trading within the local community include the energy price of the electricity producer, metering fee, local grid fee, and a 19% value-added tax (VAT) [35]. The energy price is the amount of money (cents/kWh) that a producer will receive for feeding electricity into the LEM. The metering and the local grid fees are surcharges paid for maintaining the metering infrastructure and the local distribution grid, respectively. The value-added tax (VAT) is the 19% paid for buying electricity from the local community. This is usually 19% of the sum of the energy price, metering, local, and up-stream grid fees. An additional surcharge known as the up-stream fee is added if the electricity is traded with the up-stream grid.
The total energy price was capped at 31.5 cents/kWh, which was based on the average electricity cost in Germany [36]. For the single-layer community model, there were no sub-community agents, and therefore the local agents (device agents) were able to trade electricity directly in the local community based on the market clearing mechanism, as shown in Figure 3. The higher-community agent was responsible for coordinating this market, and the electricity not traded within the community was bought/sold from/to the external up-stream grid agent by the higher-community agent. However, for the multi-layer community model, each sub-community had its own sub-community agent responsible for coordinating the trade within the sub-community, as shown in Figure 4. Electricity not traded within the sub-community was forwarded to the higher hierarchy by the sub-community agent.

4. Results and Discussion

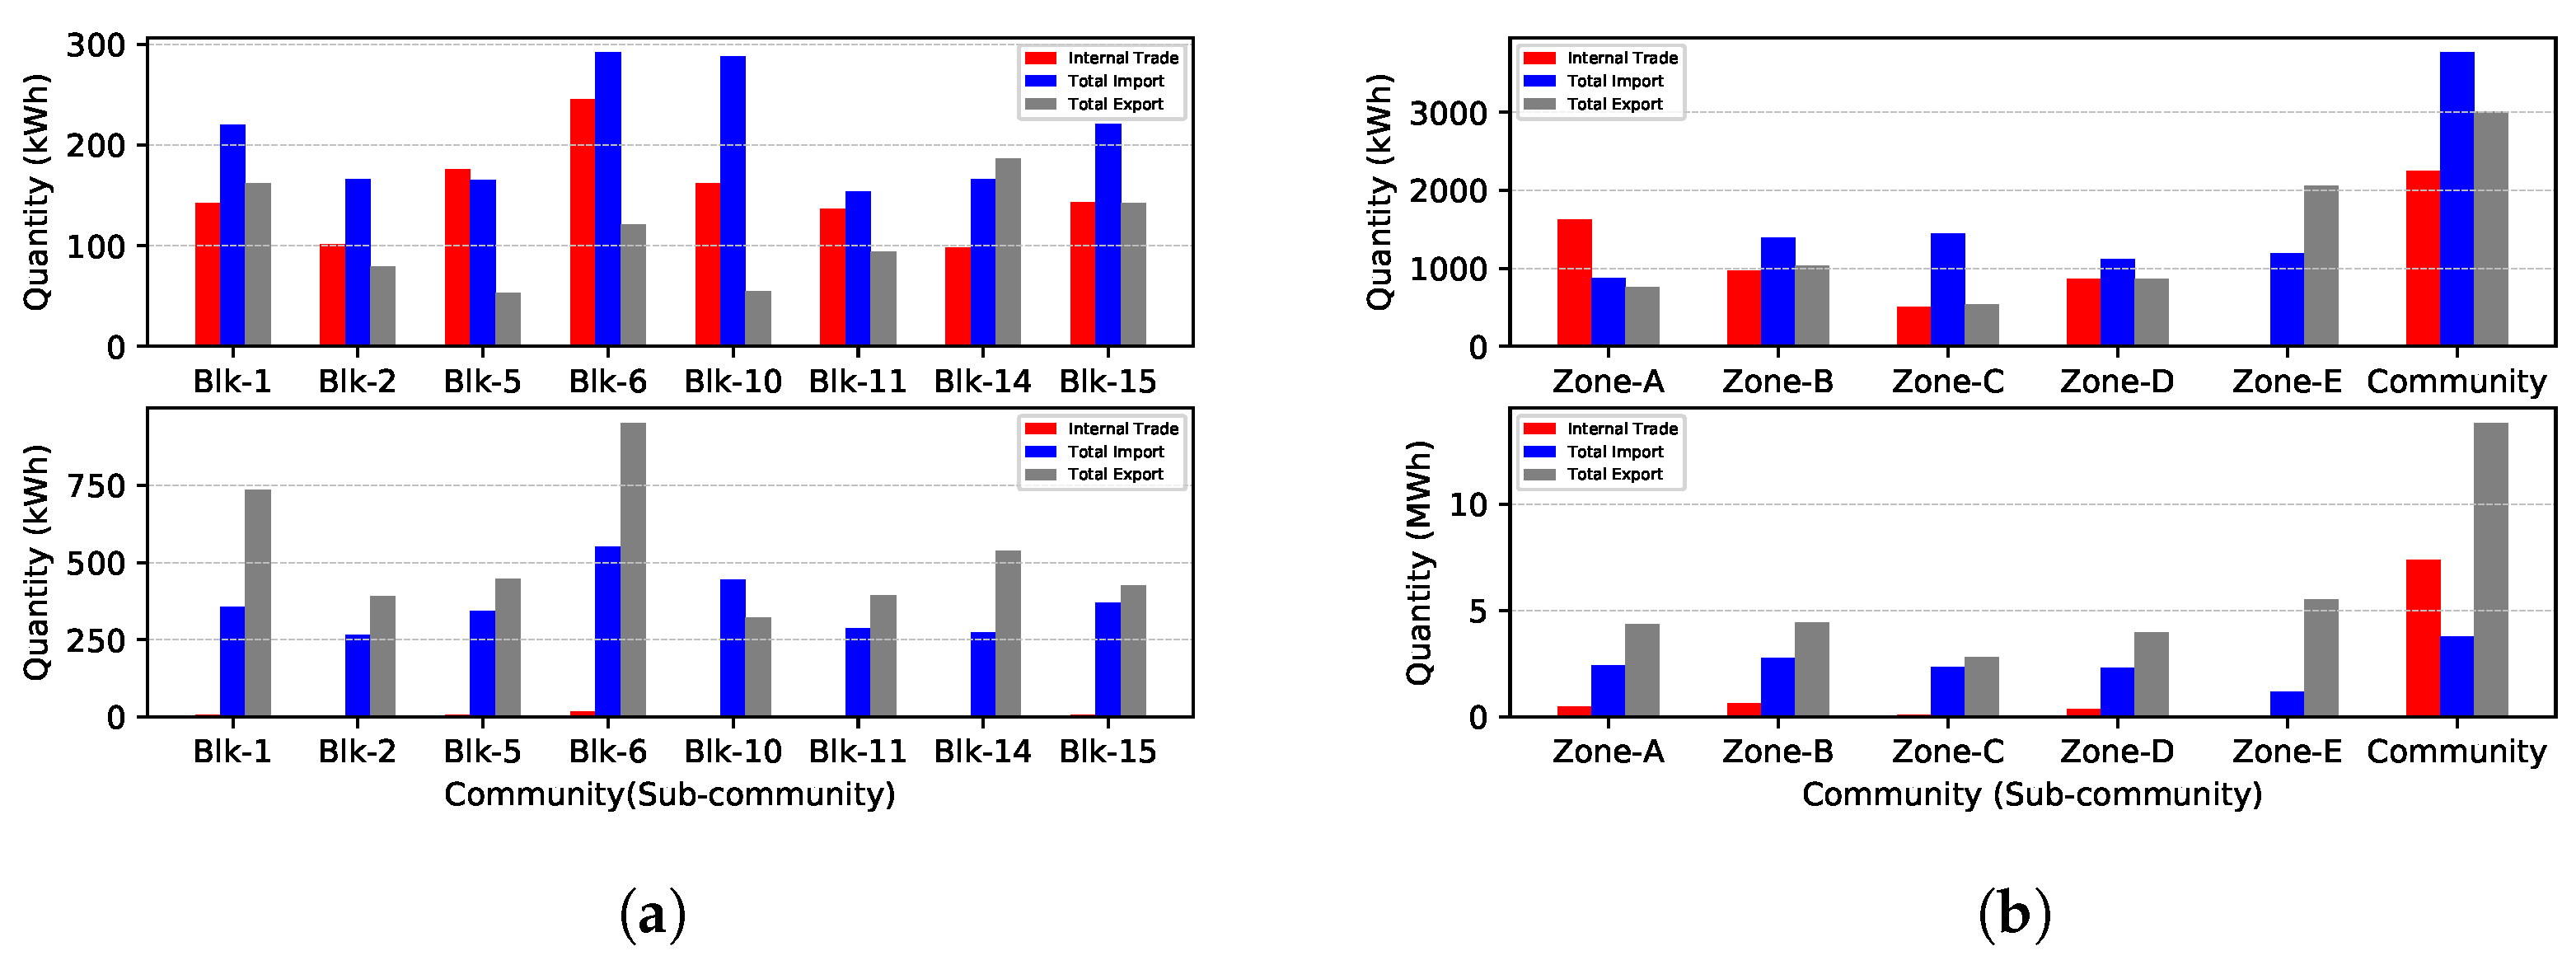
4.1. Energy Exchange per Community Block

In this section, the impact of different market models on local electricity trading is assessed. Figure 5a shows the energy exchange for selected community blocks with single-layer and multi-layer community setups using the two-sided, pay-as-bid market clearing mechanism. Internal trade is the energy traded between the device agents within a sub-community block. Total import is the total energy imported to a sub-community from the higher sub-communities, communities, and the up-stream grid. The sum of the energy exported to the higher sub-communities, communities, and up-stream grid from a sub-community is the total export of the sub-community. Comparing the higher and lower graphs of Figure 5a, it is evident that for all community blocks, internal trade is higher for the multi-layer as compared to the single-layer community. Furthermore, the total import and total export of the blocks are higher for the single-layer community as compared to the multi-layer community. Since the multi-layer community organises the market in a greater hierarchical form than the single-layer model, it ensures that local agents first trade electricity at the lowest sub-community level and forward only untraded energy to the higher communities. This results in higher levels of internal trade and in lower total import and total export for the multi-layer community as compared to the single-layer community.

4.2. Energy Exchange per Community Zone and Higher Community

Figure 5b displays the energy exchange of all the zones and higher communities with the single-layer and multi-layer community setups using the two-sided, pay-as-bid market clearing mechanism. The internal trade of a zone is the energy traded between the blocks and the device agents within a zone at the zonal level. In the same way, the internal trade of the higher community is the energy traded between the blocks, zones, and device agents within the higher community at the higher-community level. The total import of a zone is the total energy imported to the zone from the higher community and the up-stream grid. The total import of the higher community is the total energy imported to higher community from the up-stream grid. Moreover, the total export of a zone is the total energy exported to the higher community and the up-stream grid from the zone. The total export of the higher community is the total energy exported to the up-stream grid from the higher community. It is important to mention that all zones (from Zone-A to Zone-E) are sub-communities of the higher community.
The internal trade of all zones are higher for the multi-layer community compared to the single-layer community. Moreover, the total export and total import of each zone for the multi-layer community are lower compared to those of the single-layer community. Thus, it is evident that the multi-layer community coordinates the market trades better than the single-layer community. Furthermore, the total import of the higher community for the single-layer and the multi-layer communities is the same. This shows that both models only import energy that cannot be produced within the higher community from the up-stream grid. However, the internal trades of the higher community for the single-layer community is greater compared to the multi-layer community. Since the single-layer community is not coordinated, most of its trades take place at the higher-community level. This further results in higher internal trades and total export for the higher community within the single-layer community as compared to those of the multi-layer community.
Figure 6 shows further information on the electricity exchange for selected blocks and all the zones, including the higher community of the single-layer community. The external trades (external import and external export) of a community or sub-community are energy traded from the higher communities within the hierarchy and not from the up-stream grid. The external trades of the sub-community blocks and zones are higher compared to the internal trades. Hence, most of the trades for the single-layer community take place externally because the trades are not coordinated and thus happen randomly. The external trade of the higher community is zero because the higher community is the highest hierarchy of the LEM. Hence, any trade which is not made within the higher community is exchanged with the up-stream grid. Furthermore, the total import of the higher community is equal to its import from the grid (Imp4mGrid), and the total export of the higher community is equal to its export to the grid (Exp2grid).

4.3. Comparison of Single-Layer and Multi-Layer, Hierarchical Local Energy Market Models

In this section, the market models for singe-layer and multi-layer hierarchical LEMs are compared in terms of the share of individual savings, share of market savings, community self-sufficiency, self-consumption ratio, and average trade rate with varying market clearing mechanisms.

4.3.1. Share of Individual Savings

Figure 7a shows the SIS for selected households ( C 50 , C 36 , C 17 , and C 0 ) and commercial ( C 10 , C 13 , C 12 , and C 9 ) consumers for different market models. The SLEM + TPB is defined as a market model with a single-layer hierarchical model for local energy trading based on the two-sided, pay-as-bid (TPB) market clearing mechanism. In the same way, the MLEM + TPC represents a market model with a multi-layer hierarchical structure of the local transaction based on the two-sided, pay-as-clear (TPC) market clearing mechanism. The single-layer and multi-layer market models are described in Section 3.2. From Figure 7a, it is evident that the multi-layer model creates more SIS for both household and commercial consumers of the TPC and TPB market clearing mechanisms as compared to the single-layer model. This is because the multi-layer community provides an opportunity for the consumers to buy their electricity from prosumers in their neighbourhood at a cheaper price and thus avoid a certain percentage of grid fees, which provides opportunity for the consumers to save more as compared to trading with prosumers outside their neighbourhood. However, the SIS of the commercial consumers is higher compared to that of the household consumers. Since the commercial consumers trade a higher amount of electricity as compared to household consumers, their SIS is higher than that of the household consumers.
The SIS for selected industrial prosumers ( P 15 , P 11 , and P 19 ), household prosumers ( P 32 , P 21 , and P 41 ), and commercial prosumers ( P 6 and P 35 ) is displayed in Figure 7b for different market models. As seen in Figure 7b, changing from the single to the multi-layer community model increases the SIS of commercial and household prosumers. Similar to the case of consumers, trading with the multi-layer community provides the opportunity for the household and commercial prosumers to sell their electricity at a more beneficial price, which in turn creates additional SIS for the prosumers. On the other hand, changing from the single-layer to the mutli-layer LEM model decrease the SIS of the industrial prosumers ( P 15 , P 11 , and P 19 ), as shown in Figure 7b. This is because the industrial prosumers are not located within blocks, and most industrial prosumers are located in a separate zone due to their large capacity; hence, they are unable to take advantage of the multi-layer community. In other words, they are unable to benefit from selling their electricity at a rate that is better for consumers who are located in another zone. Furthermore, with a single-layer LEM model, all the local electricity traders compete directly with each other to trade electricity at the same hierarchical level. This provides the industrial prosumers with the opportunity to trade more of their electricity with consumers and prosumers who are not located within their zone at a more beneficial rate. This external electricity bought/sold from/to outside of the industrial prosumers’ zone (Zone-E) but not from the upstream-grid is known as external import/export (Figure 6). Thus, unlike the household and industrial prosumers, a single-layer LEM model is more beneficial to industrial prosumers as compared to the multi-layer LEM model.

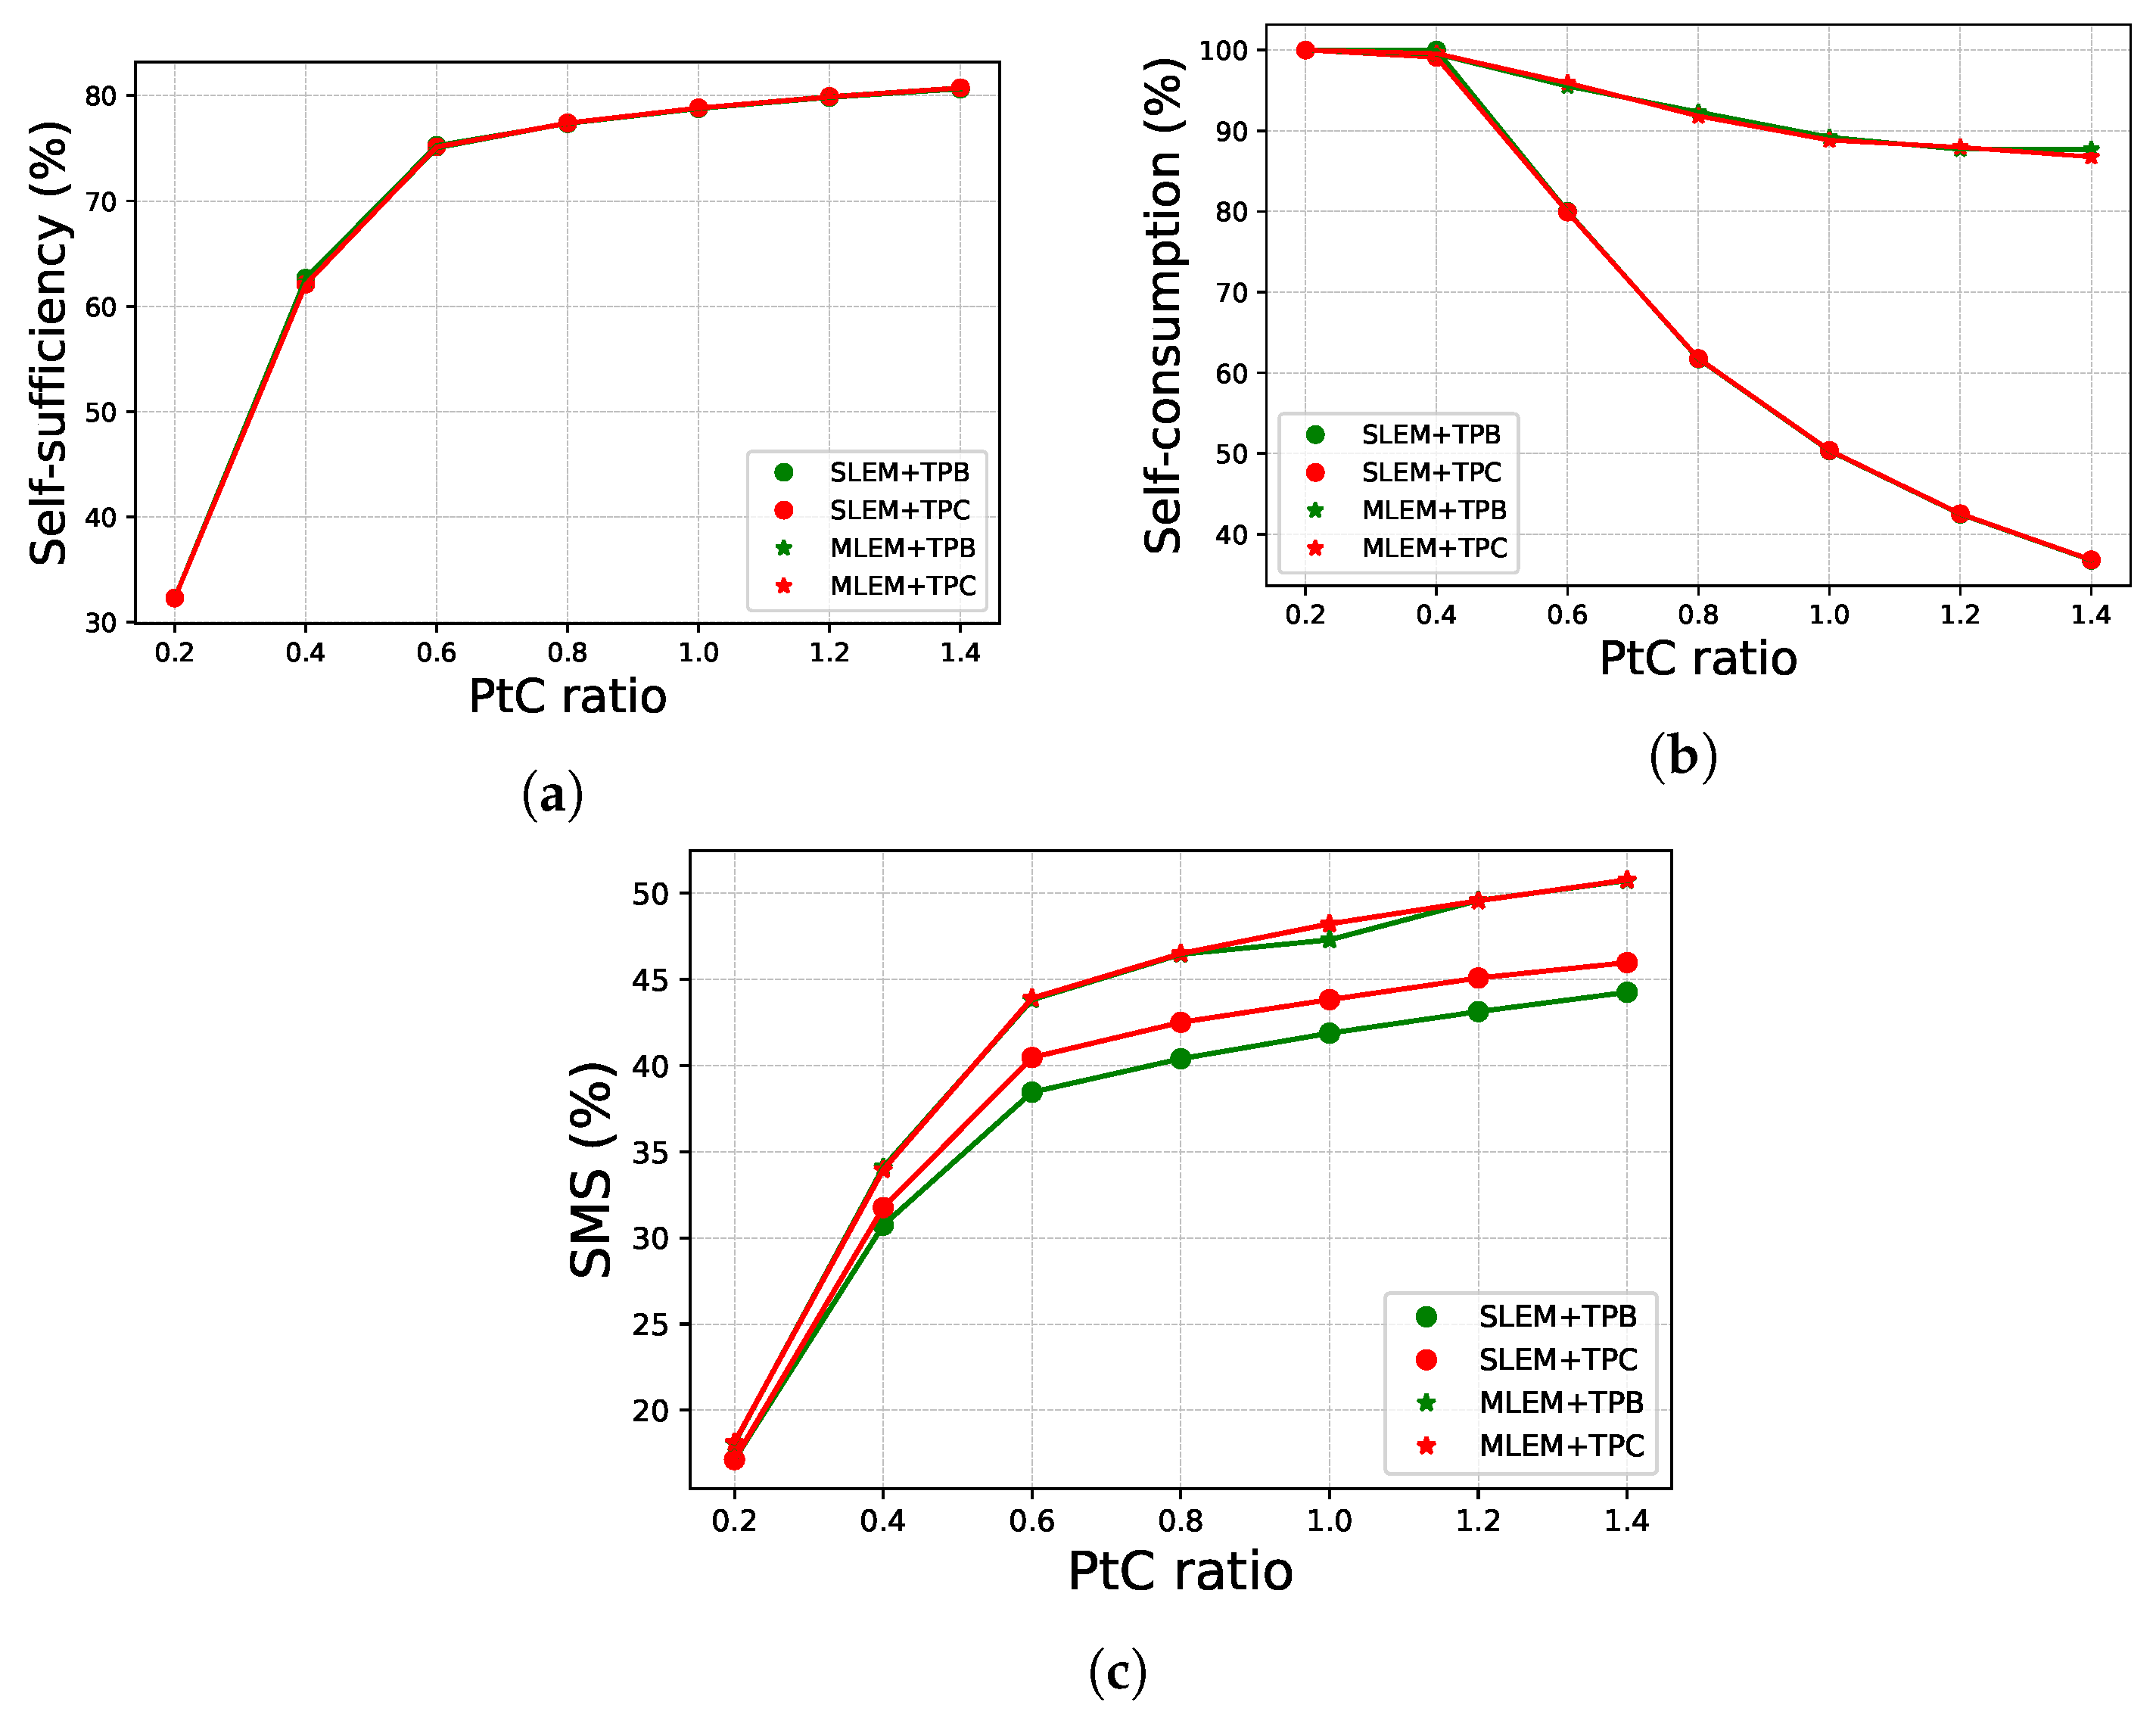
4.3.2. Community Self-Sufficiency

Figure 8a displays the community SS for increasing the production-to-consumption (PtC) ratio of the community under the four different market models. While the SS increases with an increasing PtC ratio, the market model types do not impact the community SS because the quantity of electricity imported from the up-stream grid is the same for the four models described, as seen in Figure 5b. This is because the cost of trading with the up-stream grid is higher for all the models. Hence, trading with the up-stream grid is the last option for the local agents since they have the same trading strategy.

4.3.3. Community Self-Consumption

The variation in the self-consumption (SC) ratio of communities with varying PtC ratios is shown in Figure 8b. The SC is constant with the increase of the PtC ratio from 0.2 to 0.4 for all the models, as shown Figure 8b. However, increasing the PtC ratio results in a decrease in the SC of the community for all the models with a PtC ≥ 0.4. Furthermore, the reduction rate of the SC is higher for the single-layer market models (SLEM + TPB and SLEM + TPC) as compared to the multi-layer LEM models. In other words, increasing the PtC ratio means producing more electricity within the local grid. Since less (low PtC ratio) electricity is produced within the community with a PtC ratio less than 0.4, all the electricity produced within the community is consumed inside the community. This results in a constant 100% SC ratio, with PtC ratios from 0.2 to 0.4. Moreover, increasing the PtC ratio to higher than 0.4 causes some of the electricity produced within the local community to be exported to the up-stream grid. However, the export quantity is higher for the single-layer communities as compared to the multi-layer communities, as illustrated in Figure 5b. The increase in the export quantity to the up-stream grid resulting from uncoordinated single-layer communities is in line with the decrease in the SC ratio of single-layer communities compared to the increasing PtC ratio of multi-layer communities.

4.3.4. Community Share of Market Savings

Figure 8c displays the community SMS with varying PtC ratios for the different market models. Increasing the PtC ratio increases the community SMS for all the models. However, the multi-layer community model creates an additional SMS compared to single-layer communities with an increasing PtC ratio. This is due to the fact that using the multi-layer community model reduces the quantity of electricity exported to the up-stream grid as a result of the multi-layer community coordination strategy. This provides additional revenue to the local market players, which then increases the SMS of the community.

4.3.5. Community Average Trade Price

The average trade price of the TPB market clearing mechanism with the single and multi-layer LEM models of a community is shown in Figure 9. For both models, the average trade price is between 5.5 and 31.5 ct/kWh. During the day, the average trade price is from 15 to 5.5 ct/kWh, while the average trade price is between 23.5 and 31.5 ct/kWh during the night. The lower average electricity price during the day is because of the high trade volume that results from the renewable energy generated during the day within the community. Additionally, the average trade price of the multi-layer community during the day is higher than the average trade price of the single-layer community. Furthermore, there are more benefits for the local community when the absolute value of the difference between the average trade price and the median trade price is less. Hence, the higher average trade price of the multi-layer community during the day is an evidence that it is more beneficial to trade electricity with the multi-layer community compared to trading with the single-layer community.

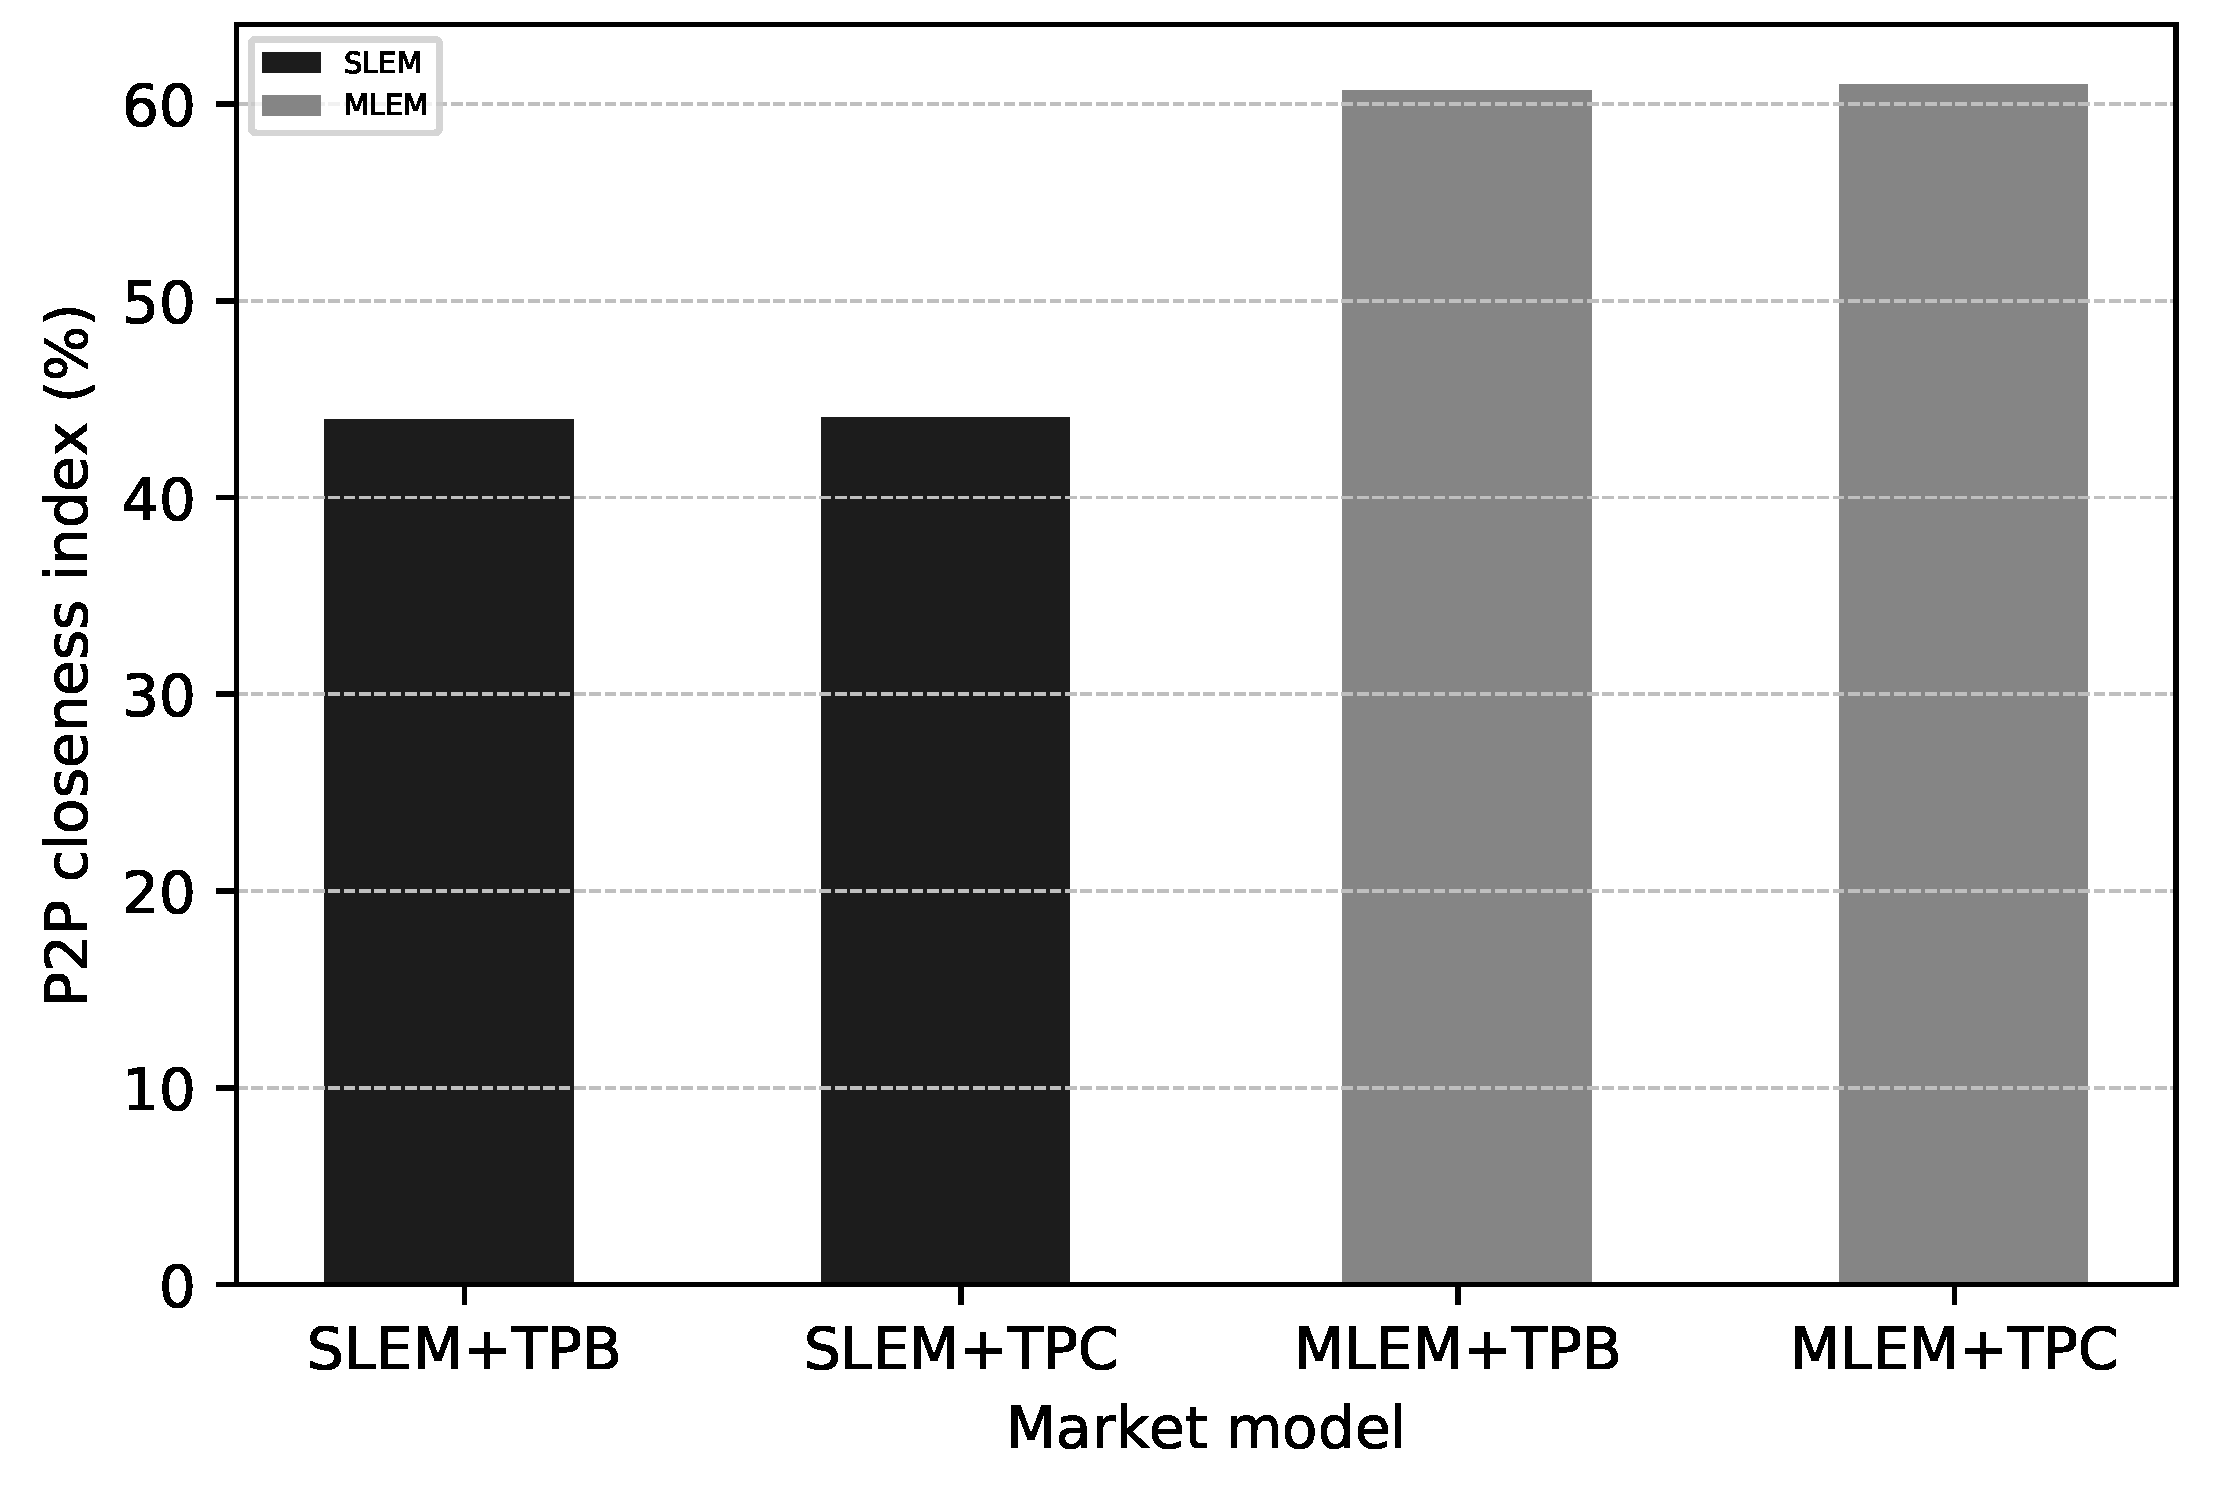
4.3.6. P2P Closeness Index

Figure 10 illustrates the P2P closeness index for the four market models evaluated. It demonstrates how the P2P closeness is not affected by the LEM clearing mechanism. However, the market model has an impact on the closeness index of the LEM. The multi-layer community creates an additional closeness index as compared to the single-layer community because of its ability to coordinate the LEM; it also ensures that the energy generated within the LEM is consumed by consumers that are closer to the producers.

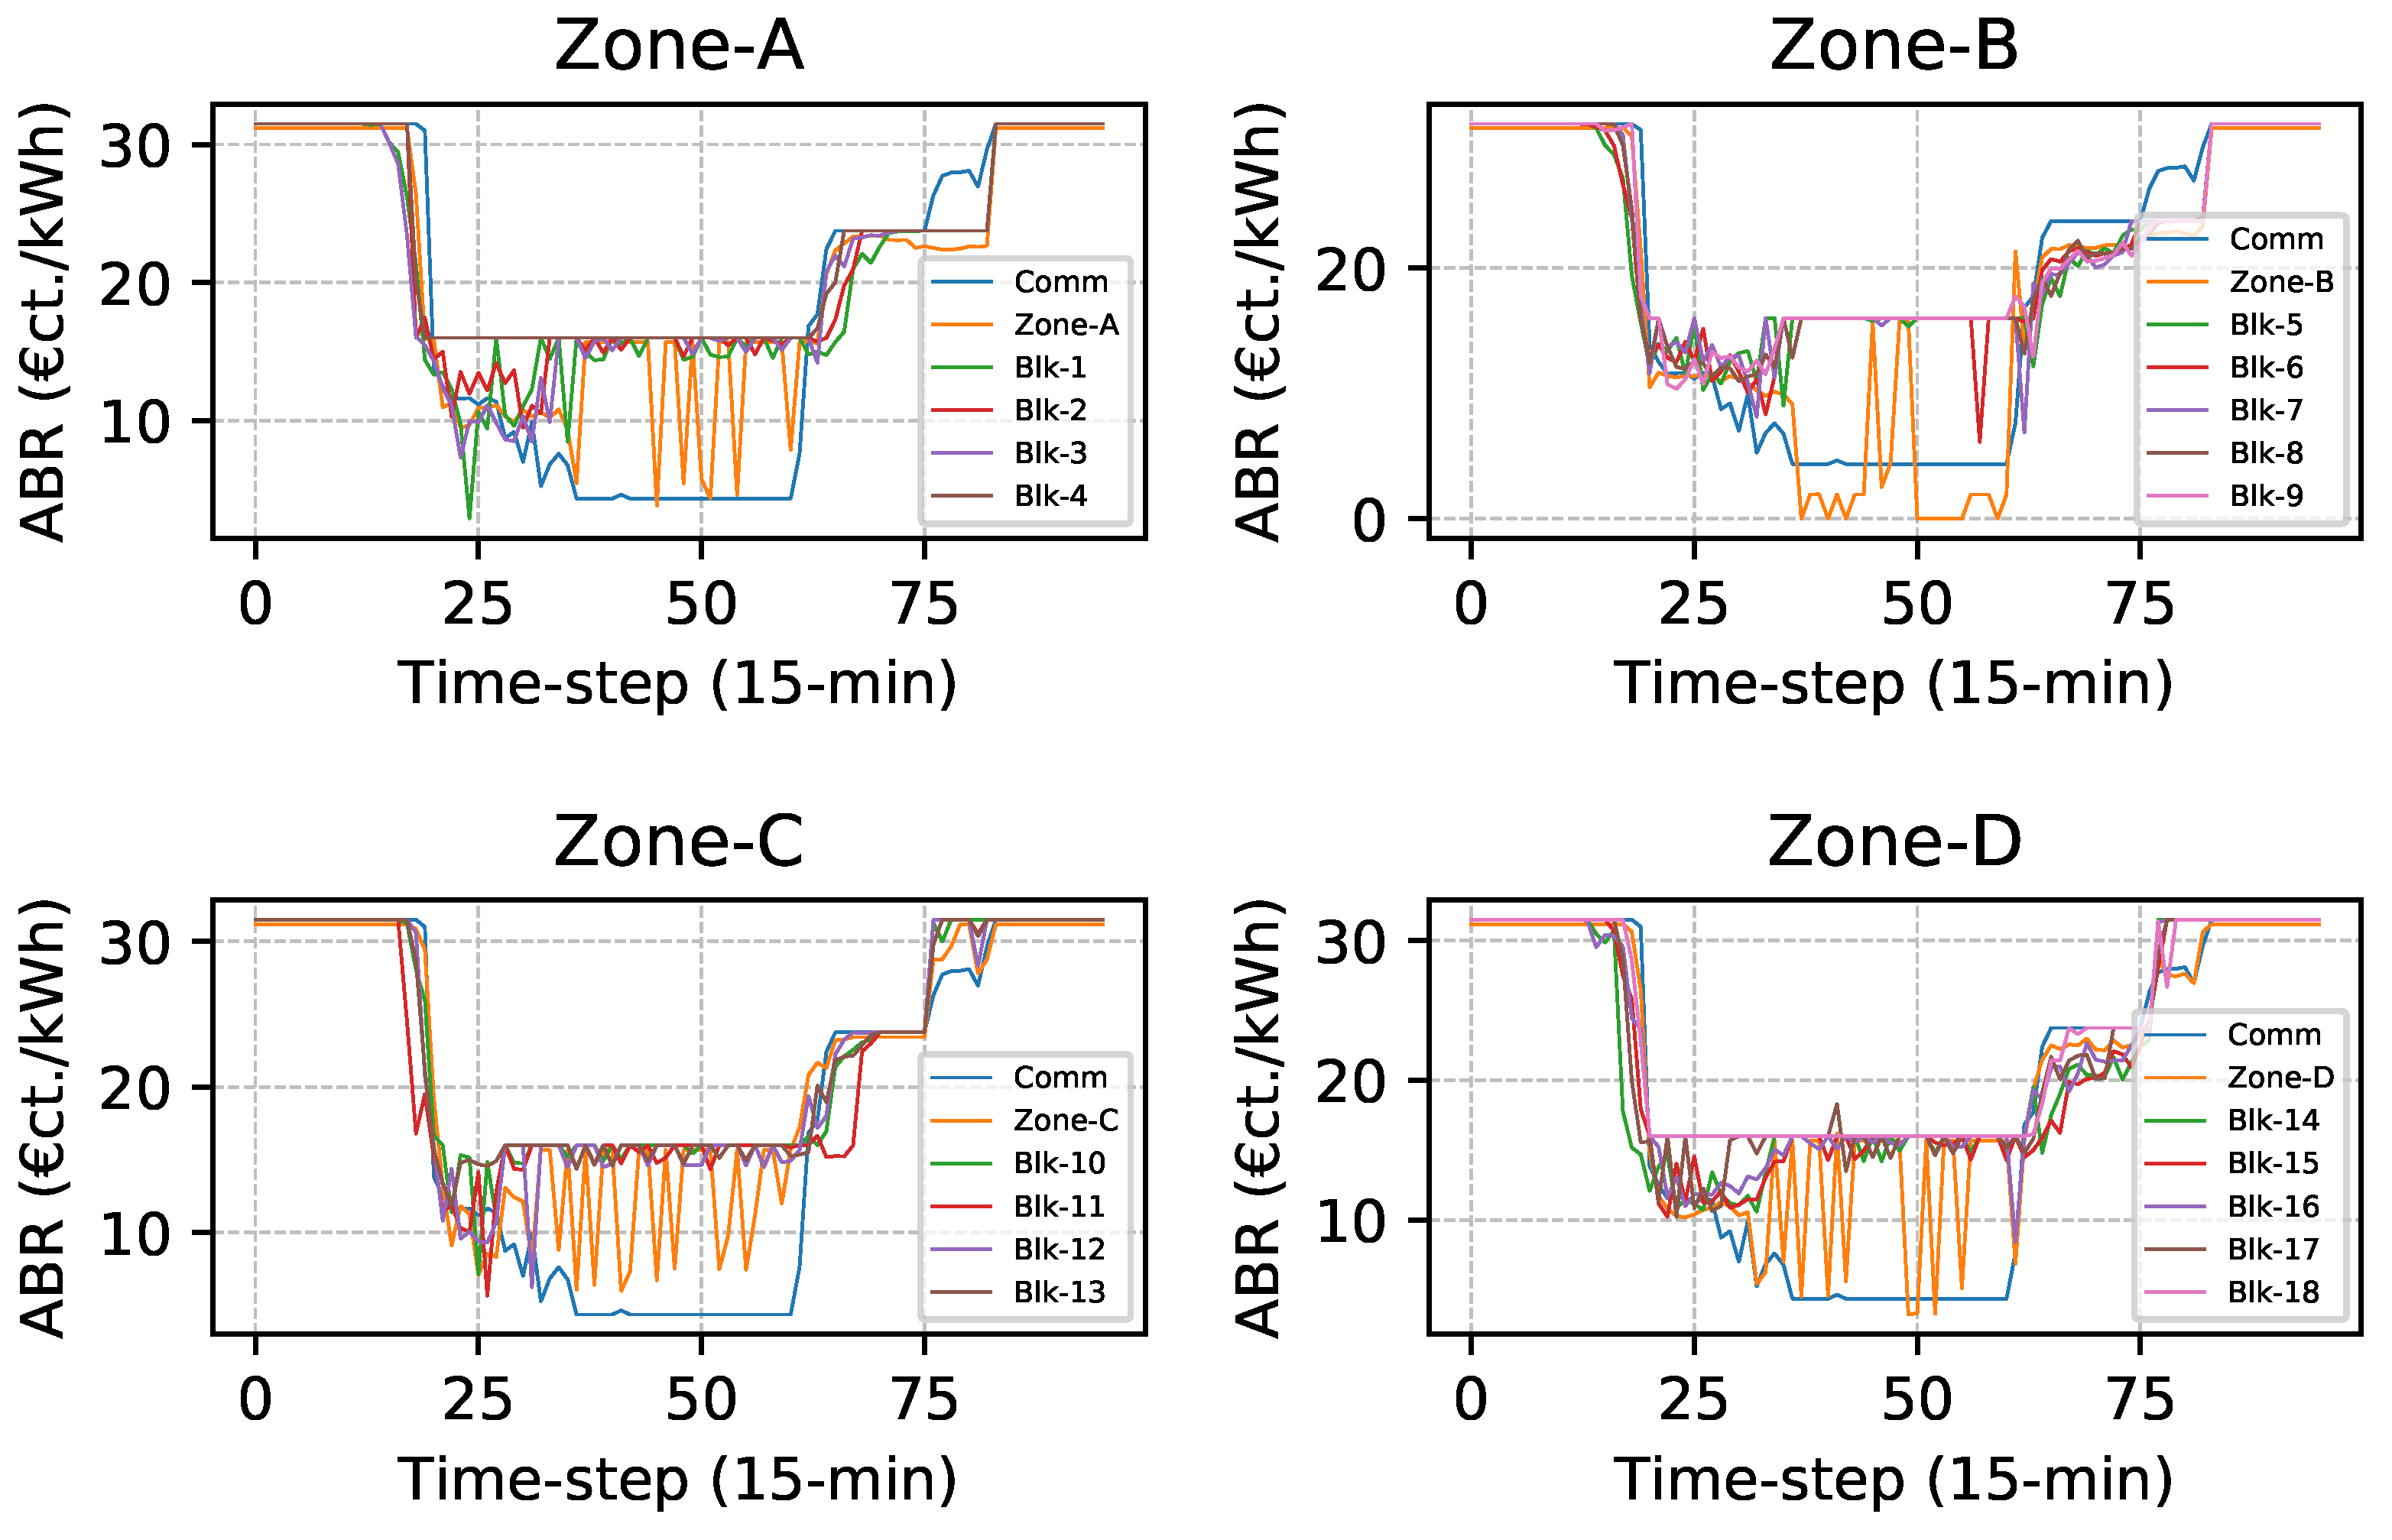
4.4. Comparison of Sub-Community Average Trade Price

Figure 11 displays the average trade price for all the sub-communities and communities with the mutli-layer community model and the TPB clearing mechanism.
For all the communities (sub-communities), the average trade price of the lowest sub-communities (blocks) are closer to the average of the minimum and maximum trade prices. Furthermore, the average trade prices of the zones are between the average trade price of the blocks and that of the higher community. This shows that it is more beneficial to trade electricity at the lowest sub-community hierarchy within an LEM than trading within the higher community (sub-community) hierarchy. Hence, the higher the community hierarchical is from a device agent, the less beneficial it is for the agent to trade electricity within the community level. The average trade price of zone-B decreases to a level below the community trade price during the day time because of the large community and household storage systems in zone-B. Since there is no intelligent trading strategy for moving energy stored in the storage systems to when less electricity is generated in the LEM, this results in a drastic reduction of the average trade price for Zone-B.

4.5. Time Complexity

Table 4 shows the average computational time per market slot while running the simulation on a PC with 16.0 GB of RAM installed, an Intel (R) Core(TM) i7 2.90 GHz processor, and an Ubuntu operating system. Comparing the models reveals that the single-layer communities take about twice the time required by the multi-layer community to complete their computation for each market slot. Additionally, the TPB market clearing mechanism requires more time to complete their computation as compared to the TPC clearing mechanism. Hence, notwithstanding all other advantages of the multi-layer community over the single-layer community models, multi-layer community models still take less computational time per time slot as compared to single-layer community models. This technical benefit of multi-layer community models and other economic benefits they have over single-layer community models makes it advantageous to adopt a multi-layer community model for LEM implementation, especially for household and commercial consumers and prosumers.

4.6. Discussion

The proposed hierarchical, agent-based model framework organises bids and offers based on the location of the agents and considering local grid fees. The device agents compete with each other directly from the house level until the up-stream grid level, thereby ensuring a competitive and efficient market. Bids/offers which are not matched at sub-community levels are forwarded to higher sub-communities or communities that consider grid fees. This approach does not require a third part such as an aggregator to exchange its electricity with the up-stream grid as the local agents organise their electricity by themselves. In some of hierarchical models developed in the literature, there is only the presence of an aggregator responsible for aggregating the trade from different microgrids and buying/selling the deficit/excess from the up-stream grids [37,38]. However, in our proposed model, the device agents are responsible for making their bids/offers and even for interacting with the up-stream grid without a third party. This creates competitive markets among the local device agents as they are responsible for their bids/offers. Furthermore, the major advantage of our proposed model is to save more for the local electricity traders and give them more power to have control over their local generation and demands. However, the local participants also have to take up the risk or losses that may come up from such markets. The local market trader may incur some loss from the market if they do not use intelligent agents for the bidding/offering. Additionally, comparing our key findings in this paper with a previous work [20] that has similar data and bidding/offering strategy, our proposed model shows better performance indicators, especially with the SMS and the SS.

5. Conclusions

This paper presents a mathematical model for a hierarchical, agent-based local electricity market framework. The proposed model shows how bid/offers are forwarded from one community to others within a hierarchy considering grid fees. The model was implemented on the open-source Grid Singularity Exchange to show its applicability in local electricity exchange. The simulations were performed in a German case study, analysing multiple scenarios to compare different market-clearing mechanisms and market models for the LEM. The simulation results revealed that by comparing the multi-layer and single-layer hierarchical models for LEMs, the multi-layer model is able to coordinate trades within the LEM and ensure that electricity is consumed closer to where it is generated. Furthermore, the multi-layer LEM community model reduces the total energy export from the LEM to the up-stream grid, increases the internal energy exchange in the LEM, increases the individual savings of the households, and increases the self-consumption and market savings of the local community as compared to the single-layer LEM community model. Moreover, the multi-layer community models resulted in a closer P2P index, lower average trade rate, and decreased the computational time of the LEM. However, for an industrial prosumer wishing to participate in LEM trading for individual economic benefits, the single-layer community model is more profitable as compared to the multi-layer LEM models.
It is worth noting that the distribution network constraints and the administrative costs were not considered in this paper, which will be addressed in our future research. We will also explore the administrative cost in comparison with simpler systems, additional local market-clearing mechanisms based on user attributes, clustering algorithms, and intelligent bidding strategies for local electricity trading.

Author Contributions

G.C.O.: Conceptualization, methodology, software, formal analysis, data curation, writing—original draft, writing—review and editing, visualization. A.S.G.: Conceptualization, methodology, formal analysis, writing—original draft, writing—review and editing. S.H.: Conceptualization, software, writing—review and editing. C.D.: Conceptualization, software, writing—review and editing. A.T.: Conceptualization, writing—review and editing. M.S.-k.: Conceptualization, writing—review and editing. P.T.: Conceptualization, writing—review and editing. T.H.: Conceptualization, writing—review and editing. All authors have read and agreed to the published version of the manuscript.

Funding

Godwin C. Okwuibe and Amin Shokri Gazafroudi acknowledge support from the BEST Project funded by the German Federal Ministry of Economics and Energy under grant number 03EI4017D.

Acknowledgments

Godwin C. Okwuibe acknowledge the support provided by the Technical University of Munich, Germany. The authors acknowledge and thank the Bundnis Bürgerenergie (BBEn) and the energy community EWS Schönau for providing anonymized data sets for research.

Conflicts of Interest

The authors declare no conflict of interest.

References

  1. Driesen, J.; Belmans, R. Distributed generation: Challenges and possible solutions. In Proceedings of the 2006 IEEE Power Engineering Society General Meeting, Montreal, QC, Canada, 18–22 June 2006; p. 8. [Google Scholar] [CrossRef]
  2. Mengelkamp, E.; Bose, S.; Kremers, E.; Eberbach, J.; Hoffmann, B.; Weinhardt, C. Increasing the efficiency of localenergy markets through residential demand response. Energy Inform. 2018, 1, 11. [Google Scholar] [CrossRef]
  3. Siano, P.; De Marco, G.; Rolán, A.; Loia, V. A survey and evaluation of the potentials of distributed ledger technology for peer-to-peer transactive energy exchanges in local energy markets. IEEE Syst. J. 2019, 13, 3454–3466. [Google Scholar] [CrossRef]
  4. Bjarghov, S.; Loschenbrand, M.; Ibn Saif, A.U.N.; Alonso Pedrero, R.; Pfeiffer, C.; Khadem, S.K.; Rabelhofer, M.; Revheim, F.; Farahmand, H. Developments and Challenges in Local Electricity Markets: A Comprehensive Review. IEEE Access 2021, 9, 58910–58943. [Google Scholar] [CrossRef]
  5. Sousa, T.; Soares, T.; Pinson, P.; Moret, F.; Baroche, T.; Sorin, E. Peer-to-peer and community-based markets: A comprehensive review. Renew. Sustain. Energy Rev. 2019, 104, 367–378. [Google Scholar] [CrossRef] [Green Version]
  6. Gazafroudi, A.S.; Khajeh, H.; Shafie-khah, M.; Laaksonen, H.; Corchado, J.M. Local market models. In Local Electricity Markets; Elsevier: Amsterdam, The Netherlands, 2021; pp. 79–90. [Google Scholar]
  7. Khorasany, M.; Mishra, Y.; Ledwich, G. Hybrid trading scheme for peer-to-peer energy trading in transactive energy markets. IET Gen. Trans. Dist. 2019, 14, 245–253. [Google Scholar] [CrossRef]
  8. Mengelkamp, E.; Staudt, P.; Garttner, J.; Weinhardt, C. Trading on local energy markets: A comparison of market designs and bidding strategies. In Proceedings of the 2017 14th International Conference on the European Energy Market (EEM), Dresden, Germany, 6–9 June 2017; pp. 1–6. [Google Scholar] [CrossRef]
  9. Morstyn, T.; Farrell, N.; Darby, S.J.; McCulloch, M.D. Using peer-to-peer energy-trading platforms to incentivize prosumers to form federated power plants. Nat. Energy 2018, 3, 94–101. [Google Scholar] [CrossRef]
  10. Gazafroudi, A.S.; Mezquita, Y.; Shafie-khah, M.; Prieto, J.; Corchado, J.M. Islanded microgrid management based on blockchain communication. In Blockchain-Based Smart Grids; Elsevier: Amsterdam, The Netherlands, 2020; pp. 181–193. [Google Scholar]
  11. Morstyn, T.; McCulloch, M.D. Multiclass energy management for peer-to-peer energy trading driven by prosumer preferences. IEEE Trans. Power Syst. 2018, 34, 4005–4014. [Google Scholar] [CrossRef]
  12. Teotia, F.; Mathuria, P.; Bhakar, R. Peer-to-peer local electricity market platform pricing strategies for prosumers. IET Gen. Trans. Dist. 2020, 14, 4388–4397. [Google Scholar] [CrossRef]
  13. Zhou, Y.; Wu, J.; Long, C. Evaluation of peer-to-peer energy sharing mechanisms based on a multiagent simulation framework. Appl. Energy 2018, 222, 993–1022. [Google Scholar] [CrossRef]
  14. Naval, N.; Yusta, J.M. Virtual power plant models and electricity markets—A review. Renew. Sustain. Energy Rev. 2021, 149, 111393. [Google Scholar] [CrossRef]
  15. Zia, M.F.; Benbouzid, M.; Elbouchikhi, E.; Muyeen, S.M.; Techato, K.; Guerrero, J.M. Microgrid Transactive Energy: Review, Architectures, Distributed Ledger Technologies, and Market Analysis. IEEE Access 2020, 8, 19410–19432. [Google Scholar] [CrossRef]
  16. Wang, C.; Li, J.; Li, W.; Zhang, Z.; Shi, Y.; Li, W. Study on the bi-level optimal clearing model of electricity market considering the weight of consumption responsibility. Energy Rep. 2021, 7, 5527–5535. [Google Scholar] [CrossRef]
  17. Georgilakis, P.S. Review of Computational Intelligence Methods for Local Energy Markets at the Power Distribution Level to Facilitate the Integration of Distributed Energy Resources: State-of-the-art and Future Research. Energies 2020, 13, 186. [Google Scholar] [CrossRef] [Green Version]
  18. Shokri Gazafroudi, A.S.; Prieto, J.; Corchado, J.M. Virtual Organization Structure for Agent-Based Local Electricity Trading. Energies 2019, 12, 1521. [Google Scholar] [CrossRef] [Green Version]
  19. Oprea, S.V.; Bâra, A. Devising a trading mechanism with a joint price adjustment for local electricity markets using blockchain. Insights for policy makers. Energy Policy 2021, 152, 112237. [Google Scholar] [CrossRef]
  20. Okwuibe, G.C.; Wadhwa, M.; Brenner, T.; Tzscheutschler, P.; Hamacher, T. Analysis of Key Performance Indicators for Local Electricity Markets’ Design Analyse des indicateurs clés de performance pour la conception des marchés locaux de l’électricité. IEEE Can. J. Electr. Comput. Eng. 2021, 44, 411–422. [Google Scholar] [CrossRef]
  21. Gazafroudi, A.S.; Khorasany, M.; Razzaghi, R.; Laaksonen, H.; Shafie-khah, M. Hierarchical approach for coordinating energy and flexibility trading in local energy markets. Appl. Energy 2021, 302, 117575. [Google Scholar] [CrossRef]
  22. Solanki, B.; Agarwal, A.; Meena, R.; Mahiya, N.; Sharma, D.; Kushwaha, P.; Mathuria, P.; Bhakar, R. Blockchain-based Decentralized Hybrid P2P Energy Trading. In Proceedings of the 2021 9th IEEE International Conference on Power Systems (ICPS), Kharagpur, India, 16–18 December 2021; pp. 1–5. [Google Scholar] [CrossRef]
  23. Weinhardt, C.; Mengelkamp, E.; Cramer, W.; Hambridge, S.; Hobert, A.; Kremers, E.; Otter, W.; Pinson, P.; Tiefenbeck, V.; Zade, M. How far along are Local Energy Markets in the DACH+ Region? In Proceedings of the Tenth ACM International Conference on Future Energy Systems, Phoenix, AZ, USA, 25–28 June 2019; ACM: New York, NY, USA, 2019; Volume 06152019, pp. 544–549. [Google Scholar] [CrossRef]
  24. Gazafroudi, A.S.; Okwuibe, G.C.; Hambridge, S.; Dietrich, C.; Trbovich, A.; Tzscheutschler, P.; Hamacher, T.; Shafie-khah, M. Mathematical Model for Agent-based Local Energy Exchange Engine (D3A). In Proceedings of the 2021 International Conference on Smart Energy Systems and Technologies (SEST), Vaasa, Finland, 6–8 September 2021; pp. 1–6. [Google Scholar] [CrossRef]
  25. Uslar, M.; Rohjans, S.; Neureiter, C.; Pröstl Andrén, F.; Velasquez, J.; Steinbrink, C.; Efthymiou, V.; Migliavacca, G.; Horsmanheimo, S.; Brunner, H.; et al. Applying the Smart Grid Architecture Model for Designing and Validating System-of-Systems in the Power and Energy Domain: A European Perspective. Energies 2019, 12, 258. [Google Scholar] [CrossRef] [Green Version]
  26. Trbovich, A.; Hambridge, S.; van den Biggelaar, D.; Hesse, E.; Sioshansi, F. D3A energy exchange for a transactive grid. In Behind and Beyond the Meter; Elsevier: Amsterdam, The Netherlands, 2020; pp. 267–284. [Google Scholar]
  27. Okwuibe, G.C.; Wadhwa, M.; Brenner, T.; Tzscheutschler, P.; Hamacher, T. Intelligent Bidding Strategies in Local Electricity Markets: A Simulation-based Analysis. In Proceedings of the 2020 IEEE Electric Power and Energy Conference (EPEC), Edmonton, AB, Canada, 9–10 November 2020; pp. 1–7. [Google Scholar] [CrossRef]
  28. Tjaden, T.; Bergner, J.; Weniger, J.; Quaschning, V. Representative Electrical Load Profiles of Residential Buildings in Germany with a Temporal Resolution of One Second. Dataset, HTW Berlin—University of Applied Sciences, License: CC-BY-NV-4.0. Available online: https://www.researchgate.net/publication/285577915_Representative_electrical_load_profiles_of_residential_buildings_in_Germany_with_a_temporal_resolution_of_one_second (accessed on 14 February 2021).
  29. Pflugradt, N. LoadProfileGenerator. Available online: https://www.loadprofilegenerator.de/ (accessed on 2 July 2021).
  30. Pflugradt, N. Modellierung von Wasser und Energieverbräuchen in Haushalten. Ph.D. Dissertation, Technische Universität Chemnitz, Chemnitz, Germany, 2016. [Google Scholar]
  31. Stromnetz-Berlin. Netznutzer -Standardlastprofile. Available online: https://www.stromnetz.berlin/netz-nutzen/netznutzer (accessed on 2 July 2021).
  32. Fünfgeld, C.; Tiedemann, R. Anwendung der Repräsentativen VDEW-Lastprofile: Step-by-Step. Available online: https://www.bdew.de/media/documents/2000131_Anwendung-repraesentativen_Lastprofile-Step-by-step.pdf (accessed on 8 July 2021).
  33. Pfenninger, S.; Staffell, I. Long-term patterns of European PV output using 30 years of validated hourly reanalysis and satellite data. Energy 2016, 114, 1251–1265. [Google Scholar] [CrossRef] [Green Version]
  34. Pfenninger, S.; Staffell, I. Renewables Ninja. Available online: https://www.renewables.ninja/ (accessed on 12 July 2021).
  35. German VAT Refund. Available online: https://www.germany.info/us-en/service/09-Taxes/vat-refund/906296 (accessed on 12 April 2021).
  36. Electricity Prices in Europe. Available online: https://strom-report.de/electricity-prices-europe/. (accessed on 14 April 2021).
  37. Rodríguez, R.; Negrete-Pincetic, M.; Olivares, D.; Lorca, Á.; Figueroa, N. The value of aggregators in local electricity markets: A game theory based comparative analysis. Sustain. Energy Grids Net. 2021, 27, 100498. [Google Scholar] [CrossRef]
  38. Long, C.; Wu, J.; Zhang, C.; Cheng, M.; Al-Wakeel, A. Feasibility of Peer-to-Peer Energy Trading in Low Voltage Electrical Distribution Networks. Energy Procedia 2017, 105, 2227–2232. [Google Scholar] [CrossRef]
Figure 1. Multi-agent framework and hierarchical structure of LEMs based on the GSyE.
Energies 15 03575 g001
Figure 2. Trading strategy for (a) Load, (b) PV, and (c) battery agent.
Energies 15 03575 g002
Figure 3. Single-layer, hierarchical, agent-based LEM.
Energies 15 03575 g003
Figure 4. Hierarchical community as a multi-layer, hierarchical, agent-based LEM.
Energies 15 03575 g004
Figure 5. Energy exchange per (a) block, (b) zone, and higher community for the single-layer (lower graph) and multi-layer (upper graph) models.
Energies 15 03575 g005
Figure 6. Energy exchange per block (upper graph) and zone (lower graph) for a single-layer community.
Energies 15 03575 g006
Figure 7. Share of individual savings for selected (a) consumers and (b) prosumers.
Energies 15 03575 g007
Figure 8. (a) Community self-sufficiency, (b) self-consumption, and (c) share of market savings for varying PtC ratios.
Energies 15 03575 g008
Figure 9. Community average trade price with the TPB clearing mechanism for one week.
Energies 15 03575 g009
Figure 10. P2P closeness index for different market models.
Energies 15 03575 g010
Figure 11. Community (sub-community) average trade price of Zone-A, Zone-B, Zone-C and Zone-D in multi-layer community model for a single day.
Energies 15 03575 g011
Table 1. Trade index for different prosumer–consumer combinations.
Location of Buyer and SellerTrade Index
Same block0.8
Different blocks but same zone0.6
Different zones but same community0.4
Different communities0.2
Table 2. Hierarchical arrangement of local traders.
CommunityNo. of Pros [Type]No. of Cons [Type]Sub-CommunitiesCommunity Storage
Blk-13 [HH]4 [HH]--
Blk-22 [HH]4 [HH]--
Blk-34 [HH]5 [HH]--
Blk-4-4 [HH]--
Blk-51 [HH], 1 [HHS]3 [HH]--
Blk-61 [HH], 1 [HHS], 1 [CMS]4 [HH]--
Blk-72 [HHS]3 [HH]--
Blk-81 [HH], 1[HHS]4 [HH]--
Blk-92 [HHS]4 [HH]--
Blk-102 [HH]3 [HH]--
Blk-112 [HH]3 [HH]--
Blk-122 [HH], 1 [CM]4 [HH]--
Blk-132 [HH]4 [HH]--
Blk-142 [HHS]3 [HH]--
Blk-152 [HHS]3 [HH]--
Blk-161 [HH], 2 [HHS]4 [HH]--
Blk-171 [HHS]4 [HH]--
Blk-18-4 [HH]--
Zone-A2 [CM]1 [CM][Blk-1, Blk-4]1
Zone-B2 [CM]-[Blk-5, Blk-9]1
Zone-C1 [CM]2 [CM][Blk-10, Blk-13]-
Zone-D2 [IND]1 [CM][Blk-14, Blk-18]-
Zone-E4 [IND]---
Community--[Zone-A, Zone-E]-
Table 3. Price components for hierarchical community and with the up-stream grid.
ComponentsBlockZonalCommunityUp-Stream Grid
TradesTradesTradesTrades
Energy price (ct/kWh)[0 24.50][0 23.50][0 22.50][0 17.75]
Metering fee (ct/kWh)0.320.320.320.32
Local grid fee (ct/kWh)-1.613.333.33
Up-stream grid fee (ct/kWh)---4.75
Value-added-tax (VAT) (ct/kWh)[0.06 4.72][0.37 4.83][0.85 4.96][1.60 5.35]
Total (ct/kWh)[0.38 29.54][2.30 30.26][4.50 31.11][10.00 31.50]
Table 4. Average computational time per time slot for in different local market models.
Market ModelAverage Computation Time per Slot (s)
SLEM + TPB185.41
SLEM + TPC181.55
MLEM + TPB83.36
MLEM + TPC81.55
Publisher’s Note: MDPI stays neutral with regard to jurisdictional claims in published maps and institutional affiliations.

