Article

How to Reduce Carbon Dioxide Emissions from Power Systems in Gansu Province—Analyze from the Life Cycle Perspective

1
College of Geography and Environmental Science, Northwest Normal University, Lanzhou 730070, China
2
College of Economic, Northwest Normal University, Lanzhou 730070, China
3
Gansu Province Ecological Environment Science Design and Research Institute, Lanzhou 730022, China
*
Author to whom correspondence should be addressed.
Energies 2022, 15(10), 3560; https://doi.org/10.3390/en15103560
Submission received: 26 April 2022 / Revised: 9 May 2022 / Accepted: 10 May 2022 / Published: 12 May 2022
(This article belongs to the Section C: Energy Economics and Policy)

Abstract

:
To develop effective strategies to reduce CO2 emissions from electricity systems, this study accounted for carbon emissions from power systems (production, transmission, consumption) in Gansu Province based on life cycle theory. We used LMDI and SDA decomposition methods to analyze the driving force of carbon emissions and quantified the influence effect and action intensity of various factors on carbon emissions in corresponding links. Several results were found: (1) Direct carbon emissions during the stage of electricity production had the largest share of the entire electricity life cycle. (2) From the perspective of the cumulative contribution rate, electricity consumption and the electricity trade promoted carbon emissions in the stage of electricity production; the power structure, electricity efficiency, and fuel structure had opposite effects. (3) In the stage of electricity transmission, the higher the voltage level, the lower the net loss rate; high-voltage-level transmission lines effectively reduced the growth of implied carbon emissions. (4) Industrial restructuring and technological advances effectively offset the growth in carbon emissions due to population, economy, and electricity consumption. The results can provide a scientific basis for energy-saving and emission reduction policies in provincial government departments and the electric industry.

1. Introduction

In recent years, global climate change caused by greenhouse gases represented by CO2 has become a severe problem faced by all countries worldwide, seriously affecting sustainable development of the world economy and human society [1,2]. Climate change is the most important issue of sustainability [3]. How to reduce CO2 emissions is a common concern across countries worldwide [4]. As the most significant energy-consuming and CO2-emitting country globally, China bears a considerable responsibility to reduce global CO2 emissions [5,6]. The Chinese government made an international commitment to address climate change at the 75th Session of the United Nations General Assembly: China aims to have carbon dioxide emissions peak before 2030 and achieve carbon neutrality before 2060. This commitment is in line with China’s national security and sustainable development strategy and an effective way to promote the international development of the carbon trading market.
Energy burning is the largest source of CO2 emissions in China, accounting for about 88% of total CO2 emissions [7,8]; the electricity sector accounts for about 41% of energy sector emissions [9]; and coal consumption is responsible for 75% of CO2 emissions from fossil fuels [10,11]. The electricity sector produces 25% of the world’s CO2 [12]. Coal-fired electricity generation is the predominant form of electricity generation in China, and the electricity generation industry produces more than 45% of the country’s total carbon emissions [13]. The “2030 · 2060” double carbon goals will be challenging to achieve if the structure of coal-burning-based energy consumption continues to hold. To maintain the economy’s growth and achieve a low-carbon electricity system, it is essential to improve energy use efficiency, and clean energy must occupy the dominant position [14].
The northwest region is the most important new energy base in China, exceeding 48% of the national developability of wind and solar technologies. As the central hub of the northwest electricity grid, Gansu Province has significant advantages in geographical location and ventilation (Figure 1). The electricity generation in Gansu Province has continued to rise since 2000 (Figure 2), increasing from 28.027 billion kWh in 2000 to 141.529 billion kWh in 2019, with a sharp increase of 404.97%. The percentage of coal-fired power generation peaked in 2004, with 74% of annual electricity generation. Since then, clean energy, such as hydraulic, wind, and solar energy, has increased yearly. Before 2016, fossil fuels were the largest source of electricity in Gansu Province, accounting for more than 50% of all sources. In 2017, thermal electricity accounted for 47%, and clean energy accounted for 53%; the proportion of clean electricity generation exceeded coal-fired electricity for the first time. By the end of 2020, the capacity for electricity supply had reached 56.2 million kW, with 41.9% of new energy units using wind and solar energy as representatives, and 59% of clean energy units, including hydroelectricity, become the most significant source in Gansu Province. The total carbon emission of Gansu Province has gradually increased since 2000 (Figure 3). In 2000, the carbon emission of Gansu Province was 54.3 Mt, of which the electricity generation industry accounted for 14.25 Mt. In 2013, the direct carbon emission of the power industry reached a peak of 65.66 Mt. After 2013, as the direct carbon emission of power production decreased, it slowed down the total growth rate in Gansu Province to a certain extent.
As can be seen from the above analysis, energy saving and emission reduction of electricity systems is one of the vital projects in China to achieve the “double carbon” goals and sustainable development. Therefore, this study conducted a staged accounting of CO2 emissions in the electric power industry of Gansu Province, further studied the drivers and effect intensity of carbon emissions from electricity at different stages, and put forward corresponding recommendations for low-carbon sustainable development in the electric power industry. Other sections of this paper are organized as follows: Section 2 briefly reviews the current literature on CO2 emissions in the electric power sector and proposes the contributions of this study; Section 3 presents the study methods and data sources; Section 4 analyzes the main factors that affect carbon emissions from power systems and quantifies the magnitude of the impact of various driving factors at different stages; Section 5 discusses the fundamental causes and the future trend in the main driving force contribution of carbon dioxide reduction in the Gansu Province power system; and Section 6 outlines the paper’s conclusions and puts forward some applicable policies, finally ending with a clear statement on future research directions.

2. Literature Review

How to reduce the emission of CO2 is one of the most studied issues in the current scientific literature on energy consumption. With further development of the new energy industry, the energy era with electricity generation and cleaning as the main characteristics is about to accelerate, and carbon emission in the electric power industry has become a hot field of concern for many scholars. As the most widely used secondary energy, electric power’s production, processing, and transportation are based mostly on fossil fuel energy [15,16]. Currently, the calculation of carbon emissions from electricity mainly uses the following methods: the IPCC carbon inventory method [17], the network approach [18], the mass balance method, and the case method [19,20]. As a classical carbon emission estimation theory, the IPCC has a wide range of applicability. Many scholars have used IPCC theory to calculate and analyze the carbon emissions of energy consumption in different fields. Mishra et al. predicted India’s share of global carbon emissions from coal-fired power plants in 2050 by using the IPCC assessment method [21]. Shan et al. studied the carbon emissions from Chinese provinces from 1997 to 2015 and listed China’s local carbon emission inventory [17]. Wei et al. calculated the carbon emission from Shanghai electric power by scope with the IPCC emission accounting method [22]. Liu et al. studied the carbon dioxide emission coefficient (the amount of carbon dioxide emitted per kilowatt-hour of electricity generated) of coal-fired power plants in different regions and further suggested ways for the national grid to minimize carbon emissions [23].
There are abundant scientific research achievements on the influencing factors of carbon emissions from the power industry, and the results show that the economic level, energy consumption, population, power intensity, power trading, energy intensity, power generation structure, and other factors have an impact on carbon dioxide emissions from the power industry [24,25,26]. Karmellos et al. selected 27 countries of the European Union to study the drivers of carbon emissions from the power sector and found that the main driving factor leading to increased carbon dioxide emissions is the economic activity effect counterbalanced mainly by the contribution of the generation structure effect [27]. Peng et al. studied carbon dioxide emissions from production to consumption in China’s power industry during the financial transition period [6]. Chen et al. considered technical indicators in the study of carbon emissions from the power industry, and the results showed that the improvement of the technology level is the crucial reason to reduce the growth of carbon emissions [28]. Similar to the above findings, Rong et al. found that per capita income and population size are drivers of increased carbon emissions [29]. Still, changes in energy intensity are the main inhibitors. In addition, the electricity trade is an essential factor in regional power carbon emission differentiation [30].
In the existing scientific literature, structural decomposition analysis (SDA) and logarithmic mean exponential decomposition (LMDI) are widely used decomposition methods with different data requirements and application fields. For example, Wang and Liu (2021) identified India’s renewable energy consumption patterns and transformational factors based on the multi-regional input-output model (MRIO) and SDA [31]. Su et al. (2017b) used the I-O model to analyze Singapore’s carbon emissions from a demand perspective and studied the drivers of changes in carbon emissions under SDA [32]. As LMDI has a complete theory, it is more flexible and practical and is widely used by researchers [33]. Chontanawat et al. (2020) used the logarithmic mean Divisia index (LMDI) method to decompose the source of changes in the CO2 emission level and CO2 emission intensity of the sector for the period 2005–2017. The results showed that during this period, on average the amount of CO2 emissions and the CO2 emission intensity increased annually. The structural change effect helped reduce both the amount of CO2 emissions and the emission intensity [34]. Wang and Wang (2020) used the LMDI method to analyze the driving forces of nitrogen oxide intensity in China’s power industry [35]. The LMDI method has a series of advantages, such as data availability, no residual error in decomposition, and additivity of results, so it is widely used.
To sum up, most scholars mainly concentrated on studying carbon emissions in other areas or electricity production and consumption carbon emissions from two aspects. They tended to ignore the part of hidden carbon emissions from transformer and transmission line losses in the power supply process. However, this part of carbon is a small proportion of the overall power system. It is an indispensable part of the accounting of carbon emissions and the formulation of emission reduction measures. From the perspective of the power life cycle, this study calculated the direct carbon emissions generated in the power production stage and the hidden carbon emissions generated in the power transmission stage and power consumption stage and, through the decomposition analysis of driving factors in each step, put forward targeted policy suggestions. In this study, CEP refers to the carbon dioxide emission directly generated by the consumption of different fuels in the power production stage in Gansu Province. CET refers to the hidden carbon dioxide emission caused by part of the electricity lost by transformers and transmission lines in the regional power transmission stage. CEC is the final electricity demand of all regions and the hidden carbon dioxide emissions generated by the daily electricity consumption of residents. The calculation results of carbon emissions in each stage do not include the carbon emissions generated by the construction of power plants and power generation equipment [23], as well as the carbon emissions generated by the extraction and transportation of fuels in the production stage.

3. Methods and Data Sources

3.1. Methods

3.1.1. IPCC Carbon Inventory Method

This study used the IPCC carbon inventory method to calculate the carbon dioxide emissions generated by the power industry in Gansu Province during the power production stage. The specific calculation formula is as follows:
C E P = k = 1 m e f k · f m k
where e f k is the carbon emission factor of the k t h fuel, f m k is the amount of k t h fuel used in the electricity generation stage, and m is the type of fuel in the electricity generation stage. Standard coal coefficients and carbon emission coefficients of different fuels can be queried in Table 1.

3.1.2. Grid Carbon Emission Factor Method

The Gansu Province power grid always undertakes the task of inter-provincial electric power exchange among the five provinces (regions) in northwest China. To a certain extent, it is impossible to avoid the circuitous phenomenon of different voltage levels and inter-provincial electricity flow, resulting in electricity loss caused by different voltage levels and transmission lines in the process of electricity transmission between Gansu Province and some other provinces. The amount of carbon dioxide corresponding to the electricity quantity lost in this part of the network is defined as the amount of carbon dioxide discharged in the power transmission stage, which can be calculated by the following formula:
C E T = n = 1 q e f n · f l n
where e f n is the carbon emission coefficient of coal-fired power plants in Gansu Province in the n t h   year (carbon dioxide emission per kWh of power generation); f l n is the electricity lost by transformers and transmission lines of different voltage levels in the power transmission process of the Gansu Province power grid in the n t h year, collectively referred as the network lost electricity; and q is the year.
The carbon emission coefficient e f n is determined by the following formula and the exact meaning of each letter in the formula can be queried in Table 2:
e f n = F C i , y × N C V i , y × E F i , y E G y

3.1.3. Logarithmic Mean Divisia Index (LMDI)

The logarithmic mean Divisia index (LMDI) was proposed by Ang to solve the remainder term problem existing in the decomposition of the IDA and DID method. They further studied the problems of zero value and a negative value in the decomposition process [36] so that the LMDI method could solve these two problems skillfully. The LMDI method has been cited in the analysis of influencing factors of carbon emissions [37,38,39], and the specific formula is as follows:
C E P = k = 1 m e f k · f m k = k = 1 m C E P k = k = 1 m C E P k E N · E N T G · T G G · G E C · E C
where E N is the total energy consumed in the power production stage, T G   is thermal power generation, G is the total amount of various forms of power generation, and E C is the power consumption.
Since 2000, the previous year is the base year, from the base year to T, and the change value of direct carbon dioxide emissions generated in the electricity production stage of Gansu Province can be expressed as follows:
C E P = C E P T C E P t = E F 1 + E F 2 + E F 3 + E F 4 + E F 5
where E F 1 , E F 2 , E F 3 , E F 4 , and E F 5 represent the change of carbon dioxide emissions caused by the fuel structure, energy efficiency, power structure, power transaction, and electricity consumption, respectively, in the power production stage. The specific calculation method of each item is as follows:
E F n = k = 1 m W k 1 · ln ( F n k T F n k t )
where   W k 1 = C E P T K C E P t k ln C E P T K ln C E P t k is the logarithmic average weight of direct carbon emissions in the electricity production stage.
Same as the calculation method of direct carbon emission driving factor decomposition in the power production stage, the disintegration of implied carbon emission causing factor decomposition in the power consumption stage is calculated by the following formula:
C E C = k = 1 m c f n · f l n = k = 1 m C E C k P O P · P O P E S · E S E G · E G G D P · G D P = k = 1 m Q 1 · Q 2 · Q 3 · Q 4 · Q 5
In the formula, P O P represents the permanent resident population in Gansu Province, E S represents the power consumption, E G represents the industrial added value of various sectors, and G D P represents the gross regional production.
Starting from 2000, the previous year is the base year, from the base year to T , and the change value of implied carbon dioxide emissions in the electricity consumption stage of Gansu Province can be expressed as follows:
C E C = C E C T C E C t = E F 6 + E F 7 + E F 8 + E F 9 + E F 10  
where E F 6 , E F 7 , E F 8 , E F 9 , and E F 10 , respectively, represent the change in carbon dioxide emissions caused by the power consumption factor, industrial technology factor, industrial structure factor, economic factor, and population factor, and the specific calculation formula can be adopted as Equation (6), where W k 3 = C E C T K C E C t k ln C E C T K ln C E C t k is the logarithmic average weight of implied carbon emissions in the electricity consumption stage.

3.1.4. Structural Decomposition Analysis (SDA)
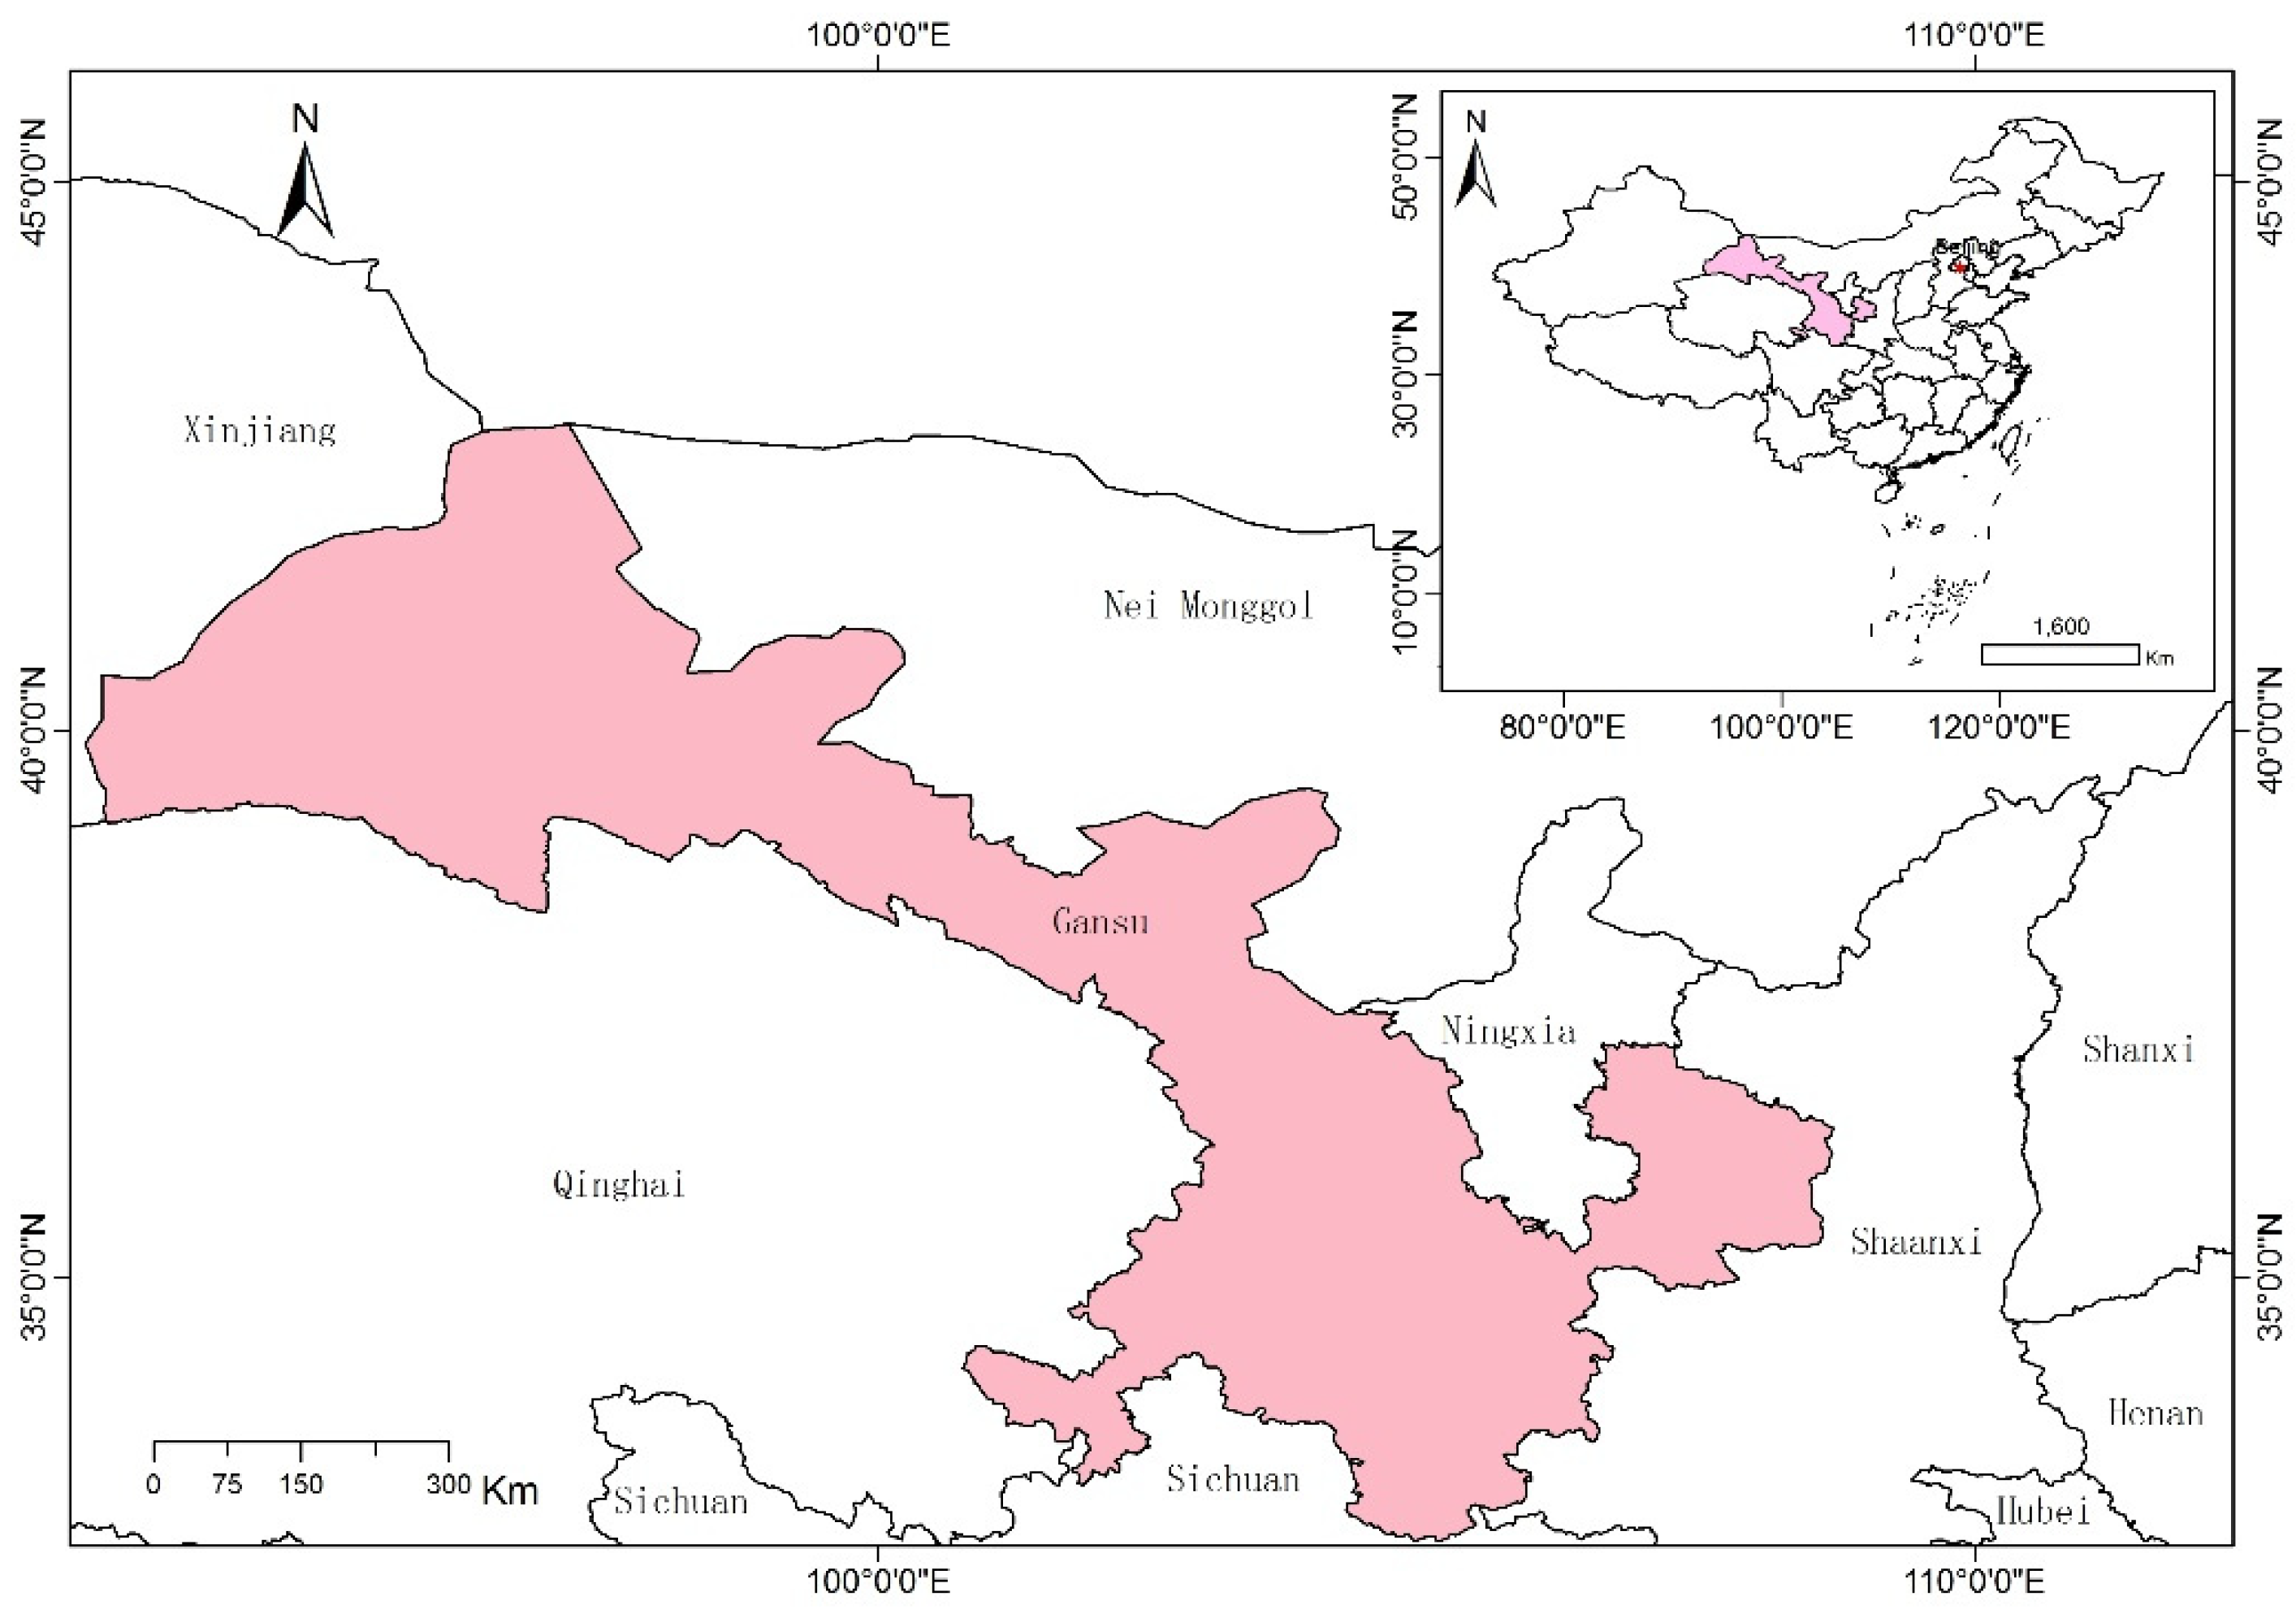
SDA is widely used to decompose the change of a variable into the sum of the alter of several primary driving factors, and these primary driving factors can explain the influence of the CO2 emission implied by a certain variable [40]. In recent years, SDA has been widely used to study the driving factors of greenhouse gas emissions and other related scientific research work. Other scholars have used the SDA method to study greenhouse gas emissions’ driving factors in 2015, 2017, and 2019 [33,41,42]. Many reasons influence the change in CO2 emissions, such as economic growth, infrastructure construction, and consumption structure adjustment [43]. In this study, SDA decomposes the driving force of hidden CO2 emissions affecting Gansu Province’s power system’s power transmission link and finds effective measures to effectively reduce the carbon emissions in the power transmission process by looking for specific measures.
According to the equation, the embodied carbon dioxide emissions in the power transmission stage in Gansu Province can be calculated by the following formula:
C E T = n = 1 t e f n · f l n = E S · S · S ^ · t ^ 1 · A
where t is the year and matrix A is used to identify carbon dioxide emissions generated by power exchange in Gansu and other provinces. E S , S , S ^ , and t ^ 1 , respectively, indicate the comprehensive network loss rate, voltage level, transmission line, and transmission electricity.
From time t to T , the change in C E T can be expressed as:
C E T = C E T T C E T t = ω ( E S ) · E S + ω ( S ) · S + ω ( S ^ ) · S ^ + ω ( t ^ 1 ) · t ^ 1
where ω ( E S ) and other similar expressions represent the weight of each driving factor.

3.2. Data Source

The fuel data used in the calculation of direct CO2 emissions in the power generation stage are derived from the energy balance sheet of Gansu Province in the Energy Yearbooks. The electricity transmission stage implicit emissions of carbon dioxide are used in the calculation of different voltage grades of wastage and involve a different voltage grade of the transmission line length, the structure of the distribution network loss power, and transmission, and other data come from the 2000–2019 annual report of the Gansu Province power network. The GDP data of Gansu Province’s industrial added value comes from the National Bureau of Statistics.

4. Results

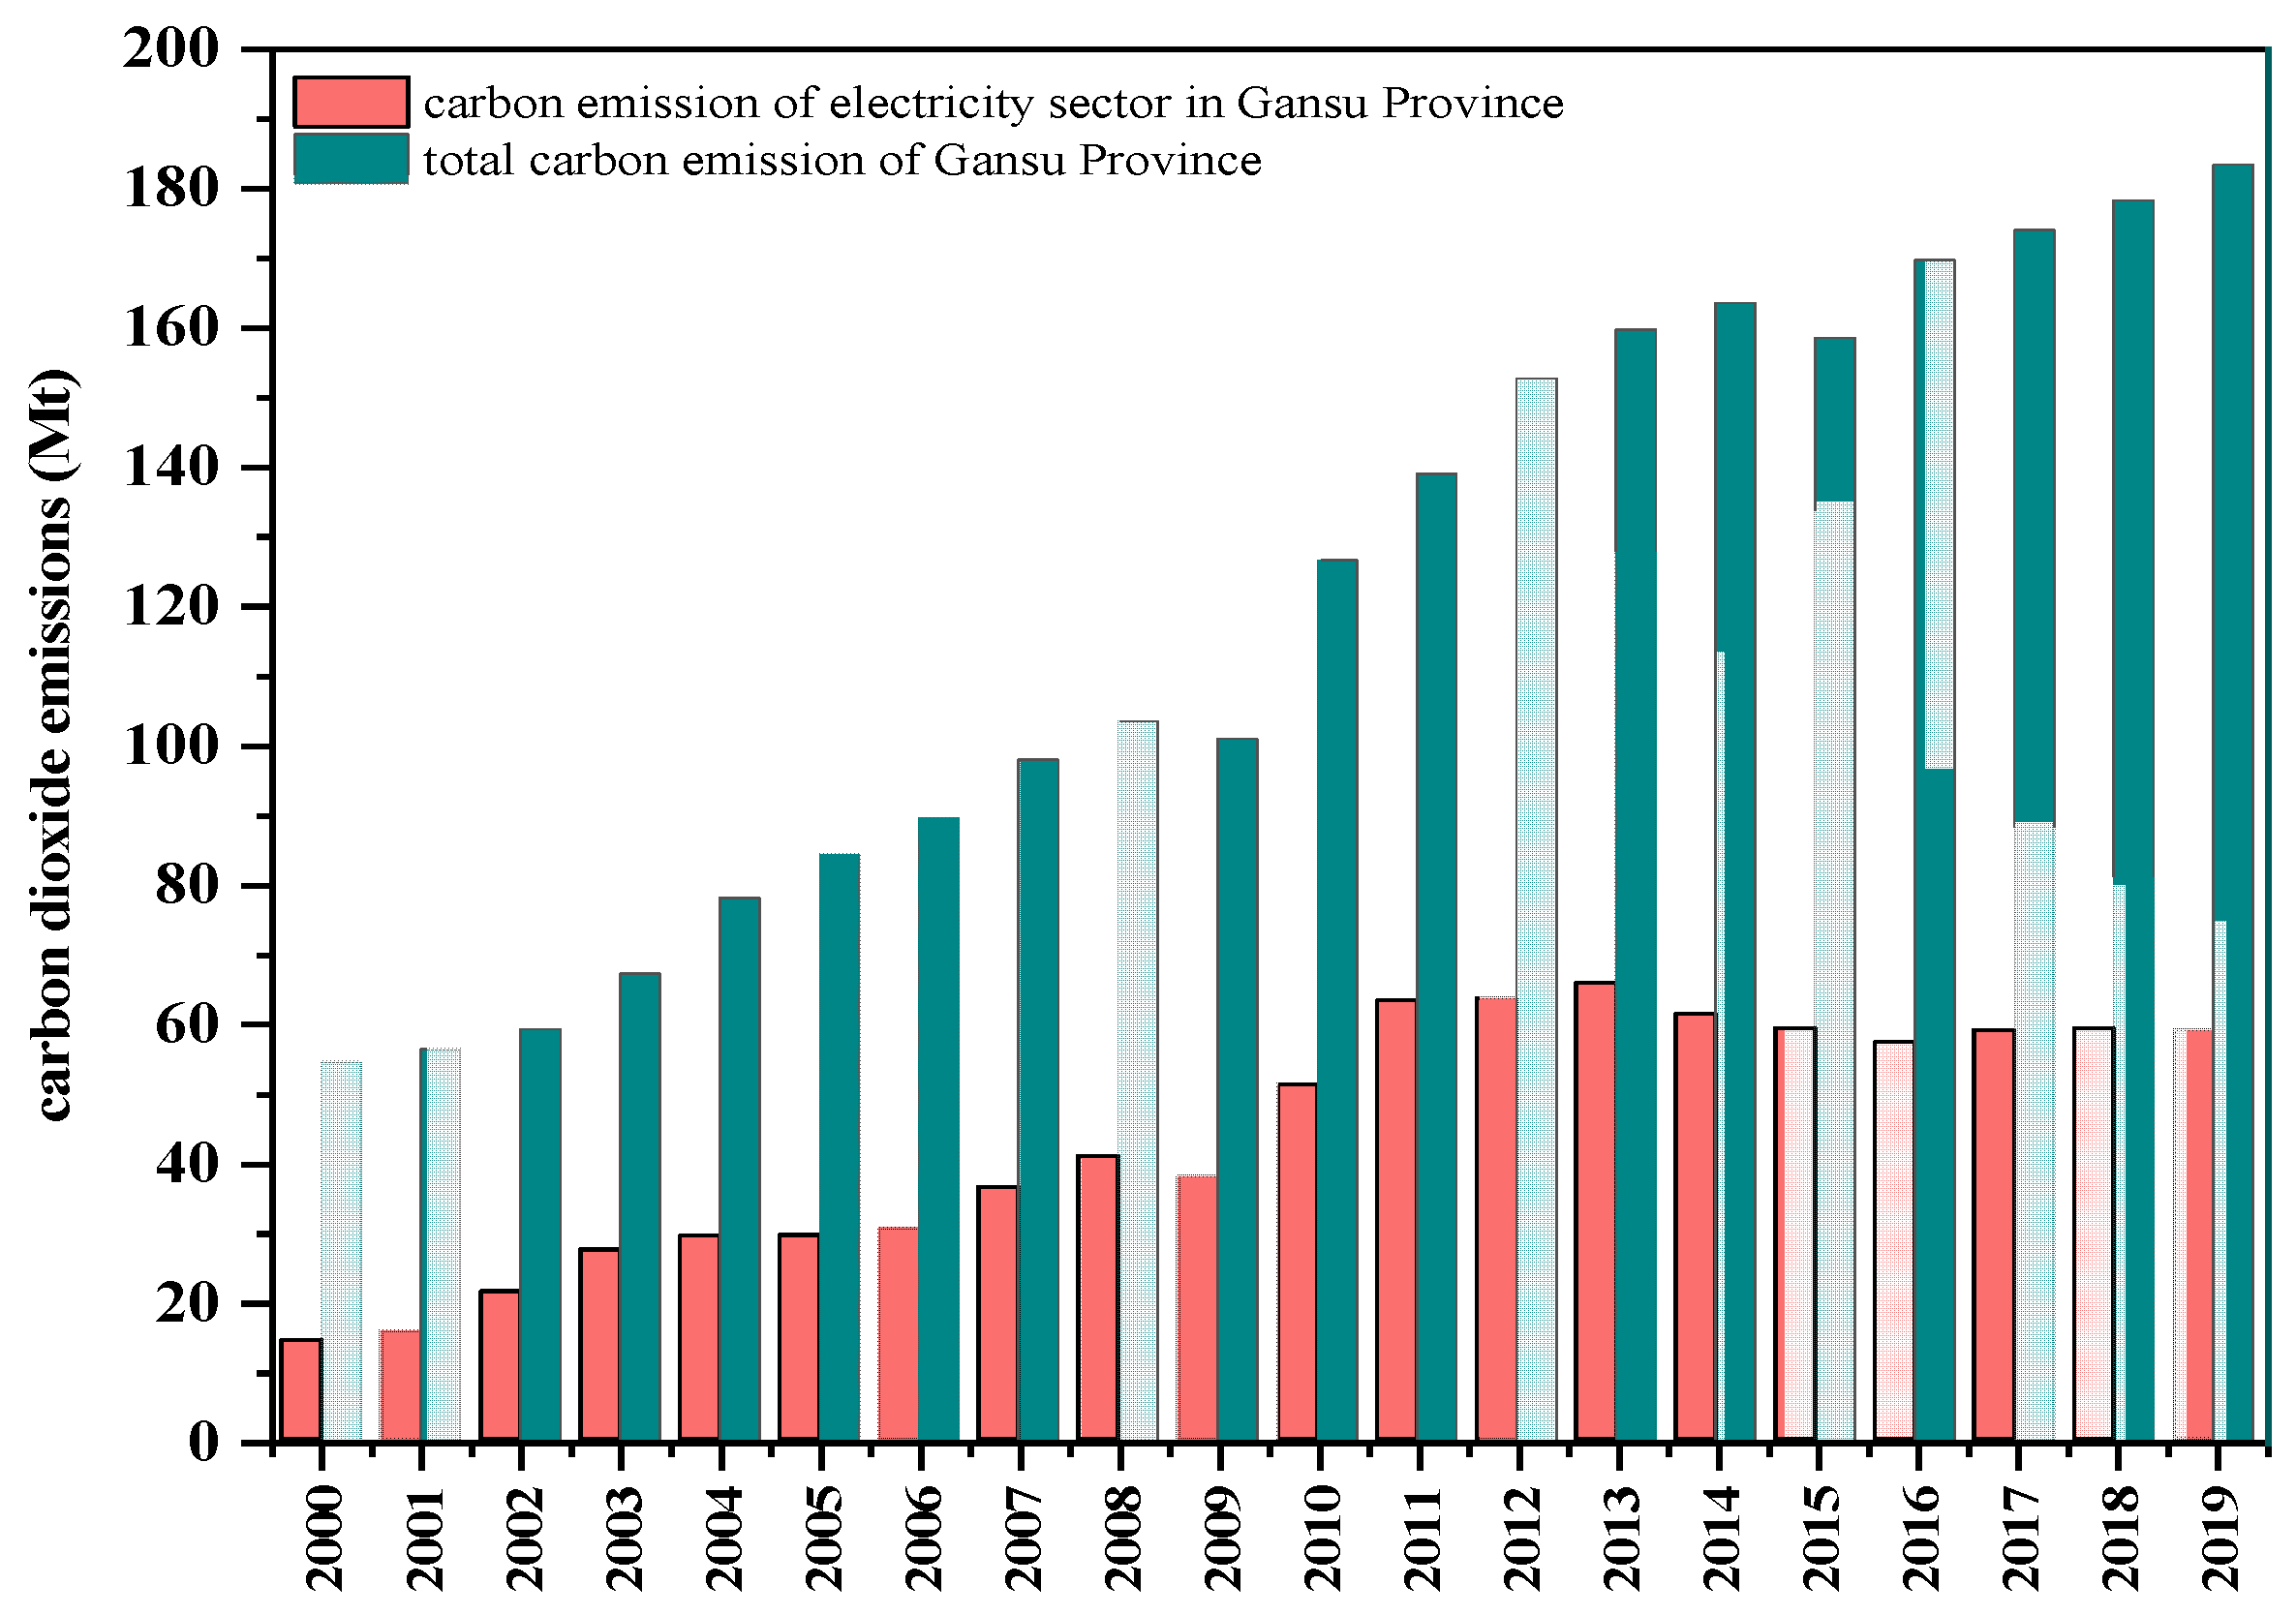
4.1. Analysis of Carbon Emission Calculation Results

The level of clean electricity production in Gansu Province was constantly improving. The electricity production and the direct carbon emissions from thermal electricity showed a high, consistent development trend, reaching the peak in 2013 (Figure 4). As shown in Figure 4, with the gradual operation of the 10 million kilowatt wind power base in Jiuquan, Gansu Province, the wind power generation in 2013 increased by 27.19% compared to the same period in 2012. In 2000, 2005, 2010, 2015, and 2019, Gansu Province generated 28.027 billion kWh, 44.403 billion kWh, 76.505 billion kWh, 107.2 billion kWh, and 141.529 billion kWh of power, accounting for 2.08%, 1.78%, 1.82%, 1.84%, and 1.89% of the Chinese total power generation, respectively. However, the power generation in Gansu Province showed a declining trend in 2014, 2015, and 2016 due to the influence of different factors, among which the electricity generated by coal-fired power decreased gradually after reaching its peak in 2013. The direct carbon emissions in the Gansu Province power production stage decreased from 65.66 Mt in 2013 (the maximum in recent 20 years) to 58.80 Mt in 2019. The carbon emission intensity of power production in Gansu Province (carbon dioxide emissions per kilowatt-hour of electricity produced) decreased from 0.57 kg/kWh in 2013 to 0.42 kg/kWh in 2019, indicating that power production in Gansu Province has become cleaner (Figure 5).

4.2. Driving Factor Decomposition Analysis

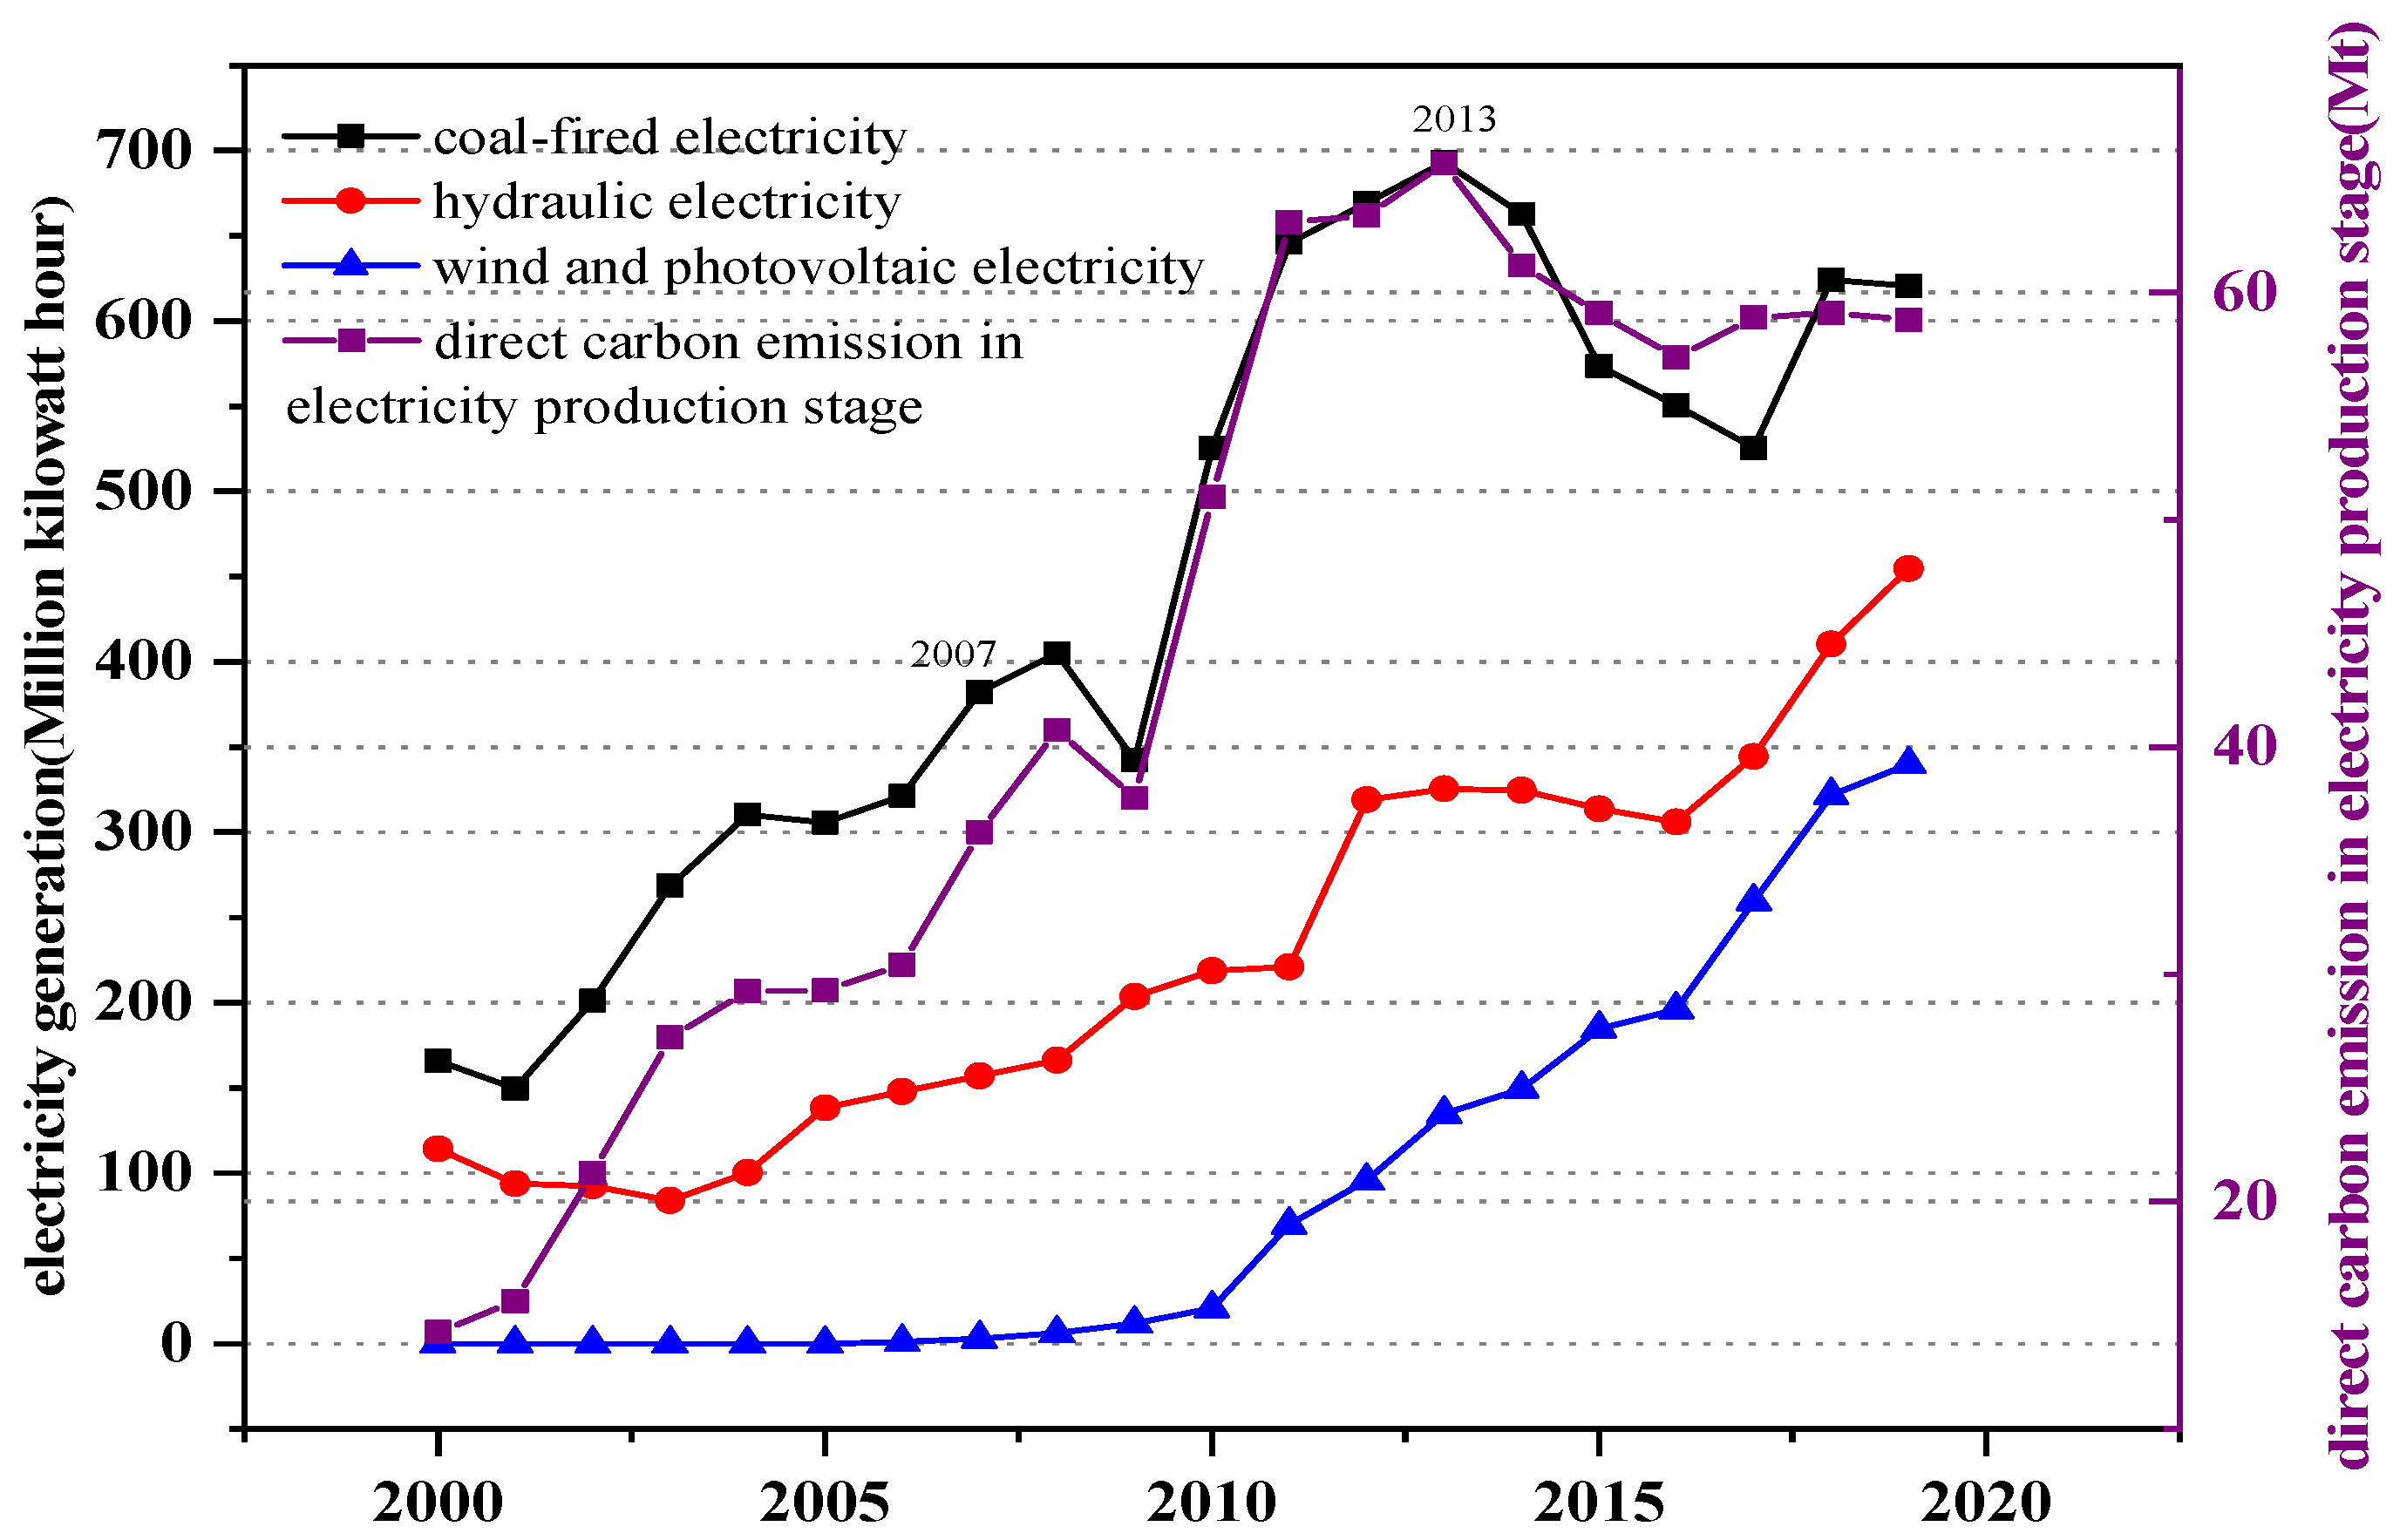
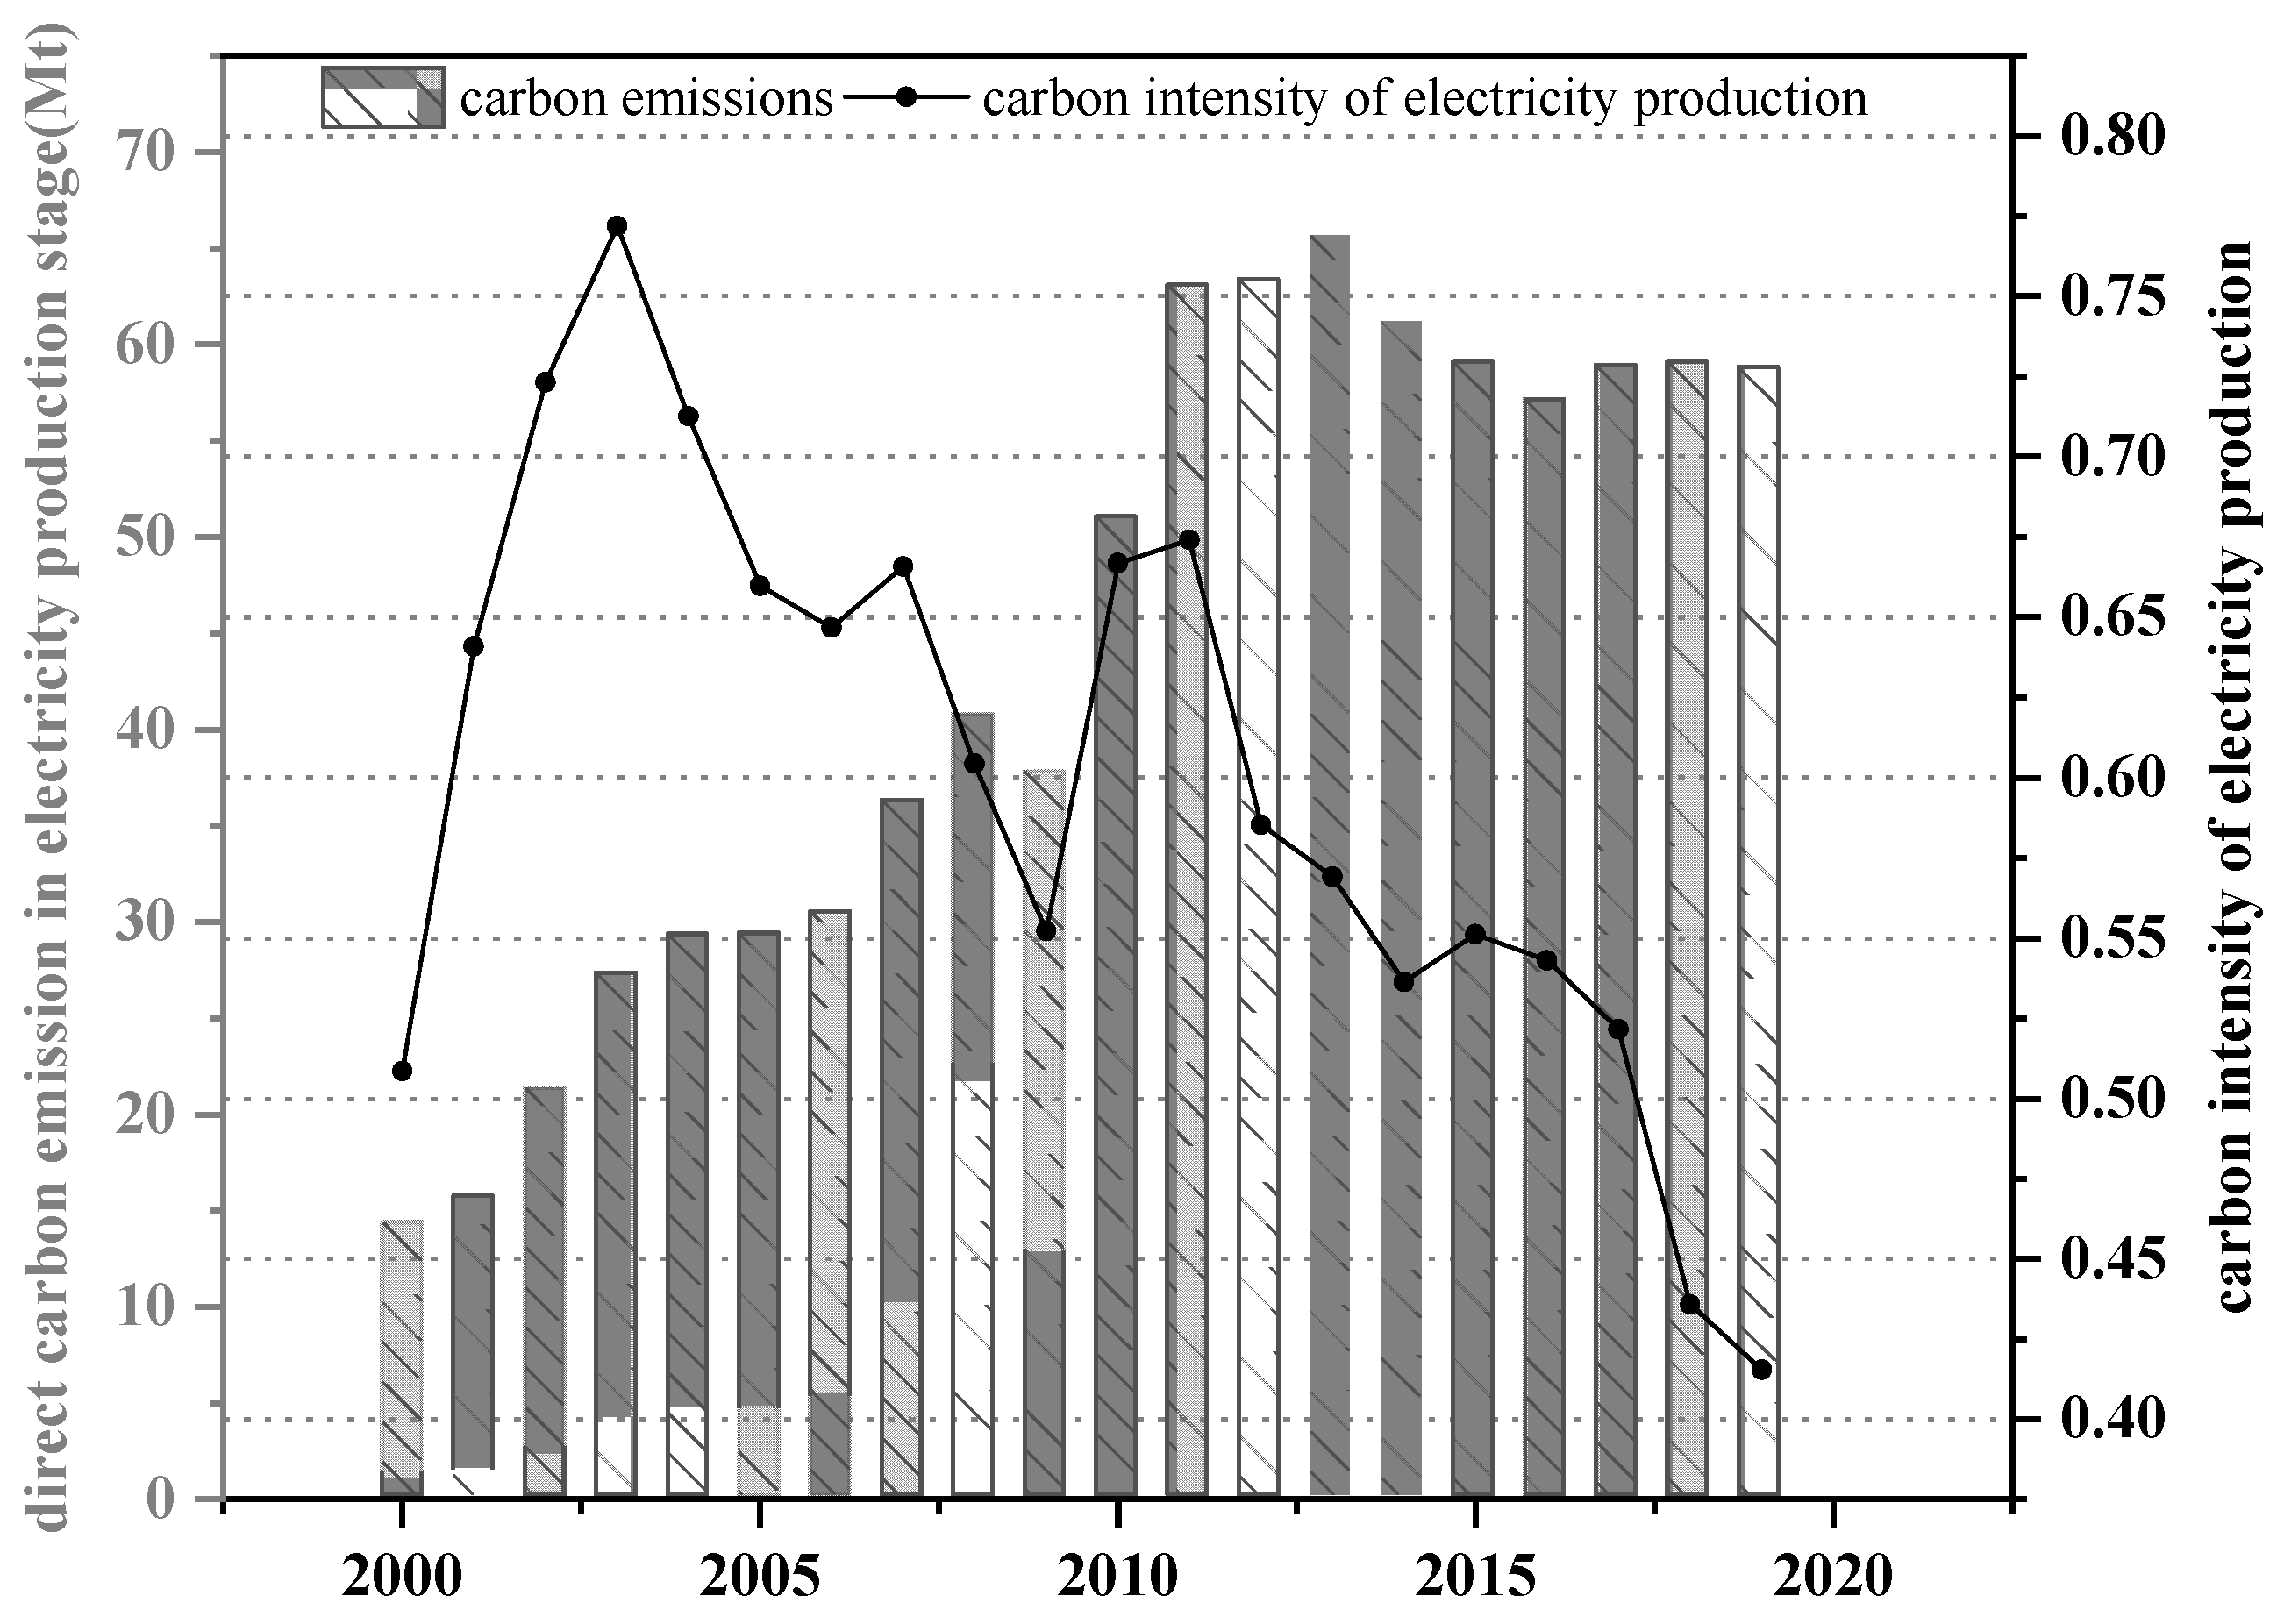
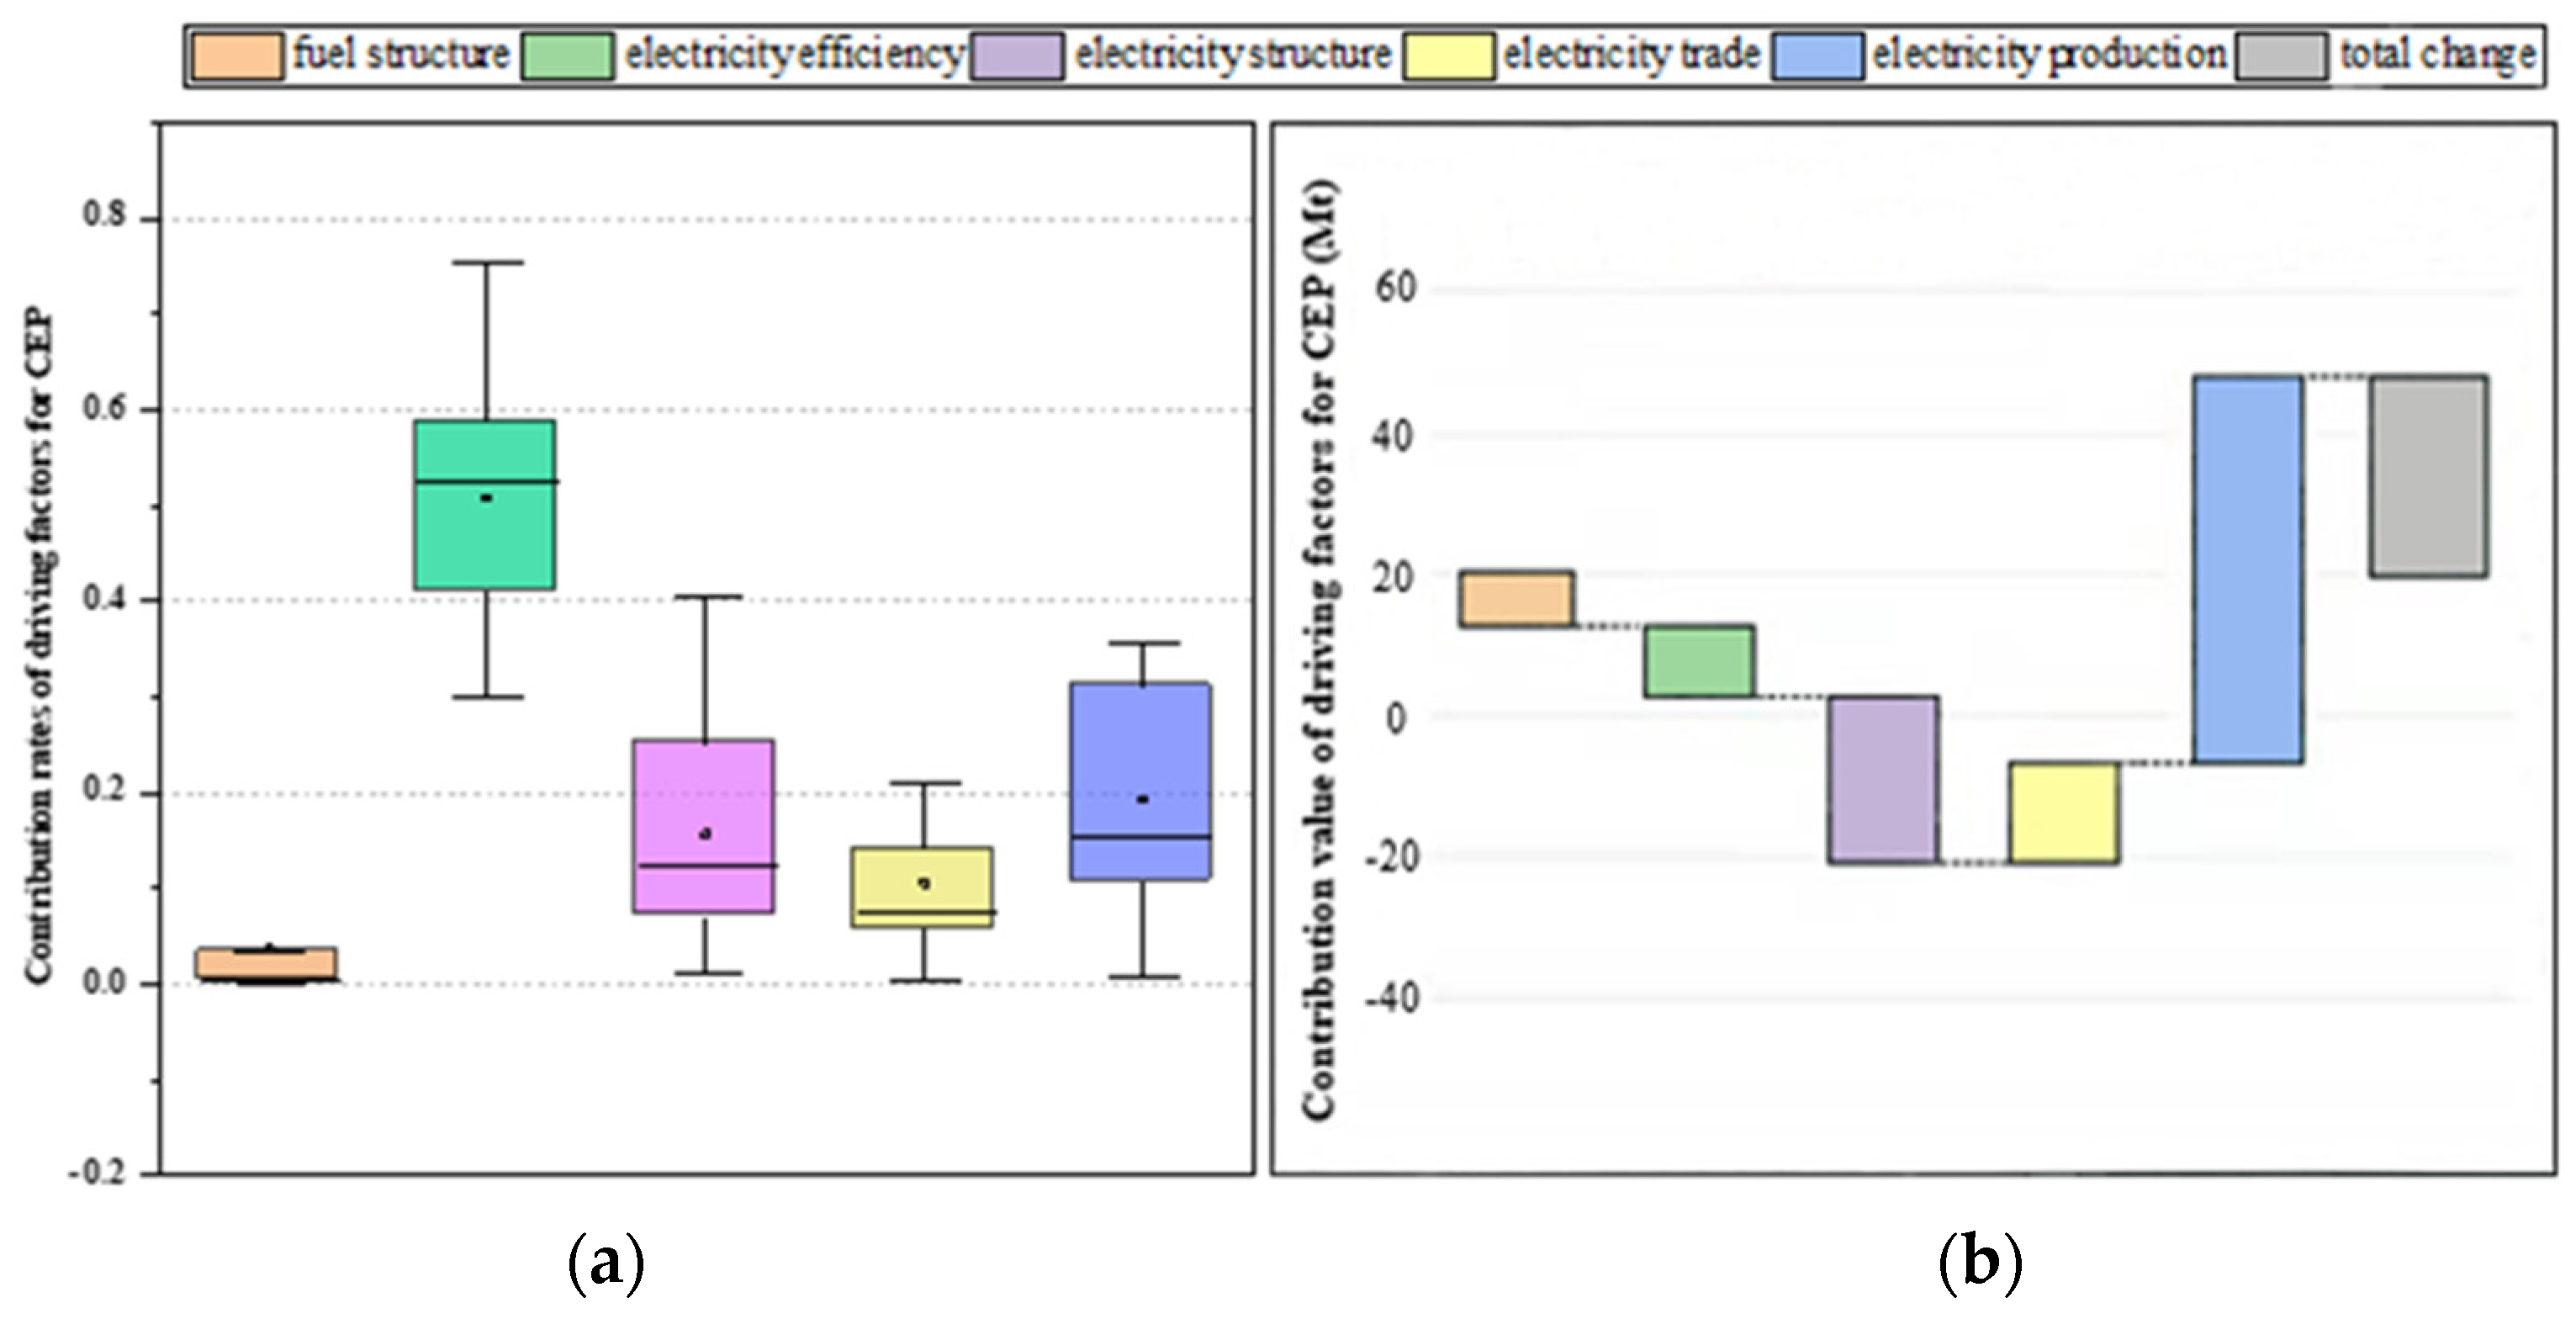
4.2.1. Electricity Production Stage

The box chart of the annual contribution rate distribution of direct carbon emission growth in the power production stage in Gansu Province from 2000 to 2019 is shown in Figure 6a: the box plot shows the distribution of contributions of these five elements to the growth of direct carbon emissions in the power production stage of Gansu Province, including the maximum value, upper quarter value, median value, lower quarter value, and minimum value, respectively. After LMDI decomposition analysis, the results showed that the direct carbon emissions from power production in Gansu Province increased by 28.17 Mt from 2000 to 2019, equivalent to more than two times of carbon emissions in 2000. Among the five driving factors, electricity generation was the main factor that contributed to the increase of about 55.14 Mt of carbon dioxide emissions in the power generation stage. The electricity trade also promoted about 14.14 Mt of carbon dioxide emissions. On the contrary, the change in the fuel structure, electricity efficiency, and electricity structure effectively inhibited the increase in power carbon emissions, with a cumulative inhibition effect of −27.09%, −35.07%, and −83.78%, respectively. From 2000 to 2019, the change in the fuel structure, electricity efficiency, and electricity structure reduced the carbon emissions by 7.63 Mt, 9.88 Mt, and 23.6 Mt, respectively (Figure 6a). This played an irreplaceable role in Gansu Province’s carbon dioxide emission reduction target.

4.2.2. Electricity Transmission Stage

The change in embodied carbon emissions is affected by the network loss rate and voltage level, transmission line, and transmission quantity in electricity transmission. The decomposition results of SDA showed that with the decrease in the integrated network loss rate yearly, the network loss rate had an inhibitory effect on the growth of carbon emissions in the power transmission stage. According to the data availability, 220 kV, 330 kV, and 750 kV voltage had a positive contribution of 11.24%, 9.81%, and 3.23% to carbon emissions in the transmission stage, respectively, and the cumulative contribution rates of transmission lines and electricity transmission were 3.94% and 61.26% (Figure 7a). Among the above driving factors, the increase in electricity transmission was the main driving force of carbon emission growth in this stage. At the same time, the change in the integrated network loss rate accumulatively offset 1.38 Mt of carbon dioxide emissions (Figure 7b). It can also be seen from the decomposition results that with the increase in the voltage level, the promoting effect on carbon emissions in this stage gradually decreased. Especially from 2007 to 2019, the construction of a 750 kV power grid structure increased year by year, and the power grid structure was gradually optimized and improved. Some new projects were into operation, which strengthened the power transmission and distribution structure of Gansu Province to a certain extent and improved the ability to optimize the allocation of large-scale power resources. All these measures directly improved the mutual supply and transfer capacity between regional power grids so that that power grids could operate safely.

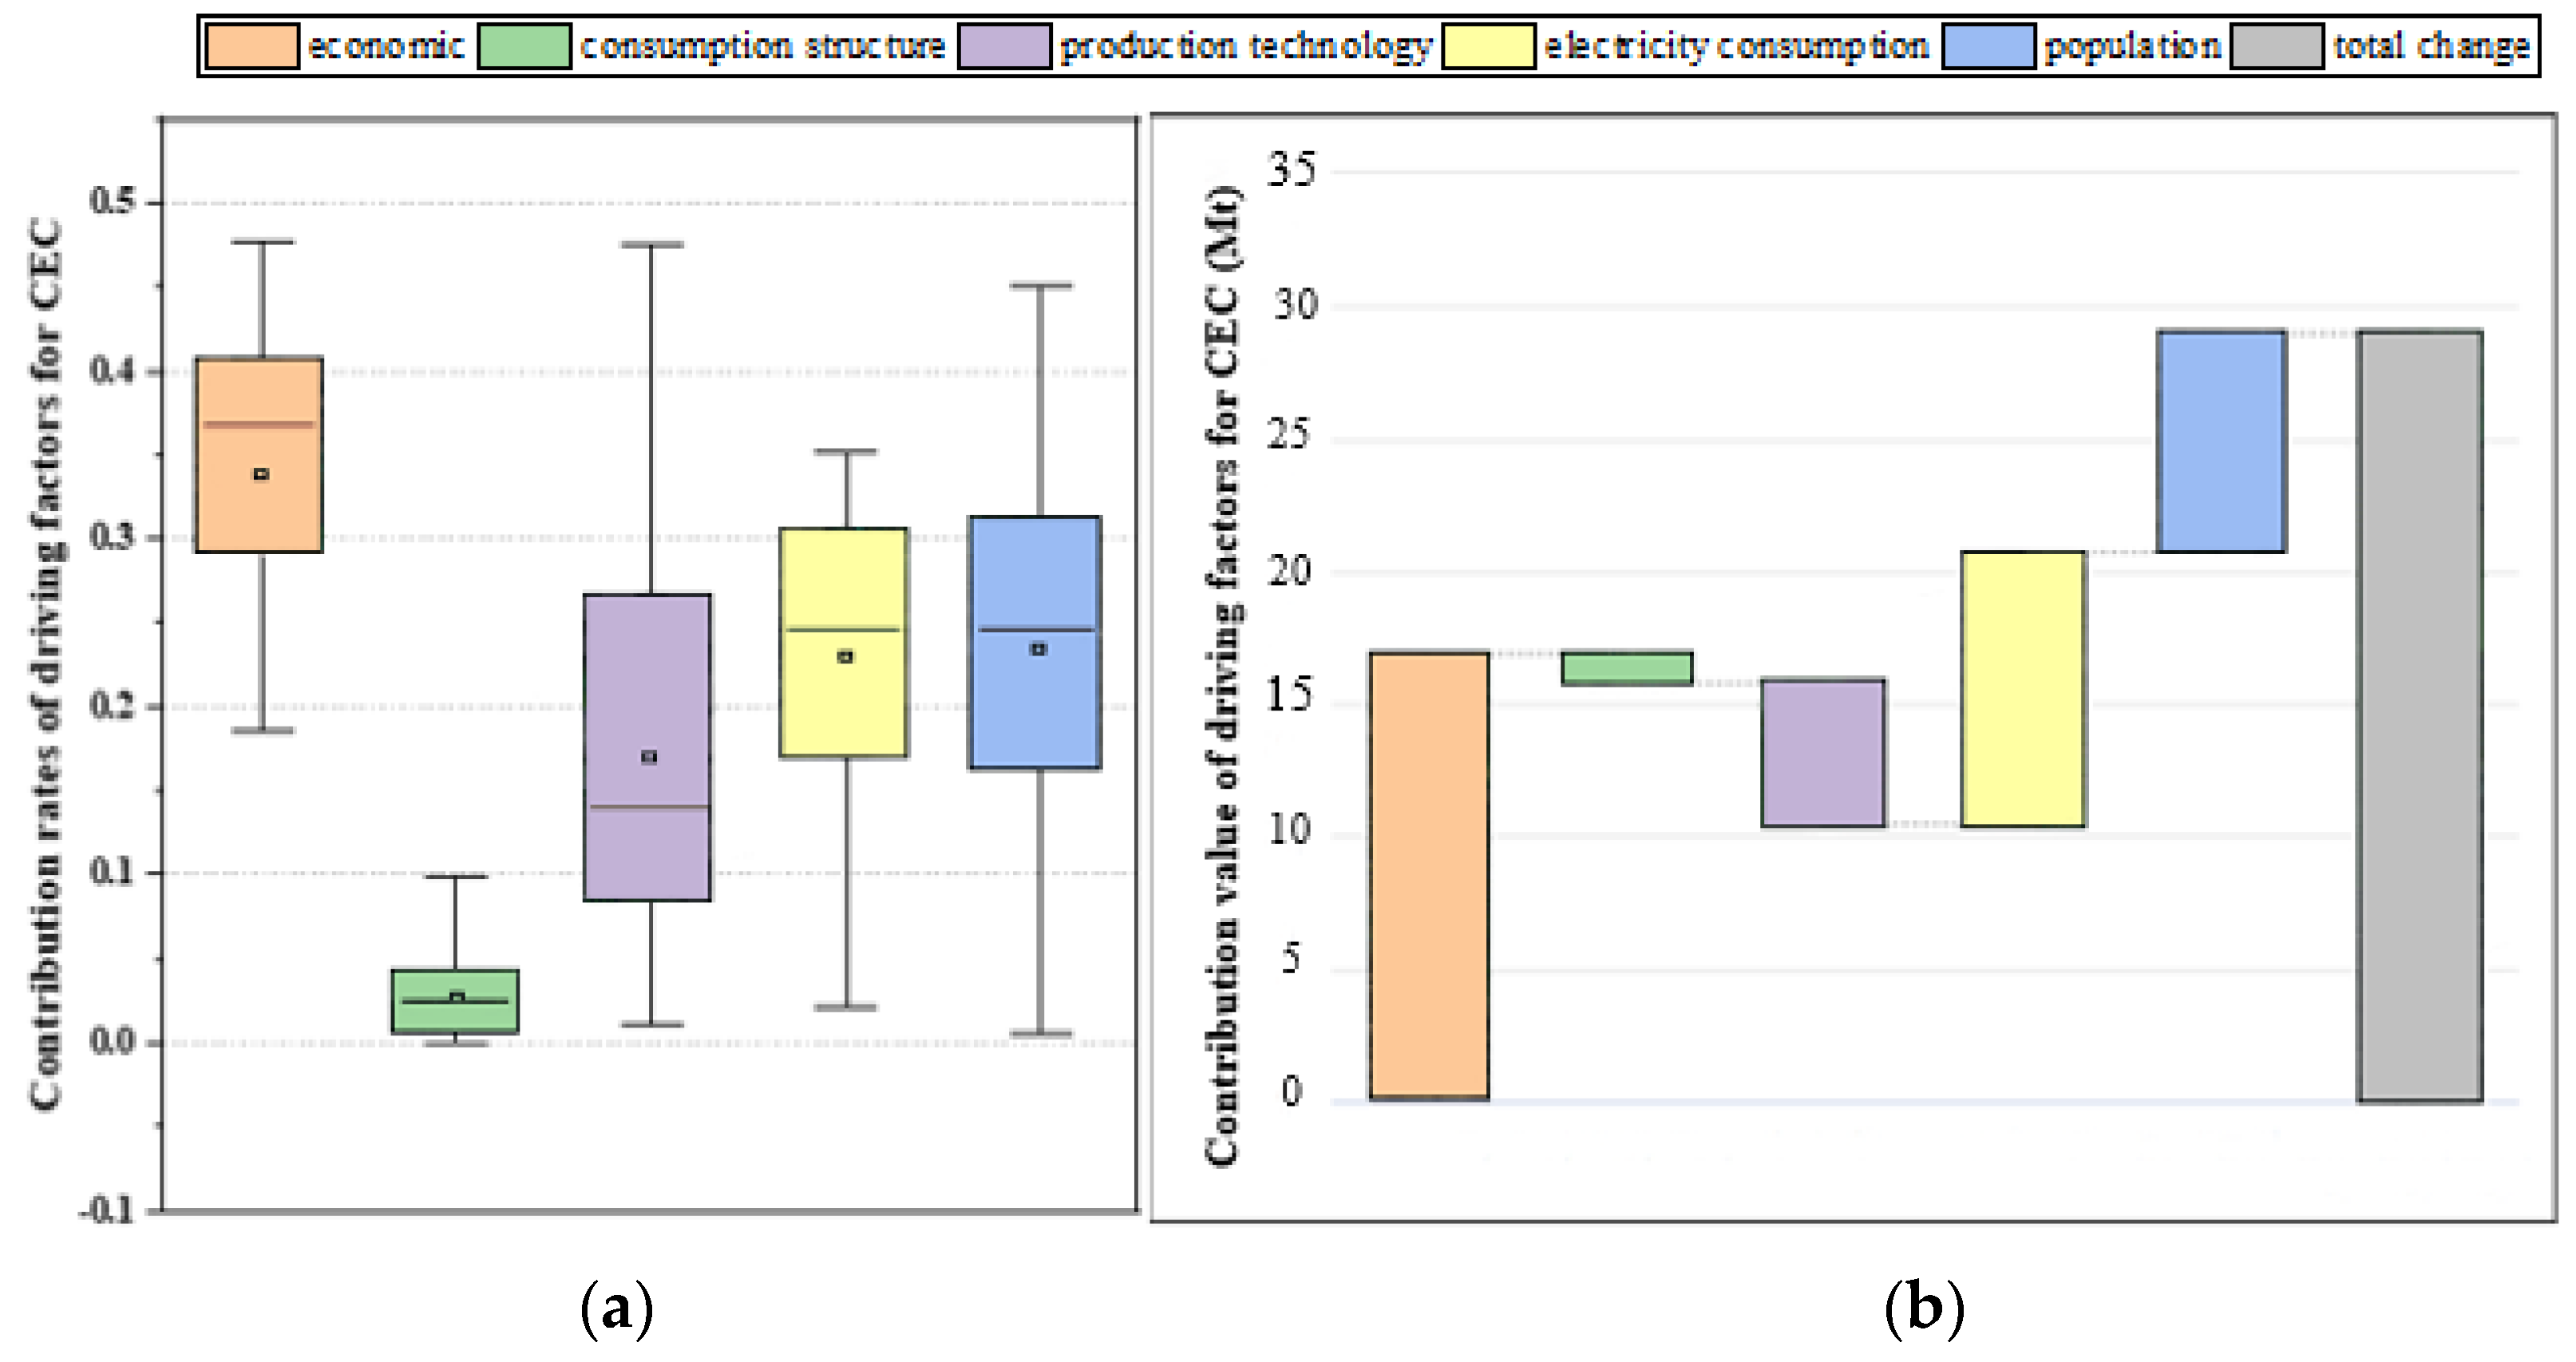
4.2.3. Electricity Consumption Stage

The box chart of the annual contribution rate distribution of the five factors mentioned above (Equation (9)) to the growth of implied carbon emissions in the power consumption stage in Gansu Province during 2000–2019 is shown in Figure 8a. From 2000 to 2019, the cumulative contribution rate of economic effect to the growth of implied carbon emissions in the power consumption stage was 40.17% and the average contribution rate was 36.3%. The driving effect of the consumption structure on the growth of carbon emissions from power consumption reflects the comprehensive results of a series of measures in Gansu Province in the past 20 years, such as the transformation of economic development in different industries, energy saving and electricity saving, and the improvement of the electrification level, so structural adjustment to a considerable extent offset the driving effect of GDP growth on carbon emissions from power consumption. From 2000 to 2019, the cumulative contribution rate of population growth to power consumption was 19.66% and the annual average contribution rate was 23.65%. In the past 20 years, the annual growth rate of the population in Gansu Province has been at a low level. The total population increased from 25.15 million in 2000 to 25.6 million at the peak of the permanent population in the past 20 years in 2010 and then decreased to 25.09 million in 2019. Under the new population policy recently issued, the average annual population growth rate of Gansu Province may increase in the future, and the driving effect of population factors on the growth of electricity consumption is expected to weaken in the future.
The cumulative contribution rate of electricity consumption is 24.63%, consistent with the continuous improvement of residents’ living standards in recent years. According to the data analysis results, the driving effect of social electricity consumption in Gansu Province on the growth of total electricity consumption was gradually enhanced, indirectly promoting the increase in carbon emissions from consumption.

5. Discussion

5.1. What Is the Root Cause of Carbon Emission Reduction in the Gansu Province Power System?

As a substantial new energy base in China, Gansu Province is also a significant ecological security barrier in western China. It has significant advantages in resources, location, and access, especially wind resources, with an excellent base, scale, and integration conditions. In recent years, the electricity generation structure of Gansu Province has been changing, with the proportion of fossil fuel energy gradually decreasing; renewable energy, such as wind and solar energy, increasing; and carbon emissions from the electricity system constantly reducing.
The results showed above can be explained from the following four aspects: First, with the cooperation of the government, environmental protection departments, and enterprises, and based on ensuring the safe and stable supply of electricity in the province, ultra-low emission transformation of coal-fired thermal power units is carried out. Second, Gansu Province has adopted a series of policies and measures to shut down coal-fired units with a capacity of less than 300,000 kW that fail to meet environmental protection, energy consumption, and safety standards and allow trades or swaps for the indicators of installed capacity of shutting down units, coal consumption, and pollutant emissions, while building low-emission coal-fired units with similar capacity. These measures are beneficial to improve the efficiency of electricity generation and reduce the carbon emission intensity of the electricity system in Gansu Province. Third, in recent years, Gansu Province has made great efforts to control air pollution in some key areas, such as replacing coal with gas, adjusting the energy structure, preventing dust, and reducing industrial emissions. Fourth, the installed capacity of new energy has continued to increase. By 2019, Gansu Province had a full-caliber installed capacity of 52.6798 million kW; the thermal electricity installed capacity was 21.04 million kW, accounting for 39.9%; hydropower was 9.43 million kW, accounting for 17.9%; and new energy was 22.21 million kW, accounting for 42.2% of the total installed capacity. The installed capacity of new energy exceeded thermal electricity by 1.17 million kW, becoming the most prominent electricity source in Gansu Province. By the end of 2021, Gansu Province’s installed capacity of new energy reached 28.97 million kW, accounting for 47.08% of the total installed capacity. In 2021, Gansu Province generated 44.6 billion kWH of new energy, equivalent to saving 17.8 Mt of standard coal and reducing carbon dioxide by 45 Mt, ranking third in China.

5.2. Future Trends in the Contribution of Major Drivers

According to the 14th Five-Year Plan of Gansu Province, electricity consumption will increase along with population growth and economic level, and electricity production will also increase to meet social needs. Electricity exchange and trade between provinces will promote the development of electricity CO2 emissions. The carbon emission plan in the electricity sector will reach a peak early by 2025. Gansu Province should focus on the decrease in a focused area and critical industries in the face of tremendous abatement pressure. The electricity sector should continue to promoting the construction of a new energy base, make good use of opportunities to optimize the distribution of national power transmission channels, exploit the market for electricity dissipation outside of the province, construct large channels for electricity delivery supported by multiple back high-voltage transmission lines, enhance the development of a new energy infrastructure, continue to improve the capacity of electricity delivery, and enhance the supply capacity and local conversion efficiency of clean energy bases; only in this way can China achieve its goal of “carbon peak and neutrality.”

6. Conclusions and Policy Implications

6.1. Conclusions

This study used the IPCC carbon inventory and the power grid carbon dioxide emission factor method to account for carbon emissions based on the electricity production, transmission, and consumption stages in 2000–2019 in Gansu Province. In addition, we analyzed the drivers of electricity-related carbon emissions in these three stages with LMDI and SDA. The main conclusions are as follows:
  • Direct carbon emissions during the stage of electricity production had the largest share of the entire electricity life cycle, and they accounted for 45.42% of total carbon emissions in Gansu Province.
  • From the perspective of the cumulative contribution rate, electricity consumption and the electricity trade promoted carbon emissions in the stage of electricity production; the power structure, electricity efficiency, and fuel structure had opposite effects.
  • In the stage of electricity transmission, the higher the voltage level, the lower the net loss rate, and high-voltage-level transmission lines effectively reduced the growth of implied carbon emissions.
  • Industrial restructuring and technological advances effectively offset the growth in carbon emissions due to population, economy, and electricity consumption.

6.2. Policy Implications

Based on the above analysis results, we proposed several policy recommendations to promote the low-carbon sustainable development of the electricity system in Gansu Province as much as possible.
  • Make full use of Gansu Province’s abundant new energy resources to promote clean, low-carbon, safe, and efficient energy. To develop and use wind, solar, and other new energy, optimize the function positioning of thermal power to gradually transform from the primary power source into the fundamental power source for power guarantee and peak regulation.
  • Combined with the national energy development plan, the strategy of electricity transmission from the west to the east, the policy of a renewable energy quota system and distribution, and the development potential of new energy resources in Gansu Province, to facilitate the early realization of the “double carbon” goal, the total installed scale of new energy in Gansu Province will achieve leapfrog development and form a large deliverable base of clean energy. Therefore, will the carbon dioxide from thermal power generation sent to other provinces be classified within Gansu or other provinces? With the development of the carbon trading market and more high-carbon emission industries entering the market, the reasonable allocation of the carbon quota will significantly impact realizing the “double carbon” goal in Gansu Province. Gansu Province should promote the upgrade of the electricity grid to the energy internet to strengthen construction, such as extensive data in electricity generation, electricity consumption, and trans-provincial electricity transmission; support policy research and quota calculation of the national carbon market; build a platform for optimal allocation of clean energy and take both supply and demand into consideration; and coordinate energy and electricity development with energy conservation and carbon reduction targets through market hands.
  • To accelerate the building of a solid and intelligent grid to ensure timely grid connection and consumption of new energy, strengthen the construction of electricity transmission channels, promote the establishment of a long-term mechanism for inter-provincial power transmission, and reduce the growth of hidden carbon emissions during large-scale and long-distance transmission of clean energy through the construction of ultrahigh transmission lines.
  • Optimize the industrial structure and strengthen the critical industries for energy saving and emission reduction. Promote intelligent green upgrading in key industries, such as smelting, cement, and petrochemical industries, and actively develop and expand strategic new sectors, such as new energy, new materials, and high-end equipment manufacturing, to accelerate the process of industrial carbon reduction. Strengthen power technology innovation; accelerate the development of large-volume, high-density, high-safety, and low-cost energy storage devices; and promote clean energy use and high efficiency.

Author Contributions

Conceptualization, F.Q.; Data curation, W.S. and W.T.; Formal analysis, Z.S.; Investigation, W.T.; Methodology, W.T.; Visualization, S.Z.; Writing—review & editing, C.W. All authors have read and agreed to the published version of the manuscript.

Funding

This work is supported by the Gansu Provincial Scientific Development Foundation, China (grant no. 21YF5FA028), the Higher Education Innovation Fund Projects in Gansu Province (grant no. 2021B-087), and the Improving Young Teachers’ Scientific Research Ability Project in Northwest Normal University (grant no. NWNU-SKON2021-22).

Institutional Review Board Statement

Not applicable.

Informed Consent Statement

Not applicable.

Data Availability Statement

Not applicable.

Conflicts of Interest

The authors declare no conflict of interest.

References

  1. Lin, B.; Xu, B. How does fossil energy abundance affect China’s economic growth and CO2 emissions? Sci. Total Environ. 2020, 719, 137503. [Google Scholar] [CrossRef] [PubMed]
  2. Mi, Z.; Zheng, J.; Meng, J.; Zheng, H.; Li, X.; Coffman, D.; Woltjer, J.; Wang, S.; Guan, D. Carbon emissions of cities from a consumption-based perspective. Appl. Energy 2018, 235, 509–518. [Google Scholar] [CrossRef] [Green Version]
  3. Zoldy, M.; Szalmane Csete, M.; Kolozsi, P.P.; Bordas, P.; Torok, A. Cognitive Sustainability. Cogn. Sustain. 2022, 1. [Google Scholar] [CrossRef]
  4. Wang, B.; Ji, F.; Zheng, J.; Xie, K.; Feng, Z. Carbon emission reduction of coal-fired power supply chain enterprises under the revenue sharing contract: Perspective of coordination game. Energy Econ. 2021, 102, 105467. [Google Scholar] [CrossRef]
  5. Peng, J.; Xie, R.; Lai, M. Energy-related CO2 emissions in the China’s iron and steel industry: A global supply chain analysis. Resour. Conserv. Recycl. 2018, 129, 392–401. [Google Scholar] [CrossRef]
  6. Peng, X.; Tao, X.; Zhang, H.; Chen, J.; Feng, K. CO2 emissions from the electricity sector during China’s economic transition: From the production to the consumption perspective. Sustain. Prod. Consum. 2021, 27, 1010–1020. [Google Scholar] [CrossRef]
  7. Shan, Y.; Liu, Z.; Guan, D. CO2 emissions from China’s lime industry. Appl. Energy 2016, 166, 245–252. [Google Scholar] [CrossRef]
  8. Chen, L.; Wemhoff, A.P. Predicting embodied carbon emissions from purchased electricity for United States counties. Appl. Energy 2021, 292, 116898. [Google Scholar] [CrossRef]
  9. Shi, K.; Yang, Q.; Fang, G.; Yu, B.; Chen, Z.; Yang, C.; Wu, J. Evaluating spatiotemporal patterns of urban electricity consumption within different spatial boundaries: A case study of Chongqing, China. Energy 2019, 167, 641–653. [Google Scholar] [CrossRef]
  10. Wei, W.; Wang, X.; Zhu, H.; Li, J.; Zhou, S.; Zou, Z. Carbon emissions of urban power grid in Jing-Jin-Ji region: Characteristics and influential factors. J. Clean. Prod. 2017, 168, 428–440. [Google Scholar] [CrossRef]
  11. Tong, D.; Zhang, Q.; Davis, S.; Liu, F.; Zheng, B.; Geng, G.; Xue, T.; Li, M.; Hong, C.; Lu, Z.; et al. Targeted emission reductions from global super-polluting power plant units. Nat. Sustain. 2018, 1, 59–68. [Google Scholar] [CrossRef] [Green Version]
  12. Tranberg, B.; Corradi, O.; Lajoie, B.; Gibon, T.; Staffell, I.; Andresen, G.B. Real-time carbon accounting method for the European electricity markets. Energy Strategy Rev. 2019, 26, 100367. [Google Scholar] [CrossRef]
  13. Zhang, P.; Cai, W.; Yao, M.; Wang, Z.; Yang, L.; Wei, W. Urban carbon emissions associated with electricity consumption in Beijing and the driving factors. Appl. Energy 2020, 275, 115425. [Google Scholar] [CrossRef]
  14. Shang, W.; Pei, G.; Walsh, C.; Meng, M.; Meng, X. Have Market-oriented Reforms Decoupled China’s CO2 Emissions from Total Electricity Generation? An Empirical Analysis. Sustainability 2016, 8, 468. [Google Scholar] [CrossRef] [Green Version]
  15. Ma, J.-J.; Du, G.; Xie, B.-C. CO2 emission changes of China’s power generation system: Input-output subsystem analysis. Energy Policy 2019, 124, 1–12. [Google Scholar] [CrossRef]
  16. Wei, W.; Hao, S.; Yao, M.; Chen, W.; Wang, S.; Wang, Z.; Wang, Y.; Zhang, P. Unbalanced economic benefits and the electricity-related carbon emissions embodied in China’s interprovincial trade. J. Environ. Manag. 2020, 263, 110390. [Google Scholar] [CrossRef]
  17. Shan, Y.; Guan, D.; Zheng, H.; Ou, J.; Li, Y.; Meng, J.; Mi, Z.; Liu, Z.; Zhang, Q. China CO2 emission accounts 1997–2015. Sci. Data 2018, 5, 170201. [Google Scholar] [CrossRef] [Green Version]
  18. Wang, F.; Shackman, J.; Liu, X. Carbon emission flow in the power industry and provincial CO2 emissions: Evidence from cross-provincial secondary energy trading in China. J. Clean. Prod. 2017, 159, 397–409. [Google Scholar] [CrossRef]
  19. Akpan, P.; Fuls, W. Cycling of coal fired power plants: A generic CO2 emissions factor model for predicting CO2 emissions. Energy 2021, 214, 119026. [Google Scholar] [CrossRef]
  20. Du, M.; Wang, X.; Peng, C.; Shan, Y.; Chen, H.; Wang, M.; Zhu, Q. Quantification and scenario analysis of CO2 emissions from the central heating supply system in China from 2006 to 2025. Appl. Energy 2018, 225, 869–875. [Google Scholar] [CrossRef] [Green Version]
  21. Mishra, M.K.; Khare, N.; Agrawal, A.B. Scenario analysis of the CO2 emissions reduction potential through clean coal technology in India’s power sector: 2014–2050. Energy Strategy Rev. 2015, 7, 29–38. [Google Scholar] [CrossRef]
  22. Wei, W.; Zhang, P.; Yao, M.; Xue, M.; Miao, J.; Liu, B.; Wang, F. Multi-scope electricity-related carbon emissions accounting: A case study of Shanghai. J. Clean. Prod. 2020, 252, 119789. [Google Scholar] [CrossRef]
  23. Lin, B.; Du, Z. How China’s urbanization impacts transport energy consumption in the face of income disparity. Renew. Sustain. Energy Rev. 2015, 52, 1693–1701. [Google Scholar] [CrossRef]
  24. Sung, W.-P.; Tsai, T.-T.; Wang, H.-J.; Wu, M.-J. Analysis of energy and carbon dioxide emission caused by power consumption. Int. J. Energy Res. 2011, 35, 1014–1022. [Google Scholar] [CrossRef]
  25. Zhang, T.; Song, Y.; Yang, J. Relationships between urbanization and CO2 emissions in China: An empirical analysis of population migration. PLoS ONE 2021, 16, e0256335. [Google Scholar] [CrossRef]
  26. Sun, W.; Cai, H.; Wang, Y. Refined Laspeyres Decomposition-Based Analysis of Relationship between Economy and Electric Carbon Productivity from the Provincial Perspective—Development Mode and Policy. Energies 2018, 11, 3426. [Google Scholar] [CrossRef] [Green Version]
  27. Karmellos, M.; Kosmadakis, V.; Dimas, P.; Tsakanikas, A.; Fylaktos, N.; Taliotis, C.; Zachariadis, T. A decomposition and decoupling analysis of carbon dioxide emissions from electricity generation: Evidence from the EU-27 and the UK. Energy 2021, 231, 120861. [Google Scholar] [CrossRef]
  28. Chen, G.; Hou, F.; Li, J.; Chang, K. Decoupling analysis between carbon dioxide emissions and the corresponding driving forces by Chinese power industry. Environ. Sci. Pollut. Res. Int. 2021, 28, 2369–2378. [Google Scholar] [CrossRef]
  29. Rong, Y.; Jia, J.; Ju, M.; Chen, C.; Zhou, Y.; Zhong, Y. Multi-Perspective Analysis of Household Carbon Dioxide Emissions from Direct Energy Consumption by the Methods of Logarithmic Mean Divisia Index and σ Convergence in Central China. Sustainability 2021, 13, 9285. [Google Scholar] [CrossRef]
  30. Fell, H.; Johnson, J.X. Regional disparities in emissions reduction and net trade from renewables. Nat. Sustain. 2021, 4, 358–365. [Google Scholar] [CrossRef]
  31. Wang, W.-Z.; Liu, L.-C.; Liao, H.; Wei, Y.-M. Impacts of urbanization on carbon emissions: An empirical analysis from OECD countries. Energy Policy 2021, 151, 112171. [Google Scholar] [CrossRef]
  32. Su, B.; Ang, B.W.; Li, Y. Input-output and structural decomposition analysis of Singapore’s carbon emissions. Energy Policy 2017, 105, 484–492. [Google Scholar] [CrossRef]
  33. Ang, B.W. Decomposition analysis for policymaking in energy. Energy Policy 2004, 32, 1131–1139. [Google Scholar] [CrossRef]
  34. Chontanawat, J.; Wiboonchutikula, P.; Buddhivanich, A. An LMDI decomposition analysis of carbon emissions in the Thai manufacturing sector. Energy Rep. 2020, 6, 705–710. [Google Scholar] [CrossRef]
  35. Wang, L.; Wang, Y.; He, H.; Lu, Y.; Zhou, Z. Driving force analysis of the nitrogen oxides intensity related to electricity sector in China based on the LMDI method. J. Clean. Prod. 2020, 242, 118364. [Google Scholar] [CrossRef]
  36. Ang, B.W.; Liu, N. Handling zero values in the logarithmic mean Divisia index decomposition approach. Energy Policy 2007, 35, 238–246. [Google Scholar] [CrossRef]
  37. Hasan, M.M.; Chongbo, W. Estimating energy-related CO2 emission growth in Bangladesh: The LMDI decomposition method approach. Energy Strategy Rev. 2020, 32, 100565. [Google Scholar] [CrossRef]
  38. Zhang, W.; Tang, X.; Yang, G.; Zha, D. Decomposition of CO2 emission intensity in Chinese MIs through a development mode extended LMDI method combined with a production-theoretical approach. Sci. Total Environ. 2020, 702, 134787. [Google Scholar] [CrossRef]
  39. Yasmeen, H.; Wang, Y.; Zameer, H.; Solangi, Y.A. Decomposing factors affecting CO2 emissions in Pakistan: Insights from LMDI decomposition approach. Environ. Sci. Pollut. Res. Int. 2020, 27, 3113–3123. [Google Scholar] [CrossRef]
  40. Cai, W.; Song, X.; Zhang, P.; Xin, Z.; Zhou, Y.; Wang, Y.; Wei, W. Carbon emissions and driving forces of an island economy: A case study of Chongming Island, China. J. Clean. Prod. 2020, 254, 120028. [Google Scholar] [CrossRef]
  41. Kim, Y.-G.; Yoo, J.; Oh, W. Driving forces of rapid CO2 emissions growth: A case of Korea. Energy Policy 2015, 82, 144–155. [Google Scholar] [CrossRef]
  42. Li, J.; Wei, W.; Zhen, W.; Guo, Y.; Chen, B. How Green Transition of Energy System Impacts China’s Mercury Emissions. Earth’s Future 2019, 7, 1407–1416. [Google Scholar] [CrossRef] [Green Version]
  43. Liang, S.; Zhang, T. What is driving CO2 emissions in a typical manufacturing center of South China? The case of Jiangsu Province. Energy Policy 2011, 39, 7078–7083. [Google Scholar] [CrossRef]
Figure 1. Schematic of the study area.
Energies 15 03560 g001
Figure 2. Electricity structures in Gansu Province from 2000 to 2019.
Energies 15 03560 g002
Figure 3. Total carbon emissions in Gansu Province and direct carbon emissions from the electricity sector from 2000 to 2019.
Energies 15 03560 g003
Figure 4. Power generation and carbon emissions from different power generation structures in Gansu Province during 2000–2019.
Energies 15 03560 g004
Figure 5. Carbon emissions from power production and carbon emission intensity in Gansu Province during 2000–2019.
Energies 15 03560 g005
Figure 6. Contribution rates and contribution value of driving factors for CEP. (a) Contribution rates of driving factors for CEP. (b) Contribution value of driving factors for CEP.
Energies 15 03560 g006
Figure 7. Contribution rates and contribution value of driving factors for CET. (a) Contribution rates of driving factors for CET. (b) Contribution value of driving factors for CET.
Energies 15 03560 g007
Figure 8. Contribution rates and contribution value of driving factors for CEC. (a) Contribution rates of driving factors for CEC. (b) Contribution value of driving factors for CEC.
Energies 15 03560 g008
Table 1. Calculation parameters of carbon emissions for different types of fossil fuel energy.
Types of EnergyRaw CoalCokeCrude OilGasolineKeroseneDieselNatural GasFuel Oil
Discounted standard coal coefficient (104 tce/104 t)0.71430.97141.42861.47141.47141.45711.33001.4286
Carbon emission coefficient (104 t/104 tce)0.75590.85500.58570.55380.57140.59210.44830.6185
Table 2. Definition of various variables in Equation (3).
VariablesDefinition
E G y Total net electricity generation in Gansu Province in year y (MWh)
F C i , y Total fuel consumption of the generator set in year y (The quality unit)
N C V i , y Average low calorific value of fuel i in year y (GJ/The quality unit)
E F i , y CO2 emission factor of fuel i in year y (t CO2/GJ)
i Type of fossil fuels consumed by power generation in the Gansu Province power system in year y
y year
Publisher’s Note: MDPI stays neutral with regard to jurisdictional claims in published maps and institutional affiliations.

