1. Introduction
There has been a notable shift in how energy is generated, distributed, and consumed, namely with the increase in distributed energy resources (DER) and the active participation of prosumers who are both power consumers and producers [
1]. The proliferation of prosumers reflects investments in the energy transition to renewable energy sources (RES) [
2]. However, it provides new challenges, requiring decentralization and flexibility in the energy market and also innovative market methods for price setting and infrastructure management. Additionally, due to the intermittent nature of renewable energy generation, prosumers find themselves in a situation where they can store their surplus energy for later use, export it to the electrical grid, or share and sell energy directly to another consumer. This, in turn, created the demand to design local energy markets with the intention to trade directly between producers and consumers (peers), overcoming the need for intermediaries [
3]. Based on the concept of energy sharing, peer-to-peer (P2P) energy trading has experienced tremendous growth, becoming an alternative to the conventional energy trading market. In P2P markets, prosumers share their excess generation or their flexibility of energy demand with others in exchange for a reduced fee compared to conventional utility company fees, resulting in benefits for both producers and consumers of energy [
4].
The application of energy sharing models can also benefit the concept of energy communities that is currently in expansion, which is addressed in several scientific publications [
5]. At the European level, the Directive (EU) 2019/944 of the European Parliament and of the Council of 5 June 2019 on common rules for the internal market for electricity opened the path toward the existence of citizen energy communities [
6]. The possibility of close collaboration among energy consumers promotes the direct transaction of energy between them. This turns the use of peer-to-peer energy transactions into a viable solution to increase the stability and sustainability of energy communities.
Although seen as beneficial solutions, the energy sharing models are heavily dependent on forecasting models. Usually, papers only focus on energy forecasting or on energy sharing models, without properly analysing the impact of this dependency. To address this issue, this paper presents an impact analysis of the use of forecasting algorithms in energy sharing. This study will use four forecasting algorithms, namely a mathematical model, a support-vector machine model, an eXtreme Gradient Boosting model, and a TabNet model, that were already proposed in the literature and their output will be used for the transaction of energy in an hour-ahead approach. This paper will use a peer-to-peer energy transaction model based on auctions. The energy transaction model was selected from the study of [
7], and the model chosen was the discriminatory-price auction (DPA). The forecasting models together with the energy transaction model were deployed in the Microgrid Intelligent Management System (µGIM) to enable the creation of a virtual energy community with eight customers: five small commerce and three households. The customer buildings do not share physical grids or resources, but they are connected by µGIM to enable the testing and validation of energy transaction models.
The main motivation of this paper can be expressed in the following research question: Does the error of forecasting algorithms affect the economic performance of end-users in local peer-to-peer energy markets?
To provide an answer to this question, the authors made use of their own previously proposed systems, tools, and models that were not yet put together as a unique solution. Therefore, this paper not only analyses the results but also provides a description on how these systems and models were integrated in order to provide a testbed using real households and offices.
The results show the energy shared in a week, based on the auction of energy among the community’s members. Considering both energy forecasting models, the results show an energy cost reduction of around 10% within the community ranging from 0.24% to 57.43% per end-user. The use of both energy forecasting models demonstrates that, depending on the choices of the end-user, the suitable energy forecasting model can vary. However, the results are clear: the smaller the forecast error is, the greater the reduction in energy costs.
After this first Introduction section, this paper is structured as follows.
Section 2 presents the materials and methods used to evaluate the impact of forecasts in peer-to-peer energy transactions.
Section 3 presents the case study and the results obtained during a week period. The discussion of results is presented in
Section 4 while the main conclusions of this paper are described in
Section 5.
2. Related Works
Transactive energy is a broad term that encompasses a variety of end-user participation processes and methodologies, including P2P transactions, local markets, and demand response [
8]. From transmission to distribution, they can be used at any level of the smart grid to promote the balance between consumption and generation [
9]. According to [
10], transactive energy can be characterised by four quadrants: top-down switching, centralised optimisation, price-reactive systems, and transactive control and coordination.
Upon reviewing various publications on P2P energy trading published in recent years, it was revealed that the methodologies most applied congregated into a few categories, such as auction, blockchain, and game theory. The auction-based theory has received much interest and is frequently used to solve several problems associated with P2P trading [
11]. Zhang et al. (2020) studied a P2P renewable energy trading system for microgrids where energy suppliers are outfitted with storage devices, and an iterative auction algorithm was applied to obtain the optimal time slot and energy allocation considering each supplier’s preference [
12]. On the other hand, Xu et al. (2021) studied a novel iterative uniform-price auction (IUPA) mechanism, where they compared the seller’s market and the buyer’s market to determine a reliable energy allocation and a uniform auction price [
13]. Prosumers then altered their bids iteratively until they attained Nash equilibrium.
The implementation of blockchain functions in P2P energy trading has grown in popularity, resulting in several works and publications demonstrating its effectiveness in virtual simulations [
14]. Matsuda et al. (2021) demonstrated the control and coordination of Plug-in Hybrid Electrical Vehicles (PHEVs) and Home Energy Management Systems (HEMS) using the blockchain system, resulting in a hybrid bidding system capable of securely and reliably distributing energy [
15]. While Takeda et al. (2021) made it feasible to trade electricity while considering the traders’ preferences, allowing transactions to be completed with little effort [
16]. The method was applied, completed automatically, to 19 homes and 9 plugin hybrid cars (PHV) in Higashi-Fuji, Japan. As a result, the study found that prosumers were able to sell their excess electricity and that consumers preferred to acquire renewable energy when possible. Yahaya et al. (2020) used blockchain technology in a local energy market supported by P2P transactions and load scheduling optimization, reducing electricity costs up to 65.17% [
17].
Game theory is a mathematical model widely utilised for local energy markets to solve intricate interactions between players [
18]. This technique is used to analyse strategic scenarios in which participants are free to pick the best economic outcome for themselves. Amin et al. (2020) provided a framework for P2P electricity trading that encompasses both non-cooperative and cooperative games while ensuring the stability of an IEEE 14-bus system with a total of 22 participants (11 prosumers and 11 consumers) [
19]. However, Malik et al. (2022) presented a cooperative game theory framework with 100 participants (50 prosumers and 50 consumers), a community energy storage system (CES), and 15 electric vehicle charging outlets [
20]. According to the economic analysis, prosumers were able to generate profit, while consumers minimise costs by adopting the algorithm.
A significant number of models can be found in the related works. These models were tested, usually by simulation, and were able to achieve good quality results. However, they fundamentally ignore, or do not properly address, the impact of forecasting algorithm in P2P models. The presented works apply P2P energy transactions in future periods; therefore, these models are supported by forecasting algorithms. Nonetheless, previous works do not analyse the impact or the effect that forecasting errors can have in P2P markets. In [
21], a P2P energy market model was deployed in a real environment and the authors identified the forecasting error as a variable that can impact the performance of the market as well as can have a significant impact in the economic result of each end-user. However, no further discussion was provided. To contribute to future P2P market models deployment, this paper assesses the impact of forecasting models in a P2P market. To do so, this paper will evaluate the performance of different forecasting models in an already proposed P2P model to assess if the forecasting errors can significantly impact the performance of the energy community members.
3. Materials and Methods
The main purpose of this paper is to test and evaluate the impact of forecasting models in peer-to-peer energy transactions. The testing and evaluation will use real data from real locations that are acquired using the previously proposed Microgrid Intelligent Management System (µGIM) [
22]. This system, as well as the forecasting models that will be presented, was proposed by the authors in their individual works. In this paper, the system and the models will be integrated and tested as a unique collaborative effort. Thus, it tests and analyses the impact of forecasting errors in a peer-to-peer energy market in a real case scenario.
µGIM allows the monitoring and control of buildings using internet of things (IoT) devices that are able to monitor and act on resources and environment. Although it can work in standalone mode, as a building energy management system (BEMS), µGIM is based on the Multi-Agent System (MAS) framework JADE (Java Agent Development Framework), enabling µGIM agents to interact with each other. These interactions can provide means for peer-to-peer energy transactions, as seen in [
21]. Another advantage provided by the µGIM is the ability to be deployed in single-board computers, such as Raspberry Pi, and the ability to locally execute energy models, such as forecasting models.
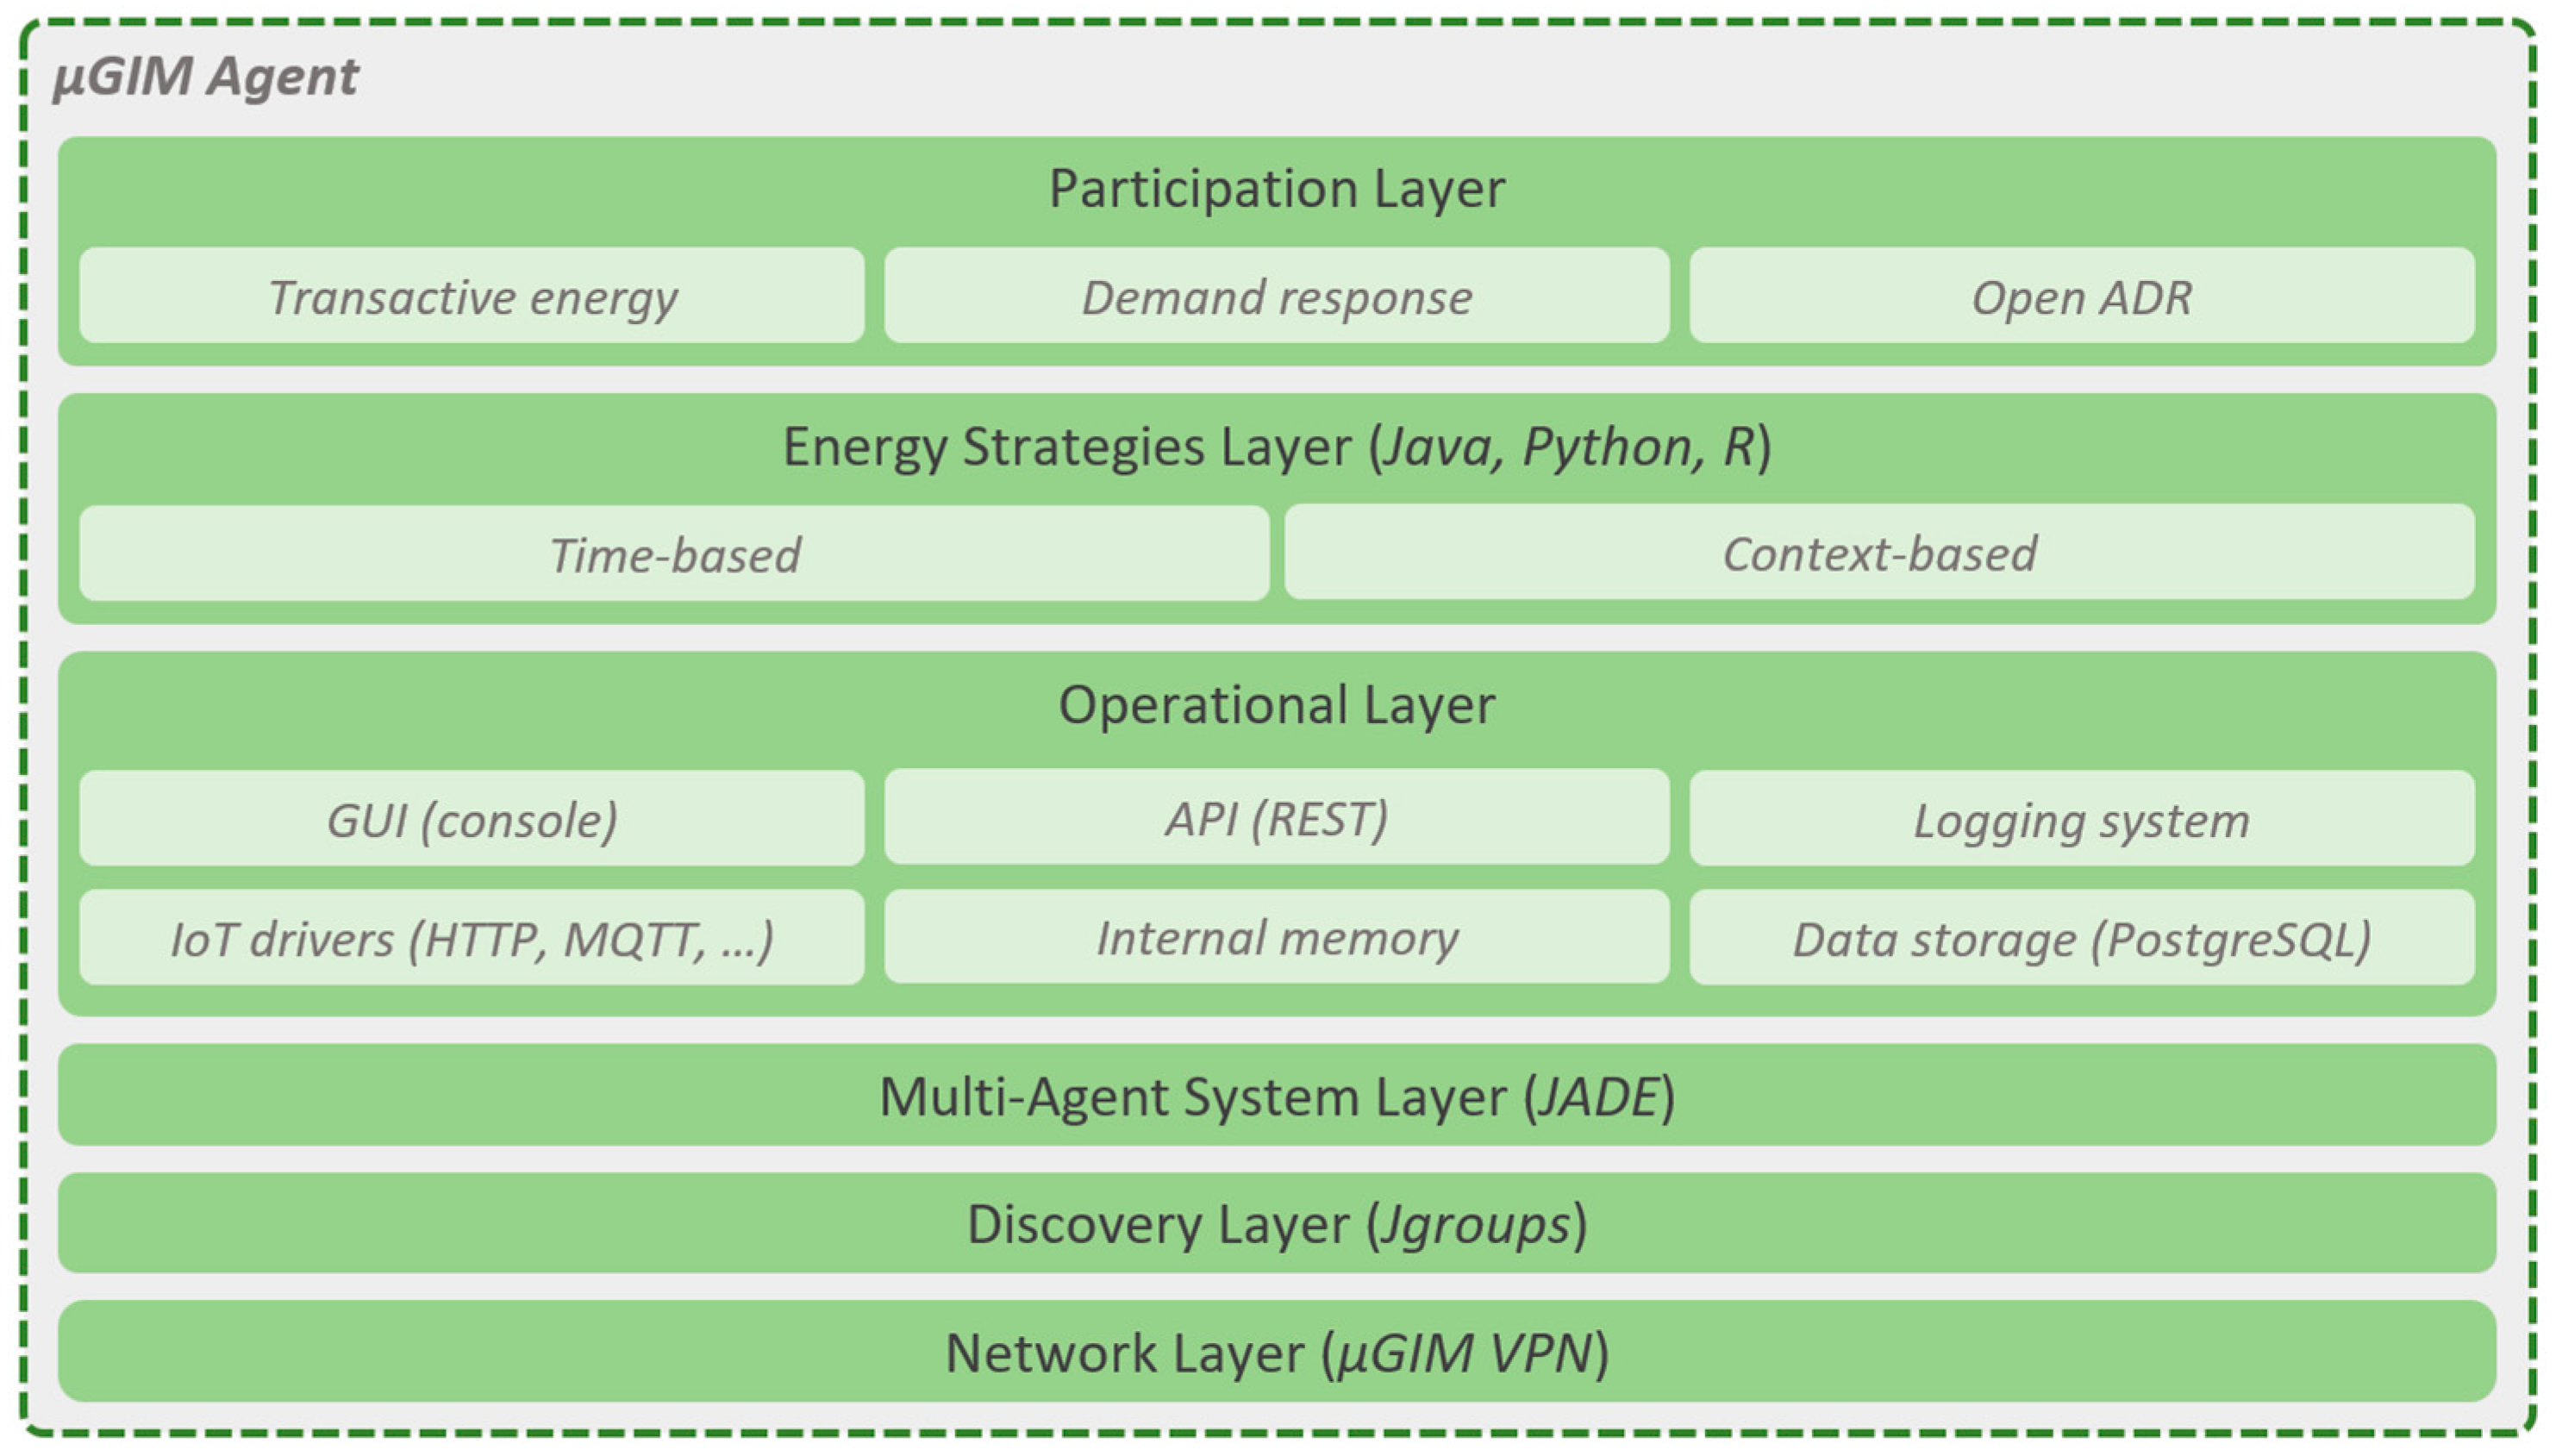
Figure 1 shows the layered architecture of a µGIM agent. From bottom to top, the three first layers are responsible for the agent’s connectivity to outside the building. The µGIM agents use a virtual private network (VPN) where agents and service providers are located. The Jgroups Java library is used for agents and services discovery (for instance, to enable the discovery of the JADE MAS provider). The MAS layer is provided by JADE to enable the registration and interaction of agents in the MAS.
The operational layer is responsible for the core of µGIM agents, allowing the persistency of data, a shared internal memory system, the integration of IoT devices, a logging system, a REST-based application programming interface (API), and a graphical interface using the console of the single-board computer—the operating systems for single-board computers compatible with the µGIM do not have graphical interfaces, and only console access is possible. IoT device integration is a set of drivers that can be used to integrate market available devices and custom-made devices; for this paper, the hypertext transfer protocol (HTTP) will be used.
The energy strategies layer is the key aspect of µGIM agents, as it provides the integration of energy models on top of the operation layer, meaning that energy strategies have direct access to IoT devices, real-time and historic data, and internal memory. Internal memory is a tag-based execution memory system (i.e., without data persistence) that can be accessed and is editable by all µGIM modules. By using internal memory, energy strategies can share information among them. The energy strategies can be one of two types: time-based and context based. The time-based are strategies that are triggered at specific hours, using a crontab-based approach, to define triggering periods. Time-based strategies can be used to integrate scripts, such as forecasting models, self-assessment algorithms, security checking mechanisms, and energy profiling models. Context-based strategies can be linked to defined events and are executed every time an event is detected. Context-based strategies can be used to integrate scripts, such as energy balancing models, demand response events participation, real-time energy resource optimization, and real-time resources prioritization algorithms.
The top layer is the participation layer that implements the necessary mechanisms to enable µGIM agents to actively participate in microgrids, energy communities, and smart grids. By default, µGIM registers all the IoT devices in Open ADR (Open Automated Demand Response) standard internal virtual end node (VEN). Additionally, µGIM also has mechanisms to enable participation in demand response programs and transactive energy models developed by researchers. This enables the test and validation of newly proposed models. In this paper, a peer-to-peer model will be implemented in the transactive energy block, which will be supported by energy strategies for energy forecast, and by the MAS infrastructure that will allow the interaction between entities.
3.1. Energy Strategies
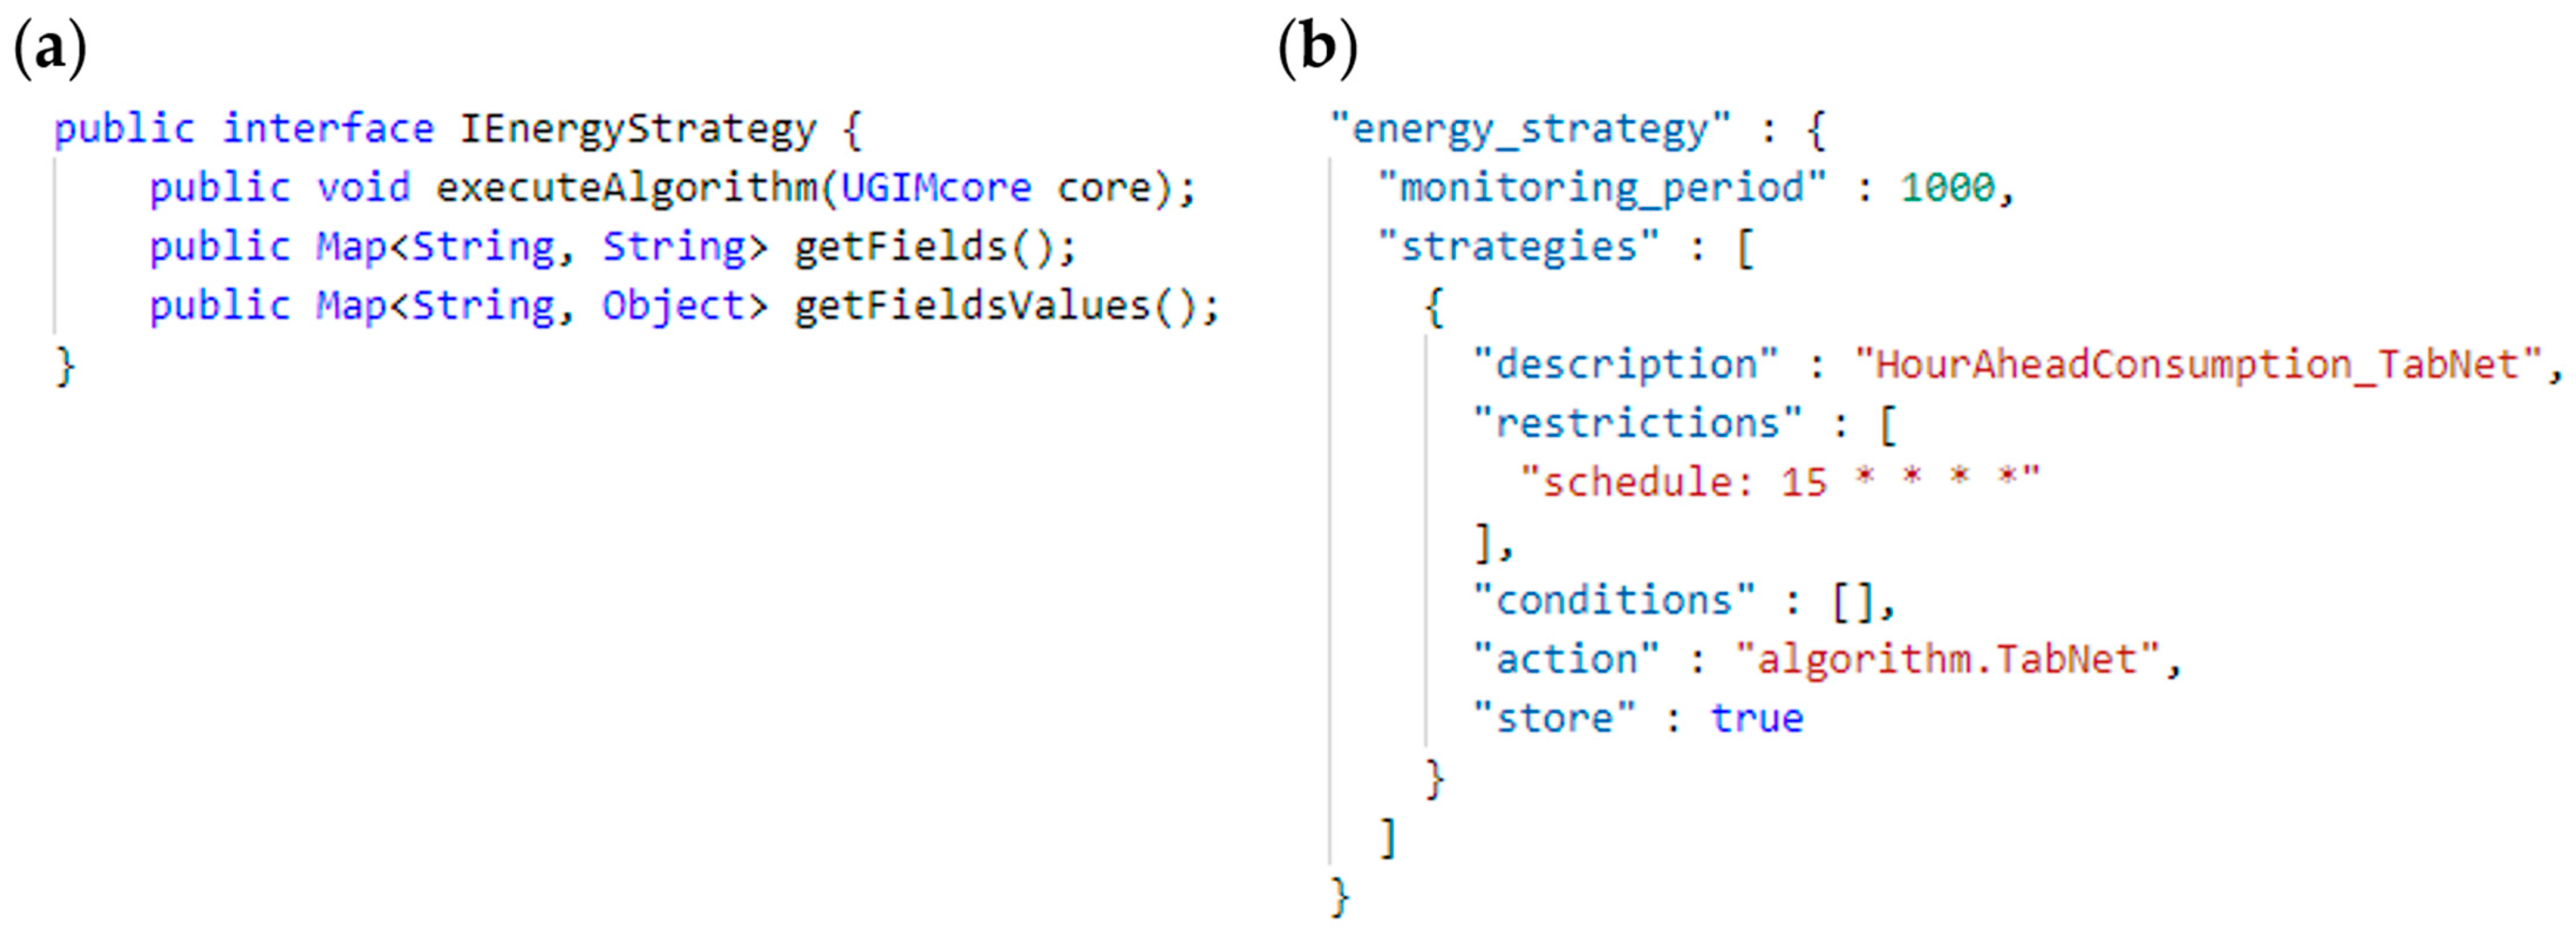
The use of energy strategies is a significant feature in µGIM, as it provides the ability to include scripts coded in Java, R, or Python. To perform this, the integration of such scripts need to implement a Java interface class named IEnergyStrategy. This interface class can be seen in
Figure 2a, where the methods can be described as follows:
- (1)
public void executeAlgorithm(uGIMcore core)—this is the main function that will be executed at the triggering of the energy strategy, which can be time-based or context-based. If the script is in R or Python, the developer should use the connection drivers available in Java to connect to R or Python code (µGIM provides examples to ease this integration);
- (2)
public Map < String, String > getFields()—this function is needed for data persistence and to obtain results of the energy strategy. To perform this, getFields() should provide a description of the variables that the developer wants to store in the database. The description of the variables should be provided by a map with the variable’s name and its data type (e.g., int, float, varchar(20));
- (3)
public Map < String, String > getFieldsValues()—the getFieldsValues() returns the current values of the variables described in getFields().
To implement the interface class IEnergyStrategy, the developer needs to implement the three identified methods. However, the getFields and getFieldsValues methods can be left empty (i.e., only with ‘return null’). This is because these methods are only used in energy strategies that are tagged in the configuration file as storable, meaning that the identified values will be persisted in the database every time the energy strategy is executed. In
Figure 2b, it is shown how energy strategies are configured in the configuration file that will be read by µGIM to create an object of UGIMcore class. This object is unique to the agent, and it provides access to the entire configuration as well as common methods, such as the real-time energy data and a list of IoT devices integrated in the agent. The configuration of the energy strategy mechanism is composed of the monitoring period and the list of energy strategy available. The monitoring period, in milliseconds, indicates the time interval where the µGIM agent evaluates all energy strategies and checks if these need to be executed. For each energy strategy, a definition of a description is needed, which is a unique tag without spaces that is used internally to acquire the result of the strategy. The list of restrictions and conditions determine the activation rules for the energy strategy. To execute the energy strategy, all restrictions need to be met and at least one condition needs to be valid. As it is a time-based energy strategy, the configuration is set as a cron-based nomenclature, stating that the energy strategy will be executed every hour on the 15 min mark. The action tag defines the name of the class that implements the interface class IEnergyStrategy of the energy strategy. Additionally, the store tag defines if the result of the energy strategy needs to be persisted in the database.
The input ‘core’ variable of executeAlgorithm aggregates pointers to every thread that is monitoring and controlling IoT devices, as well as to another pointer in the internal memory of the µGIM. This enables energy strategies to access real-time values from IoT devices and also act on IoT devices. In this paper, the major use will be on historical data, which are also accessible through the “core” variable.
The energy strategies that will be employed are forecasting algorithms that use the “core” variable to access historical data from each IoT device that stores energy data. The forecasting algorithms will be executed using historical data. Furthermore, the results of the strategy will be made available in the internal memory tag “forecast.[time].[period].[model]”, where [time] represents the time of the day, in minutes, for which the forecast is applied, [period] represents the size, in minutes, of the forecast period, and [model] identifies the forecasting model used. Examples of internal memory tags are forecast.0.60.SVM1 and forecast.120.15.ANN1.
3.2. IoT Devices for Households Monitoring
The integration of IoT devices in the µGIM agent is performed in the IoT driver block, where several drivers can be used to manage different communication and integration protocols. The currently available protocols include HTTP (for representational state transfer-based (REST-based) APIs), message queuing telemetry transport (MQTT), Modbus/TCP (transmission control protocol), and Modbus/RTU (remote terminal unit). However, similar to energy strategies, the developers can create their own drivers if these follow the guidelines provided by µGIM.
In the context of this work, HTTP drivers will only be used to connect to already established supervisory control and data acquisition (SCADA) systems or Wibeee devices (
https://wibeee.com, accessed on 11 May 2022). Wibeee devices provide an IoT solution for energy monitoring with easy installation in households. Although these devices are connected to the cloud, µGIM will use the API available in the local network to enable energy monitoring. For this paper, µGIM was updated to enable the discovery of Wibeee devices in the local network, meaning that the integration will occur automatically when powering up systems.
Figure 3 shows the installation and necessary components and connections that were used in real households.
The µGIM agent monitors energy data every 5 s and stores it in a local database every 30 s, using the average or sum of values, depending on the data type (e.g., energy will be summed, and voltage will be averaged). These data will then be available for energy strategies and, consequently, for models of energy forecasts and peer-to-peer trading.
3.3. Energy Forecasting Models
Several methods have been proposed in the literature for energy forecasting. The performance and adequacy of the methods depend significantly on the resource to predict (e.g., photovoltaic generation, wind generation, or power demand), the time horizon, and the granularity of the predictions. Afterward, for some methods, the definition of convenient features and hyper-parameterization can have a significant impact on the final results.
In this paper, four forecasting models will be used to evaluate the peer-to-peer energy transactions. Two of these models were already proposed in [
23] and were designed having in mind their execution in single-board computers. Two new models based on recent forecast methods will also be used to perform the load and photovoltaic generation forecast. The four models will be utilised in parallel to evaluate the peer-to-peer market performance of each end-user.
3.3.1. Mathematical and Support-Vector Machine Models
In [
23], two different models were proposed: one based on a mathematical approach and another based on a support-vector machine (SVM) approach. The mathematical model uses the average of the last ten days and then applies an adjustment to the current day. The SVM model also uses the last ten days to forecast the hour-ahead value. These two models are used in this work as a basis to compare the results of the two novel forecasting models (XGBoost and TabNet) that will be described in the next sections. XGBoost was selected based on some recent studies that show its good performance when compared with other methods (studies presented in
Section 3.3.2). TabNet was selected due to its aptitude in the parameterization of the model [
24]. This can be important in the present context due to the diversity of consumption/generation profiles of the consumers/prosumers. The models used were proposed in [
23]; however, these have not yet been used in peer-to-peer energy transactions, allowing this work to evaluate the performance of such forecasting models in peer-to-peer energy transactions.
3.3.2. eXtreme Gradient Boosting (XGBoost)
eXtreme Gradient Boosting (XGBoost) is an established approach for tackling tabular data [
25]. It is a modified decision tree algorithm that features improvements in how it handles and scales with input data relative to the other existing gradient-boosted decision tree (GBDT) algorithms. Being an ensemble algorithm, it relies on building multiple weak models to build a robust one.
The XGBoost algorithm was designed to take into account the sparsity of data, i.e., missing records, and features various improvements on how the data are handled to extract as much computational value as possible. This turns XGBoost into a robust model that strike a good compromise between model performance and training times. Authors mention the importance of value approximation, especially in cases where data do not fit into memory and introduce an approximation algorithm to perform the data split more efficiently for building the tree’s branches.
While many models are considered black-box approaches, the XGBoost algorithm has a term on its objective function that penalises model complexity, promoting the development of more interpretable models from which behaviour is more easily explained.
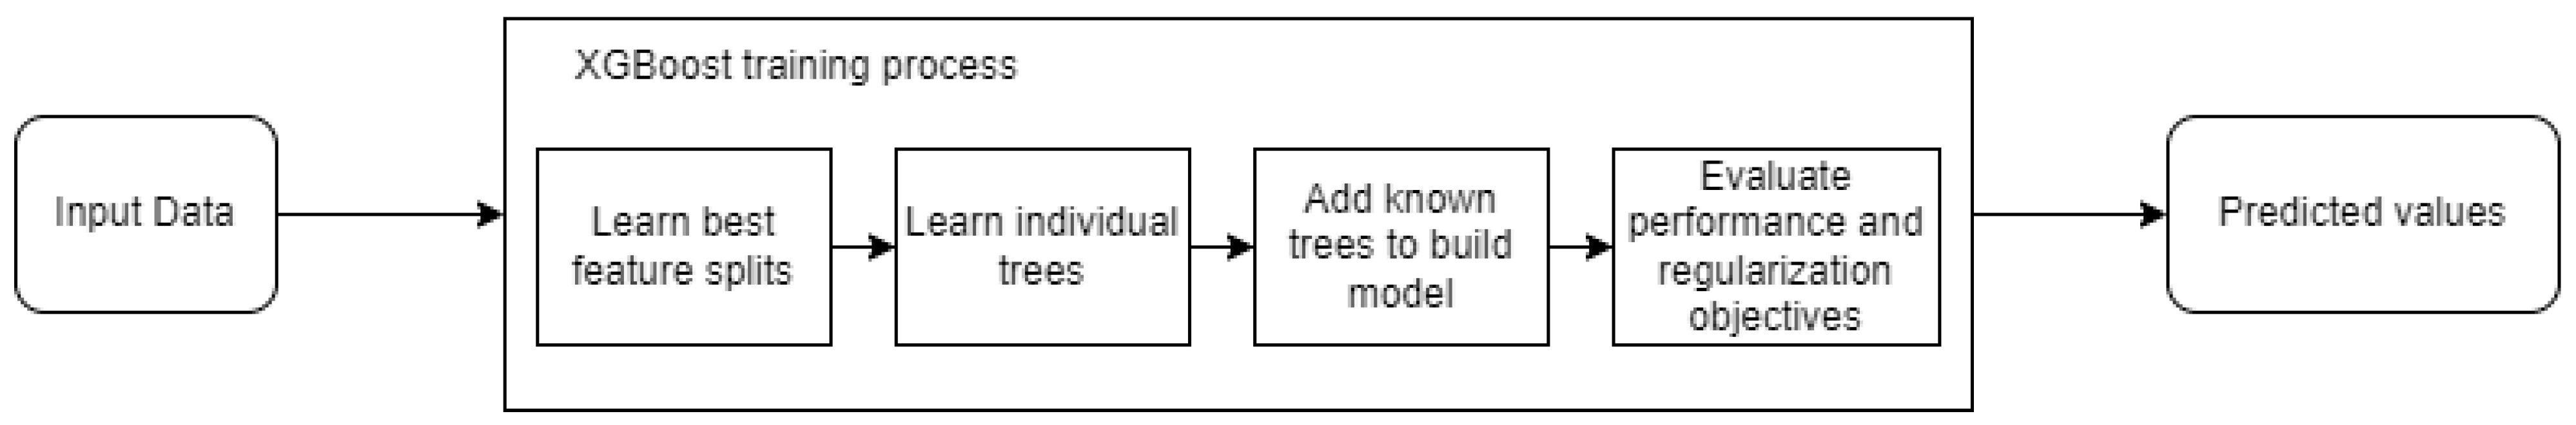
The XGBoost algorithm is an extension of the regular Gradient Tree Boosting algorithms. This family of algorithms is reliant on the ensemble concept, where multiple weaker models are used together to form a stronger model. The training of the algorithm can be separated into splitting, tree building, tree addition, and model evaluation, as illustrated in
Figure 4.
Decision trees rely on feature split to perform efficient learning, which can prove to be difficult depending on the problem’s magnitude. XGBoost uses an approximation algorithm to reliably find solutions and learn trees, although the authors of the work mention that it works with the traditional greedy approach available for smaller dimension problems.
Furthermore, the authors introduce a method for finding the best candidates for feature splitting that is also capable of handling unbalanced data. The XGBoost algorithm is also aware of data sparsity and makes use of this information to help the learning process.
For the resulting model, the trees are trained in an additive manner due to computational efficiency. The model is evaluated regarding its performance and complexity, more specifically by the sum of errors and a complexity penalty term, with the objective of minimizing this quantity. The authors mention that the introduction of a penalty term smoothens learning and can help prevent overfitting.
Finally, this method has seen multiple uses in various areas, such as energy [
26], structural integrity [
27], and health [
28]. More specifically, in the forecast domain, XGBoost has been applied for short-term wind production forecast [
29], outperforming traditional artificial neural network (ANN), long short-term memory (LSTM) recurrent neural network, and temporal convolutional networks (TCN) models and also presenting extremely good results for time-series forecast in terms of results, computational resources, and memory use for load forecasting [
30]. In [
31], XGBoost is used for photovoltaic generation. The results of XGBoost are compared with random forest and decision trees, presenting better results in terms of root mean square errors.
3.3.3. TabNet
Motivated by the recent successes of the transformer architecture and mechanisms such as attention and the lack of dominance of deep learning in tasks involving tabular data, TabNet was created [
32,
33]. The TabNet architecture thus attempts to leverage the power of deep learning in conjunction with said mechanisms, seeing success in applications, such as load forecasting and other fields such as fraud detection [
34,
35].
Capable of dynamically learning feature importance, TabNet effectively performs feature selection and produces outputs with a single architecture. This is performed by using an attention mechanism that is inspired by decision tree feature splitting. This determines the most prominent features to use at a certain moment, while at the same time being able to provide insights on model behaviour and helping to prevent overfitting.
Being a deep learning architecture, it inherits many advantages such as gradient-based learning and scalability with data and is able to represent nonlinearities through higher dimensionality. Finally, the authors elaborate on the possibility and advantages of using TabNet with unsupervised pre-training. TabNet uses raw numerical features of tabular data (not normalised) as the learning mechanism. In TabNet, normalisation and feature extraction are available in the architecture due to the Batch Normalization layer [
36] that filters raw data. Additionally, several transformer blocks are used to learn relevant features to be used in the forecast model [
34]. The instance-wise feature selection is performed by a deep learning block that consists of a sequential attention mechanism and learnable masks. Following this approach, the accumulated learned weights can be used to understand the obtained outputs. Grid search, proposed in [
33], is used to set hyperparameters values, namely the number of hidden neurons in each block and the number of hidden blocks.
TabNet has been applied in different domains, such as health [
37], fraud detection [
38], and energy [
39]. Concerning the application of TabNet in the forecast domain, it is possible to mention the use for load forecasting [
34] presenting similar results to other methods but without the need of performing complex feature engineering.
3.4. Peer-to-Peer Transactions
This paper will present an impact analysis of the forecasting algorithms in energy sharing. To enable energy sharing among players in a virtualised energy community, an auction-based peer-to-peer energy transaction model will be used. The peer-to-peer model will be based on the discriminatory-price auction (DPA) model proposed in [
7]. This type of auction proved to be one of the most efficient regarding the relationship between energy transacted and energy available. Additionally, it proved to be the one that brings the most benefits to sellers. DPA is a pay-as-bid multi-unit auction where customers can present curving bids. This type of auction does not have a market-clearing price, as the customer pays the price they bided.
Peer-to-peer energy transactions are performed hourly on an hour-ahead basis, following the proposed model in [
21]. At each hour, the auction synchronizer will query and collect the information regarding players that have energy to be sold in the peer-to-peer market. Based on hour-ahead forecasting, the agents of the µGIM will specify if they need to buy or sell energy—only a single intention per hour is allowed, meaning that agents cannot sell and buy energy within the same period. Hour-ahead forecasting will be applied to energy consumption and energy generation from photovoltaic systems. The difference between the forecasted consumption and generation will define the position of the agent (i.e., as a seller or as a buyer) and will indicate the amount of energy that needs to be traded.
The auctions will be performed by each seller according to the order given by the auction synchronizer. In each auction, the auctioneer will broadcast, among buyers, the amount of energy available and the minimum price. The interested buyers will submit a single bidding curve according to the following equation:
where
represents a linear decreasing marginal price to be bid by agent
in auction
for an energy amount of
. Variable
represents the total amount of energy that agent
will try to purchase in auction
. The variables
and
represent, respectively, the highest and lowest price offer of agent
in auction
. To create the curving bid, the value of
will be iterated to decrease 100 Wh each cycle.
For the implementation executed in this paper, the values of and will be calculated using a 20 % margin over the hourly energy prices to buy and sell energy from/to the main grids. After receiving the bidding curves, the auctioneer (i.e., the seller) will order the bids and distribute the energy available among the highest bids until there is no more energy to bid on. When the auction is closed, the auction synchronizer will choose another seller to start their auction until there are no more sellers available.
4. Case Study and Results
The case study presented in this paper was deployed using the µGIM solution. The case study integrated the five small offices described in [
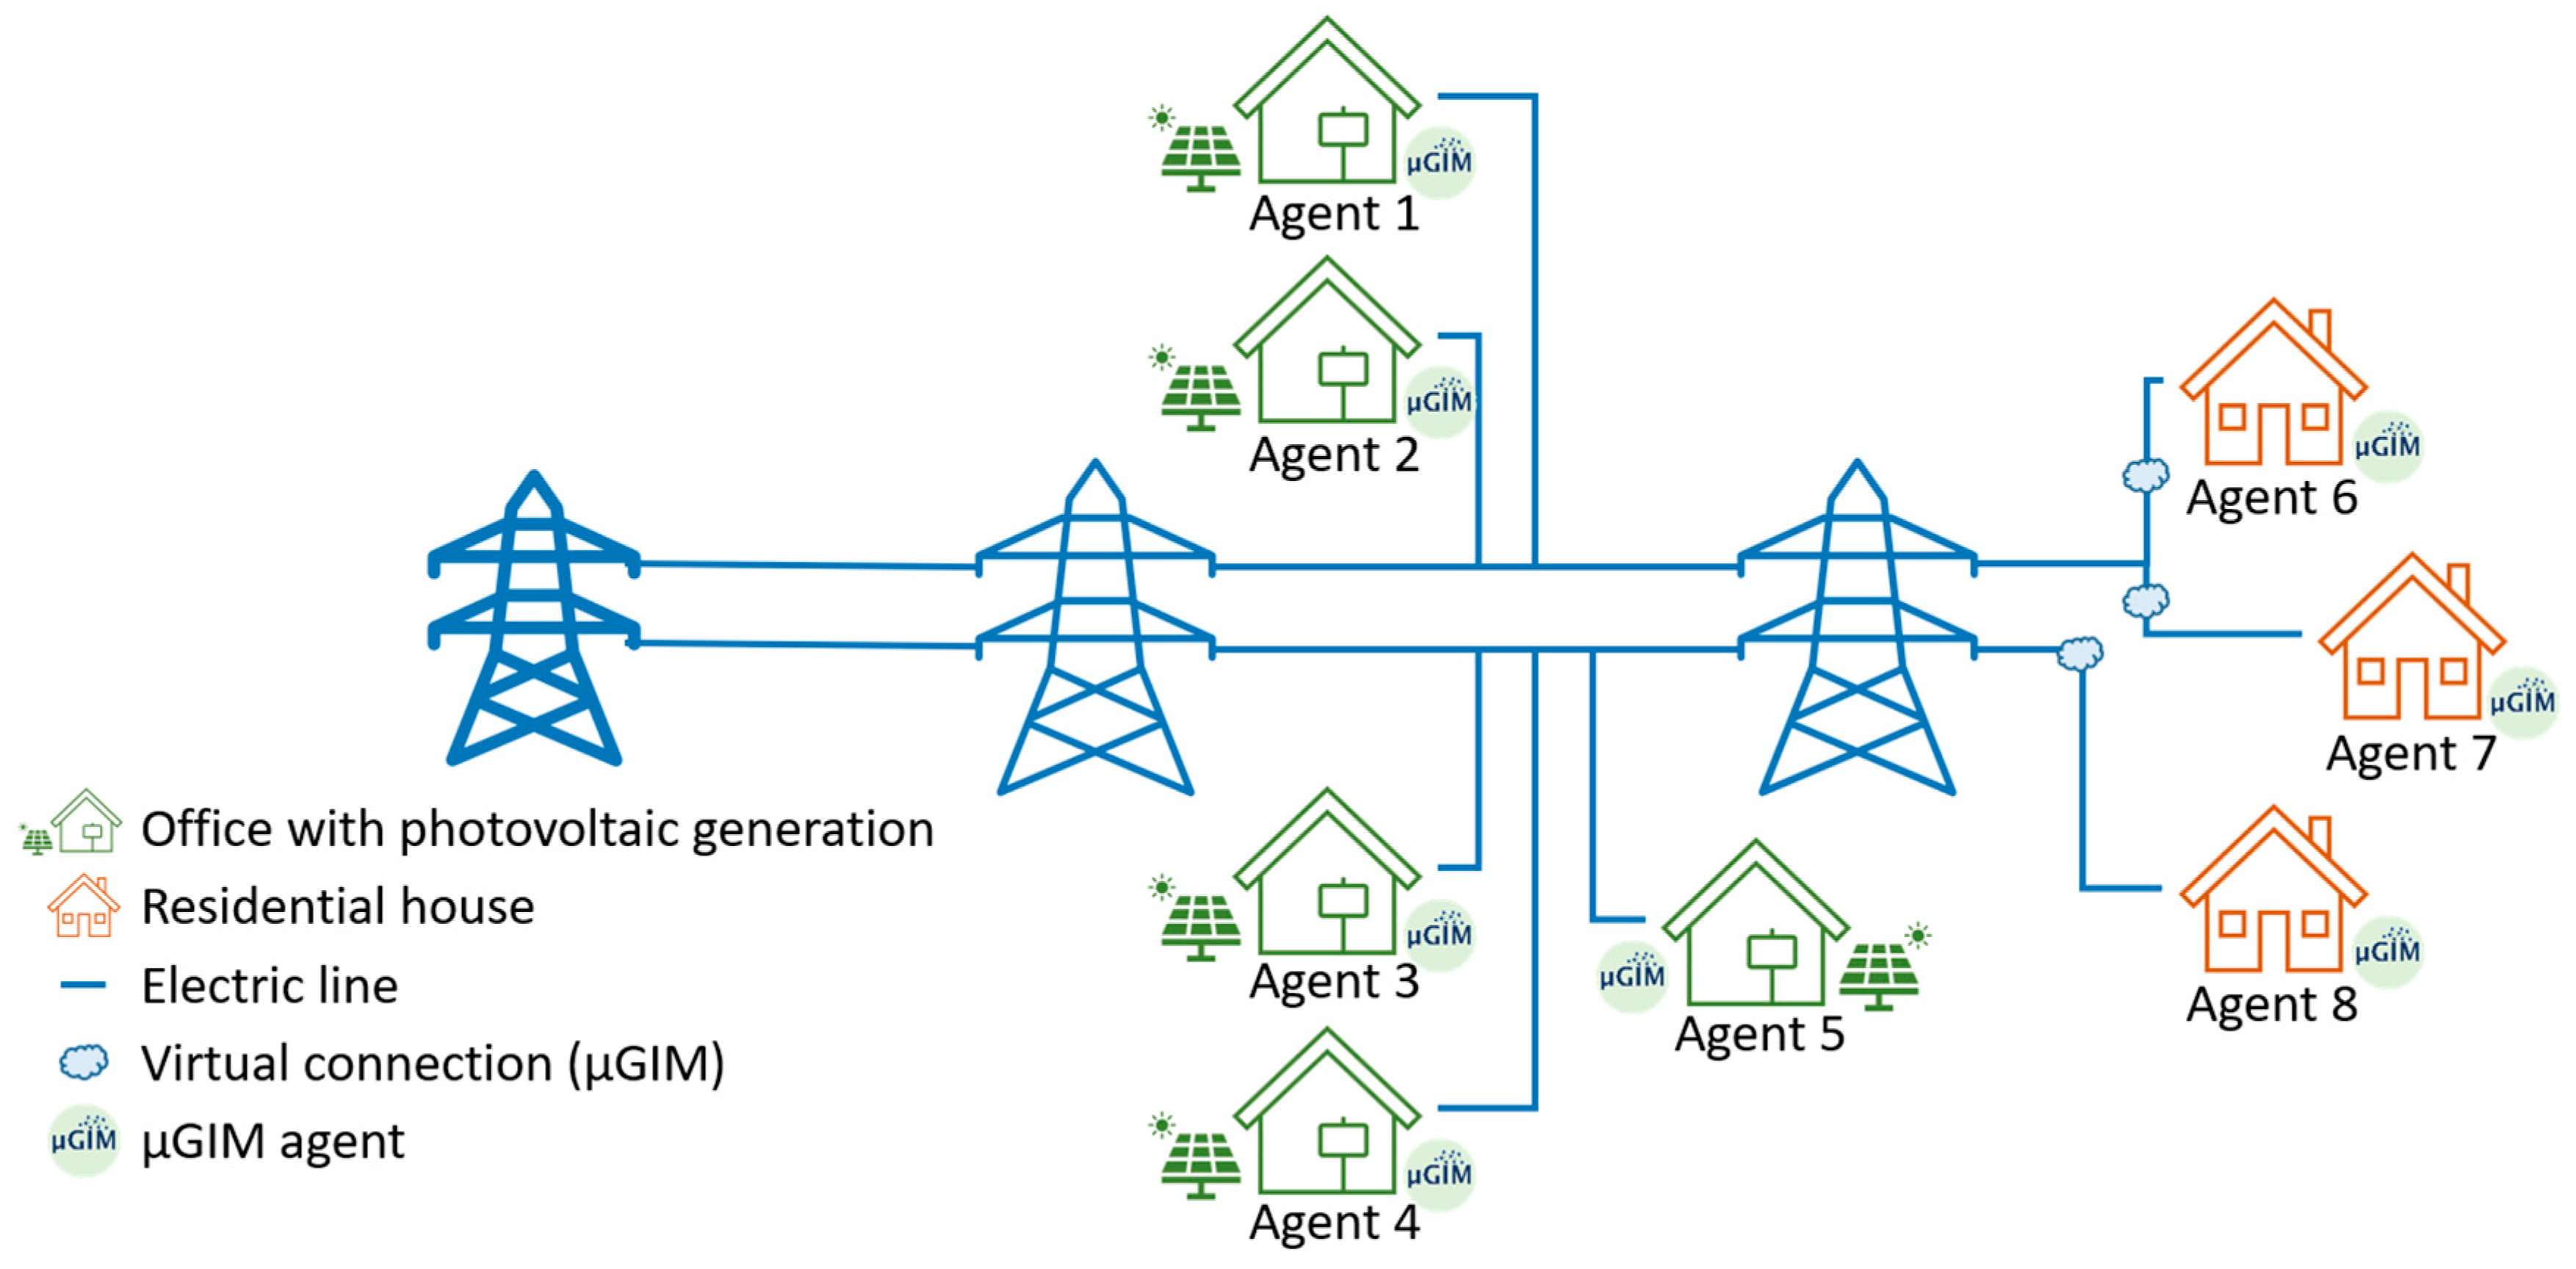
18] and added the existence of three residential households. The small offices are equipped with photovoltaic generation and will be able to sell energy in the peer-to-peer energy market, while the households only have consumption. All the buildings in this case study are real and are located in Porto, Portugal.
Figure 5 shows the energy community created for this paper. Although the small office buildings are physically connected with electrical lines, the households do not have a physical connection among them nor with the small offices. The community is virtually created by the µGIM solution, which uses the VPN to enable communication and energy transactions among the seven buildings.
To test the peer-to-peer model of
Section 3.4, the configurations of the forecasting algorithms of
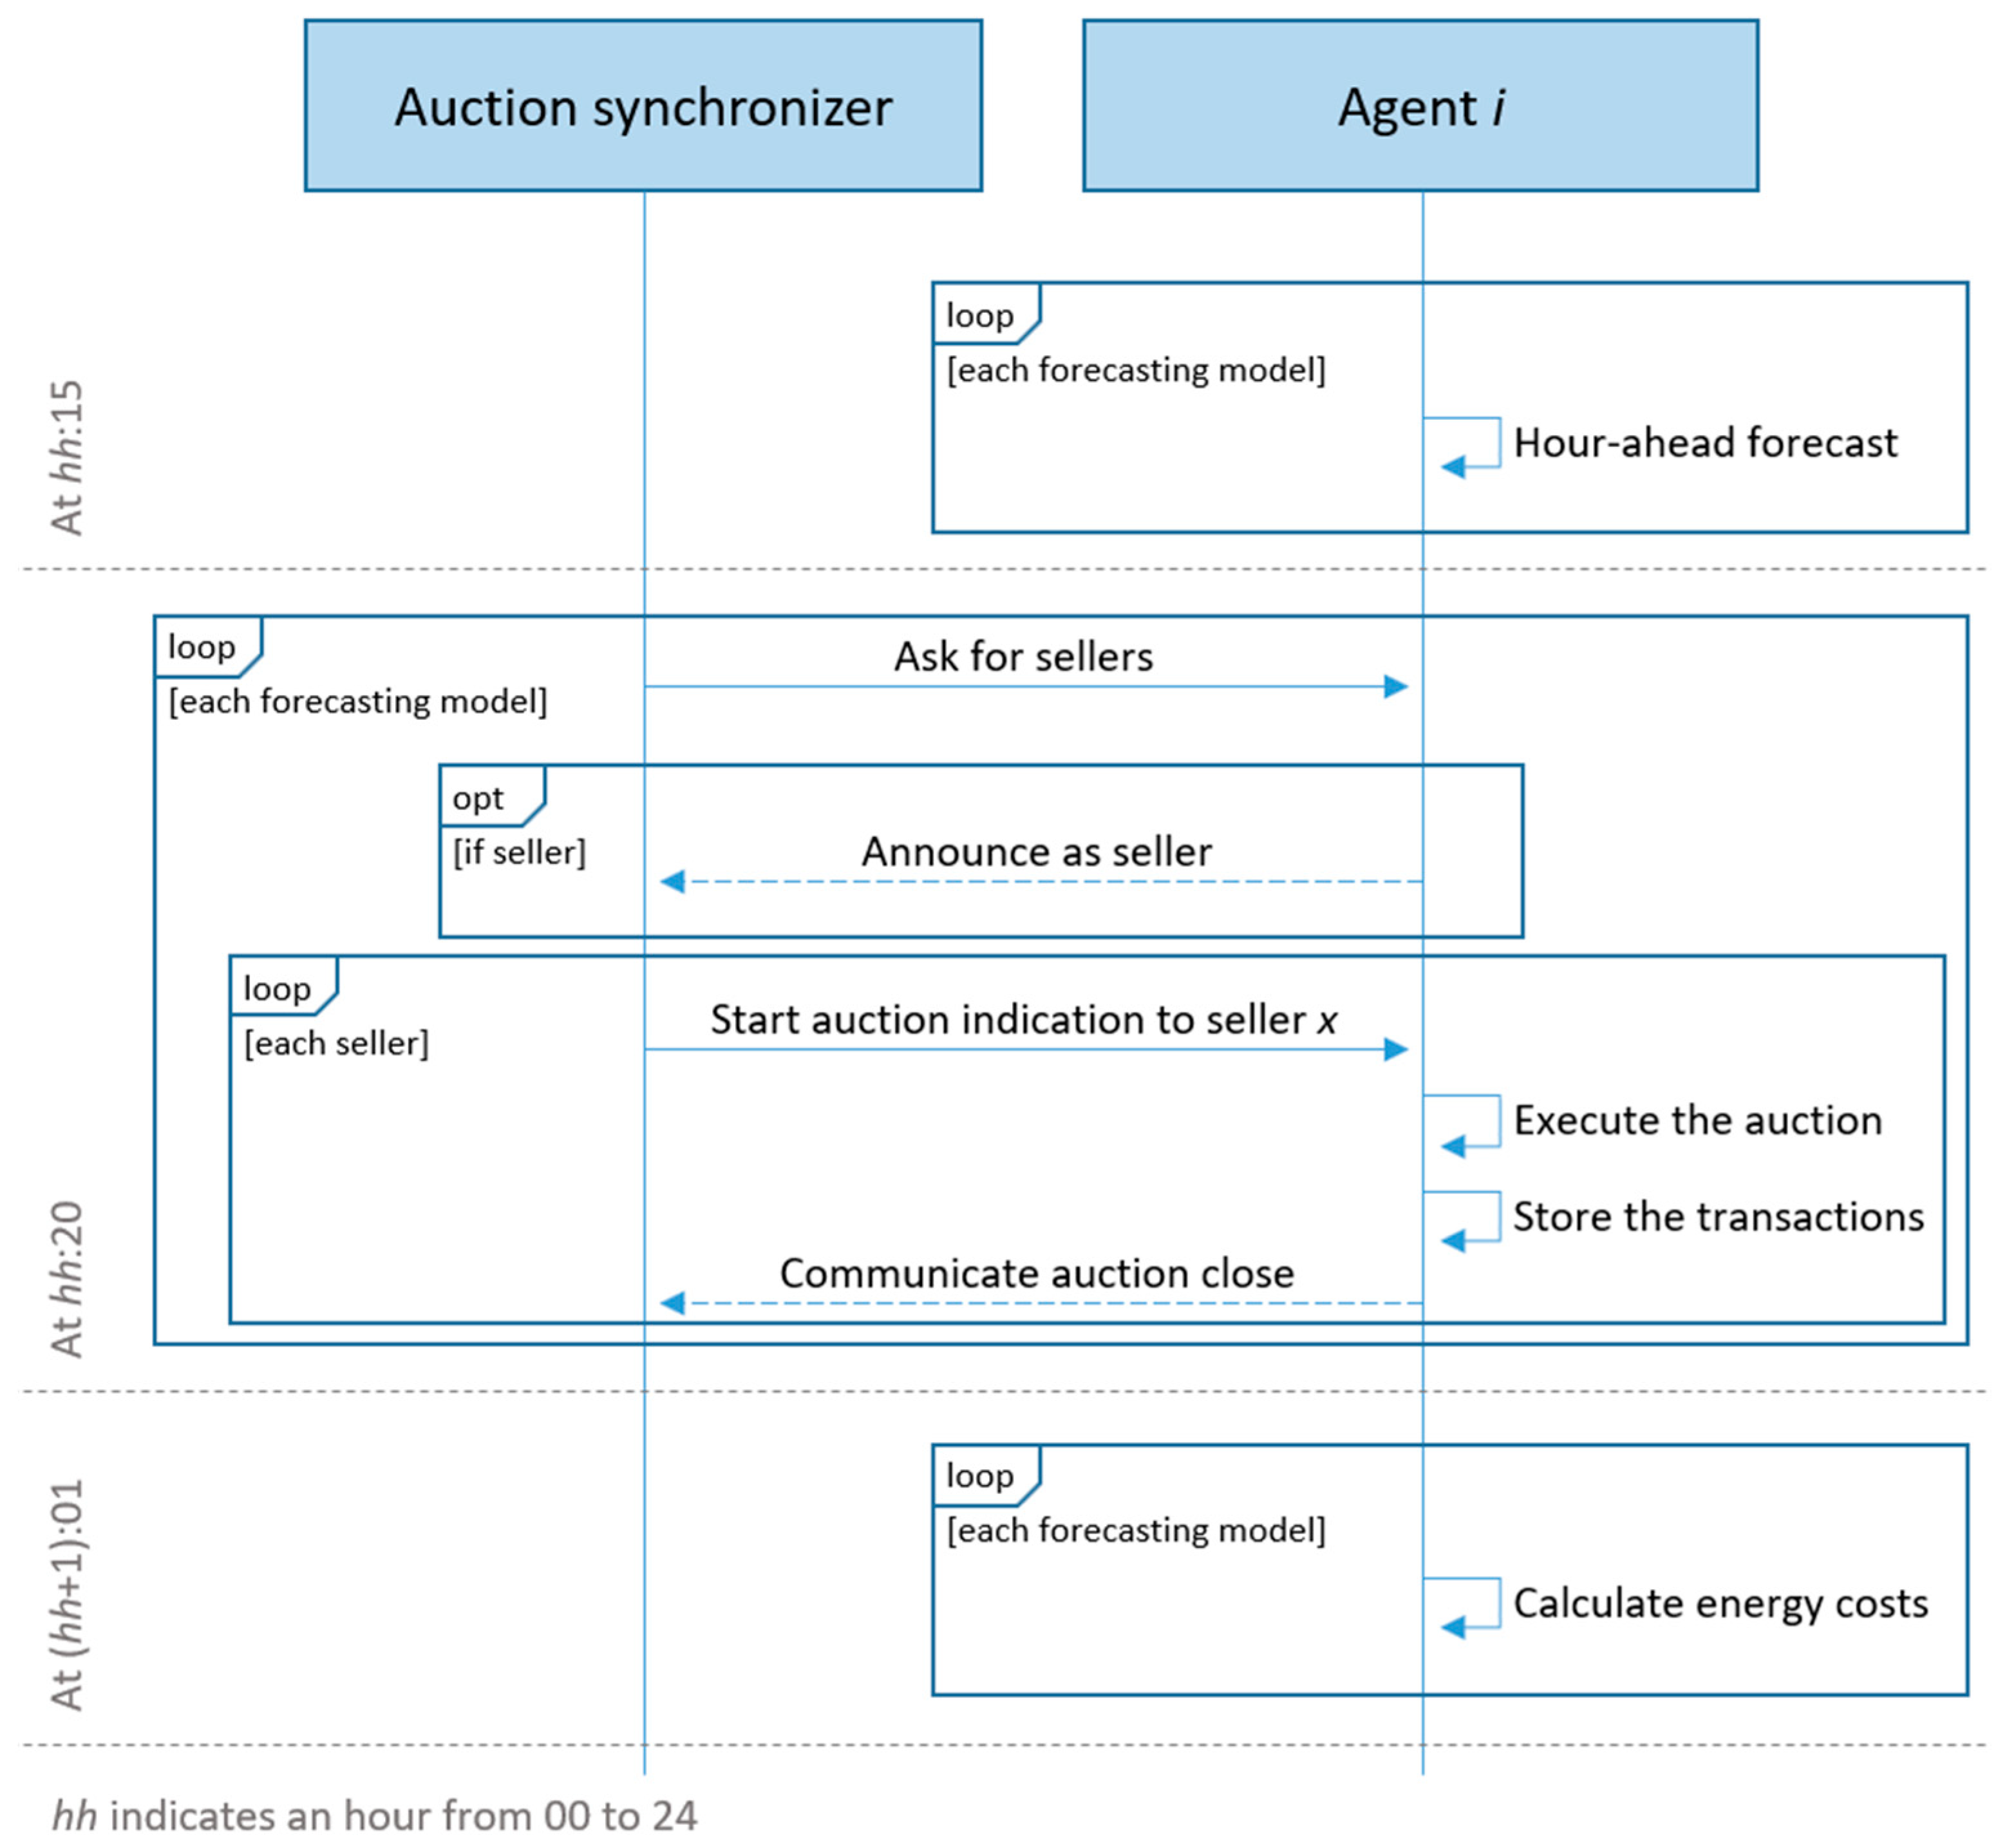
Section 3.3 were deployed in µGIM, where each agent was installed in a single-board computer Raspberry Pi 3 Model B. Peer-to-peer energy transactions were performed on an hour-ahead basis. To compare the impact of the forecasting algorithms, all algorithms will be executed for each hour, and the auctions will be executed by taking into account the result of each forecast. This means that multiple P2P markets will be executed for the same hour in order to have a comparison using the same base. This is shown in
Figure 6 where forecasting and P2P-related actions are represented. The auction synchronizer is the role of Agent 1. This is a necessary role to enable the synchronization of auctions in order to prevent the parallel execution of auctions. This role is performed automatically by the µGIM and does not impose any limitation on the agent; in other words, the agent can still be a buyer or a seller in auctions (more on this issue can be read in [
21]). As shown in
Figure 6, the P2P model is executed four times in total and once for each forecasting algorithm: mathematical model, SVM model, TabNet model, and XGBoost. This repetition of auction in each hour will allow us to test several forecasting models in the same scenario using the same P2P model.
4.1. Mathematical and SVM Models
The mathematical and the SVM models were used in this case study to compare the results of the proposed forecasting algorithms and assess their impact in peer-to-peer energy trading. By comparing the scenario where no peer-to-peer transactions are performed with the scenario where they are,
Table 1 demonstrates that all agents achieved an energy cost reduction. Agent 8 presents, in both forecasting models, the lowest cost reduction of 0.13%. This is also the agent with the least amount of energy that attempted to transact in the peer-to-peer market. According to
Figure 5, Agent 8 does not have local generation, meaning that the agent sought out to buy 20.486 kWh during the week. The agents with a significant amount of surplus generation, Agents 4 and 5, presented the highest reduction in their energy costs over the week.
Regarding energy reductions, both forecasting algorithms are similar to each other. The mathematical model resulted in a community reduction average of 10.24%, and the SVM model culminated in a community reduction average of 10.46%.
4.2. TabNet Model
The TabNet model was executed every hour during the case study and its forecasts were used in the P2P energy market.
Table 2 shows the results for the energy community considering the use of TabNet model. The P2P target column indicates the total amount of energy that an agent tried to transact during a seven-day period—this also includes the night periods when all agents intended to buy without having an available seller. This explains the significant gap between this value and the actual amount transacted. The grid transactions identify the amount of energy that was exchanged with the grid operator. As observed, by applying the P2P market, Agents 1, 2, 3, 6, 7, and 8 decrease their demand from the grid. However, the agents with surplus generation (i.e., Agents 4 and 5) increase their grid demand. This can be explained by the forecasting errors that led the agents to sell more than what they had and, consequently demanding them to purchase energy from the grid while selling their renewable energy to other agents. Agents 4 and 5 also present a significant reduction in the amount of energy injected into the grid due to selling it directly to other agents.
As a result, all agents were able to decrease their energy costs by applying a P2P market. The reduction in energy costs varies from 0.26% to 56.79%, benefitting agents with local renewable generation. This is a consequence of the DPA model, which has been shown to be beneficial for sellers. The community energy cost reduction was 10.65%.
4.3. XGBoost Model
Similarly to TabNet, the XGBoost model was also applied in a P2P market using the same auction model.
Table 3 shows the community results for the P2P market when applying XGBoost. The P2P target of
Table 3 differs from
Table 2 due to being a direct consequence of the forecasting results. Only the grid transactions without P2P are the same as
Table 2. By using XGBoost, Agents 4 and 5 were able to decrease the amount of energy sold to the grid, ending the week with, respectively, 0.199 kWh and 1.848 kWh injected into the grid. Nonetheless, energy cost reductions are similar to TabNet, ranging from 0.24% to 57.43%. The community energy cost reduction was 10.89%.
4.4. Overall Results and Discussion
The forecasting models are used by µGIM agents to evaluate the performance of the P2P energy sharing market inside the energy community. To assess the impact of the different forecasting models,
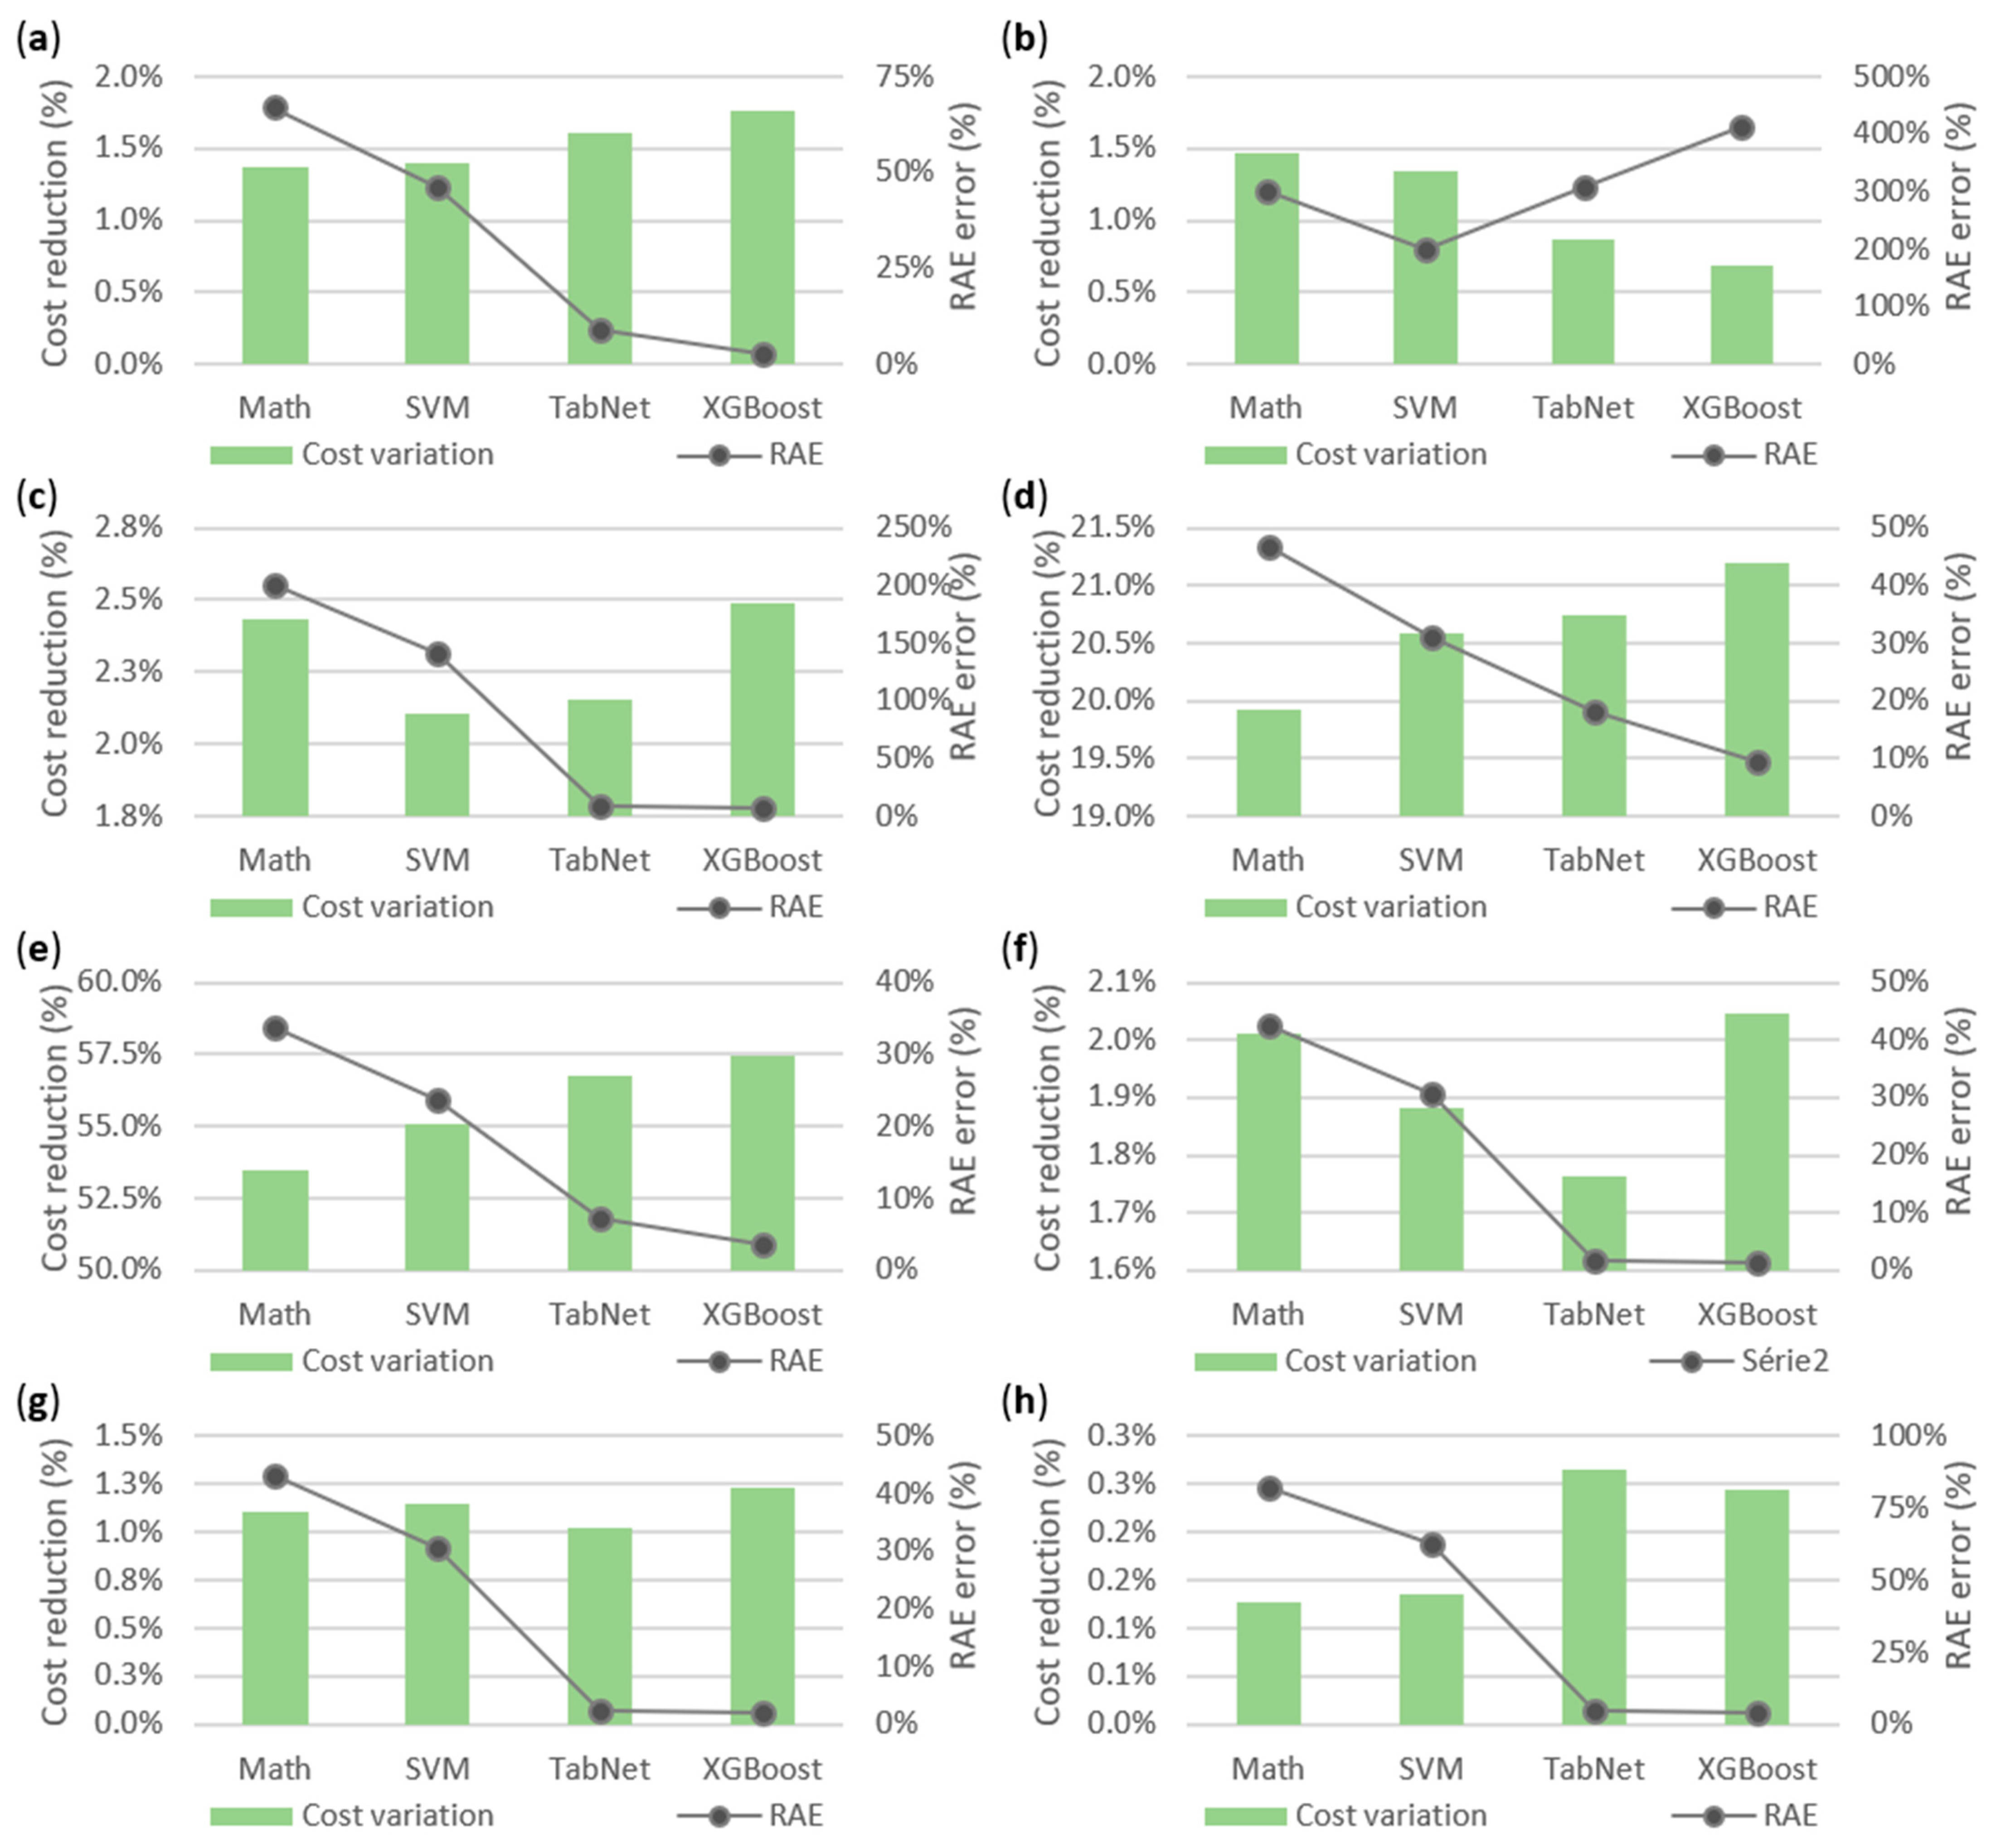
Figure 7 shows the overall results regarding the relative absolute error (RAE) of forecasting models, as well as the average reduction in energy costs in the energy community. The use of XGBoost benefited Agents 1, 3, 4, 5, 6, and 7, while Agent 2 achieved higher reductions using the mathematical model, and Agent 8 accomplished a higher reduction using TabNet. With the exception of Agent 2, it can be seen that the forecast algorithm that has the highest energy reduction is the one that presents the lowest error. However, in Agent 2, the lowest forecast error was the SVM model (with a RAE of 201.27%), but it was the mathematical model (with a RAE of 301.91%) that achieved a higher energy reduction cost. The forecasting models of XGBoost and TabNet were not able to correctly learn and forecast the Agent 2′s consumption due to their unpredictability. Agent 2 integrates common office spaces where the number of workers is not known and that changes every day.
Figure 7 also demonstrates that the forecast error and the energy cost reduction are related but not proportional. The mathematical error of the community is 2.8-times higher than the TabNet error (i.e., the mathematical forecast was 126.14% worse). However, the reduction costs of the mathematical model were 10.24%, while TabNet was 10.65% (i.e., the TabNet result was only 4% better).
The four forecasting models had close results in the community’s energy cost reduction from 10.24% to 10.89%, even though the forecast errors were significantly different. By analysing the energy that was transacted in the P2P market, it can be seen that the values are also similar (mathematical model: 104.23 kWh; SVM: 94.10 kWh; TabNet: 86.93 kWh; XGBoost: 94.91 kWh), rendering the community’s energy cost reduction equally similar. However, this is not the case of the agents’ individual performance between the mathematical model and the XGBoost model, where energy costs have a variation between −53.50% in Agent 2 and 93.42% in Agent 8. However, all agents have a positive energy cost reduction in all energy forecasting algorithms, as seen in
Table 1,
Table 2 and
Table 3. The negative energy cost variation value of Agent 2 is due to the performance of XGBoost model, which is the worst model to be applied to this agent. If the opposite analysis was performed, then it will indicate that, by applying the XGBoost model to the application of the SVM model (that is the model with the best forecast error), Agent 2’s energy cost reduction increased by 97.71%. These results are in line with the motivation and findings of our research that state that P2P energy markets will significantly depend on energy forecast errors. This reinforces the need of better studying P2P energy market models that can handle energy forecasting errors and uncertainty. Moreover, each end-user should adjust their energy forecast model to their specific needs and context.
To evaluate forecast errors, this study used RAE and the mean absolute error (MAE), as shown in
Table 4. These two accuracy measurements reinforce the idea that a smaller error in the forecast, regardless of how small, can reflect a greater efficiency and return on the P2P market. Agent 2, due to its imperfectability, is the agent that presented a significantly higher error; this must be considered when analysing the community’s averages. When examining the error agent by agent, the common rule found was that the forecast with highest error was the mathematical model, and the forecast with the lowest error was the XGBoost model. Hence, the XGBoost model was able to have the highest community energy cost reduction even though the average community forecast error was slightly higher than the TabNet model.
There is another explanation that needs to be accounted in the result analysis, which involves the incorrect transactions that were made by each forecast algorithm. A common issue in P2P energy markets is obtaining a forecast that contradicts the market’s position, which could happen when considering real values. For instance, during an hour with higher consumption, if the forecasts predict that an energy surplus scenario will occur, then the energy surplus forecasted will be sold. However, in real-time, the agent will need to purchase energy from the grid to satisfy its demand in addition to the energy it sold in the P2P market. The same can occur in the opposite scenario, where the forecasts predict an energy deficit but, in fact, the period will have an energy surplus. Another issue is buying too much or too little in the P2P market, meaning that the agent will need to sell or buy the difference to/from the grid in real-time. These types of errors result in a high impact on the energy cost and must be avoided. This can be performed by using lower error forecasting algorithms or by implementing a safety flexibility margin in the P2P market—however, this may decrease the efficiency of transactions.
In the present case study, 124 incorrect sales were completed by Agents 4 and 5 in periods where they sold energy in the P2P market and were required to purchase it back. The mathematical model produced 18 incorrect sales by Agent 4 and 26 incorrect sales by Agent 5. The SVM model reduced incorrect sales to 14 and 20, respectively, relative to Agents 4 and 5. The XGBoost reduced the number to 18 and 7, respectively, relative to Agents 4 and 5. Moreover, TabNet was the forecasting model with the lowest number of incorrect sales, producing 15 incorrect sales by Agent 4 and 6 incorrect sales by Agent 5. However, the incorrect sales, by their own, do not dictate the performance of the agents. For example, Agent 5 achieved a higher cost reduction with the XGBoost model than with the TabNet model, where it had one less incorrect sale. The reason for this is that the economic losses from incorrect sales can be diluted during the week.
Table 2 and
Table 3 show that this happens with P2P transactions. Agent 5 significantly decreased its energy injected into the grid, and with the TabNet model, 88.41% of the surplus energy was sold in the P2P market. However, with the XGBoost model, Agent 5 was able to transact 95.71% of its surplus energy in the P2P market, increasing its overall cost reduction.
5. Conclusions
This paper applies a discriminatory-price auction model for peer-to-peer energy transactions in a small community of five small offices and three residential households. This deployment was made possible by using multi-agent-based solution µGIM, which enabled the deployment of energy management systems in end-users. With five prosumers and three consumers, the community was able to transact energy among peers.
To test and evaluate the peer-to-peer energy transaction model, four independent energy forecasting models were used to assess the amount of energy each agent must transact in the peer-to-peer market. These algorithms are as follows: a mathematical-based model, a support-vector machine model, an eXtreme Gradient Boosting model, and a TabNet model. The impact of these forecasting models in the energy transaction model was analysed by taking into consideration the community view and the end-user view of economic impact and forecasting errors.
The results demonstrated that the application of peer-to-peer energy markets leads to a reduction in energy costs by simply allowing end-users to pursue profits and/or cheaper energy sources/sellers. The results show an energy cost reduction, within the community, ranging from 10.24% to 10.89%, depending on the energy forecast model used. Moreover, the results were coherent, demonstrating that the energy forecast model with less errors usually results in a higher energy cost reduction for the end-user.


 ,
, 


