
Integration of Hydrothermal Carbonisation and Anaerobic Digestion for the Energy Valorisation of Grass


Abstract
:1. Introduction

| Composition | Miscanthus | Switchgrass | Reed Canary Grass | Marginal Land Grass b |
|---|---|---|---|---|
| Cellulose (%db) | 44–45 | 30–45 | 26–39 | 20–33 |
| Hemicellulose (%db) | 18–30 | 21–35 | 17–28 | 24 |
| Lignin (%db) | 14–22 | 7–23 | 4–5 | 10–25 |
| Protein (%db) | NR | 3–11 | 16 | 7–16 |
| Ash (%db) | 2–7 | 2–10 | 1–13 | 8–27 |
| Alkali Metals a (%db) | 0.1–1.0 | 0.2–1.3 | 0.2–3.8 | 0.4–4.4 |
| Chlorine (%db) | 0.0–0.6 | 0.0–0.5 | 0.0–0.6 | 0.1–2.0 |
| Additional References | [2,8,10,11,12] | [12] | - | [3,13,14,15,16] |
2. Materials and Methods
2.1. Sample Collection and Preparation
2.1.1. Grass
2.1.2. Inoculum
2.2. Hydrothermal Carbonisation (HTC) Reactions
2.2.1. HTC Reaction Conditions
2.2.2. HTC Mass Balance
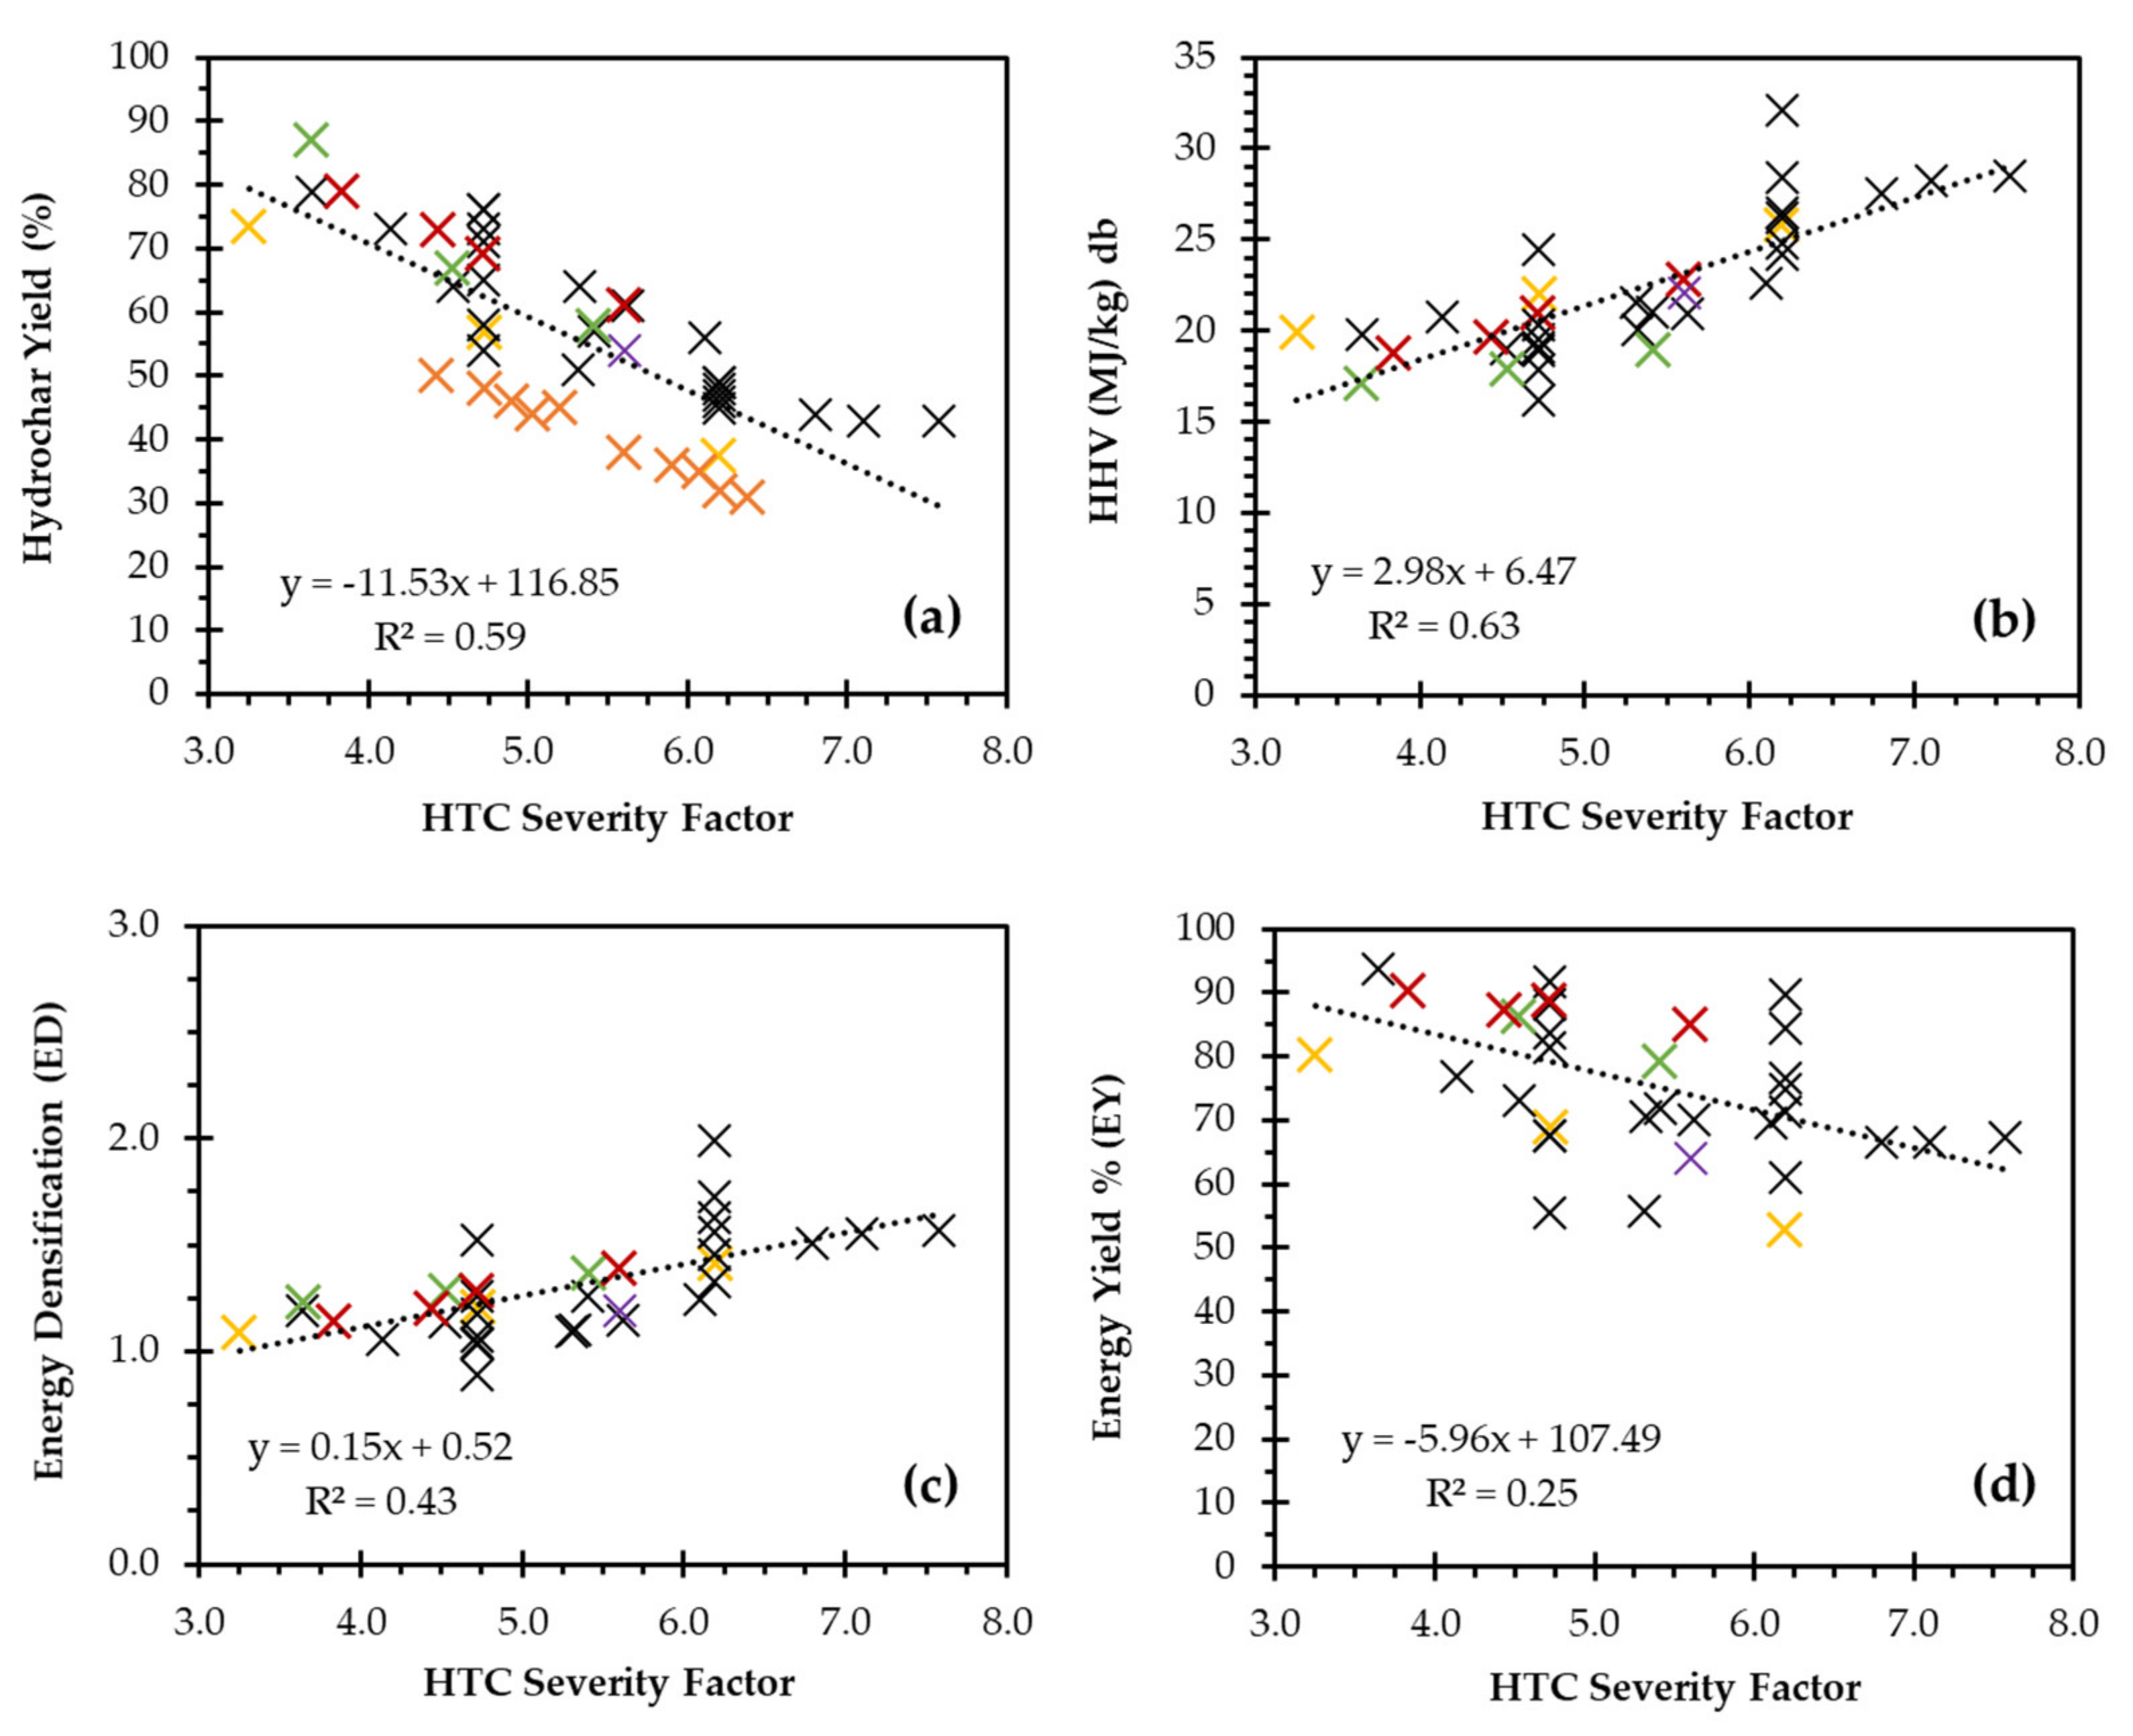
2.2.3. Hydrothermal Severity Factor
2.3. Biochemical Methane Potential
2.3.1. Theoretical Biochemical Methane Potential
2.3.2. Experimental Biochemical Methane Potential
2.4. Analytical Methods
2.4.1. Solid Sample Analysis
2.4.2. Aqueous Sample Analysis
2.5. Energy Balance Calculations
2.6. Error and Statistical Analysis
3. Results and Discussion
3.1. Influence of HTC on Hydrochar Properties
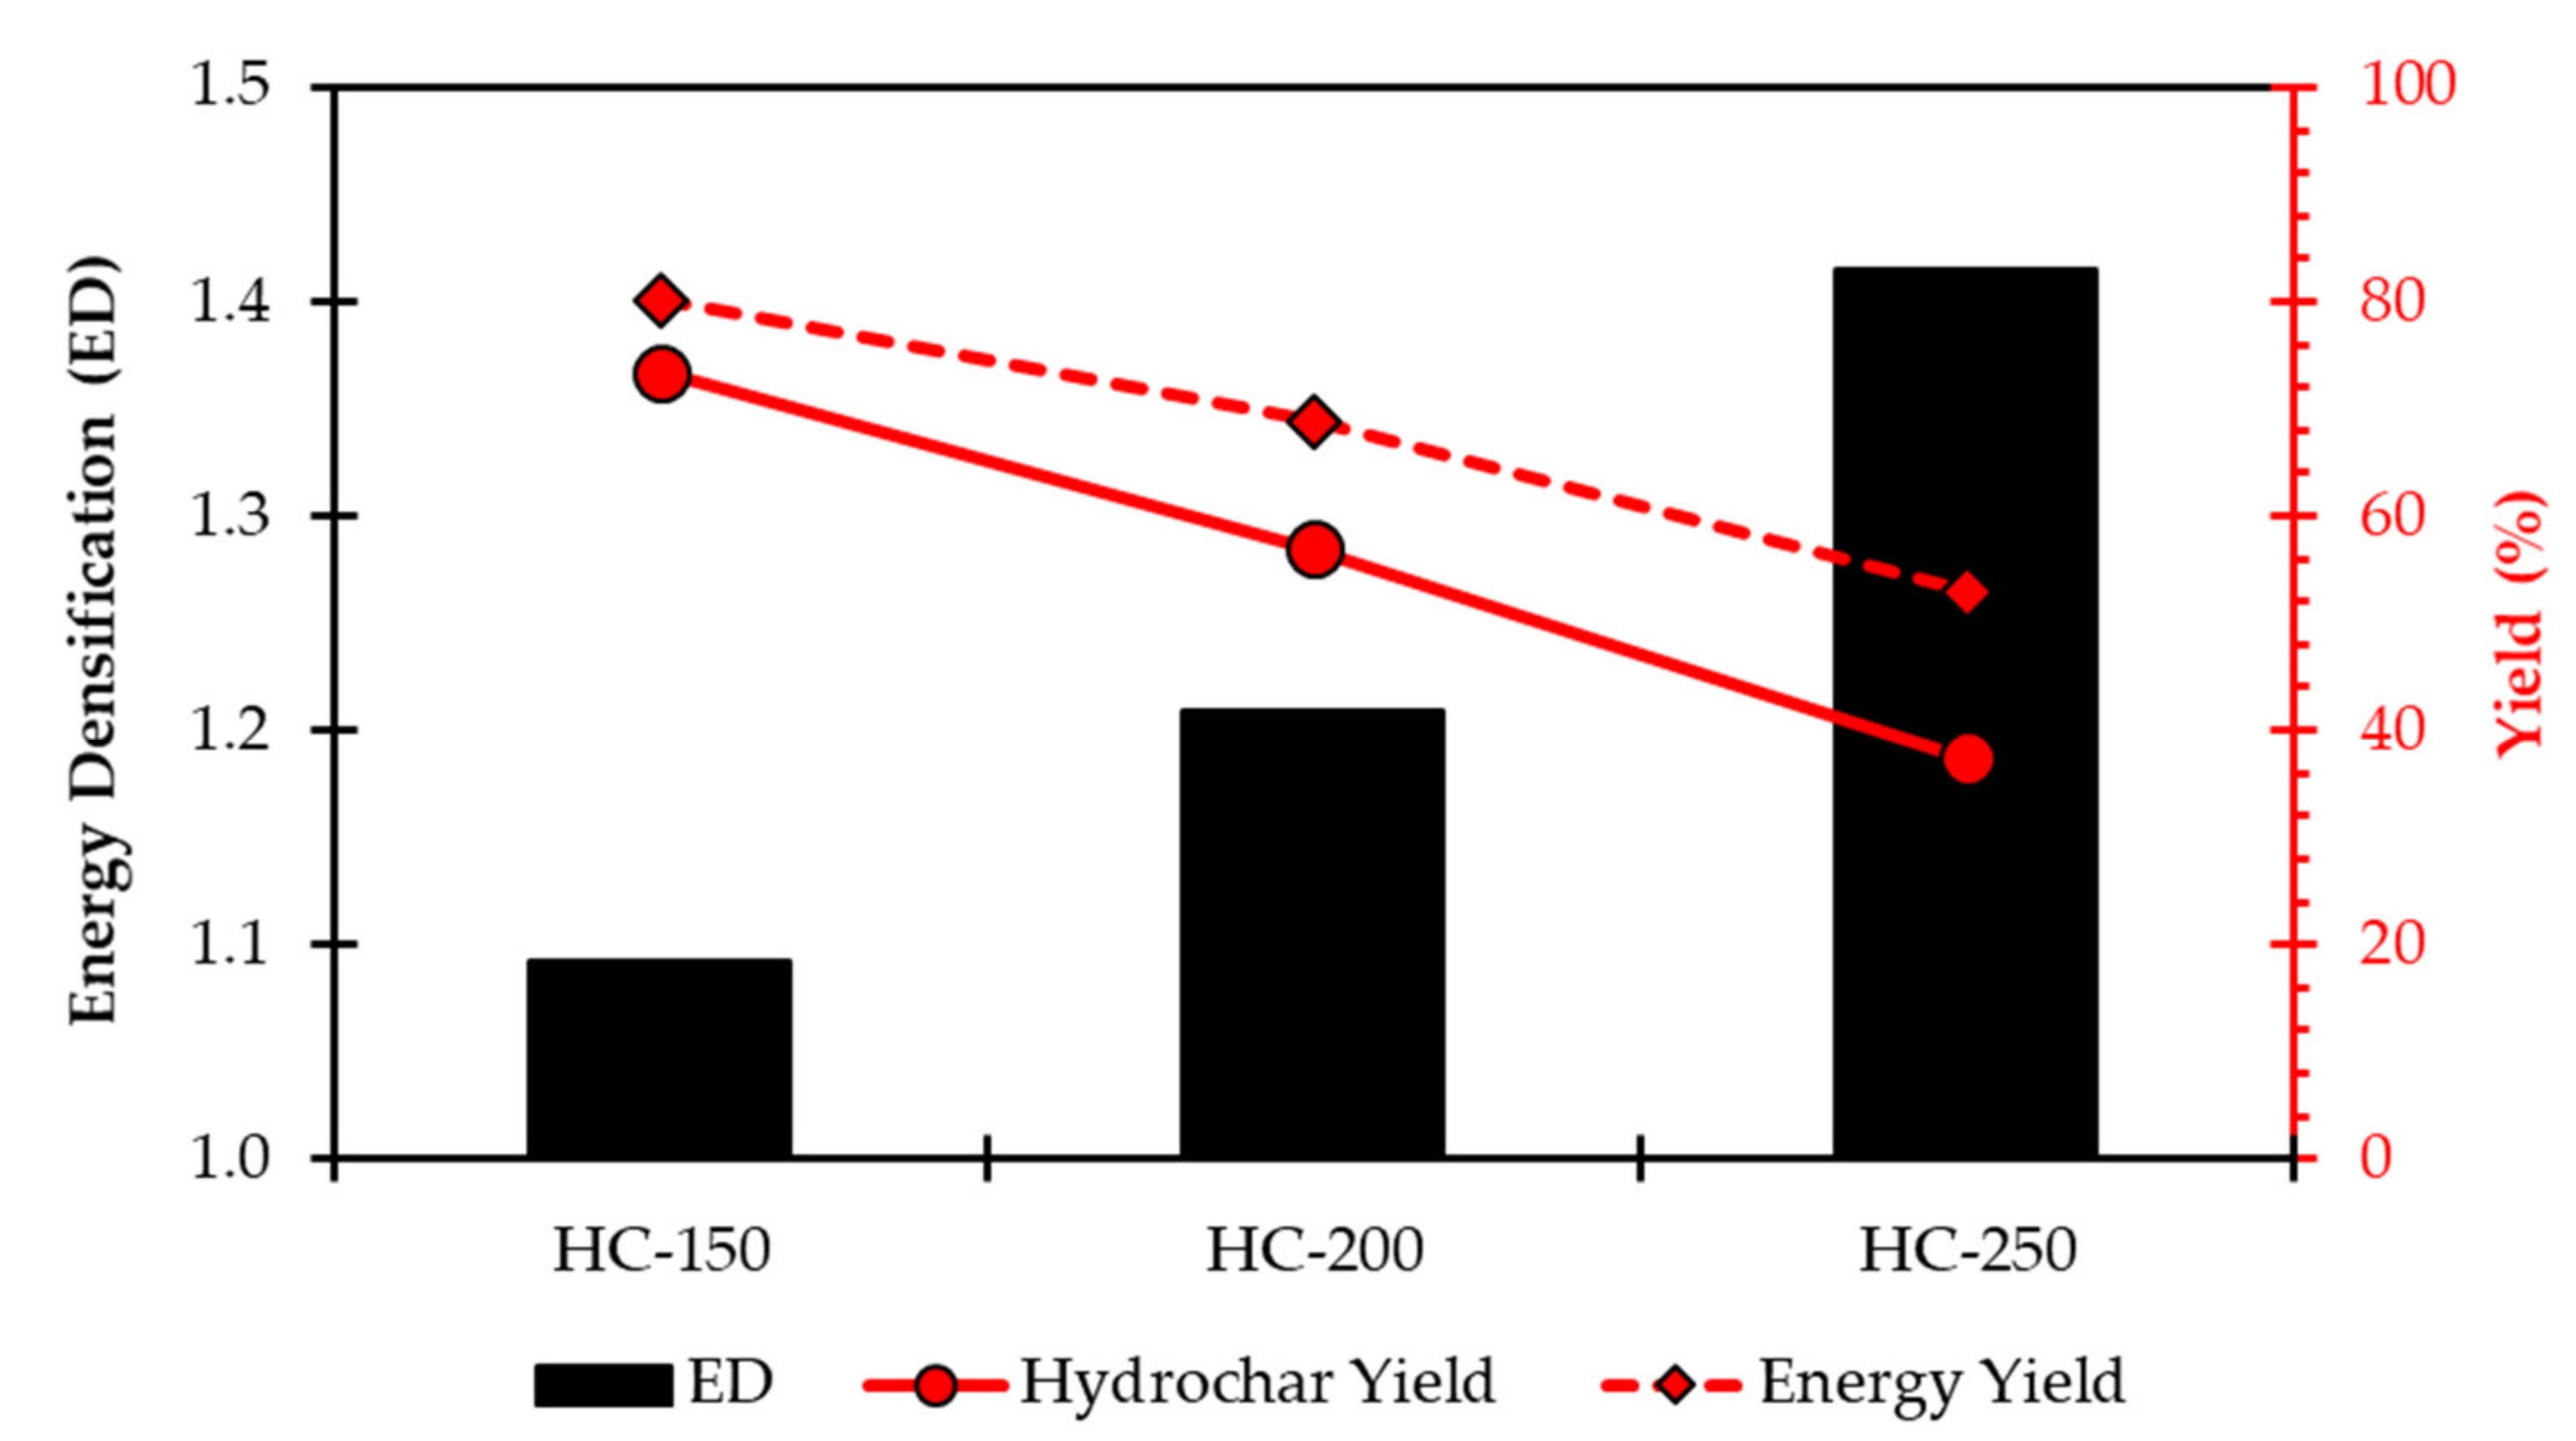
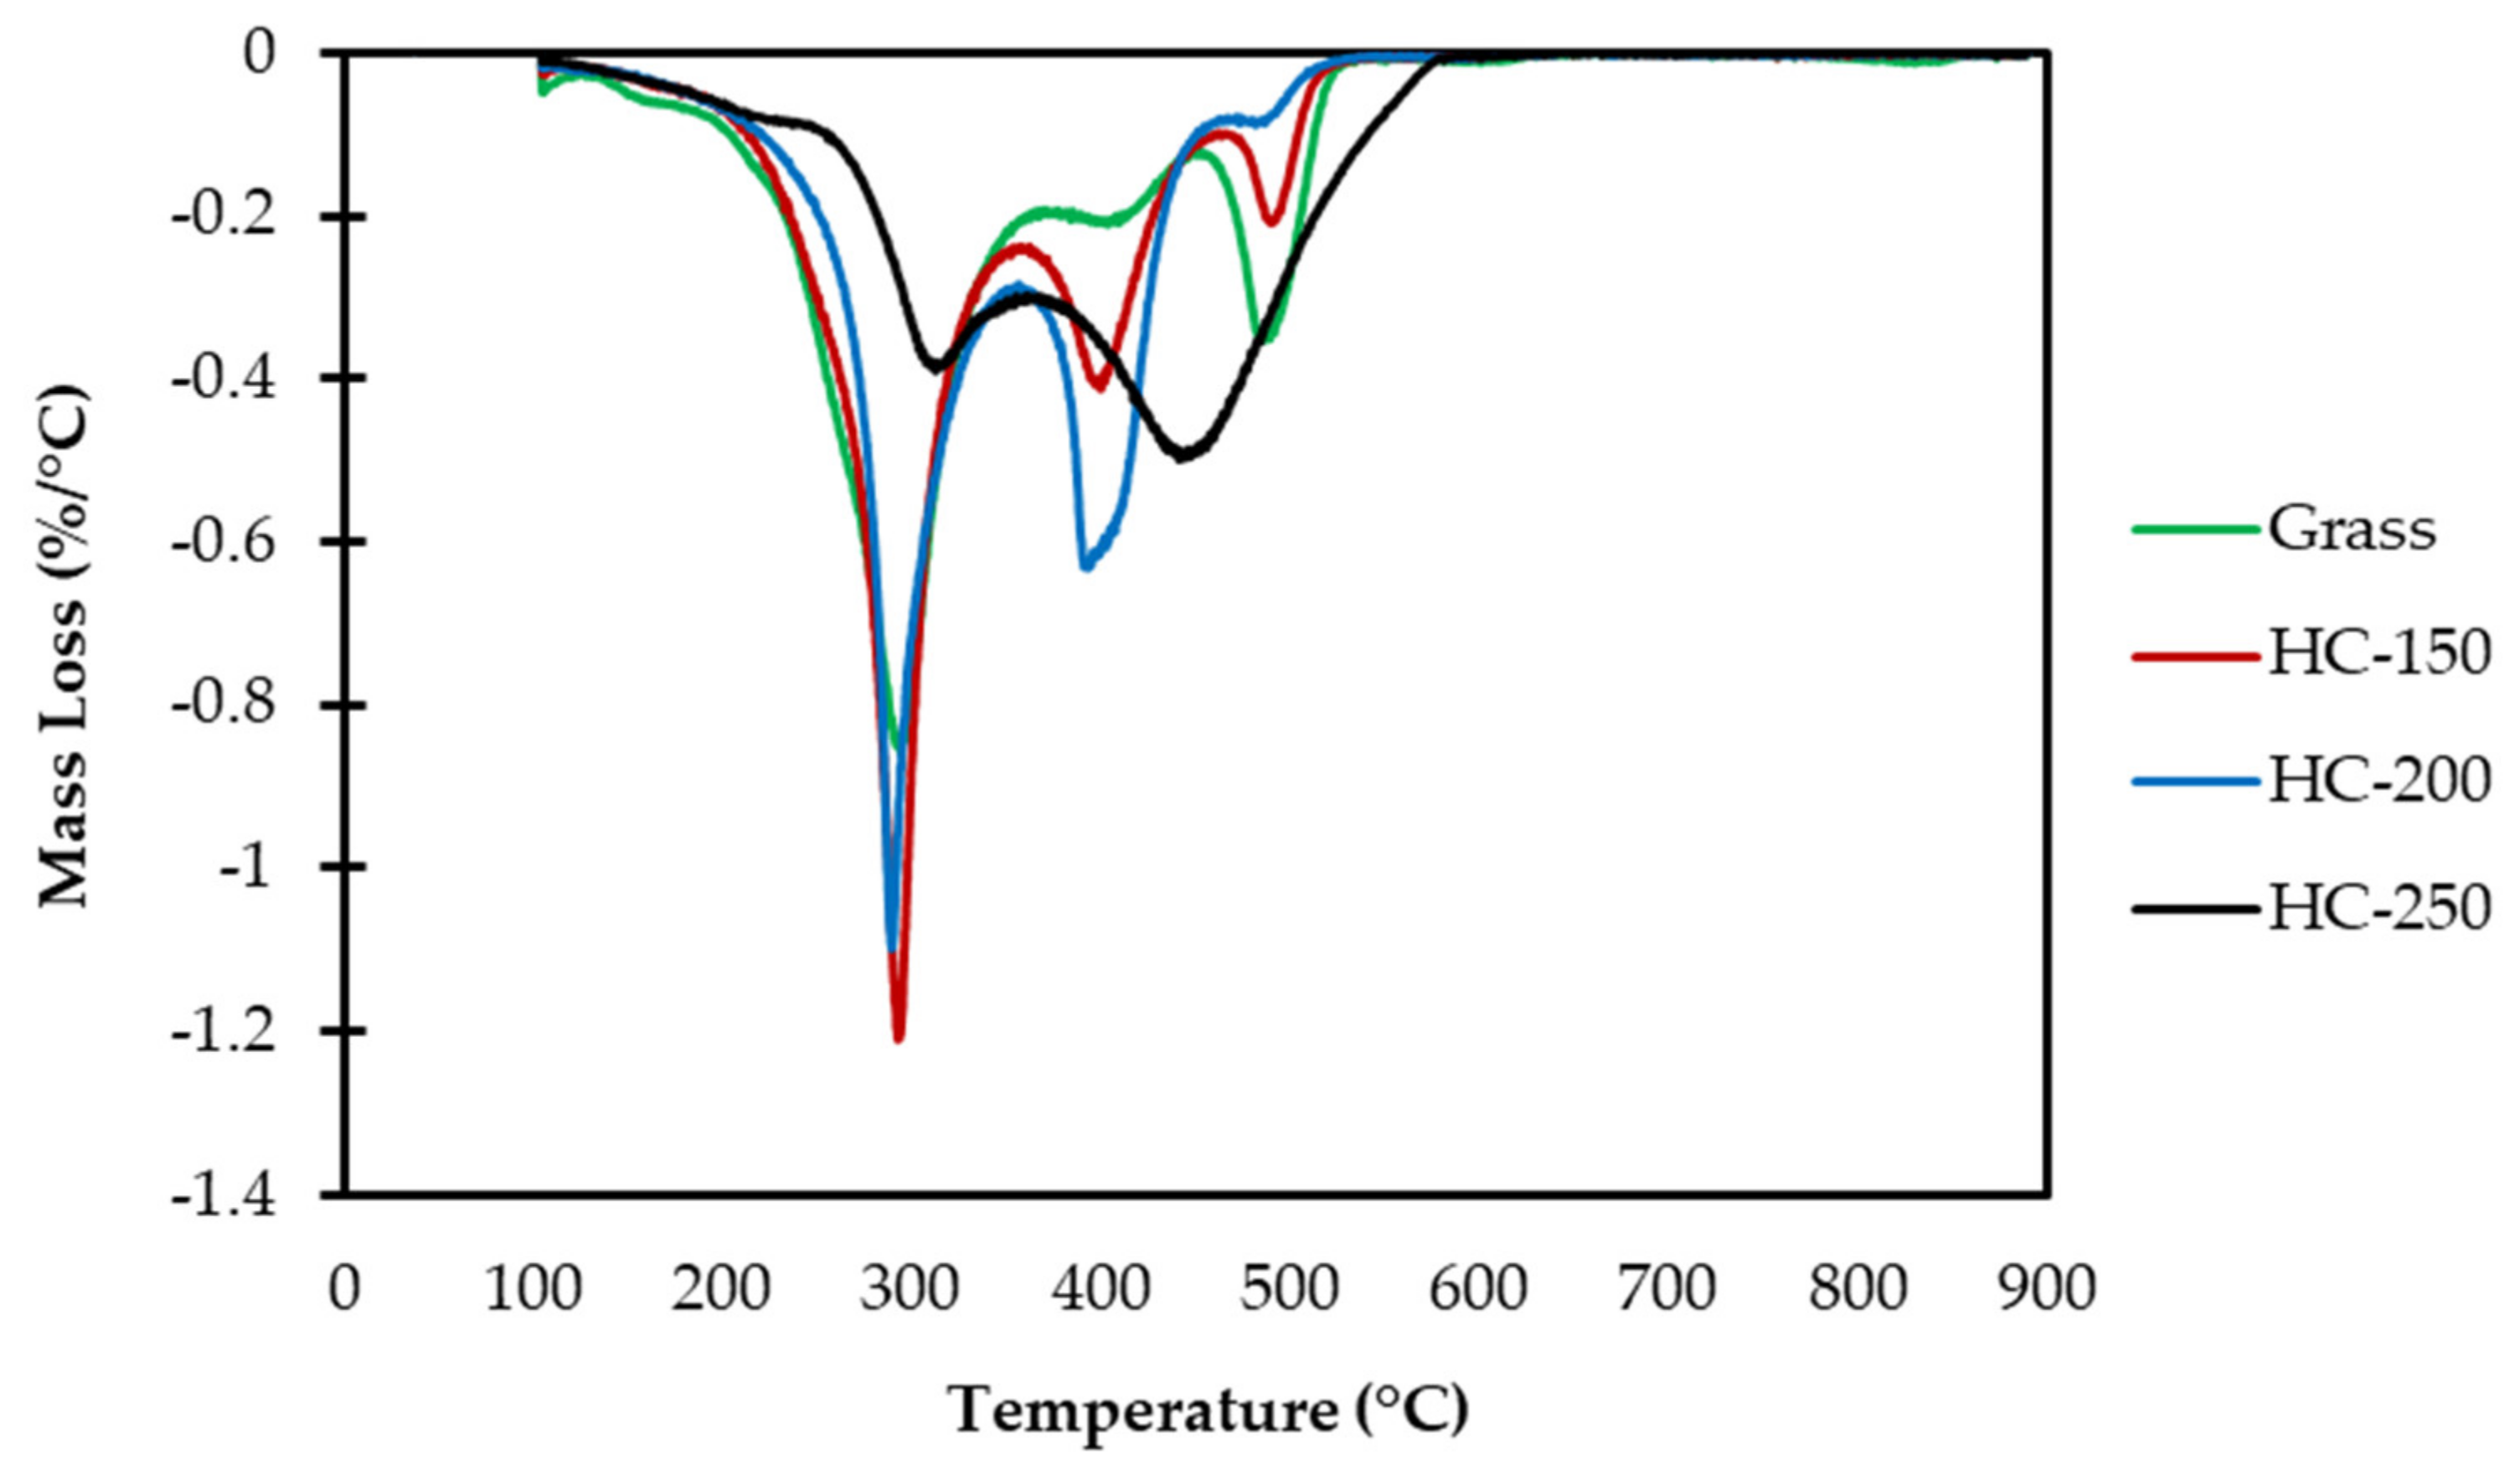
3.1.1. Proximate, Ultimate and Energy Densification Properties
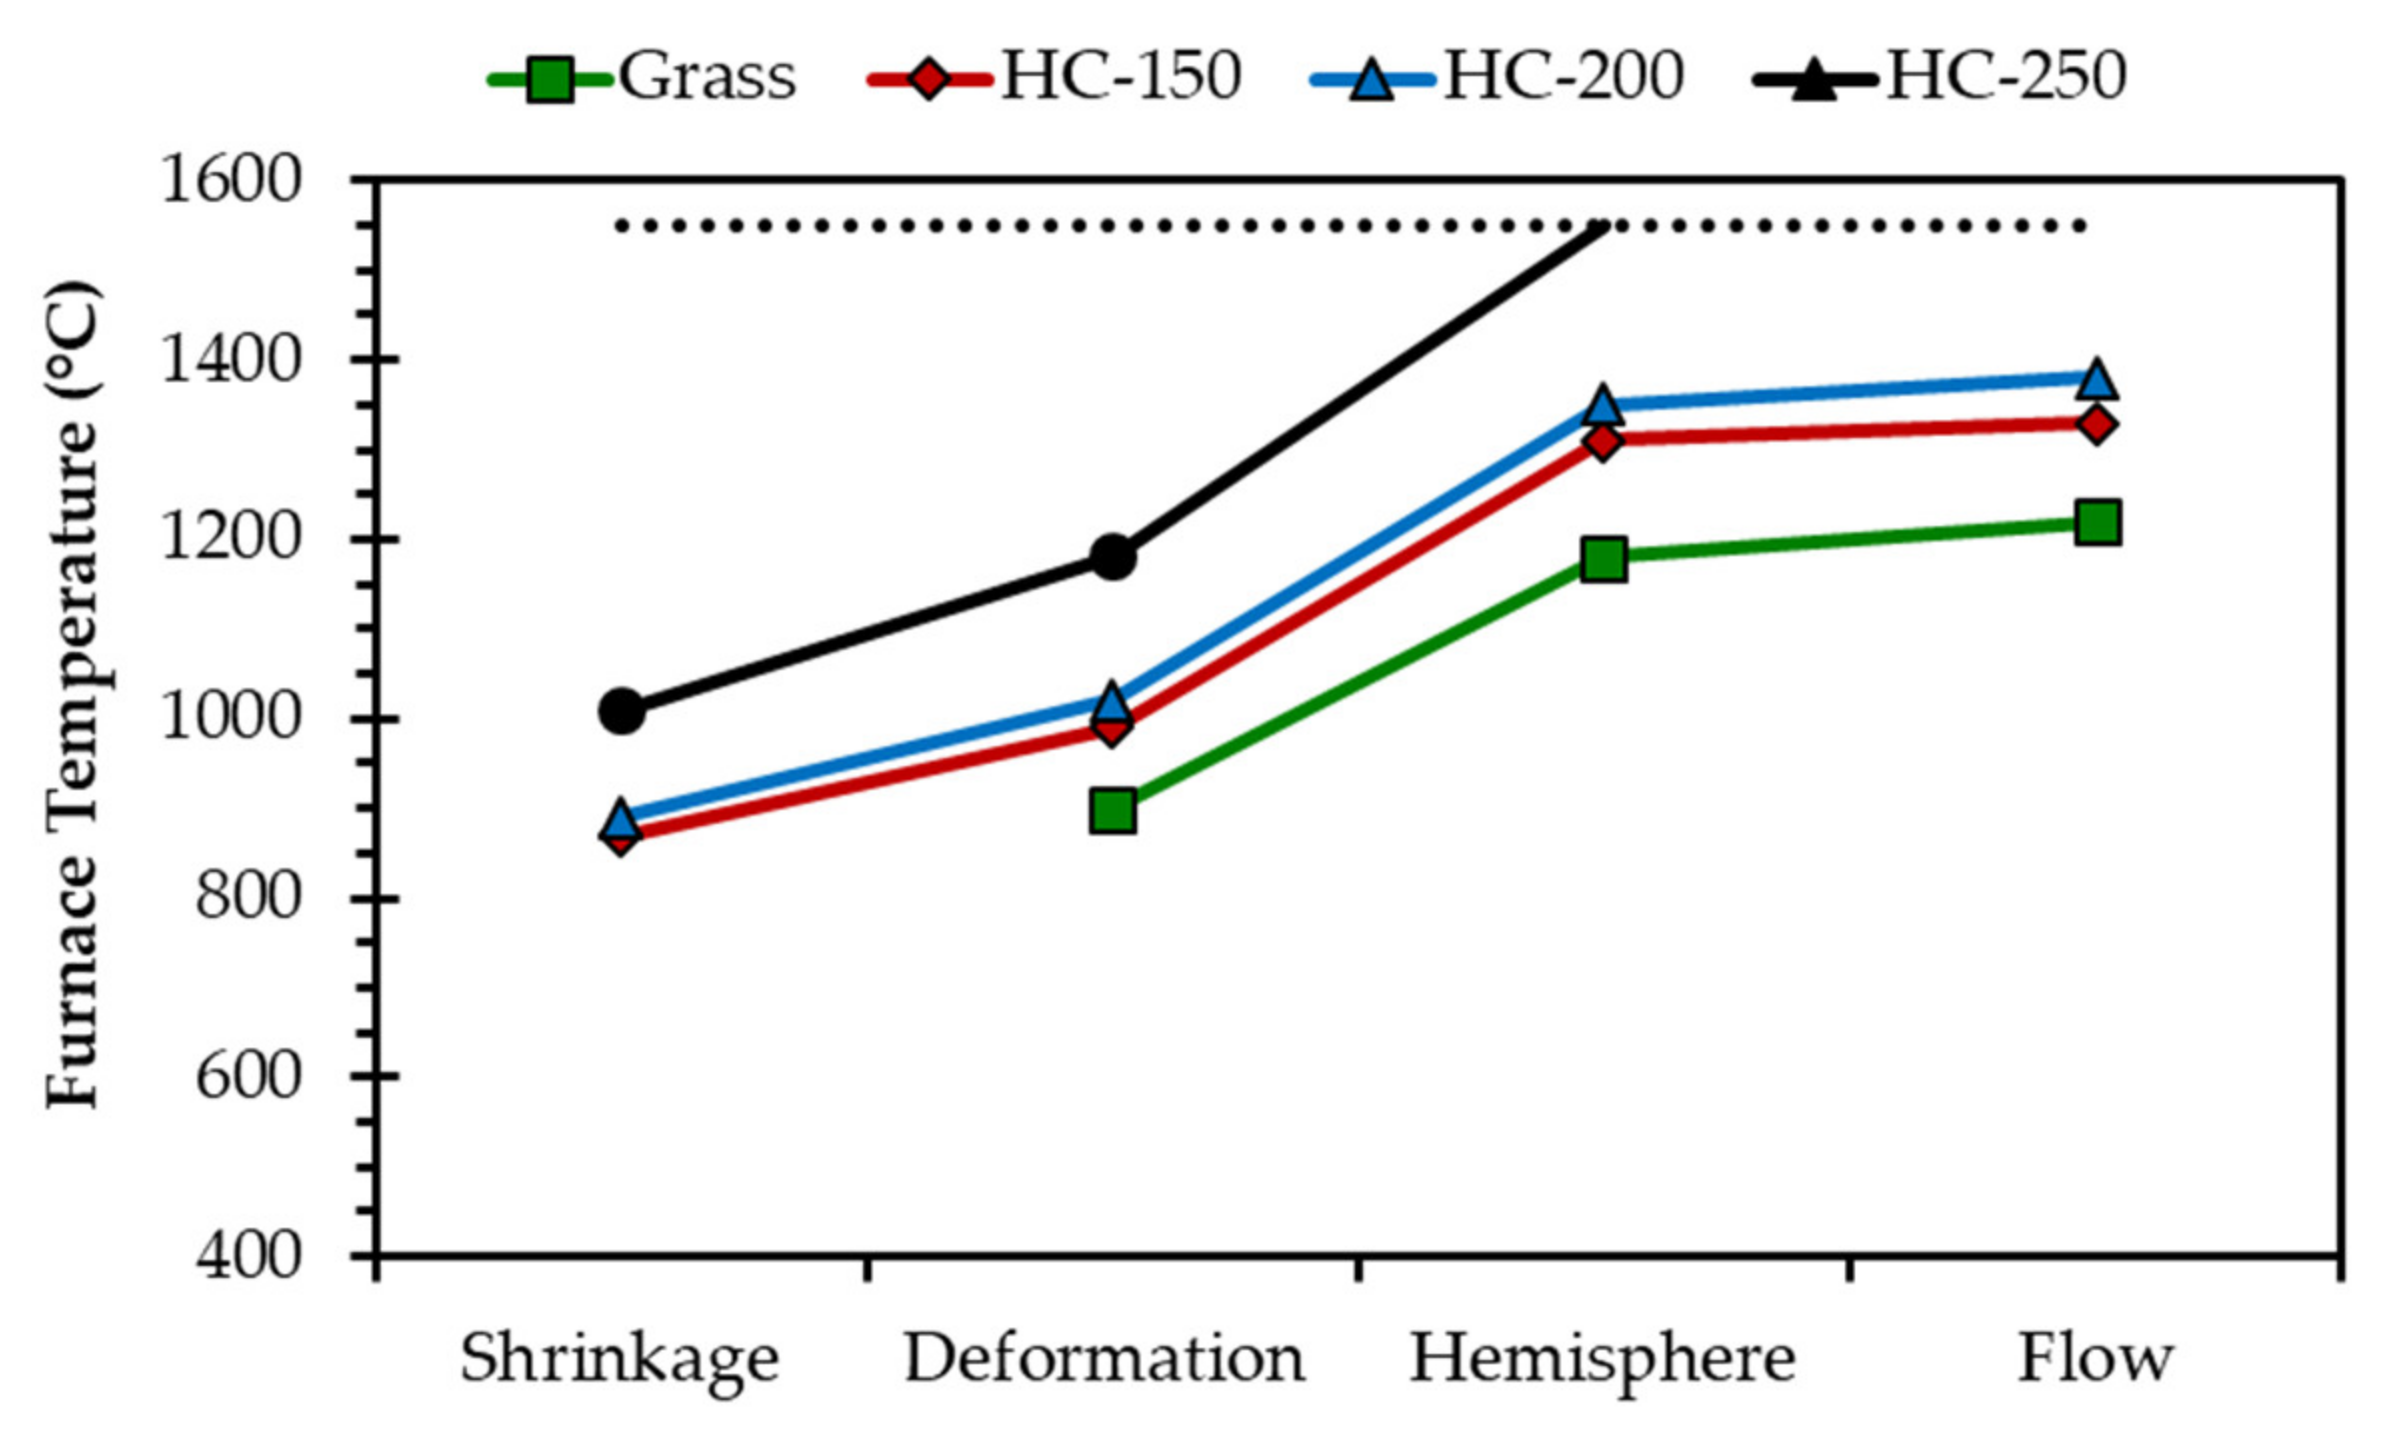
3.1.2. Inorganic Composition and Behaviour of Ash during Combustion
3.2. Influence of HTC on Process Water Composition
3.3. Biomethane Potential of Hydrothermal Products
3.3.1. Untreated Grass
3.3.2. Process Waters
3.3.3. Hydrochars
3.3.4. HTC Slurries
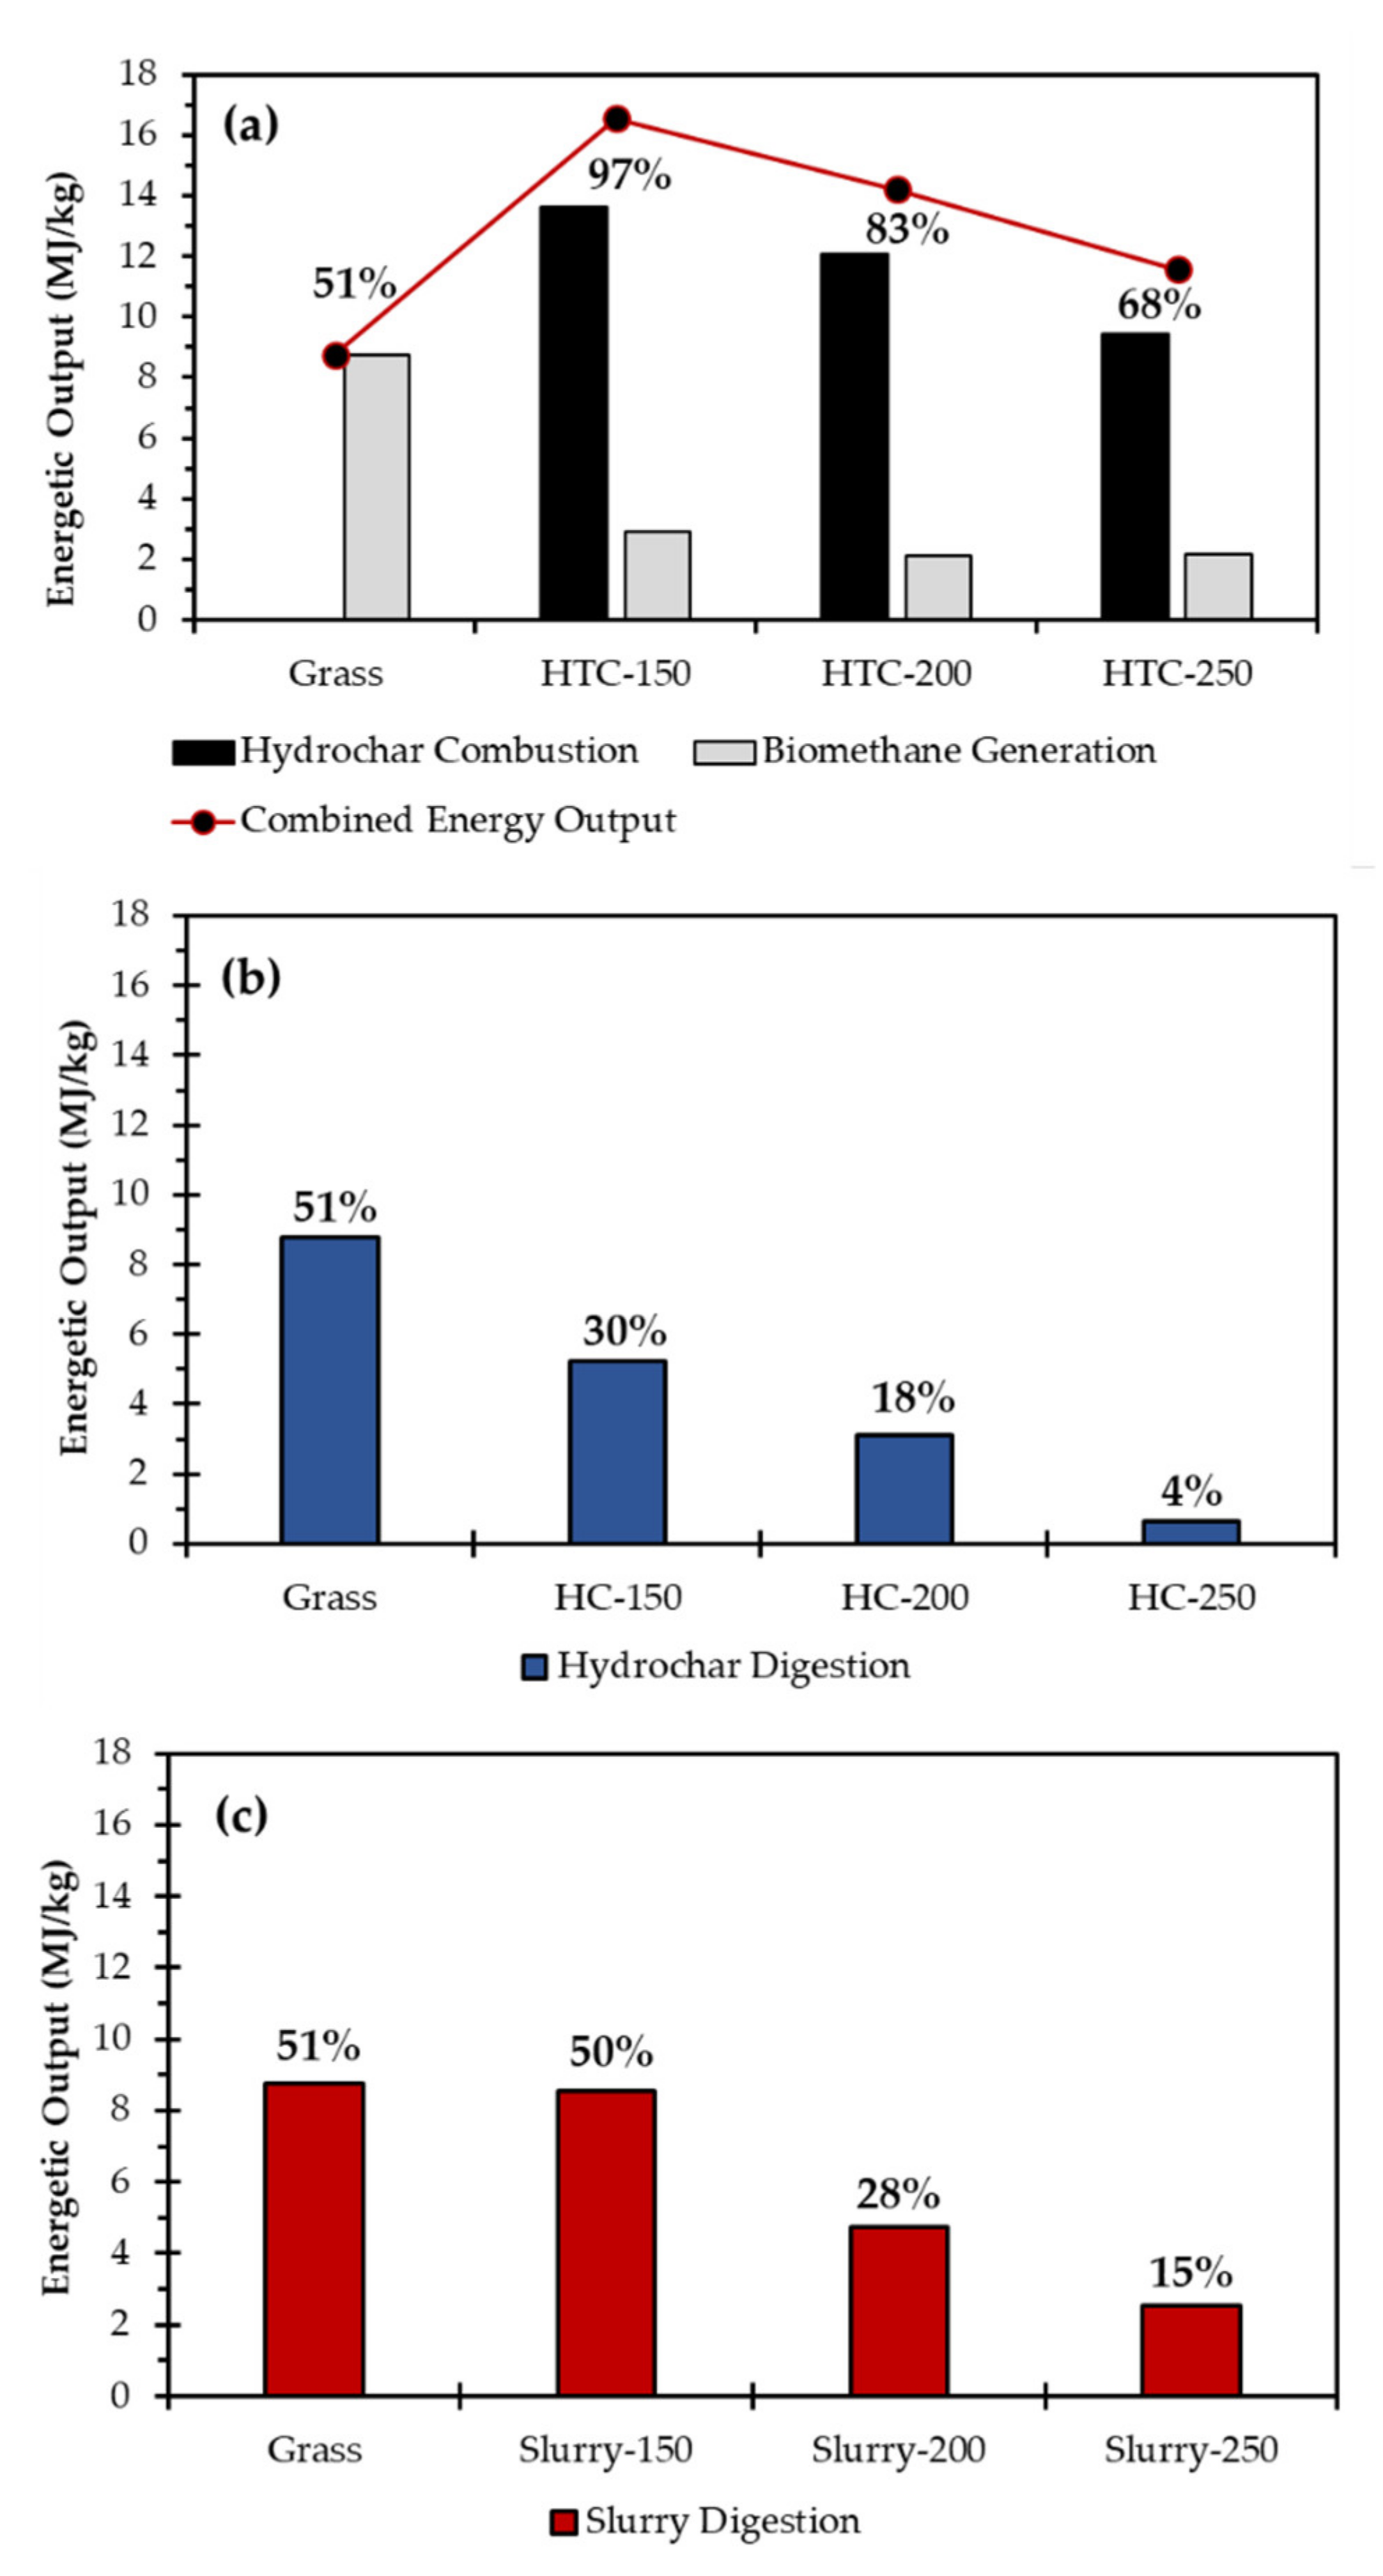
3.4. Energy Balance
4. Conclusions
Author Contributions
Funding
Institutional Review Board Statement
Informed Consent Statement
Data Availability Statement
Acknowledgments
Conflicts of Interest
References
- Prochnow, A.; Heiermann, M.; Plöchl, M.; Linke, B.; Idler, C.; Amon, T.; Hobbs, P.J. Bioenergy from permanent grassland—A review: 1. Biogas. Bioresour. Technol. 2009, 100, 4931–4944. [Google Scholar] [CrossRef] [PubMed]
- Smith, A.M.; Whittaker, C.; Shield, I.; Ross, A.B. The potential for production of high quality bio-coal from early harvested Miscanthus by hydrothermal carbonisation. Fuel 2018, 220, 546–557. [Google Scholar] [CrossRef]
- Brown, A.E.; Ford, J.S.; Bale, C.S.E.; Camargo-Valero, M.A.; Cheffins, N.J.; Mason, P.E.; Price-Allison, A.M.; Ross, A.B.; Taylor, P.G. An assessment of road-verge grass as a feedstock for farm-fed anaerobic digestion plants. Biomass Bioenergy 2020, 138, 105570. [Google Scholar] [CrossRef]
- Watson, L. The grass family, Poaceae. In Reproductive Versatility in the Grasses; Chapman, G.P., Ed.; Cambridge University Press: Cambridge, UK, 1990. [Google Scholar]
- Wall, D.M.; O’Kiely, P.; Murphy, J.D. The potential for biomethane from grass and slurry to satisfy renewable energy targets. Bioresour. Technol. 2013, 149, 425–431. [Google Scholar] [CrossRef] [PubMed]
- Rodriguez, C.; Alaswad, A.; Benyounis, K.Y.; Olabi, A.G. Pretreatment techniques used in biogas production from grass. Renew. Sustain. Energy Rev. 2017, 68, 1193–1204. [Google Scholar] [CrossRef] [Green Version]
- Basu, P. Biomass Gasification, Pyrolysis and Torrefaction: Practical Design and Theory; Academic Press: Cambridge, MA, USA, 2013. [Google Scholar]
- Smith, A.M.; Singh, S.; Ross, A.B. Fate of inorganic material during hydrothermal carbonisation of biomass: Influence of feedstock on combustion behaviour of hydrochar. Fuel 2016, 169, 135–145. [Google Scholar] [CrossRef]
- Nitsche, M.; Hensgen, F.; Wachendorf, M. Using grass cuttings from sports fields for anaerobic digestion and combustion. Energies 2017, 10, 388. [Google Scholar] [CrossRef] [Green Version]
- Smith, A.M.; Ross, A.B. The influence of residence time during hydrothermal carbonisation of miscanthus on bio-coal combustion chemistry. Energies 2019, 12, 523. [Google Scholar] [CrossRef] [Green Version]
- Mihajlović, M.; Petrović, J.; Maletić, S.; Isakovski, M.K.; Stojanović, M.; Lopičić, Z.; Trifunović, S. Hydrothermal carbonization of Miscanthus × giganteus: Structural and fuel properties of hydrochars and organic profile with the ecotoxicological assessment of the liquid phase. Energy Convers. Manag. 2018, 159, 254–263. [Google Scholar] [CrossRef]
- Reza, M.T.; Lynam, J.G.; Uddin, M.H.; Coronella, C.J. Hydrothermal carbonization: Fate of inorganics. Biomass Bioenergy 2013, 49, 86–94. [Google Scholar] [CrossRef]
- Chiumenti, A.; Boscaro, D.; Da Borso, F.; Sartori, L.; Pezzuolo, A. Biogas from fresh spring and summer grass: Effect of the harvesting period. Energies 2018, 11, 1466. [Google Scholar] [CrossRef] [Green Version]
- Cadavid Rodríguez, L.S.; Bolaños Valencia, I.V. Grass from public green spaces an alternative source of renewable energy in tropical countries. Rev. Investig. Optim. Nuevos Procesos En Ing. 2016, 29, 109–116. [Google Scholar] [CrossRef]
- Wang, Y.; Li, Y.; Zhang, Y.; Song, Y.; Yan, B.; Wu, W.; Zhong, L.; Li, N.; Chen, G.; Hou, L. Hydrothermal carbonization of garden waste by pretreatment with anaerobic digestion to improve hydrohcar performance and energy recovery. Sci. Total Environ. 2022, 807, 151014. [Google Scholar] [CrossRef]
- Yu, L.; Bule, M.; Ma, J.; Zhao, Q.; Frear, C.; Chen, S. Enhancing volatile fatty acid (VFA) and bio-methane production from lawn grass with pretreatment. Bioresour. Technol. 2014, 162, 243–249. [Google Scholar] [CrossRef]
- UKERC Energy Data Centre. Phyllis2: Database for Biomass and Waste. Available online: https://phyllis.nl/Browse/Standard/ECN-Phyllis#grass (accessed on 3 March 2022).
- Kruse, A.; Funke, A.; Titirici, M.M. Hydrothermal conversion of biomass to fuels and energetic materials. Curr. Opin. Chem. Biol. 2013, 17, 515–521. [Google Scholar] [CrossRef]
- Kambo, H.S.; Dutta, A. A comparative review of biochar and hydrochar in terms of production, physico-chemical properties and applications. Renew. Sustain. Energy Rev. 2015, 45, 359–378. [Google Scholar] [CrossRef]
- Funke, A.; Ziegler, F. Hydrothermal carbonization of biomass: A summary and discussion of chemical mechanisms for process engineering. Biofuels Bioprod. Biorefining 2010, 4, 160–177. [Google Scholar] [CrossRef]
- Qadi, N.; Takeno, K.; Mosqueda, A.; Kobayashi, M.; Motoyama, Y.; Yoshikawa, K. Effect of Hydrothermal Carbonization Conditions on the Physicochemical Properties and Gasification Reactivity of Energy Grass. Energy Fuels 2019, 33, 6436–6443. [Google Scholar] [CrossRef]
- Guo, S.; Dong, X.; Liu, K.; Yu, H.; Zhu, C. Chemical, energetic, and structural characteristics of hydrothermal carbonization solid products for lawn grass. BioResources 2015, 10, 4613–4625. [Google Scholar] [CrossRef]
- Ipiales, R.P.; de la Rubia, M.A.; Diaz, E.; Mohedano, A.F.; Rodriguez, J.J. Integration of Hydrothermal Carbonization and Anaerobic Digestion for Energy Recovery of Biomass Waste: An Overview. Energy Fuels 2021, 35, 17032–17050. [Google Scholar] [CrossRef]
- Becker, R.; Dorgerloh, U.; Paulke, E.; Mumme, J.; Nehls, I. Hydrothermal carbonization of biomass: Major organic components of the aqueous phase. Chem. Eng. Technol. 2014, 37, 511–518. [Google Scholar] [CrossRef]
- Brown, A.E.; Finnerty, G.L.; Camargo-Valero, M.A.; Ross, A.B. Valorisation of Macroalgae via the Integration of Hydrothermal Carbonisation and Anaerobic Digestion. Bioresour. Technol. 2020, 312, 123539. [Google Scholar] [CrossRef] [PubMed]
- Brown, A.E.; Adams, J.M.M.; Grasham, O.R.; Camargo-valero, M.A.; Ross, A.B. An Assessment of Different Integration Strategies of Hydrothermal Carbonisation and Anaerobic Digestion of Water Hyacinth. Energies 2020, 13, 5983. [Google Scholar] [CrossRef]
- Marin-Batista, J.D.; Villamil, J.A.; Rodriguez, J.J.; Mohedano, A.F.; Rubia, M.A. De Valorization of microalgal biomass by hydrothermal carbonization and anaerobic digestion. Bioresour. Technol. 2019, 274, 395–402. [Google Scholar] [CrossRef] [PubMed]
- Marin-Batista, J.D.; Villamil, J.A.; Qaramaleki, S.V.; Coronella, C.J.; Mohedano, A.F.; de la Rubia, M.A. Energy valorization of cow manure by hydrothermal carbonization and anaerobic digestion. Renew. Energy 2020, 160, 623–632. [Google Scholar] [CrossRef]
- Lucian, M.; Volpe, M.; Merzari, F.; Wüst, D.; Kruse, A.; Andreottola, G.; Fiori, L. Hydrothermal carbonization coupled with anaerobic digestion for the valorization of the organic fraction of municipal solid waste. Bioresour. Technol. 2020, 314, 123734. [Google Scholar] [CrossRef]
- Aragón-Briceño, C.; Ross, A.B.; Camargo-Valero, M.A. Evaluation and comparison of product yields and bio-methane potential in sewage digestate following hydrothermal treatment. Appl. Energy 2017, 208, 1357–1369. [Google Scholar] [CrossRef]
- Luz, F.C.; Volpe, M.; Fiori, L.; Manni, A.; Cordiner, S.; Mulone, V.; Rocco, V. Spent coffee enhanced biomethane potential via an integrated hydrothermal carbonization-anaerobic digestion process. Bioresour. Technol. 2018, 256, 102–109. [Google Scholar] [CrossRef]
- Lin, R.; Deng, C.; Ding, L.; Bose, A.; Murphy, J.D. Improving gaseous biofuel production from seaweed Saccharina latissima: The effect of hydrothermal pretreatment on energy efficiency. Energy Convers. Manag. 2019, 196, 1385–1394. [Google Scholar] [CrossRef]
- Wang, D.; Shen, F.; Yang, G.; Zhang, Y.; Deng, S.; Zhang, J.; Zeng, Y.; Luo, T.; Mei, Z. Can hydrothermal pretreatment improve anaerobic digestion for biogas from lignocellulosic biomass? Bioresour. Technol. 2018, 249, 117–124. [Google Scholar] [CrossRef]
- Parmar, K.R.; Ross, A.B. Integration of Hydrothermal Carbonisation with Anaerobic Digestion; Opportunities for Valorisation of Digestate. Energies 2019, 12, 1586. [Google Scholar] [CrossRef] [Green Version]
- Pagés-Díaz, J.; Alvarado, A.O.C.; Montalvo, S.; Diaz-Robles, L.; Curio, C.H. Anaerobic bio-methane potential of the liquors from hydrothermal carbonization of different lignocellulose biomasses. Renew. Energy 2020, 157, 182–189. [Google Scholar] [CrossRef]
- Parmar, K.R.; Brown, A.E.; Hammerton, J.M.; Camargo-Valero, M.A.; Fletcher, L.A.; Ross, A.B. Co-Processing Lignocellulosic Biomass and Sewage Digestate by Hydrothermal Carbonisation: Influence of Blending on Product Quality. Energies 2022, 15, 1418. [Google Scholar] [CrossRef]
- Heidari, M.; Norouzi, O.; Salaudeen, S.; Acharya, B.; Dutta, A. Prediction of Hydrothermal Carbonization with Respect to the Biomass Components and Severity Factor. Energy Fuels 2019, 33, 9916–9924. [Google Scholar] [CrossRef]
- Raposo, F.; Fernández-Cegrí, V.; de la Rubia, M.A.; Borja, R.; Béline, F.; Cavinato, C.; Demirer, G.; Fernández, B.; Fernández-Polanco, M.; Frigon, J.C.; et al. Biochemical methane potential (BMP) of solid organic substrates: Evaluation of anaerobic biodegradability using data from an international interlaboratory study. J. Chem. Technol. Biotechnol. 2011, 86, 1088–1098. [Google Scholar] [CrossRef]
- APHA Standard Methods for the Examination of Water and Wastewater; American Public Health Association: Washington, DC, USA, 2005.
- He, C.; Giannis, A.; Wang, J.Y. Conversion of sewage sludge to clean solid fuel using hydrothermal carbonization: Hydrochar fuel characteristics and combustion behavior. Appl. Energy 2013, 111, 257–266. [Google Scholar] [CrossRef]
- Mitchell, E.J.S.; Lea-Langton, A.R.; Jones, J.M.; Williams, A.; Layden, P.; Johnson, R. The impact of fuel properties on the emissions from the combustion of biomass and other solid fuels in a fixed bed domestic stove. Fuel Process. Technol. 2016, 142, 115–123. [Google Scholar] [CrossRef]
- Andriamanohiarisoamanana, F.J.; Matsunami, N.; Yamashiro, T.; Iwasaki, M.; Ihara, I.; Umetsu, K. High-solids anaerobic mono-digestion of riverbank grass under thermophilic conditions. J. Environ. Sci. 2017, 52, 29–38. [Google Scholar] [CrossRef]
- Munawer, M.E. Human health and environmental impacts of coal combustion and post-combustion wastes. J. Sustain. Min. 2018, 17, 87–96. [Google Scholar] [CrossRef]
- Zhang, C.; Ma, X.; Chen, X.; Tian, Y.; Zhou, Y.; Lu, X.; Huang, T. Conversion of water hyacinth to value-added fuel via hydrothermal carbonization. Energy 2020, 197, 117193. [Google Scholar] [CrossRef]
- Reza, M.T.; Andert, J.; Wirth, B.; Busch, D.; Pielert, J.; Lynam, J.G.; Mumme, J. Hydrothermal Carbonization of Biomass for Energy and Crop Production. Appl. Bioenergy 2014, 1, 11–29. [Google Scholar] [CrossRef]
- Nizamuddin, S.; Baloch, H.A.; Griffin, G.J.; Mubarak, N.M.; Bhutto, A.W.; Abro, R.; Mazari, S.A.; Ali, B.S. An overview of effect of process parameters on hydrothermal carbonization of biomass. Renew. Sustain. Energy Rev. 2017, 73, 1289–1299. [Google Scholar] [CrossRef]
- Smith, A.M. Fate and Influence of Inorganics and Heteroatoms during the Hydrothermal Carbonisation of Biomass. Ph.D. Thesis, University of Leeds, Leeds, UK, 2018. [Google Scholar]
- Machado, N.T.; de Castro, D.A.R.; Santos, M.C.; Araújo, M.E.; Lüder, U.; Herklotz, L.; Werner, M.; Mumme, J.; Hoffmann, T. Process analysis of hydrothermal carbonization of corn Stover with subcritical H2O. J. Supercrit. Fluids 2018, 136, 110–122. [Google Scholar] [CrossRef]
- Nakason, K.; Panyapinyopol, B.; Kanokkantapong, V.; Viriya-empikul, N.; Kraithong, W.; Pavasant, P. Hydrothermal carbonization of unwanted biomass materials: Effect of process temperature and retention time on hydrochar and liquid fraction. J. Energy Inst. 2017, 91, 786–796. [Google Scholar] [CrossRef]
- Yenigün, O.; Demirel, B. Ammonia inhibition in anaerobic digestion: A review. Process Biochem. 2013, 48, 901–911. [Google Scholar] [CrossRef]
- Monlau, F.; Sambusiti, C.; Barakat, A.; Quéméneur, M.; Trably, E.; Steyer, J.P.; Carrère, H. Do furanic and phenolic compounds of lignocellulosic and algae biomass hydrolyzate inhibit anaerobic mixed cultures? A comprehensive review. Biotechnol. Adv. 2014, 32, 934–951. [Google Scholar] [CrossRef]
- Deng, C.; Lin, R.; Cheng, J.; Murphy, J.D. Can acid pre-treatment enhance biohydrogen and biomethane production from grass silage in single-stage and two-stage fermentation processes ? Energy Convers. Manag. 2019, 195, 738–747. [Google Scholar] [CrossRef]
- Nizami, A.S.; Orozco, A.; Groom, E.; Dieterich, B.; Murphy, J.D. How much gas can we get from grass? Appl. Energy 2012, 92, 783–790. [Google Scholar] [CrossRef]
- Raju, C.S.; Ward, A.J.; Nielsen, L.; Møller, H.B. Comparison of near infra-red spectroscopy, neutral detergent fibre assay and in-vitro organic matter digestibility assay for rapid determination of the biochemical methane potential of meadow grasses. Bioresour. Technol. 2011, 102, 7835–7839. [Google Scholar] [CrossRef]
- Zhang, Y.; Kusch-Brandt, S.; Salter, A.M.; Heaven, S. Estimating the methane potential of energy crops: An overview on types of data sources and their limitations. Processes 2021, 9, 1565. [Google Scholar] [CrossRef]
- Erdogan, E.; Atila, B.; Mumme, J.; Reza, M.T.; Toptas, A.; Elibol, M.; Yanik, J. Characterization of products from hydrothermal carbonization of orange pomace including anaerobic digestibility of process liquor. Bioresour. Technol. 2015, 196, 35–42. [Google Scholar] [CrossRef]
- Hoekman, S.K.; Broch, A.; Robbins, C. Hydrothermal carbonization (HTC) of lignocellulosic biomass. Energy Fuels 2012, 25, 1802–1810. [Google Scholar] [CrossRef]
- Ward, A.J.; Hobbs, P.J.; Holliman, P.J.; Jones, D.L. Optimisation of the anaerobic digestion of agricultural resources. Bioresour. Technol. 2008, 99, 7928–7940. [Google Scholar] [CrossRef]
- Mumme, J.; Srocke, F.; Heeg, K.; Werner, M. Use of biochars in anaerobic digestion. Bioresour. Technol. 2014, 164, 189–197. [Google Scholar] [CrossRef]
- Lin, R.; Deng, C.; Rajendran, K.; Bose, A.; Kang, X.; Murphy, J.D. Competing Reactions Limit Production of Sugars in Hydrothermal Hydrolysis of Grass Silage: An Assessment of the Effect of Temperature on Sugar Production and Parasitic Energy Demand. Front. Energy Res. 2020, 8, 255. [Google Scholar] [CrossRef]


| Analysis | Grass | HC-150 | HC-200 | HC-250 |
|---|---|---|---|---|
| VM (%db) | 73.8 | 77.7 | 69.7 | 58.6 |
| FC (%db) | 15.2 | 16.6 | 20.7 | 27.4 |
| Ash (%db) | 11.0 | 5.6 | 9.6 | 14.0 |
| C (%db) | 44.2 ± 1.0 | 45.2 ± 0.4 | 49.0 ± 0.6 | 57.2 ± 0.2 |
| H (%db) | 6.9 ± 0.8 | 6.1 ± 0.2 | 6.3 ± 0.4 | 6.1 ± 0.2 |
| N (%db) | 3.9 ± 0.1 | 3.0 ± 0.1 | 3.0 ± 0.0 | 3.4 ± 0.0 |
| S (%db) | ND | 0.4 ± 0.0 | 0.4 ± 0.0 | 0.4 ± 0.0 |
| O a (%db) | 34.0 ± 1.7 | 39.7 ± 0.3 | 31.8 ± 0.2 | 18.9 ± 0.1 |
| FC:VM | 0.21 | 0.21 | 0.30 | 0.47 |
| H:C b | 1.88 | 1.62 | 1.53 | 1.28 |
| O:C b | 0.58 | 0.66 | 0.49 | 0.25 |
| C:N c | 11.3 | 15.1 | 16.3 | 16.8 |
| TS (%ar) | 95.4 ± 0.9 | 93.8 ± 0.1 | 95.6 ± 0.0 | 97.5 ± 0.1 |
| VS (%ar) | 84.3 ± 0.7 | 83.0 ± 0.1 | 84.0 ± 0.2 | 81.5 ± 0.0 |
| VS (%TS) | 88.3 | 88.5 | 87.9 | 83.6 |
| HHV d (MJ/kg db) | 18.8 | 16.9 | 19.8 | 24.7 |
| HHV e (MJ/kg db) | 18.2 | 19.9 | 22.0 | 25.8 |
| Element | Grass | HC-150 | HC-200 | HC-250 |
|---|---|---|---|---|
| Inorganic Content (wt% db) | ||||
| Na | 0.1 | 0.0 | 0.0 | 0.0 |
| Mg | 0.3 | 0.2 | 0.2 | 0.4 |
| Si | 1.9 | 2.4 | 2.6 | 3.9 |
| P | 0.6 | 0.6 | 0.7 | 1.5 |
| Cl | 1.2 | 0.8 | 0.7 | 0.2 |
| K | 2.7 | 1.8 | 1.6 | 0.6 |
| Ca | 1.5 | 1.6 | 1.7 | 2.9 |
| Fe | 0.0 | 0.0 | 0.1 | 0.1 |
| Removal Efficiency of Inorganics, Compared to Untreated Grass (%) | ||||
| Na | - | 52 | 68 | 87 |
| Mg | - | 45 | 59 | 56 |
| Si | - | 7 | 22 | 24 |
| P | - | 21 | 33 | 1 |
| Cl | - | 55 | 68 | 93 |
| K | - | 53 | 67 | 92 |
| Ca | - | 22 | 33 | 25 |
| Fe | - | 13 | 15 | 14 |
| Sample | Slagging and Fouling Index | |||||
|---|---|---|---|---|---|---|
| AI | BAI | Rb/a | SI | FI | SVI | |
| Grass | 1.84 | 0.02 | 1.4 | 0.6 | 4.8 | 61.3 |
| HC-150 | 1.09 | 0.03 | 0.9 | 0.3 | 2.0 | 66.4 |
| HC-200 | 0.89 | 0.04 | 0.8 | 0.3 | 1.6 | 66.5 |
| HC-250 | 0.27 | 0.17 | 0.7 | 0.3 | 0.5 | 63.4 |
| Analysis | PW-150 | PW-200 | PW-250 |
|---|---|---|---|
| PW Yield (%) | 26.0 ± 2.8 | 42.2 ± 2.7 | 61.1 ± 4.0 |
| COD (g/L) | 34.6 ± 1.3 | 33.0 ± 0.6 | 34.2 ± 0.4 |
| TOC (g/L) | 13.5 ± 0.0 | 12.3 ± 0.0 | 12.4 ± 0.0 |
| TS (g/L) | 33.0 ± 0.1 | 27.1 ± 0.1 | 23.4 ± 0.0 |
| VS (g/L) | 27.2 ± 0.1 | 20.9 ± 0.0 | 18.2 ± 0.1 |
| Ash (g/L) * | 5.8 ± 0.1 | 6.5 ± 0.1 | 5.2 ± 0.1 |
| Acetic Acid (mg/L) | 721.1 ± 86.2 | 1529.0 ± 70.0 | 1911.2 ± 41.9 |
| Propionic Acid (mg/L) | 48.3 ± 16.9 | 81.0 ± 3.5 | 123.8 ± 7.1 |
| Butyric Acid (mg/L) | 33.6 ± 2.9 | 33.6 ± 17.4 | 45.2 ± 4.3 |
| Total VFA (mg/L) | 830.5 ± 73.5 | 1676.1 ± 47.3 | 2124.7 ± 57.4 |
| Total Phenol (mg/L) | 237.3 ± 8.8 | 345.8 ± 16.6 | 590.0 ± 28.3 |
| TN (mg/L) | 1236 ± 25 | 1520 ± 17 | 1482 ± 20 |
| NH4+-N (mg/L) | 224 ± 1 | 218 ± 6 | 260 ± 2 |
| NH4+-N (%TN) | 18 | 14 | 18 |
| C:N | 10.9 | 8.1 | 8.4 |
| pH | 4.6 | 4.1 | 4.7 |
| Sample | EBMP (mL CH4/g VS) | TBMP (mL CH4/g VS) | BI (%) |
|---|---|---|---|
| Grass | 261.2 | 521.5 | 50 |
| HC-150 | 215.4 | 463.3 | 46 |
| HC-200 | 162.6 | 558.4 | 29 |
| HC-250 | 53.2 | 721.7 | 7 |
| Slurry-200 | 239.3 | 521.5 | 49 |
| Slurry-200 | 196.9 | 521.5 | 38 |
| Slurry-250 | 127.7 | 521.5 | 24 |
| Sample | EBMP (mL CH4/g COD) | TBMP (mL CH4/g COD) | BI (%) |
| PW-150 | 209.3 | 350.0 | 60 |
| PW-200 | 158.7 | 350.0 | 45 |
| PW250 | 152.4 | 350.0 | 44 |
| HTC-AD Integration Strategy | Temperature (°C) | Energy Input (MJ/kg Grass) | Energy Output (MJ/kg Grass) | EROI * |
|---|---|---|---|---|
| Combined HC combustion and PW digestion | 150 | 5.44 | 16.55 | 6.76 |
| 200 | 7.61 | 14.21 | 4.15 | |
| 250 | 9.79 | 11.58 | 2.63 | |
| HC digestion alone | 150 | 5.44 | 5.22 | 2.13 |
| 200 | 7.61 | 3.10 | 0.91 | |
| 250 | 9.79 | 0.65 | 0.15 | |
| Slurry digestion | 150 | 5.44 | 8.55 | 3.49 |
| 200 | 7.61 | 4.75 | 1.39 | |
| 250 | 9.79 | 2.54 | 0.58 |
Publisher’s Note: MDPI stays neutral with regard to jurisdictional claims in published maps and institutional affiliations. |
© 2022 by the authors. Licensee MDPI, Basel, Switzerland. This article is an open access article distributed under the terms and conditions of the Creative Commons Attribution (CC BY) license (https://creativecommons.org/licenses/by/4.0/).
Share and Cite
Brown, A.E.; Hammerton, J.M.; Camargo-Valero, M.A.; Ross, A.B. Integration of Hydrothermal Carbonisation and Anaerobic Digestion for the Energy Valorisation of Grass. Energies 2022, 15, 3495. https://doi.org/10.3390/en15103495
Brown AE, Hammerton JM, Camargo-Valero MA, Ross AB. Integration of Hydrothermal Carbonisation and Anaerobic Digestion for the Energy Valorisation of Grass. Energies. 2022; 15(10):3495. https://doi.org/10.3390/en15103495
Chicago/Turabian StyleBrown, Aaron E., James M. Hammerton, Miller Alonso Camargo-Valero, and Andrew B. Ross. 2022. "Integration of Hydrothermal Carbonisation and Anaerobic Digestion for the Energy Valorisation of Grass" Energies 15, no. 10: 3495. https://doi.org/10.3390/en15103495
APA StyleBrown, A. E., Hammerton, J. M., Camargo-Valero, M. A., & Ross, A. B. (2022). Integration of Hydrothermal Carbonisation and Anaerobic Digestion for the Energy Valorisation of Grass. Energies, 15(10), 3495. https://doi.org/10.3390/en15103495