1. Introduction
In the 21st century, energy and environment are fundamental issues for human survival and social development [
1,
2,
3]. With the reduction of non-renewable energy, the attention to environmental protection, as well as strict laws and regulations, electric vehicles with “energy saving” and “emission reduction” have become a hot spot for global research and development [
4,
5]. Compared with conventional internal combustion vehicles, electric vehicles have the dual advantages of environmental friendliness and high energy efficiency.
Due to the wide span of electric vehicles in geography, time and seasons, the operating temperature environment of lithium ion power batteries also spans a wide range [
6]. Generally speaking, the operating temperature range of the power battery is −20 °C to 50 °C. Changes in temperature directly affect the discharge performance and discharge capacity of a lithium ion battery [
7]. When the temperature decreases, the internal resistance of the battery increases, the electrochemical reaction speed slows down, the internal polarization resistance increases rapidly, and the discharge capacity and discharge platform decrease, which affects the battery power and energy output. Low temperature will cause the discharge capacity of a lithium ion battery to drop sharply. The discharge capacity at high temperature is close to or slightly higher than that at room temperature [
8]. High temperature can accelerate the migration speed of lithium ions [
9]. Nickel electrodes and hydrogen storage electrodes decompose or form hydrogen gas at high temperatures, resulting in the decrease in capacity. When the battery module is discharged at low temperature, the resistor generates heat to increase the battery temperature, which is expressed as a voltage increase. As the discharge progresses, the voltage gradually drops. Among all environmental factors, temperature has the greatest impact on the charge and discharge performance of lithium ion batteries [
10].
At present, many scholars have conducted related research and obtained certain results. Piernas-Muñoz et al. [
11] believed that silicon is a promising anode candidate material, evaluated the electrochemical performance of silicon-graphite (Si-Gr) half-cells at four different temperatures, and discussed the effect of adding fluoroethylene carbonate to the electrolyte. Wang et al. [
12] used the electrochemical impedance spectroscopy study of the palladium electrode in the electrolyte to study the thermal stability of the electrolyte at high temperature, and formed a new electrochemical impedance spectroscopy film on the original at high temperature. Jee HoYom et al. [
13] employed lithium powder to synthesize 71 SSR SiO with a pre-formed irreversible phase through a solid-state reaction to improve the initial Coulomb efficiency of SiO. A mixture consisting of 70% by weight SiO powder and 10% by weight lithium powder was heated at 600 °C for 2 h under an argon atmosphere. Marinaro et al. [
14] demonstrated that the Cu modified anode exhibits a significant improvement in its higher reversible capacity at low temperatures. Mostafa Al-Gabalawy et al. [
15] proposed a reliable and robust observer which could estimate the SOC and SOH of LiFePO
4 batteries simultaneously with high accuracy rates. Dina Emara et al. [
16] proposed a new type of control strategy, including independent mode and grid-connected mode, which can be considered for use in lithium battery functional systems. Eman S. Ali et al. [
17] proposed a two-stage program and multi-objective cat swarm optimization algorithm to solve the two-stage optimization problem of improving the performance of the power distribution system. Ahmed S. Abbas et al. [
18] proposed a harmonic suppression method to improve the power quality of the power distribution system. This method can be used for reference to the lithium battery automotive functional system. Ahmed F. Bendary et al. [
19] proposed a photovoltaic system fault tracking and detection method, which seems to be applicable to lithium battery systems. Martin Winter et al. [
20] believe that lithium-ion batteries are a key component of energy storage in automobiles and stationary applications. Ana-Irina Stan et al. [
21] thought that lithium-ion batteries are becoming the most attractive candidate for electrochemical storage systems for stationary applications, as well as power sources for sustainable automotive and backup power applications.
However, there is currently no clear theory on the effect of temperature on the capacity of lithium ion batteries with different anodes in the lithium ion battery industry [
22,
23,
24]. In addition, related calculation formulas and mathematical models are still in the exploratory stage. In the current study, the novelty is that we take lithium iron phosphate battery, lithium manganate battery and lithium cobalt oxide battery as the research objects, and simulate the operating temperature and tests the battery capacity at different temperatures. Through the simulation and regression analysis of the test data, the specific mathematical relationship between battery capacity and temperature is finally obtained.
2. Equipment and Methods
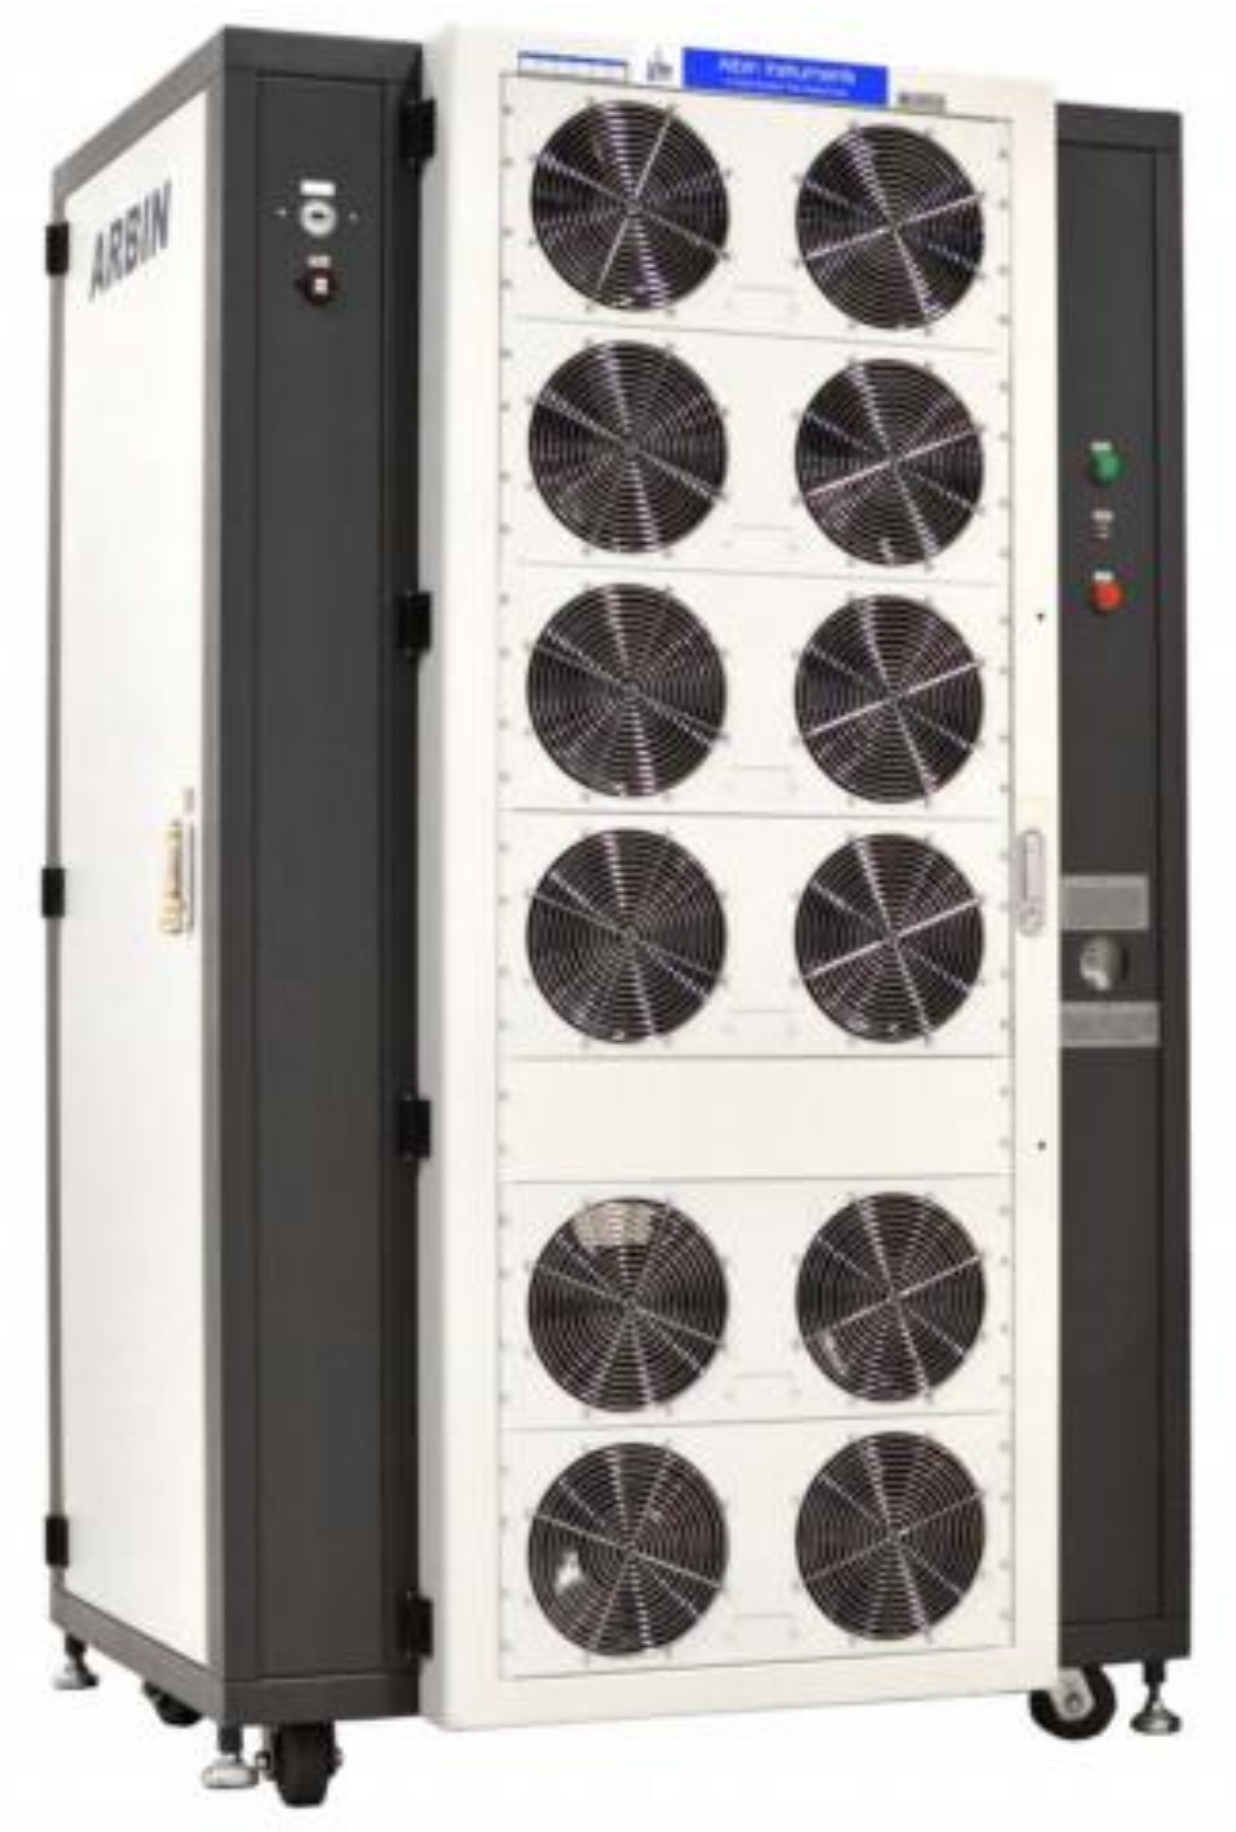
As shown in
Figure 1, the power battery test equipment used in this experiment includes an Arbin Instruments EVTS power battery test system, CDS5V-100A-CD power battery test system, and BTS-9000 high-performance battery monitoring system. The humidity chamber (model: SMC-800-CC-FB, Guangdong Sanmu Technology Co., Ltd. Dongguan, China) is used to simulate the battery working environment.
In the process of simulating the ambient temperature, the humidity chamber is set with 8 gradients, namely −40 °C, −20 °C, −10 °C, 0 °C, 25 °C, 40 °C, 55 °C and 60 °C and the relative humidity is 40%. The customization of the charging and discharging system will be elaborated in detail. The charging system is constant voltage and constant current charging under the condition of 25 °C. In more detail, constant current charge is carried out at a standard charging current of 0.2C (2A) to 3.65 V, then converted to 3.65 V constant voltage charging, until the charging current is less than less than 200 mA and then stop. The discharging system is to stand under the set temperature gradient and hold for 3 h to eliminate battery polarization and ensure stable temperature of incubator as well as battery thermal balance, and then discharge at a constant current of 1C (10A) to a cut-off voltage of 2 V to calculate the battery capacity. In order to ensure the comparability of the measured data under different temperature gradients, this experiment uses 25 °C as the criterion point of the temperature experiment, and then conducts the test in the order of low temperature and high temperature. The low temperature performance test ranges from 25 °C to −40 °C, with a total of five temperature gradients, namely 25 °C, 0 °C, −10 °C, −20 °C and −40 °C. The high-temperature performance test ranges from 25 °C to 60 °C, with a total of three temperature gradients, namely 40 °C, 55 °C and 60 °C.
3. Experimental Results and Discussion
3.1. The Influence of Temperature on Battery Capacity
3.1.1. Experimental Results
In order to ensure the accuracy of the experimental data and avoid random errors, the average value of the temperature gradient test data of three single batteries is used as the final value.
Table 1 shows the statistical result of the discharge capacity of a lithium iron phosphate battery.
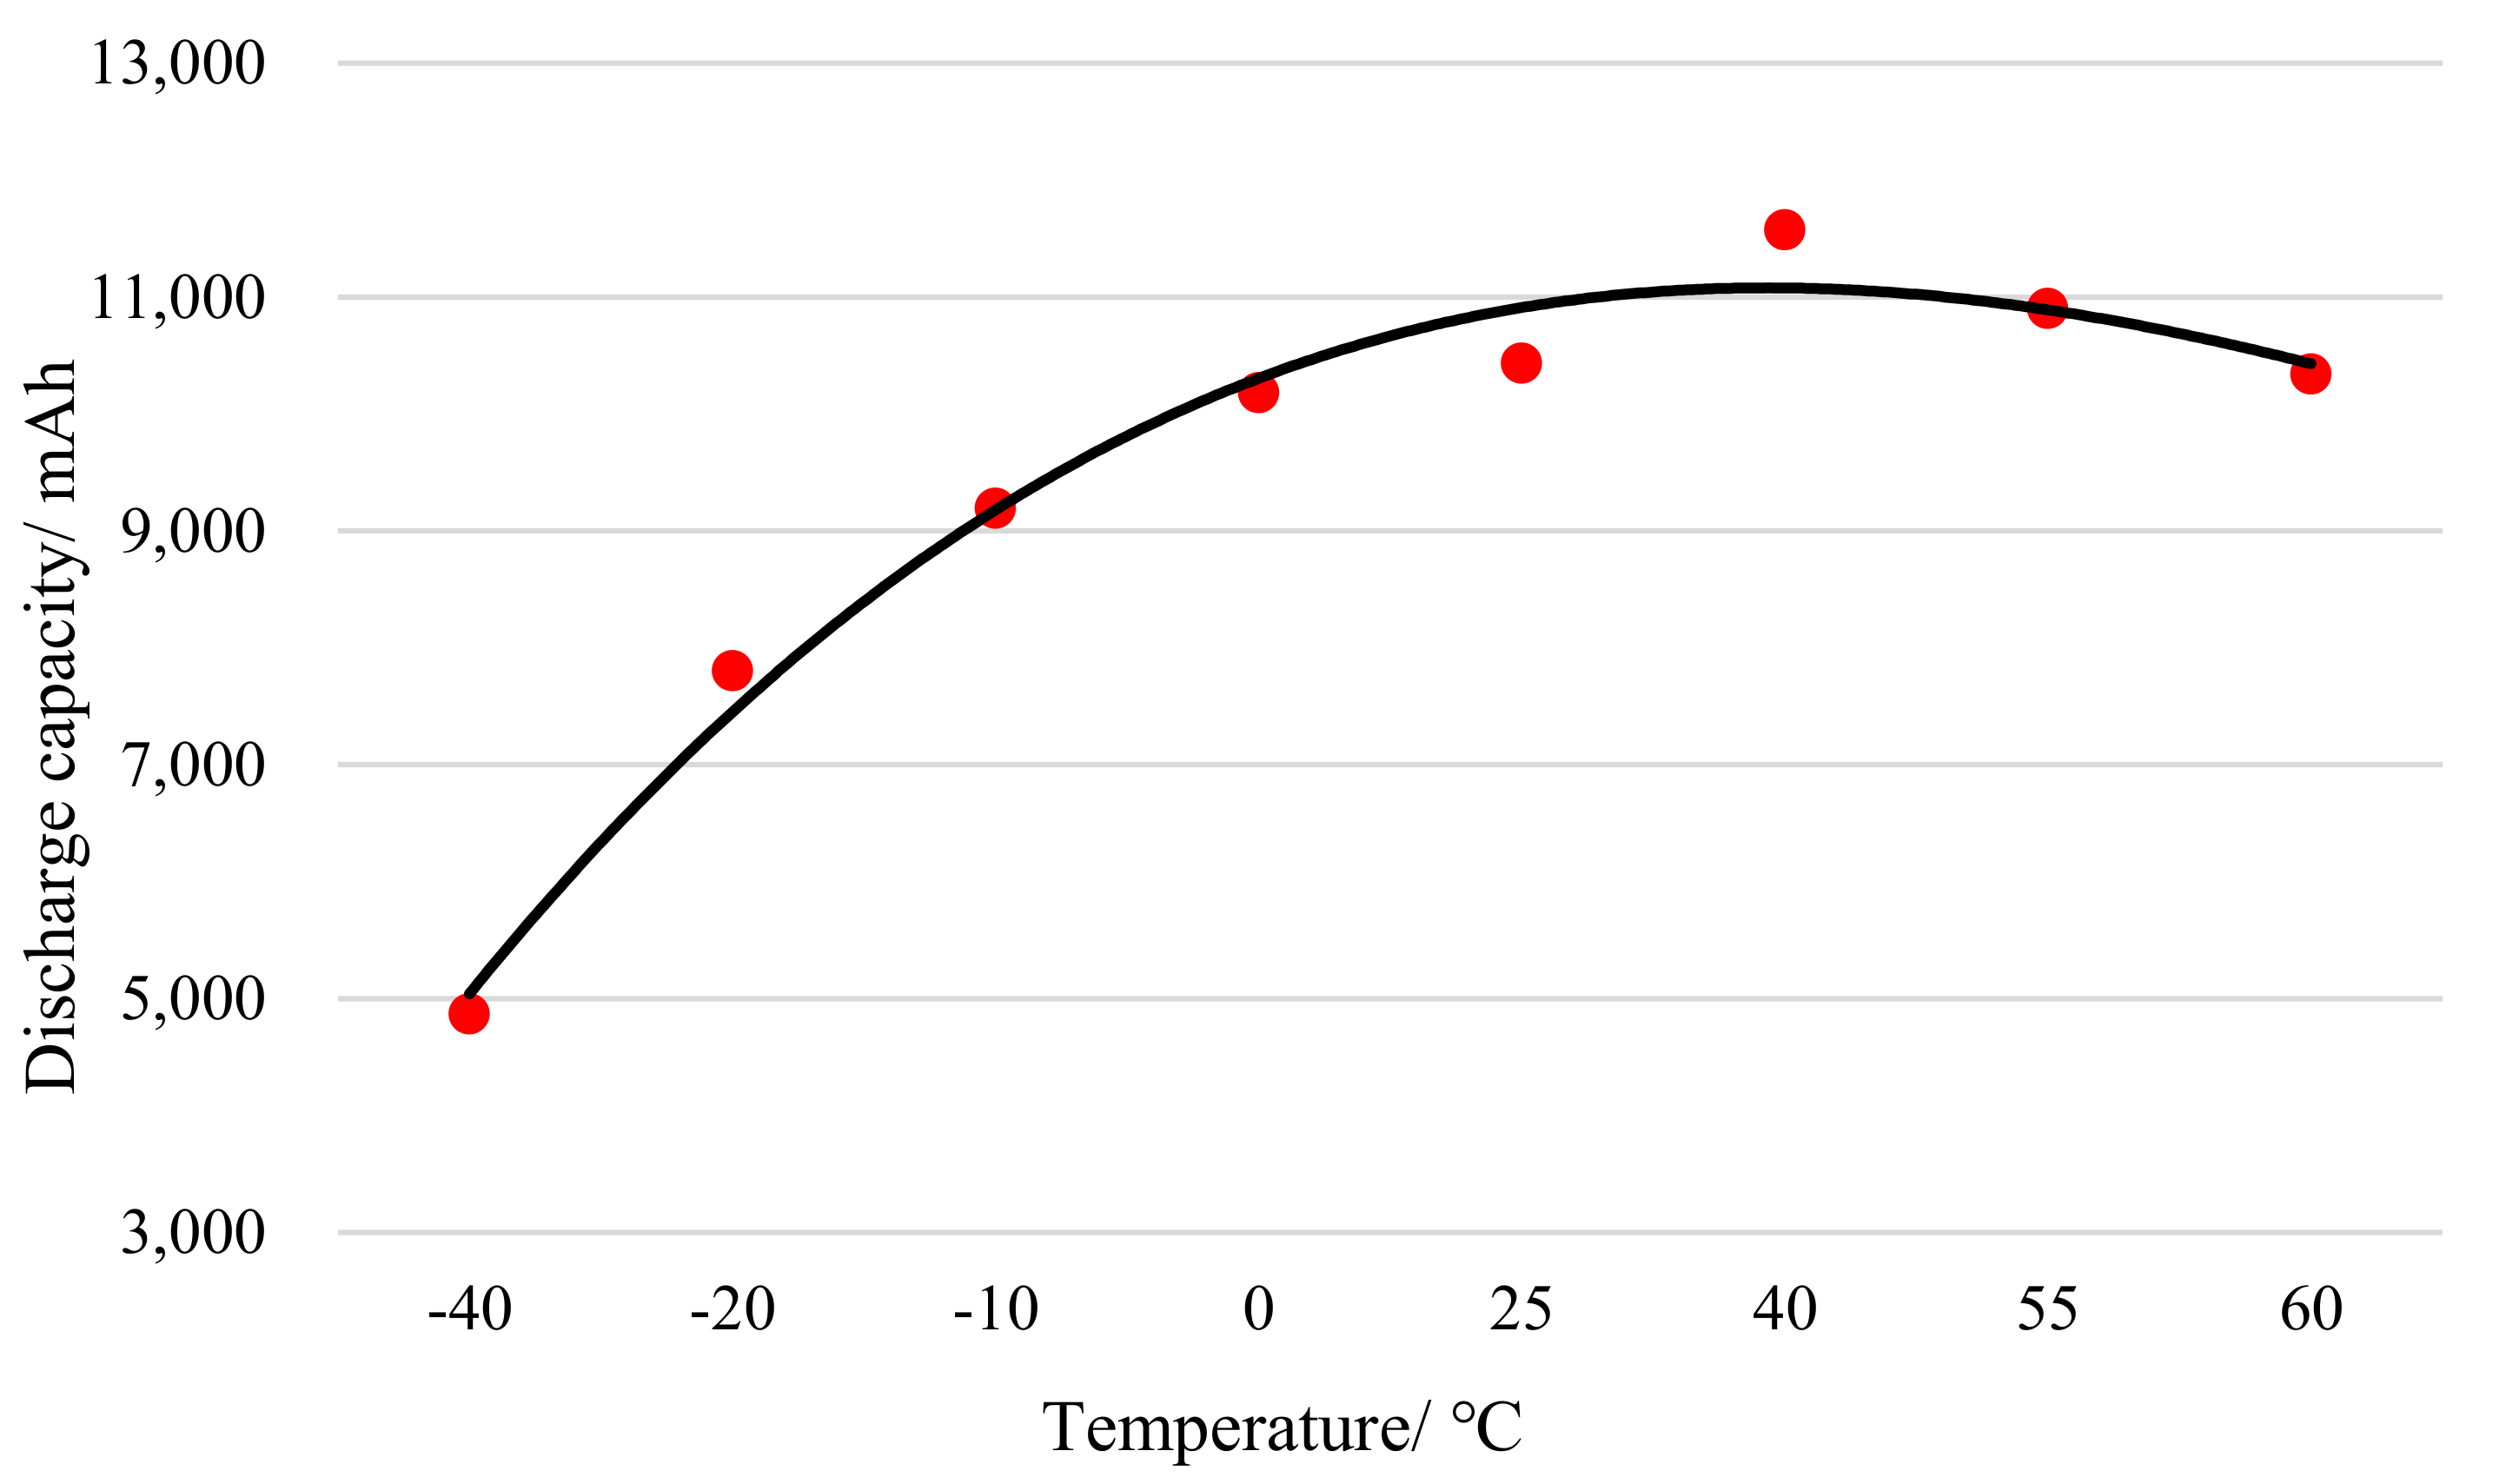
Figure 2 shows the discharge capacity curve of a lithium iron phosphate battery at different temperatures.
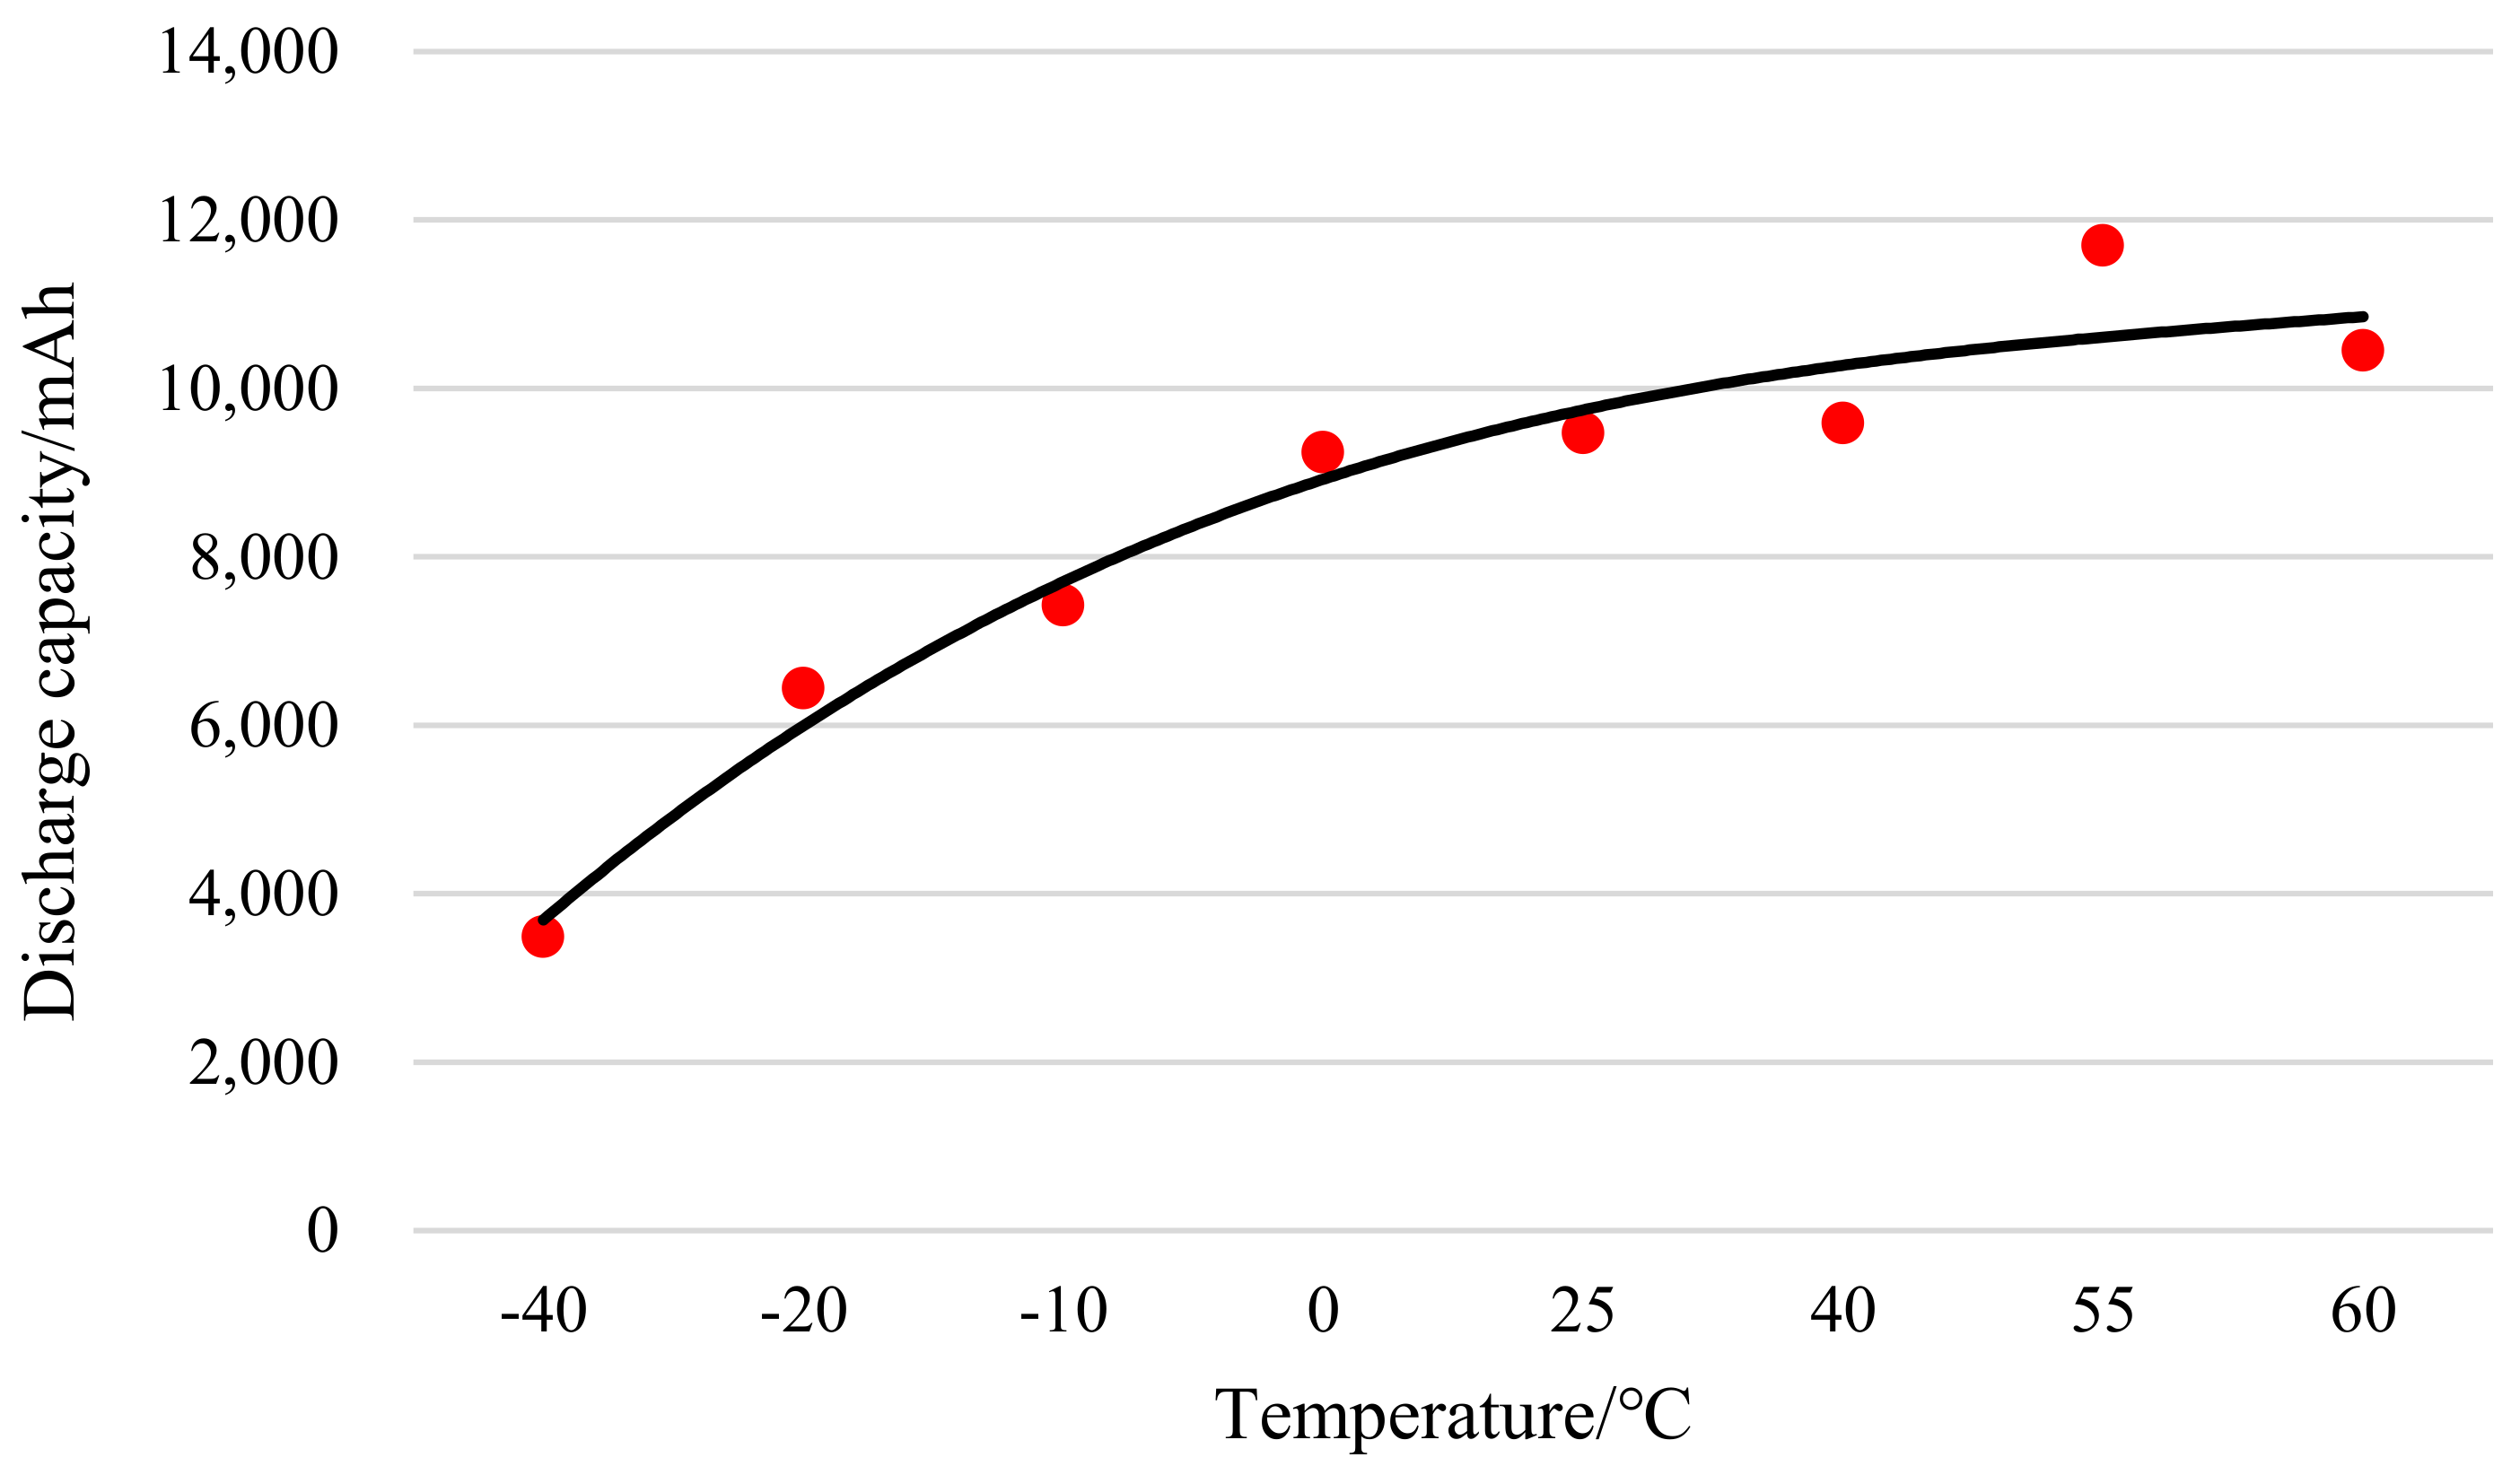
According to the test data in
Figure 2, fitting between the capacity of a lithium iron phosphate battery and the temperature is performed. The fitted curve is shown in
Figure 3. Through curve fitting and regression analysis, the polynomial between discharge capacity and temperature is obtained:
The above is the regression analysis fitting equation, where C refers to discharge capacity and t refers to temperature. R2 is the coefficient of determination, reflecting the proportion of all the variation of the dependent variable that can be explained by the independent variable through the regression relationship.
Table 2 shows the test result regarding the influence of temperature on lithium manganate battery discharge capacity.
Figure 4 shows the discharge capacity curve of a lithium manganate battery at different temperatures.
According to the test data, the fitting of the capacity of a lithium manganate battery and the temperature is carried out to obtain the fitting diagram shown in
Figure 5 and the following polynomial:
where,
C refers to discharge capacity and
t refers to temperature.
R2 is the coefficient of determination.
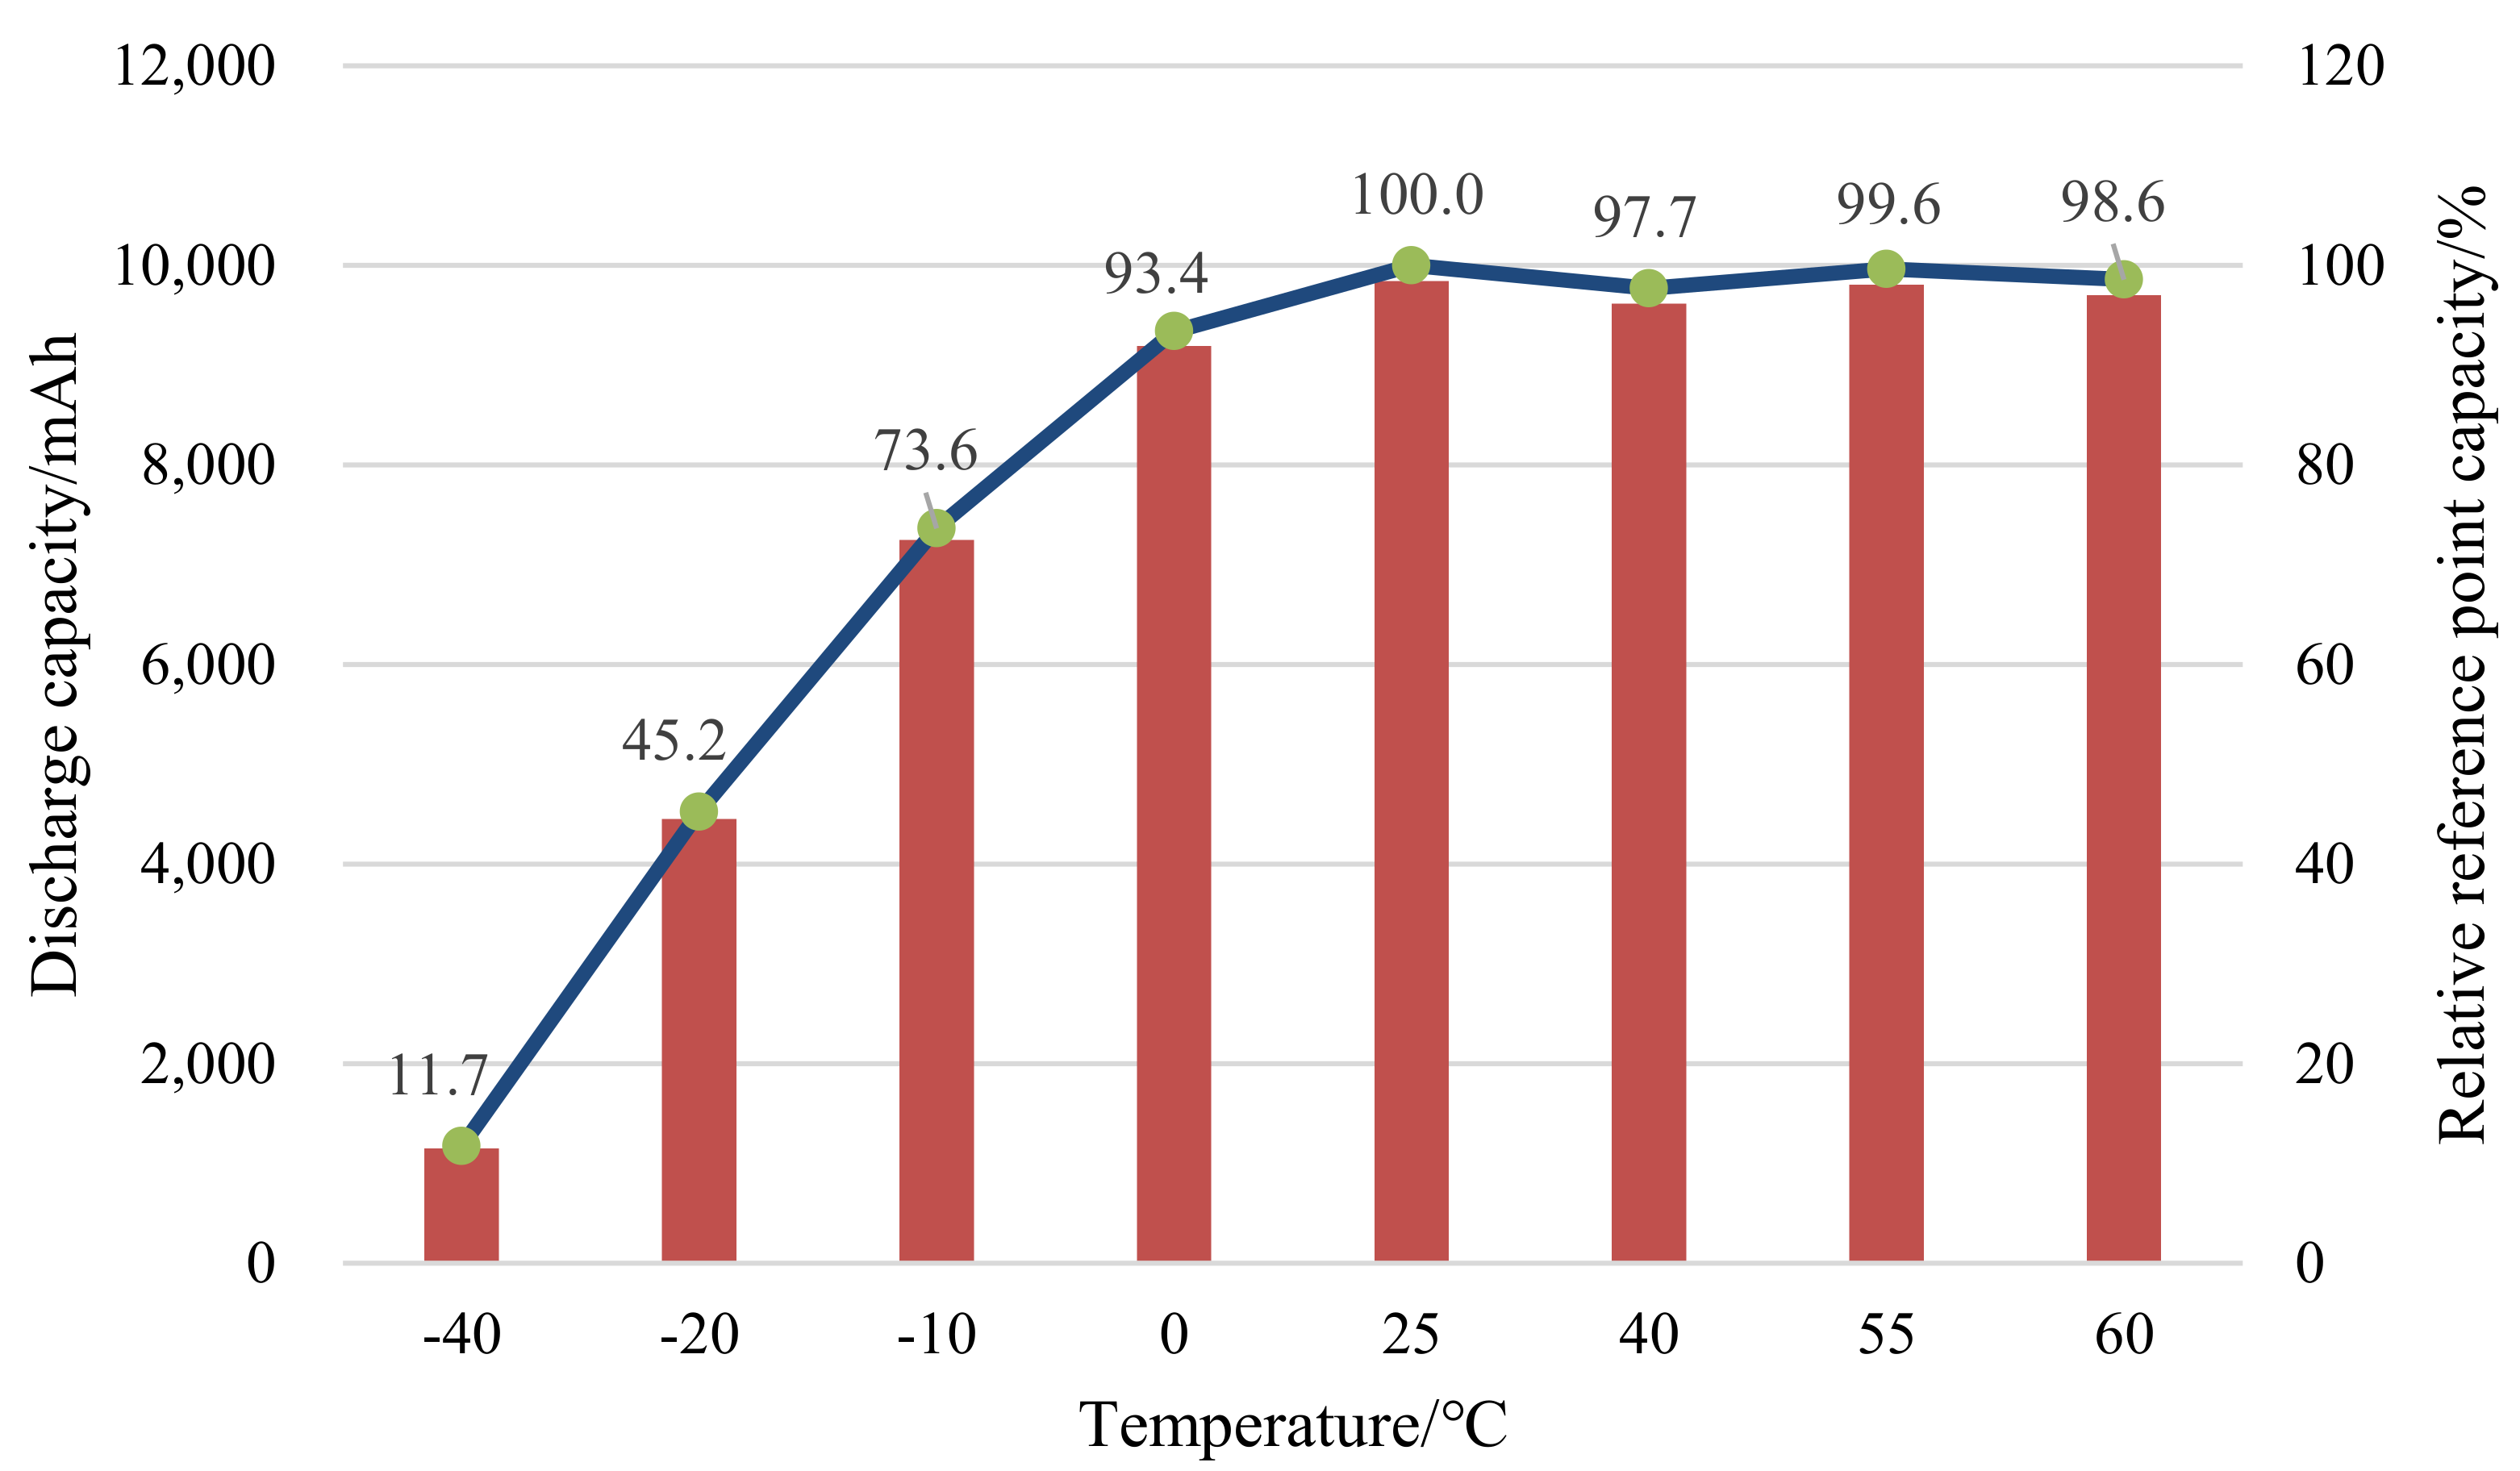
Table 3 shows the test result regarding the influence of temperature on the discharge capacity of a lithium cobalt oxide battery.
Figure 6 shows the discharge capacity curve of a lithium cobalt oxide battery at different temperatures.
According to the test data, the fitting between the capacity of a lithium manganate battery and the temperature is performed to obtain the fitting diagram and polynomial as shown in
Figure 7 and Equation (5):
where,
C refers to discharge capacity and
t refers to temperature.
R2 is the coefficient of determination.
3.1.2. Discussion
Through the comprehensive analysis of the above charts, it can be seen that regardless of whether the cathode material is lithium iron phosphate, lithium manganate or lithium cobalt oxide, the discharge capacity of a lithium ion battery will decrease as the temperature decreases at low temperatures [
25,
26]. The reasons for this phenomenon are as follows. On the one hand, the decrease in temperature will result in a decrease in the activity of the active electrolyte in the lithium ion battery and an increase in the concentration, which in turn will slow down the deintercalation rate of lithium ions during the discharge process [
27]. On the other hand, the decrease in temperature will increase the internal resistance of the lithium ion battery, which will cause the discharge cut-off voltage to be reached early, and the discharge will end. When the temperature is higher than 0 °C, the discharge capacity of the lithium ion battery basically remains above 93.4%. When the temperature is lower than 0 °C, the discharge capacity of the lithium ion battery begins to decrease, and it drops sharply as the temperature drops. When the temperature reaches –40 °C, the capacity of the lithium iron phosphate battery is 46.6%, the capacity of the lithium manganate battery is 36.8%, and the capacity of the lithium cobalt oxide battery is 11.7%.
When the ambient temperature is higher than 25 °C and lower than 55 °C, the discharge capacity of the battery will increase as the temperature rises. This is due to the increase in the activity of the internal materials of the battery, the faster the deintercalation of lithium ions, as well as the decrease in internal resistance. When the ambient temperature continues to rise to 60 °C, the discharge capacity of the lithium ion battery of the three materials is slightly lower than that at 55 °C. The main reason is that the activity of the active battery internal electrolyte and the reaction strength of the electrode material decrease in a high temperature environment. Moreover, excessively high temperature will cause the lattice of the cathode material to rupture, resulting in an irreversible drop in battery capacity. Therefore, the use of lithium ion batteries at high temperatures should be avoided. Through comprehensive consideration of discharge efficiency and cycle life, the best operating temperature of the lithium ion battery is 20–50 °C.
3.2. Relationship between Internal Resistance of Lithium Iron Phosphate Battery and State of Charge (SOC)
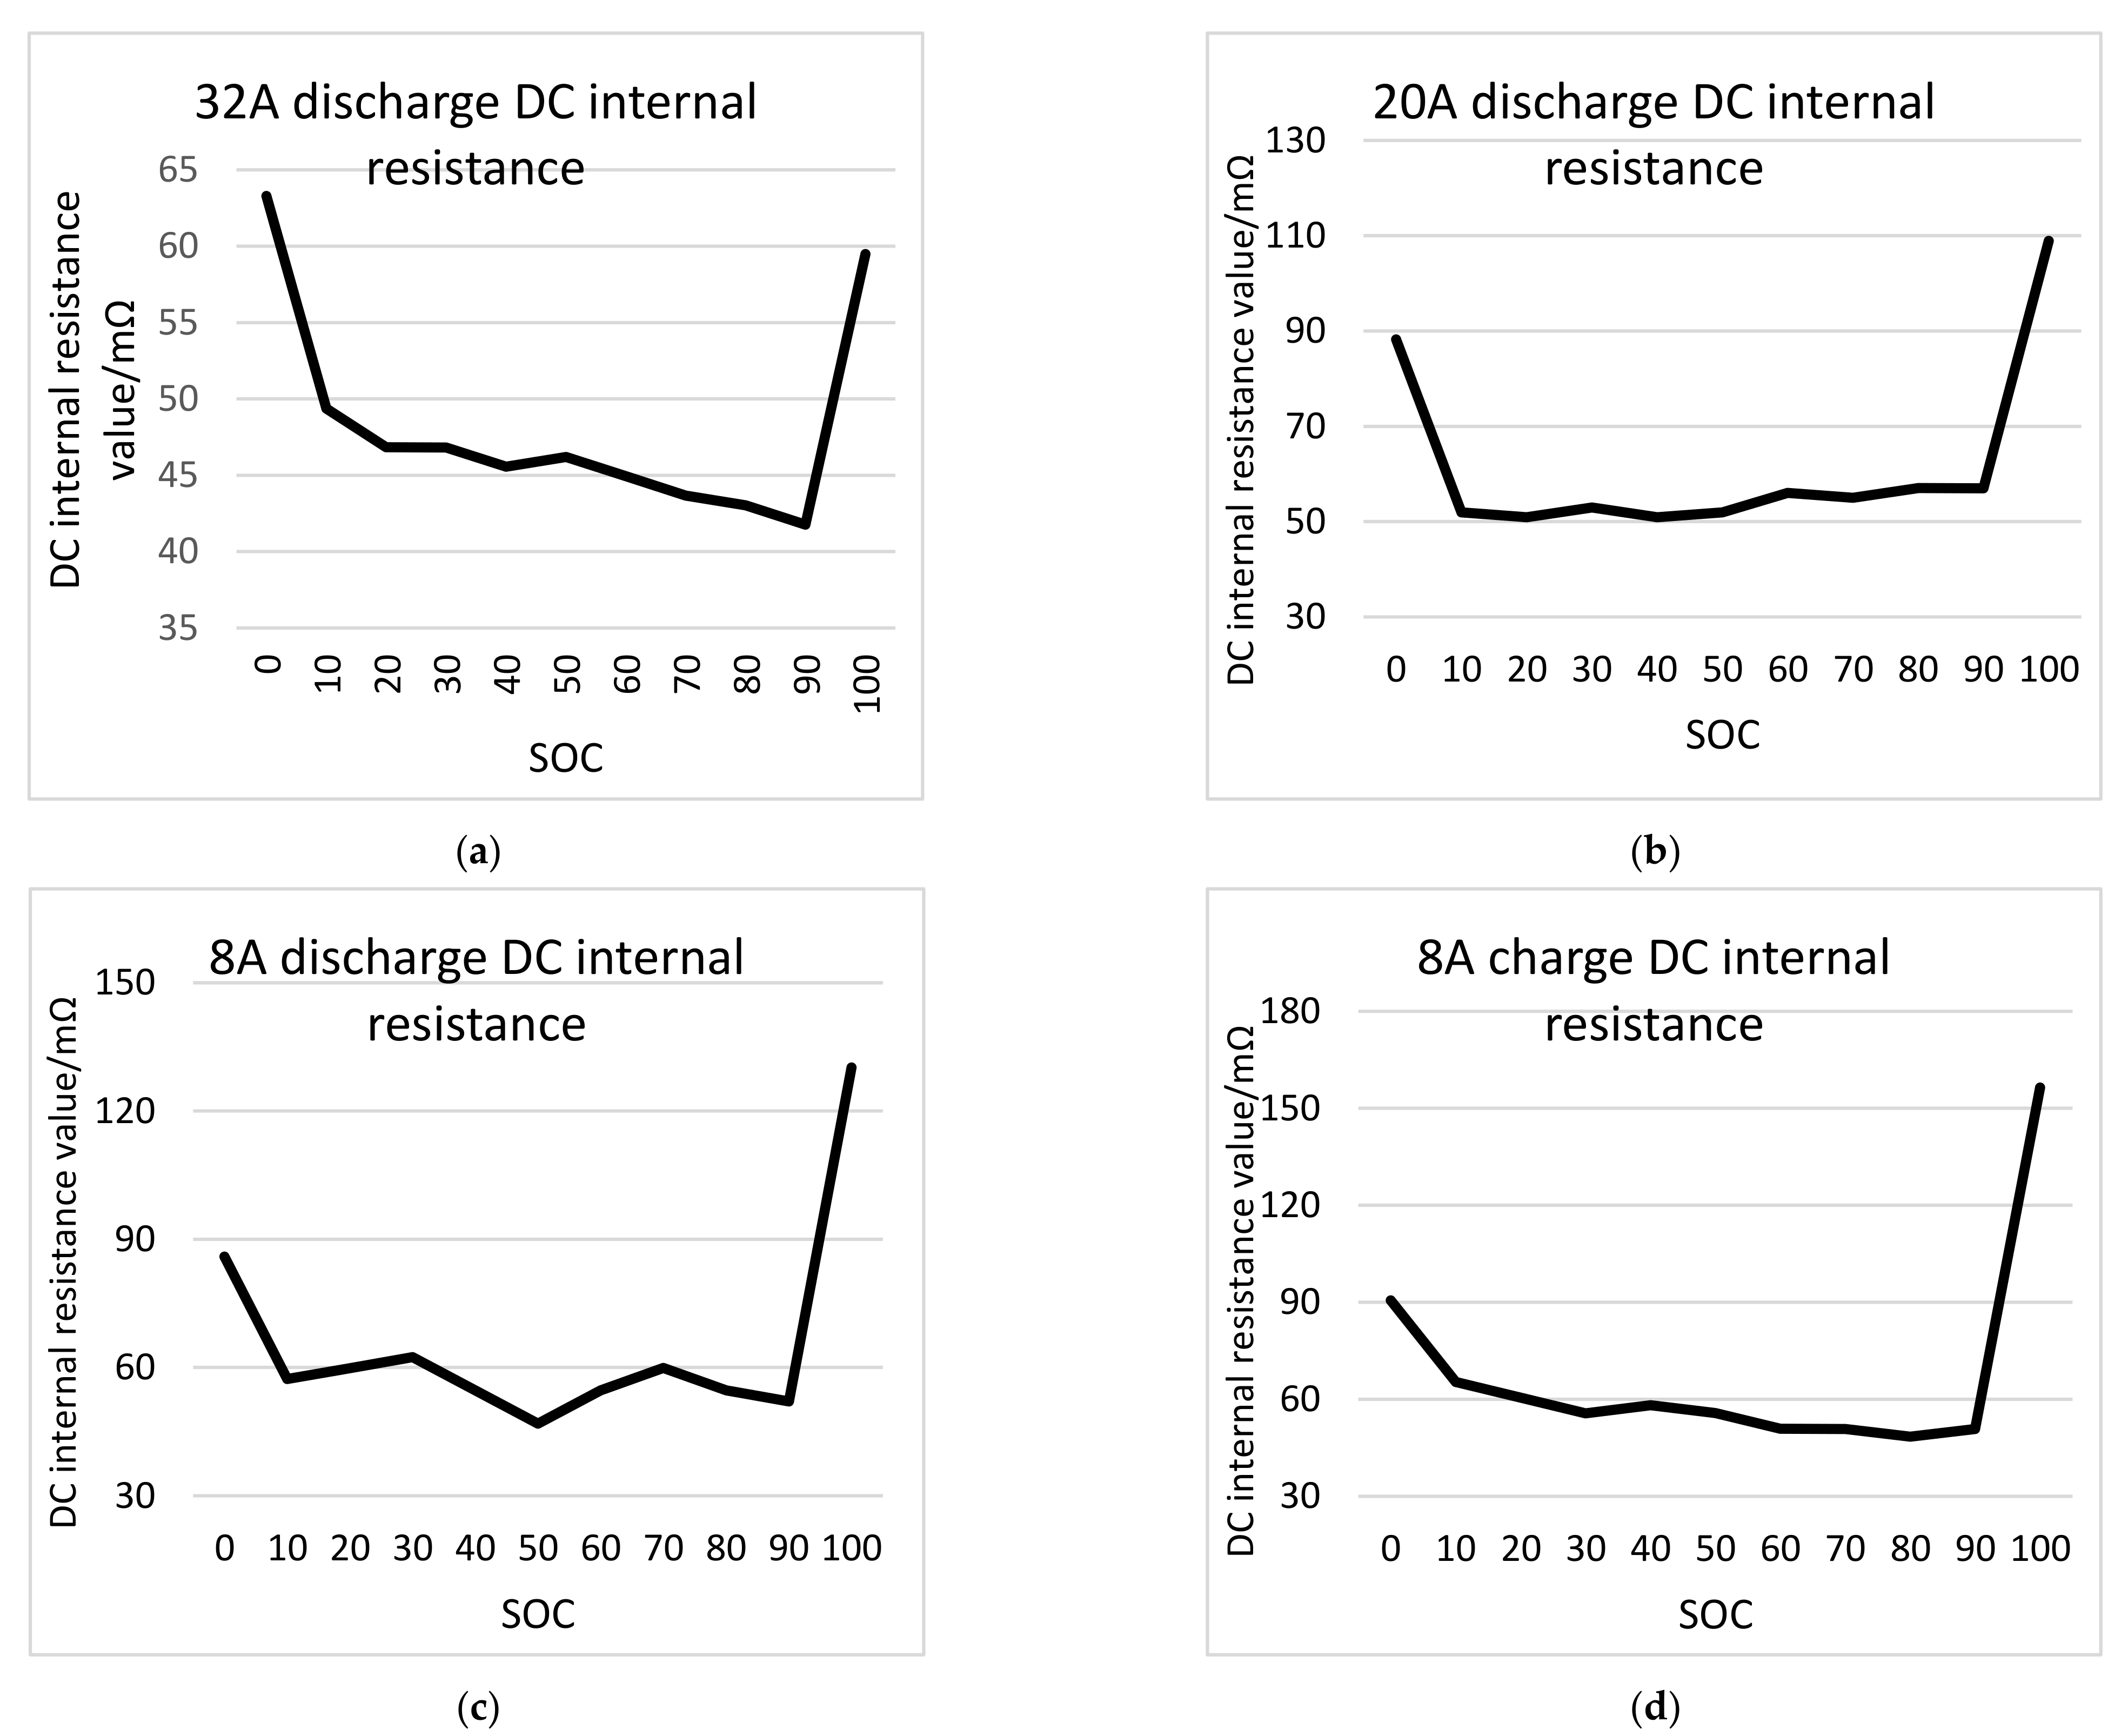
According to
Figure 8, it can be found that the DC internal resistance of the battery is high at both ends and low in the middle during the charging and discharging process. In other words, when the SOC is 100% and 0%, the DC internal resistance is the largest, and the other SOC resistances are small and change relatively smoothly. According to the battery internal resistance, it is recommended that the normal use range of lithium iron phosphate battery for electric vehicles is 10–90% SOC [
28].
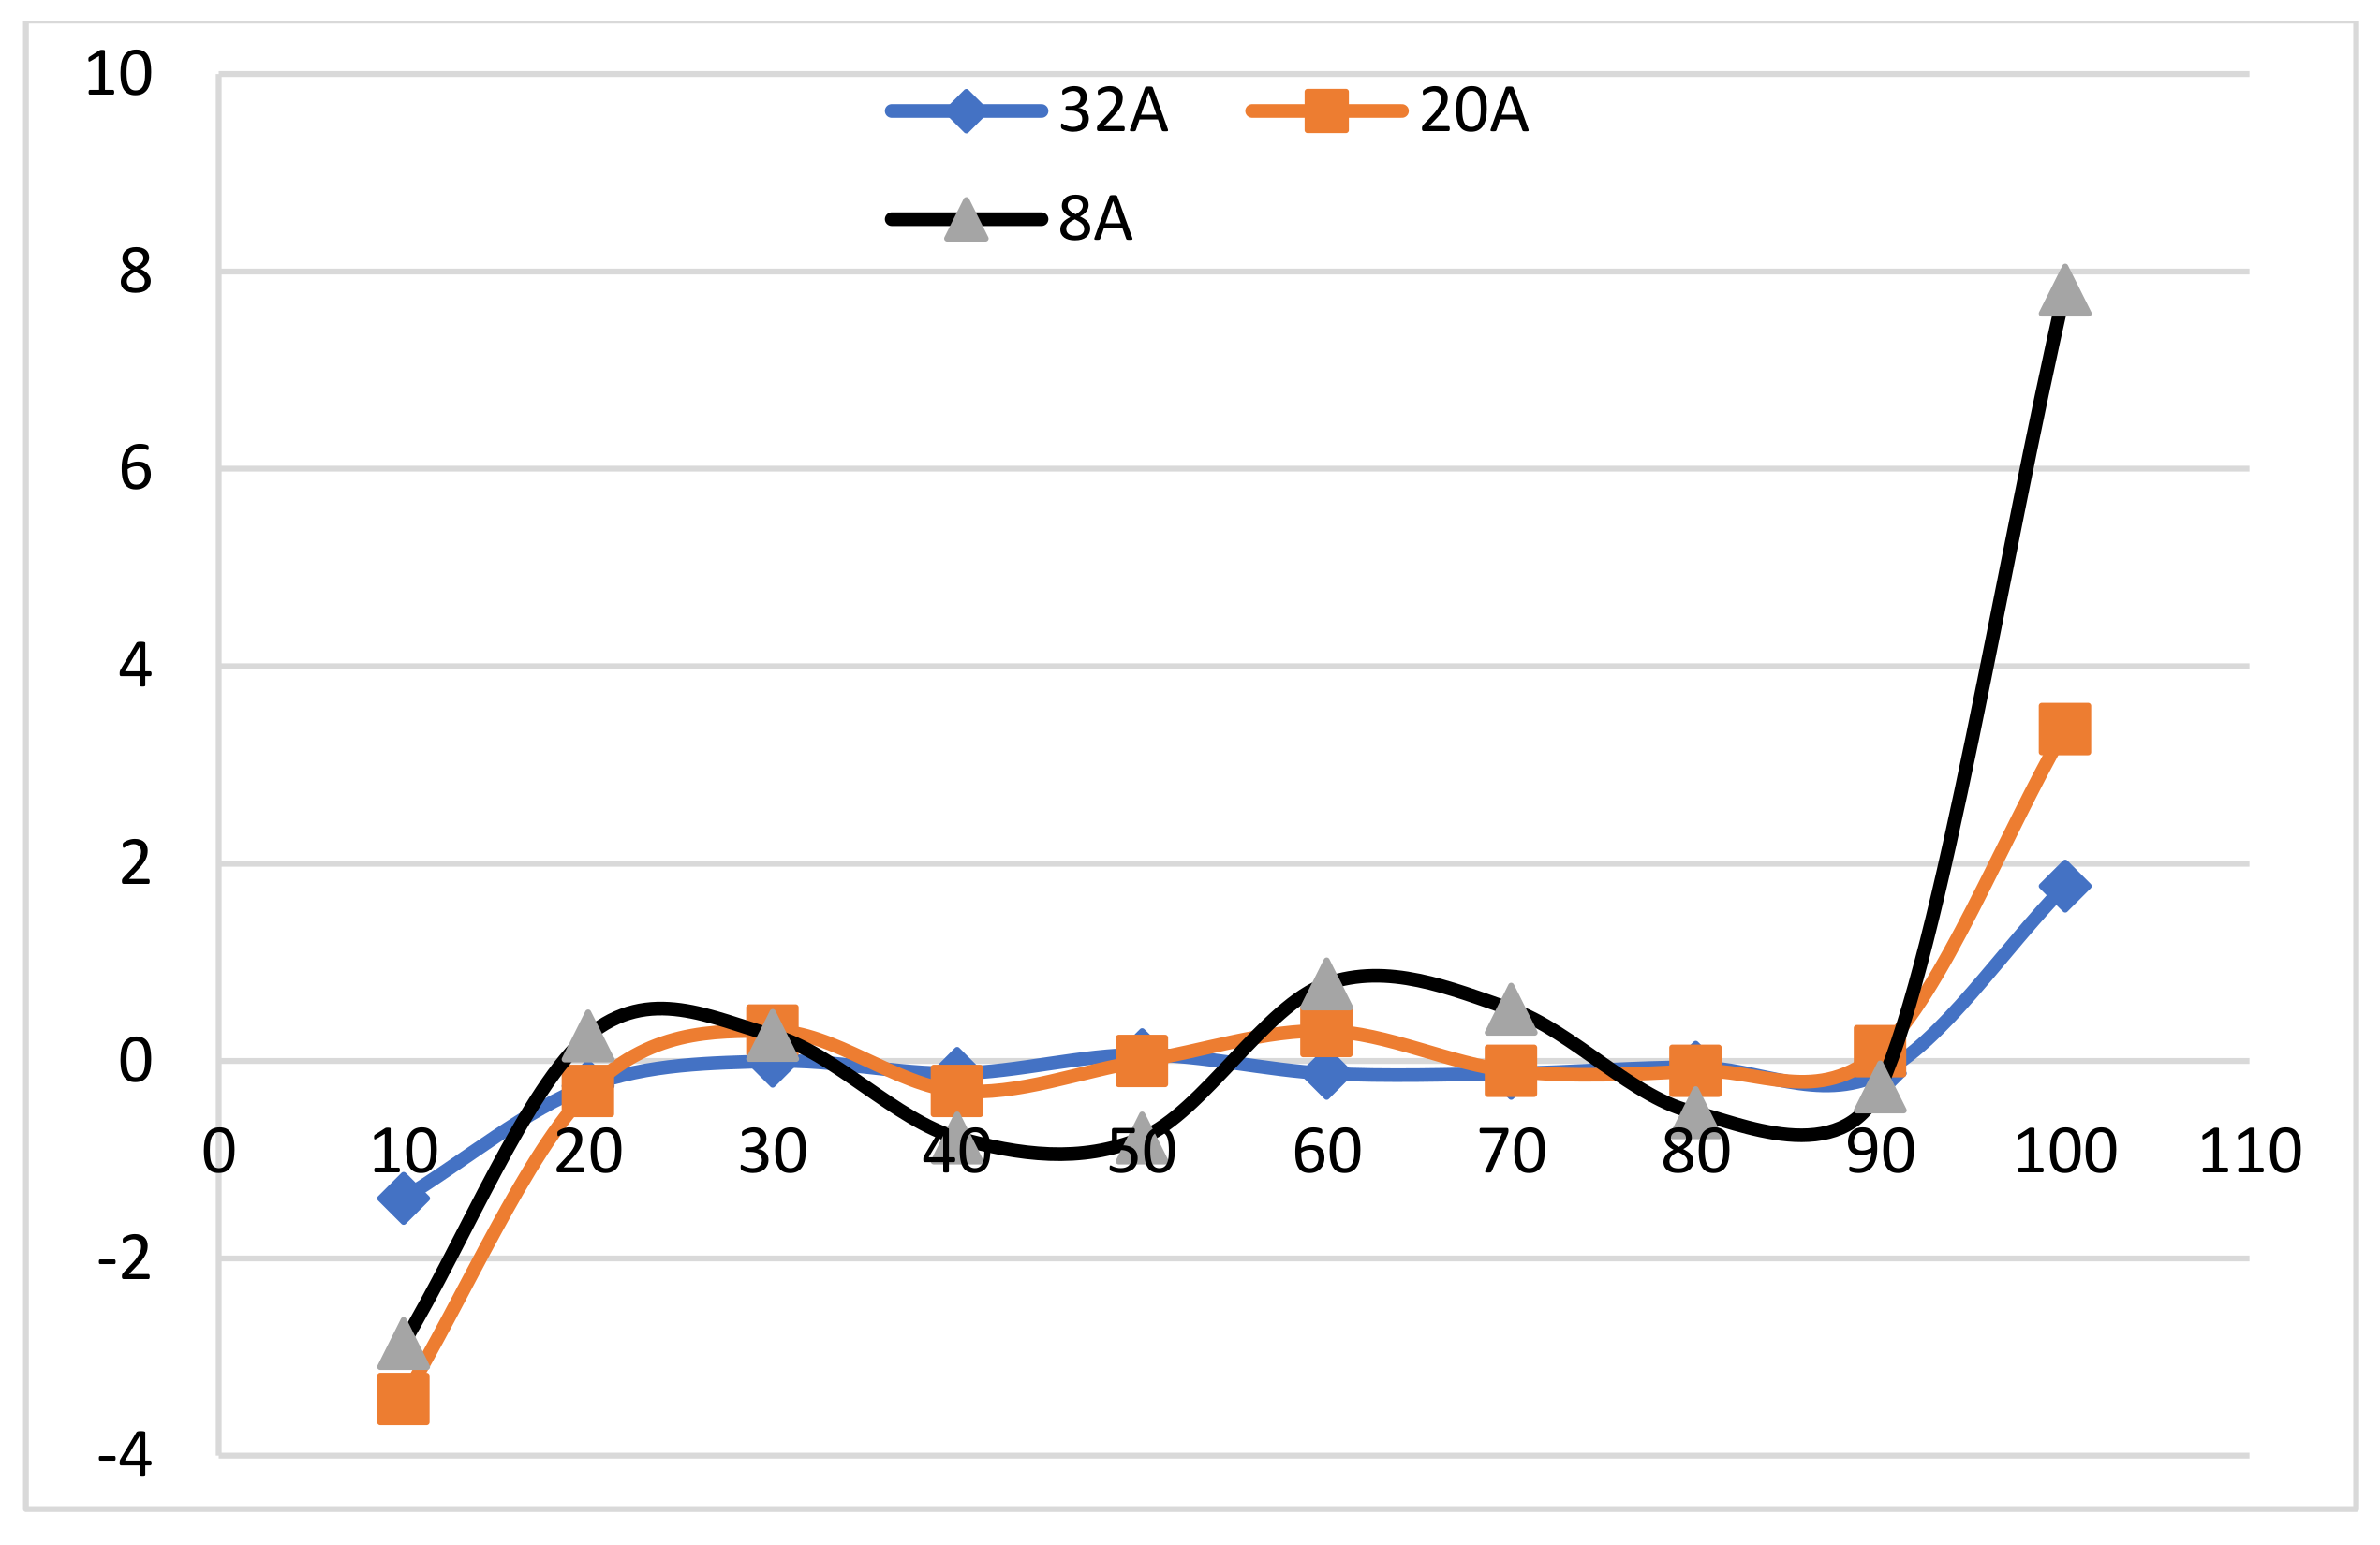
In order to visually display the relationship between the battery DC internal resistance and SOC, the resistance sensitivity is defined as the change value of the internal resistance when the SOC changes 1%, so as to obtain the DC internal resistance sensitivity comparison diagram shown in
Figure 9.
When the current increases, the sensitivity of DC internal resistance to SOC decreases. When the SOC is 10–90%, the sensitivity of DC internal resistance to SOC is relatively small, and the change is stable. When SOC is ≤10% or SOC ≥90%, the sensitivity of battery DC internal resistance to SOC increases sharply. When the SOC is 90–100%, the sensitivity of DC internal resistance is the largest [
29].
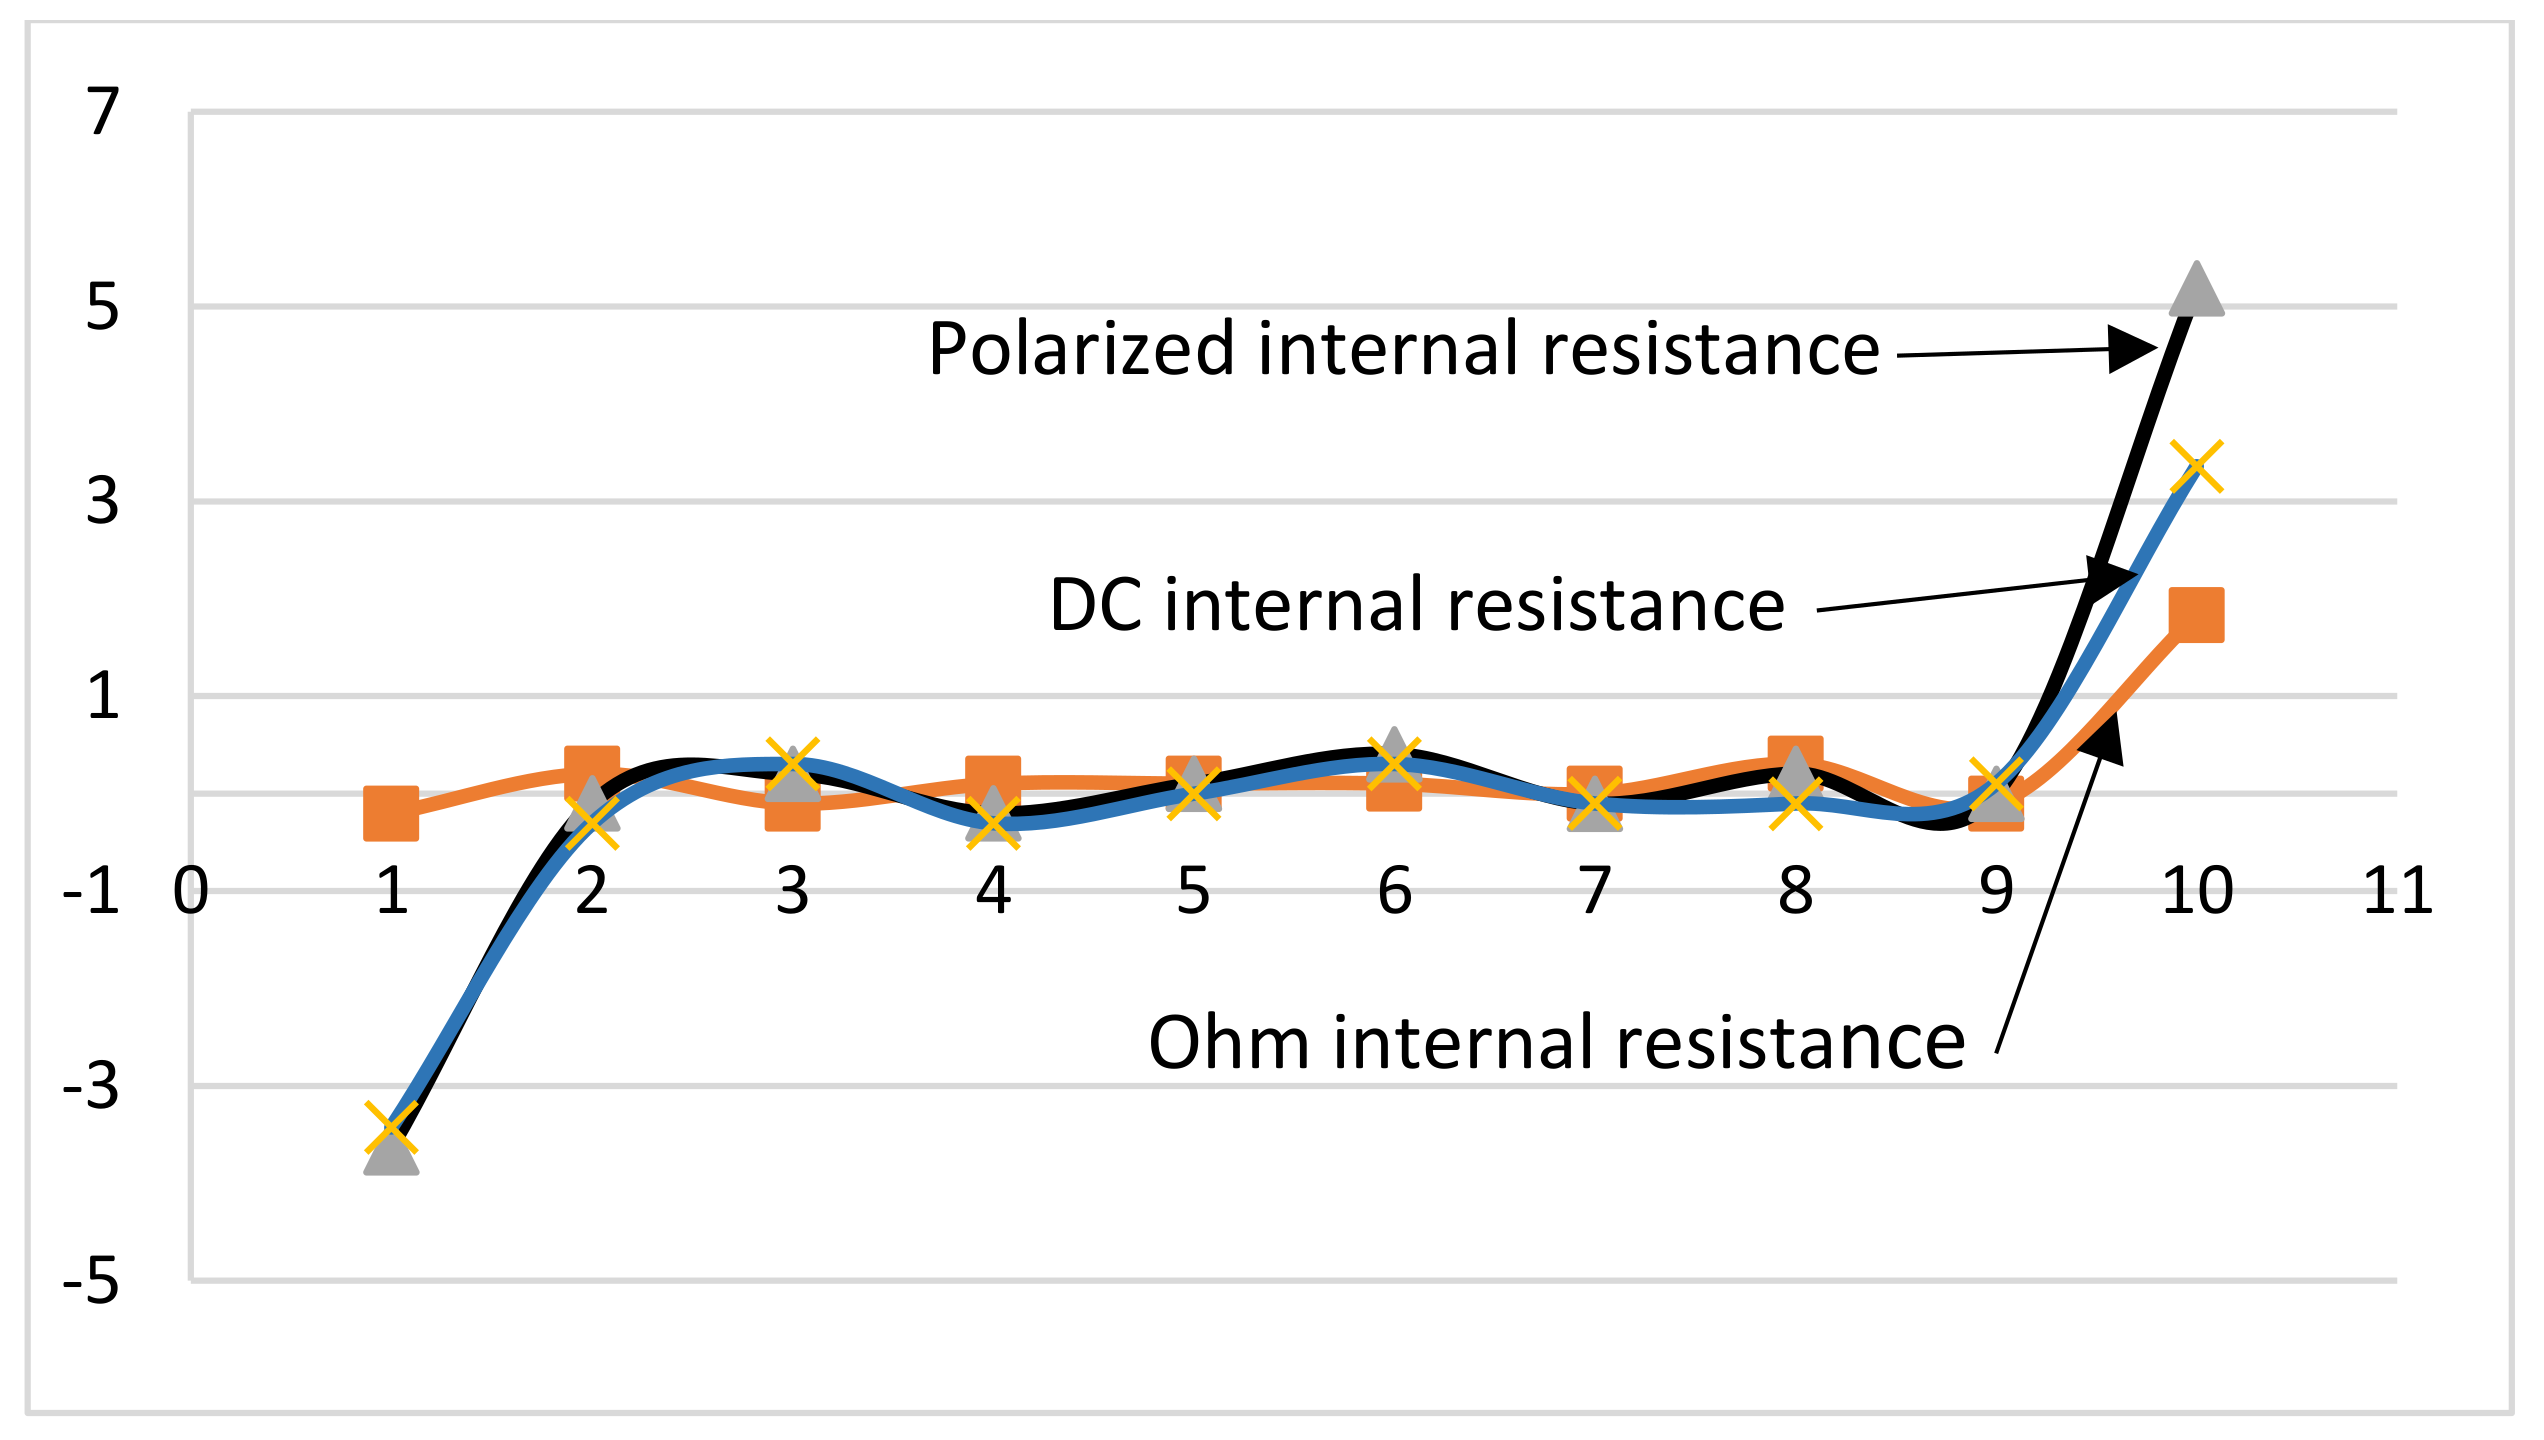
Similarly, the comparison diagrams of DC internal resistance, polarization resistance, and ohmic resistance to SOC sensitivity as shown in
Figure 10 are obtained. It can be seen from the figure that the polarization resistance is more affected by SOC than DC internal resistance [
30,
31]. SOC has a greater influence on DC internal resistance than ohmic resistance. In addition, SOC has basically the same influence on ohmic resistance, polarization resistance and DC internal resistance.
The pulse time has a significant impact on the internal resistance of a lithium iron phosphate battery. As the pulse time increases, the internal resistance of the battery increases, which can be divided into two stages: within 1 s and between 1–10 s. Within 1 s, the DC internal resistance of the battery increases and the slope takes effect as time increases. Between 1–10 s, the DC internal resistance of the battery has a linear relationship with time. For the measurement and evaluation of the internal resistance parameters of the lithium iron phosphate battery, it is necessary to reasonably select the pulse test time in accordance with the actual use of the lithium iron phosphate battery. When the discharge current is not extremely large, the DC internal resistance and polarization resistance of the power battery will decrease as the discharge current increases. Moreover, the DC internal resistance is basically similar to the polarization resistance. During the charging and discharging process, the battery internal resistance reaches maximum when the SOC is 0% and 100%. SOC has the greatest impact on polarization resistance and the least impact on ohmic resistance.
3.3. Open Circuit Voltage (OCV) of Lithium Iron Phosphate Battery
According to relevant research results, the battery balance EMF (electrodynamic force) and battery SOC have a fixed monotonic non-linear functional relationship [
32,
33]. After fully standing still, the battery OCV (open circuit voltage) is approximately equal to the battery balance EMF. Based on this, this paper uses OCV after fully standing still to replace the battery balanced EMF. OCV refers to the difference in potential value between the positive and negative electrodes of the battery when no current flows through the external circuit. Unlike EMF, the measurement of OCV does not require that the positive and negative electrodes of the battery are in a completely stable state or there is no chemical reaction. In other words, as long as the external circuit of the battery is disconnected, regardless of whether the internal chemical reaction of the battery is over, the measured voltage value is OCV [
34]. For discharging, OCV is generally higher than the battery operating voltage. For the battery discharge process, the OCV will gradually rise to a stable value after the power is off. For charging, OCV is generally lower than the battery operating voltage. For the battery charge process, the OCV will gradually drop to a stable value after the power is off [
35].
The time that the battery OCV is stable is related to factors such as the current before the battery is cut off, SOC, and ambient temperature. According to relevant data, in normal use and experiments, the OCV change rate of less than 2 mV/10 min can be achieved after the battery is standing for 3 h, which can be regarded as the battery OCV reaching a stable value.
3.3.1. SOC–OCV Curve Obtained by Interpolation Method
This method uses the median value of the voltage curve during the complete charging and discharging process as the battery OCV. In order to ensure that the polarization voltage is small during the experiment, this method generally selects a relatively small charge-discharge rate. Among them, the magnification selected in this paper is 0.2C [
36].
According to the battery OCV, the OCV data is obtained by interpolation method, as shown in
Table 4. In addition, the SOC-OCV curve shown in
Figure 11 is based on the median value of the voltage during the charge and discharge process.
Although the operation is simple, the accuracy of this method is poor. Because even at a small charge-discharge rate, the polarization voltage still exists, especially at the beginning and end of charge and discharge. Therefore, this method is not commonly used.
3.3.2. SOC–OCV Curve Obtained by Static Method
The static method is to obtain a stable and accurate OCV by fully standing still after power off. Compared with the interpolation method, this method has higher accuracy. This article chooses allowing it to stand for 3 h after the power failure to obtain a stable and accurate OCV. The experimental steps are as follows:
- (1)
The experiment temperature is room temperature. Before the experiment, three standard charge-and-discharge circles (0.2C) are performed to activate the battery;
- (2)
The battery is fully charged through a constant current to constant voltage charging mechanism. After fully standing for 3 h, the corresponding OCV when the SOC is 100% is recorded;
- (3)
After 0.2C discharge, SOC becomes 95%. After fully standing for 3 h after power failure, the corresponding OCV is recorded when the SOC is 95%;
- (4)
With 5% SOC as a stage, the above steps are repeated until SOC reaches 0%.
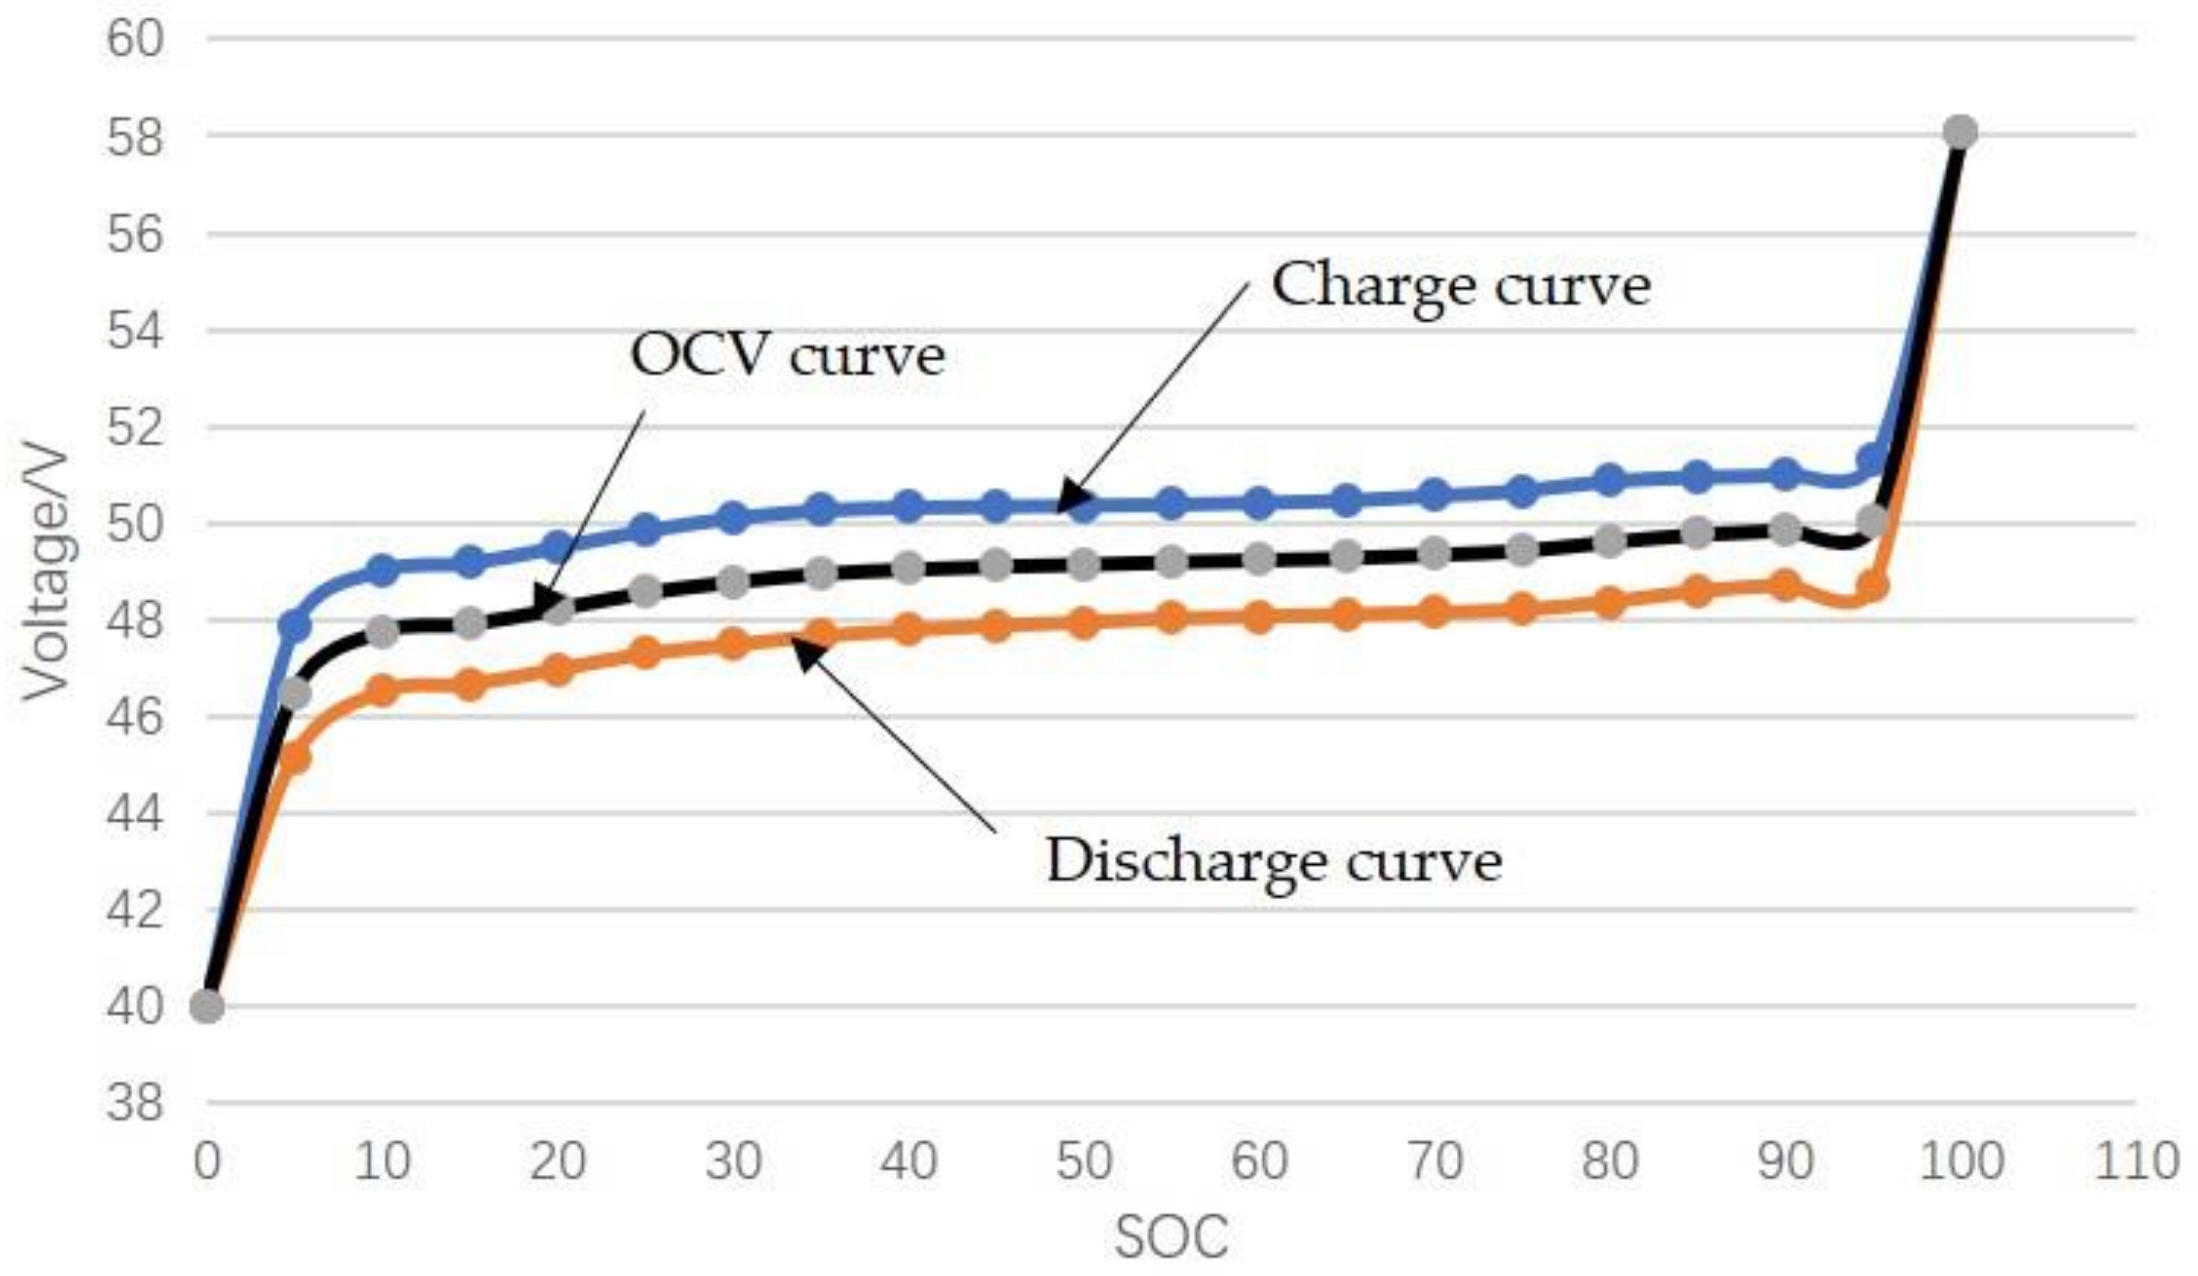
The SOC–OCV curve obtained by a static method is shown in
Figure 12.
By fitting the above polynomial, the equation obtained by the fitting is as follows:
where,
x is the battery OCV, and
y is the battery SOC,
R2 is the coefficient of determination.
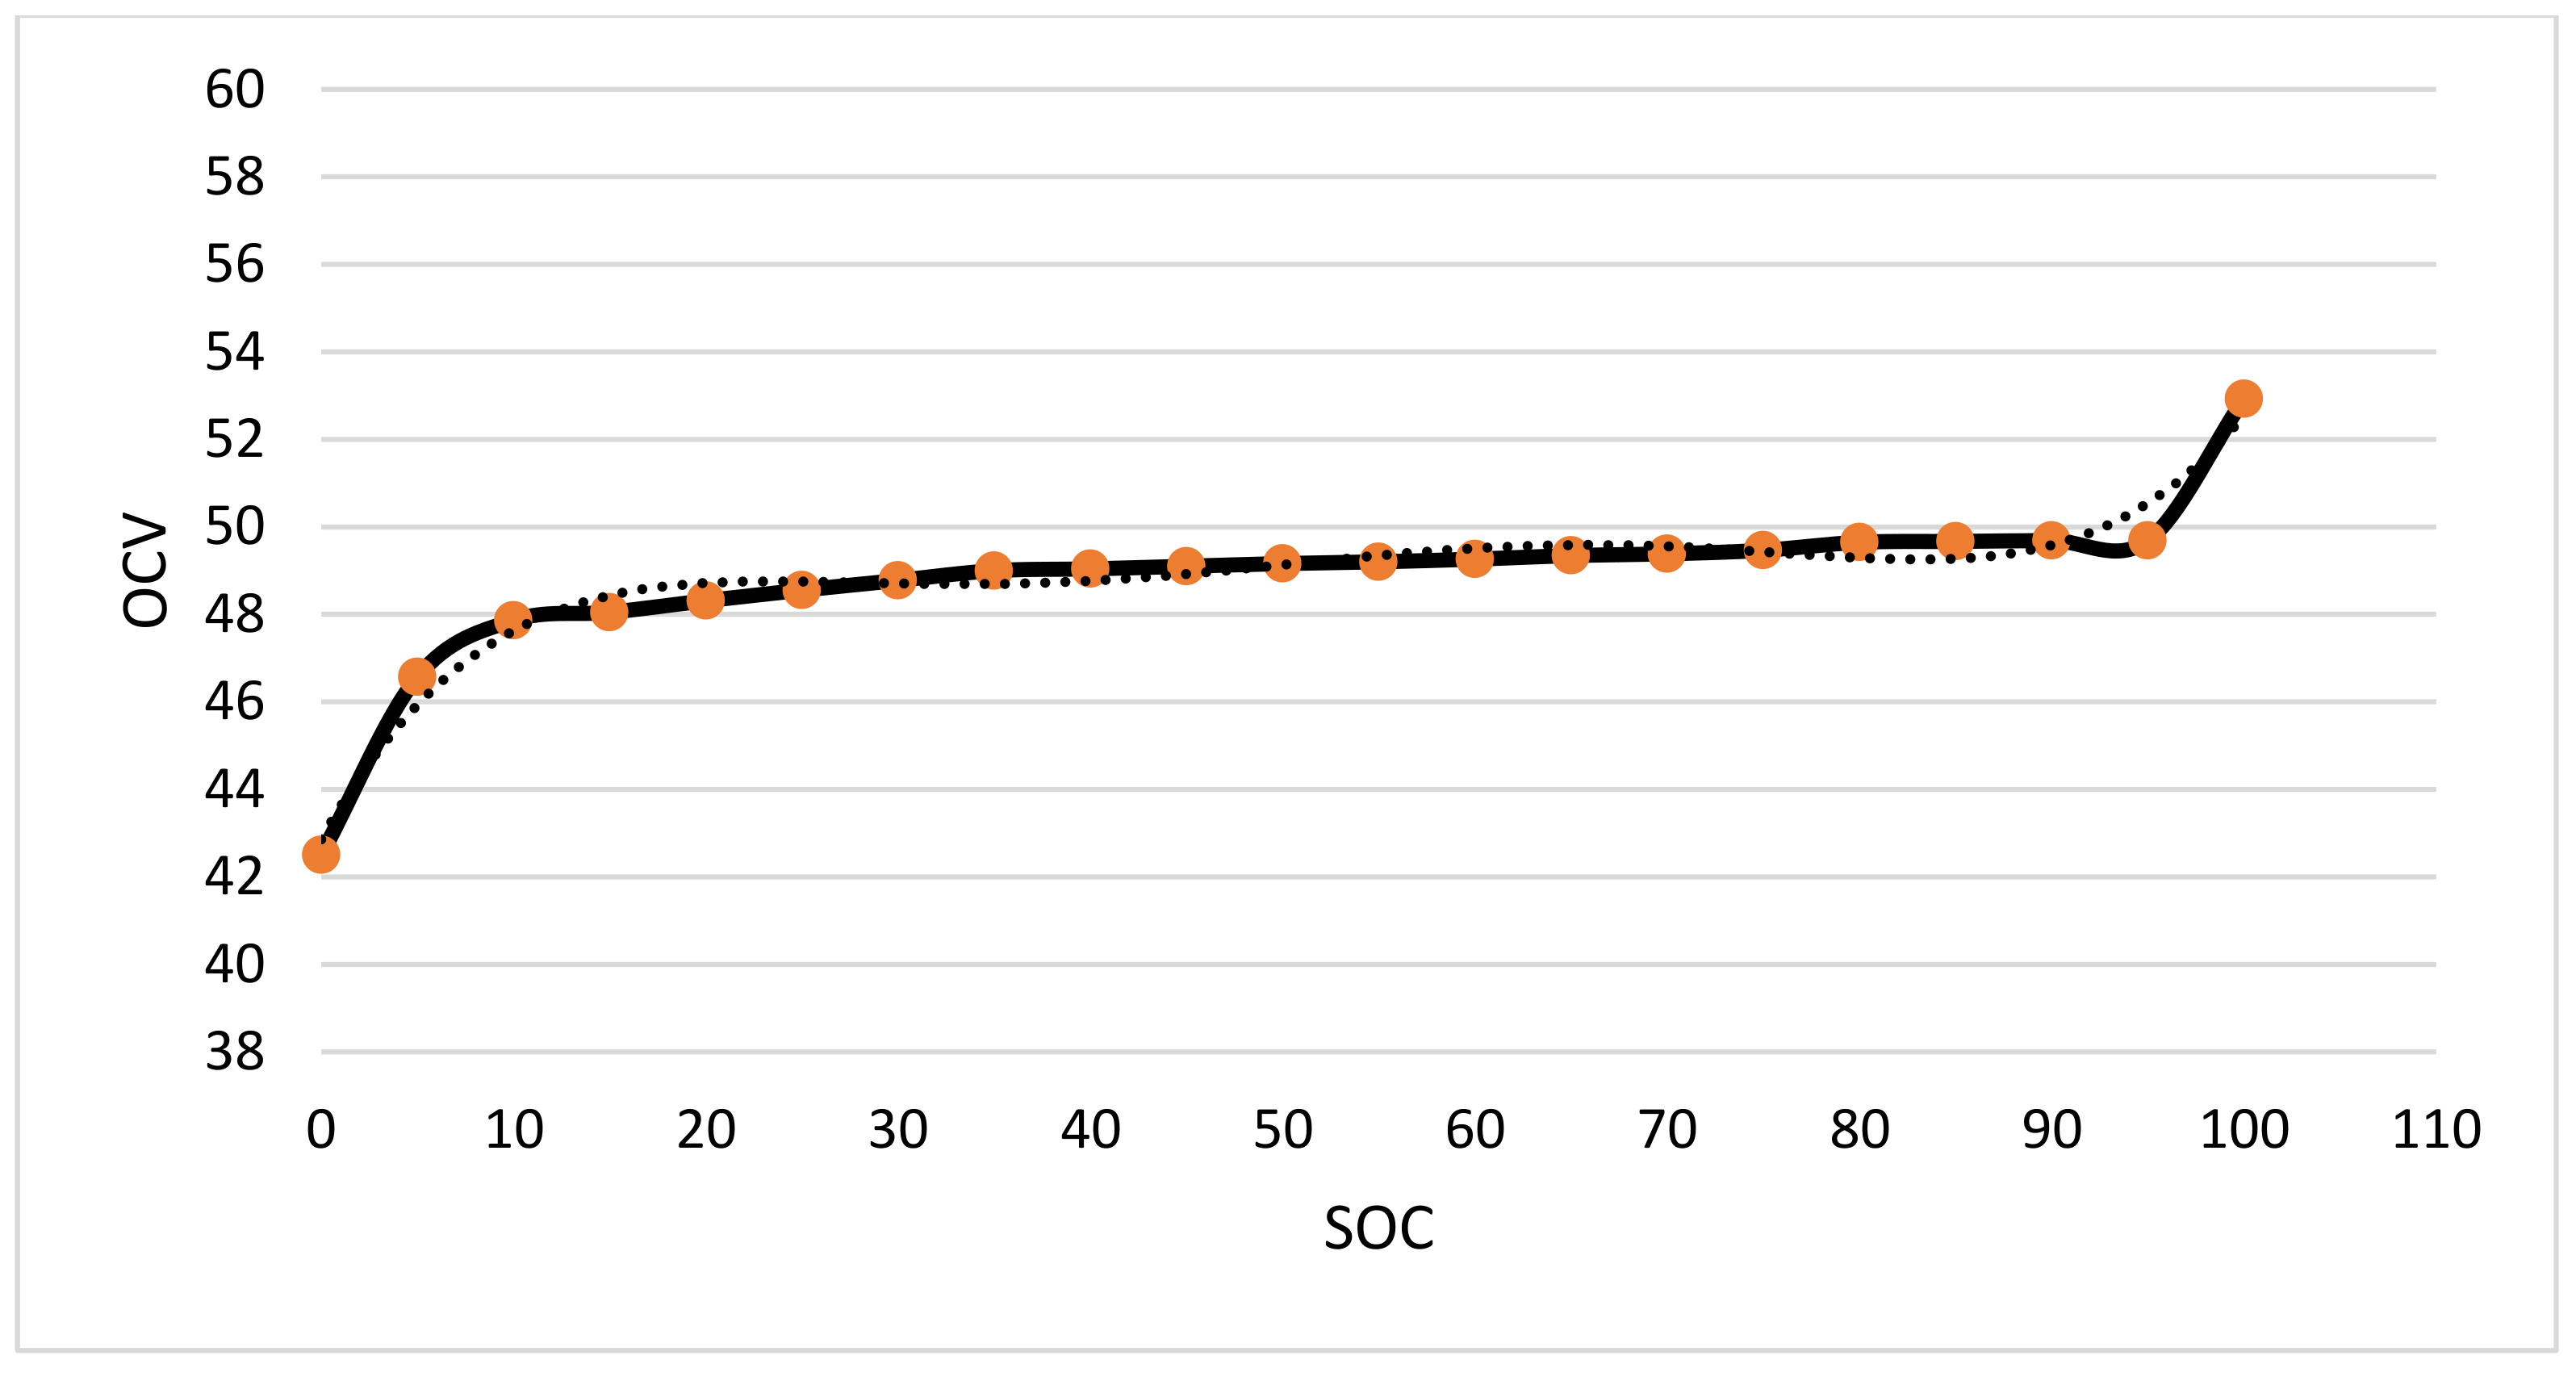
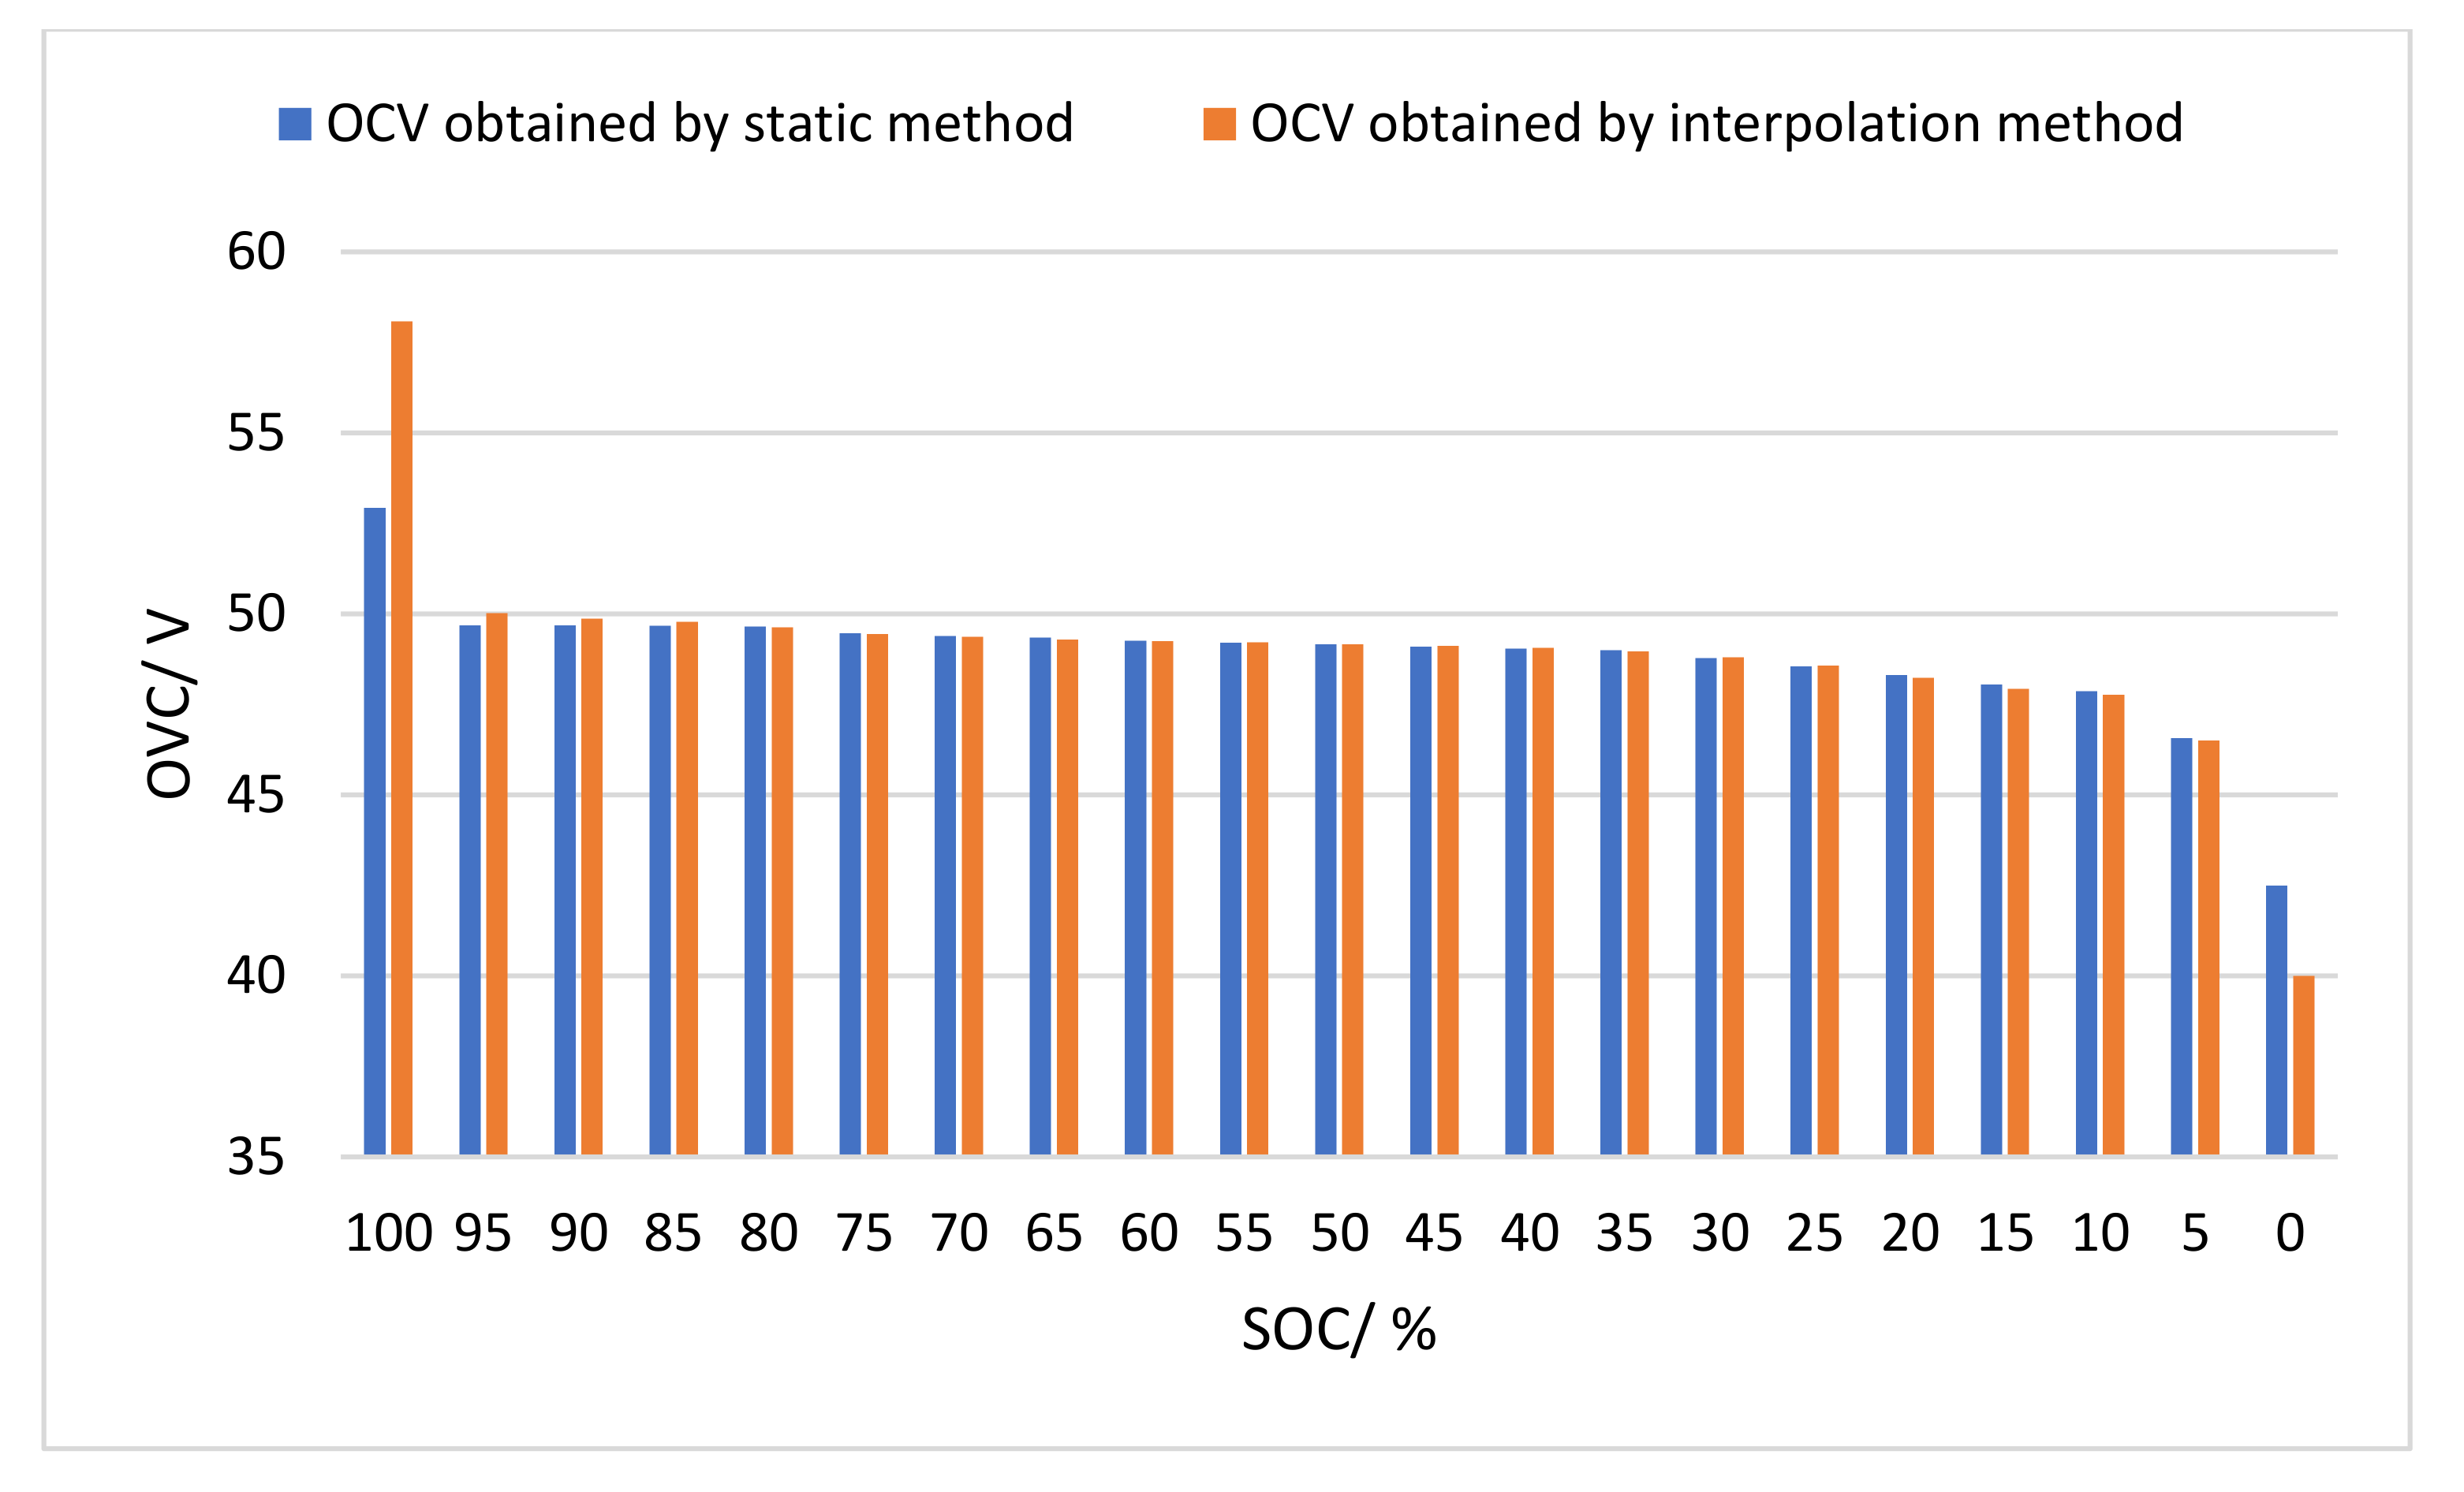
Finally, the OCV comparison data tables obtained by static method and interpolation method are shown in
Table 5 and
Figure 13.
4. Conclusions
Cathode material and temperature are the key indicators that determine the discharge capacity of the lithium ion battery. According to the fitting analysis, the discharge capacity of the lithium ion battery can be approximated as a third-degree polynomial of temperature. As the temperature increases, the activity of the active electrolyte in the lithium ion battery decreases, and the discharge capacity first increases and then decreases. At −40 °C, the capacity of the lithium iron phosphate battery is 46.6%, the capacity of the lithium manganate battery is 36.8%, and the capacity of the lithium cobalt oxide battery is 11.7%. When the ambient temperature is higher than 25 °C and lower than 55 °C, the discharge capacity of lithium ion batteries with different cathode materials is relatively high. Considering the discharge efficiency and cycle life, the optimal operating temperature of a lithium ion battery is 20–50 °C.
Based on the voltage acquisition platform and current acquisition platform of the monitoring and early warning system, the performance test and analysis of the lithium iron phosphate battery are carried out, including battery capacity and internal resistance, so as to explore the relationship between power battery capacity and internal resistance and environmental temperature, charging current, SOC, cycle times and other factors. The static method and interpolation method are adopted to obtain the SOC–OCV curve of the lithium iron phosphate battery, which provides strong support for the rational and efficient use of the lithium iron phosphate battery.
At high temperature (≥50 °C) or low temperature (≤20 °C), the capacity of lithium-ion power batteries decreases in varying degrees. When the temperature is above 0 °C, the discharge capacity of lithium-ion batteries can basically be maintained above 93.4%. Below 0 °C, the discharge capacity of lithium-ion batteries begins to decrease, and decreases sharply as the temperature drops. At −40 °C, the battery capacity of lithium iron phosphate remains 46.6%, that of lithium manganate is 36.8%, and that of lithium cobaltate is only 11.7%. Considering the discharge efficiency and cycle life, the best working temperature of a lithium-ion battery is 20–50 °C.
Due to the complexity and variability of lithium-ion power batteries, our research needs to be further improved. In the current research, the lithium iron phosphate power battery pack is regarded as a whole, and the influence of the inconsistency within the battery pack on the battery characteristics is not considered. The next step can be to consider the influence of the inconsistency between the battery packs on the battery characteristics, and introduce inconsistency parameters.
Author Contributions
Conceptualization, H.N. and W.L.; methodology, S.L.; validation, S.L.; formal analysis, H.N. and S.L.; investigation, J.Z. and X.W.; resources, H.N.; writing—original draft, W.L.; writing—review and editing, H.N.; visualization, X.W.; supervision, H.N. All authors have read and agreed to the published version of the manuscript.
Funding
This work was supported by A Priority Academic Program Development of Jiangsu Higher Education Institutions (PAPD), Jiangsu Province Policy Guidance Program (International Science and Technology Cooperation) Project (granted number: BZ2021045), University-Industry Collaborative Education Program, Nantong Applied Research Project (granted number: JCZ21013 and JCZ21043).
Institutional Review Board Statement
Not applicable.
Informed Consent Statement
Not applicable.
Data Availability Statement
Not applicable.
Conflicts of Interest
The authors declare no conflict of interest.
References
- Hopwood, B.; Mellor, M.; O’Brien, G. Sustainable development: Mapping different approaches. Sustain. Dev. 2005, 13, 38–52. [Google Scholar] [CrossRef] [Green Version]
- Grubb, M.; Ulph, D. Energy, the environment, and innovation. Oxf. Rev. Econ. Policy 2002, 18, 92–106. [Google Scholar] [CrossRef]
- Popp, D.; Newell, R.G.; Jaffe, A.B. Energy, the environment, and technological change. In Handbook of the Economics of Innovation; Elsevier: Amsterdam, The Netherlands, 2010; Volume 2, pp. 873–937. [Google Scholar]
- Wenlong, S.; Xiaokai, C.; Lu, W. Analysis of energy saving and emission reduction of vehicles using light weight materials. Energy Procedia 2016, 88, 889–893. [Google Scholar] [CrossRef] [Green Version]
- Que, Z.; Wang, S.; Li, W. Potential of energy saving and emission reduction of battery electric vehicles with two type of drivetrains in China. Energy Procedia 2015, 75, 2892–2897. [Google Scholar] [CrossRef] [Green Version]
- Jaguemont, J.; Boulon, L.; Dubé, Y. A comprehensive review of lithium-ion batteries used in hybrid and electric vehicles at cold temperatures. Appl. Energy 2016, 164, 99–114. [Google Scholar] [CrossRef]
- Zhang, X.; Liu, C.; Rao, Z. Experimental investigation on thermal management performance of electric vehicle power battery using composite phase change material. J. Clean. Prod. 2018, 201, 916–924. [Google Scholar] [CrossRef]
- Rao, Z.; Wang, S.; Wu, M.; Lin, Z.; Li, F. Experimental investigation on thermal management of electric vehicle battery with heat pipe. Energy Convers. Manag. 2013, 65, 92–97. [Google Scholar] [CrossRef]
- Karimi, G.; Li, X. Thermal management of lithium-ion batteries for electric vehicles. Int. J. Energy Res. 2013, 37, 13–24. [Google Scholar] [CrossRef]
- Harper, G.; Sommerville, R.; Kendrick, E.; Driscoll, L.; Slater, P.; Stolkin, R.; Walton, A.; Christensen, P.; Heidrich, O.; Lambert, S.; et al. Recycling lithium-ion batteries from electric vehicles. Nature 2019, 575, 75–86. [Google Scholar] [CrossRef] [Green Version]
- Piernas-Munoz, M.J.; Trask, S.E.; Dunlop, A.R.; Lee, E.; Bloom, I. Effect of temperature on silicon-based anodes for lithium-ion batteries. J. Power Sources 2019, 441, 227080. [Google Scholar] [CrossRef]
- Wang, C.; Appleby, A.J.; Little, F.E. Charge–discharge stability of graphite anodes for lithium-ion batteries. J. Electroanal. Chem. 2001, 497, 33–46. [Google Scholar] [CrossRef]
- Yom, J.H.; Hwang, S.W.; Cho, S.M.; Yoon, W.Y. Improvement of irreversible behavior of SiO anodes for lithium ion batteries by a solid state reaction at high temperature. J. Power Sources 2016, 311, 159–166. [Google Scholar] [CrossRef]
- Marinaro, M.; Mancini, M.; Nobili, F.; Tossici, R.; Damen, L.; Marassi, R. A newly designed Cu/Super-P composite for the improvement of low-temperature performances of graphite anodes for lithium-ion batteries. J. Power Sources 2013, 222, 66–71. [Google Scholar] [CrossRef]
- Al-Gabalawy, M.; Mahmoud, K.; Darwish, M.M.F.; Dawson, J.A.; Lehtonen, M.; Hosny, N.S. Reliable and Robust Observer for Simultaneously Estimating State-of-Charge and State-of-Health of LiFePO4 Batteries. Appl. Sci. 2021, 11, 3609. [Google Scholar] [CrossRef]
- Emara, D.; Ezzat, M.; Abdelaziz, A.Y.; Mahmoud, K.; Lehtonen, M.; Darwish, M.M.F. Novel Control Strategy for Enhancing Microgrid Operation Connected to Photovoltaic Generation and Energy Storage Systems. Electronics 2021, 10, 1261. [Google Scholar] [CrossRef]
- Ali, E.S.; El-Sehiemy, R.A.; Abou El-Ela, A.A.; Mahmoud, K.; Lehtonen, M.; Darwish, M.M.F. An Effective Bi-Stage Method for Renewable Energy Sources Integration into Unbalanced Distribution Systems Considering Uncertainty. Processes 2021, 9, 471. [Google Scholar] [CrossRef]
- Abbas, A.S.; El-Sehiemy, R.A.; Abou El-Ela, A.; Ali, E.S.; Mahmoud, K.; Lehtonen, M.; Darwish, M.M.F. Optimal Harmonic Mitigation in Distribution Systems with Inverter Based Distributed Generation. Appl. Sci. 2021, 11, 774. [Google Scholar] [CrossRef]
- Bendary, A.F.; Abdelaziz, A.Y.; Ismail, M.M.; Mahmoud, K.; Lehtonen, M.; Darwish, M.M.F. Proposed ANFIS Based Approach for Fault Tracking, Detection, Clearing and Rearrangement for Photovoltaic System. Sensors 2021, 21, 2269. [Google Scholar] [CrossRef] [PubMed]
- Winter, M.; Passerini, S. Lithium ion batteries as key component for energy storage in automotive and stationary applications. In Proceedings of the 2011 IEEE 33rd International Telecommunications Energy Conference (INTELEC), Amsterdam, The Netherlands, 9–13 October 2011; pp. 1–3. [Google Scholar]
- Stan, A.I.; Świerczyński, M.; Stroe, D.I.; Teodorescu, R.; Andreasen, S.J. Lithium ion battery chemistries from renewable energy storage to automotive and back-up power applications—An overview. In Proceedings of the 2014 International Conference on Optimization of Electrical and Electronic Equipment (OPTIM), Bran, Romania, 22–24 May 2014; pp. 713–720. [Google Scholar]
- Blomgren, G.E. The development and future of lithium ion batteries. J. Electrochem. Soc. 2016, 164, A5019. [Google Scholar] [CrossRef] [Green Version]
- Placke, T.; Kloepsch, R.; Dühnen, S.; Winter, M. Lithium ion, lithium metal, and alternative rechargeable battery technologies: The odyssey for high energy density. J. Solid State Electrochem. 2017, 21, 1939–1964. [Google Scholar] [CrossRef]
- Lu, L.; Han, X.; Li, J.; Hua, J.; Ouyang, M. A review on the key issues for lithium-ion battery management in electric vehicles. J. Power Sources 2013, 226, 272–288. [Google Scholar] [CrossRef]
- Bandhauer, T.M.; Garimella, S.; Fuller, T.F. A critical review of thermal issues in lithium-ion batteries. J. Electrochem. Soc. 2011, 158, R1. [Google Scholar] [CrossRef]
- Ma, S.; Jiang, M.; Tao, P.; Song, C.; Wu, J.; Wang, J.; Deng, T.; Shang, W. Temperature effect and thermal impact in lithium-ion batteries: A review. Prog. Nat. Sci. Mater. Int. 2018, 28, 653–666. [Google Scholar] [CrossRef]
- Wen, J.; Yu, Y.; Chen, C. A Review on Lithium-Ion Batteries Safety Issues: Existing Problems and Possible Solutions. Mater Express 2012, 2, 197–212. [Google Scholar] [CrossRef]
- Enache, B.A.; Grigorescu, S.D.; Seritan, G.C.; Argatu, F.C.; Adochiei, F.C.; Constantinescu, L.M. Modelling the Discharge of a Lithium Iron Phosphate Battery at Low Temperatures. In Proceedings of the 2019 11th International Symposium on Advanced Topics in Electrical Engineering (ATEE), Bucharest, Romania, 28–30 March 2019; pp. 1–6. [Google Scholar]
- Li, J.; Gao, F.; Yan, G.; Zhang, T.; Li, J. Modeling and SOC estimation of lithium iron phosphate battery considering capacity loss. Prot. Control Mod. Power Syst. 2018, 3, 5. [Google Scholar] [CrossRef] [Green Version]
- Qi, G.; Li, X.; Yang, D. A control strategy for dynamic balancing of lithium iron phosphate battery based on the performance of cell voltage. In Proceedings of the 2014 IEEE Conference and Expo Transportation Electrification Asia-Pacific (ITEC Asia-Pacific), Beijing, China, 31 August–3 September 2014; pp. 1–5. [Google Scholar]
- Zhou, S.; Zhao, Y.; Gao, S. Analysis of Heat Dissipation and Preheating Module for Vehicle Lithium Iron Phosphate Battery. Energies 2021, 14, 6196. [Google Scholar] [CrossRef]
- Poynting, J.H. XV. On the transfer of energy in the electromagnetic field. Philos. Trans. R. Soc. Lond. 1884, 175, 343–361. [Google Scholar]
- Zuza, K.; De Cock, M.; van Kampen, P.; Kelly, T.; Guisasola, J. Guiding students towards an understanding of the electromotive force concept in electromagnetic phenomena through a teaching-learning sequence. Phys. Rev. Phys. Educ. Res. 2020, 16, 020110. [Google Scholar] [CrossRef]
- Ko, Y.; Choi, W. A New SOC Estimation for LFP Batteries: Application in a 10 Ah Cell (HW 38120 L/S) as a Hysteresis Case Study. Electronics 2021, 10, 705. [Google Scholar] [CrossRef]
- Jiang, Y.; Zhao, X.; Valibeygi, A.; De Callafon, R.A. Dynamic Prediction of Power Storage and Delivery by Data-Based Fractional Differential Models of a Lithium Iron Phosphate Battery. Energies 2016, 9, 590. [Google Scholar] [CrossRef]
- De Sutter, L.; Nikolian, A.; Timmermans, J.-M.; Omar, N.; Van Mierlo, J. Online Multi Chemistry SoC Estimation Technique Using Data Driven Battery Model Parameter Estimation. World Electr. Veh. J. 2018, 9, 16. [Google Scholar] [CrossRef] [Green Version]
Figure 1.
The power battery test equipment used in our experiment.
Figure 1.
The power battery test equipment used in our experiment.
Figure 2.
Discharge capacity of a lithium iron phosphate battery at different temperatures.
Figure 2.
Discharge capacity of a lithium iron phosphate battery at different temperatures.
Figure 3.
Fitting curve of discharge capacity of a lithium iron phosphate battery at different temperatures.
Figure 3.
Fitting curve of discharge capacity of a lithium iron phosphate battery at different temperatures.
Figure 4.
Discharge capacity of a lithium manganate battery at different temperatures.
Figure 4.
Discharge capacity of a lithium manganate battery at different temperatures.
Figure 5.
Fitting curve of discharge capacity of a lithium manganate battery at different temperatures.
Figure 5.
Fitting curve of discharge capacity of a lithium manganate battery at different temperatures.
Figure 6.
Discharge capacity of a lithium cobalt oxide battery at different temperatures.
Figure 6.
Discharge capacity of a lithium cobalt oxide battery at different temperatures.
Figure 7.
Discharge curve of a lithium cobalt oxide battery at different temperatures.
Figure 7.
Discharge curve of a lithium cobalt oxide battery at different temperatures.
Figure 8.
Relationship between internal resistance of lithium iron phosphate battery and state of charge (SOC): (a) 32A discharge direct current (DC) internal resistance diagram; (b) 20A discharge DC internal resistance diagram; (c) 8A discharge DC internal resistance diagram; (d) 8A charge DC internal resistance diagram.
Figure 9.
DC internal resistance sensitivity comparison diagram.
Figure 9.
DC internal resistance sensitivity comparison diagram.
Figure 10.
Sensitivity comparison diagram of ohmic resistance, polarization resistance, and DC internal resistance.
Figure 10.
Sensitivity comparison diagram of ohmic resistance, polarization resistance, and DC internal resistance.
Figure 11.
State of charge–open circuit voltage (SOC-OCV) curve obtained by interpolation method.
Figure 11.
State of charge–open circuit voltage (SOC-OCV) curve obtained by interpolation method.
Figure 12.
SOC–OCV curve obtained by static method.
Figure 12.
SOC–OCV curve obtained by static method.
Figure 13.
Comparison of OCV obtained by static method and interpolation method.
Figure 13.
Comparison of OCV obtained by static method and interpolation method.
Table 1.
Influence of temperature on the discharge capacity (1C) of a lithium iron phosphate battery.
Table 1.
Influence of temperature on the discharge capacity (1C) of a lithium iron phosphate battery.
| Temperature/(°C) | Discharge Capacity/mAh | Relative Test Reference Point Capacity/(%) |
|---|
| 1 | 2 | 3 | Mean Value | 1 | 2 | 3 | Mean Value | Rate of Change |
|---|
| −40 | 4842.1 | 4953.9 | 4799.9 | 4865.3 | 46.5 | 47.4 | 46.1 | 46.6 | −53.4 |
| −20 | 7981.3 | 7841.2 | 7579.2 | 7800.6 | 76.6 | 75 | 72.8 | 74.8 | −25.2 |
| −10 | 9179.2 | 9250.6 | 9147.5 | 9192.4 | 88.1 | 88.4 | 87.8 | 88.1 | −11.9 |
| 0 | 10,228 | 10,210 | 10,106.3 | 10,181.4 | 98.1 | 97.6 | 97 | 97.6 | −2.4 |
| 25 (Criterion) | 10,421.1 | 10,460 | 10,416.1 | 10,432.4 | 100 | 100 | 100 | 100 | 0 |
| 40 | 11,430.5 | 11,352.1 | 11,933.4 | 11,572 | 109.8 | 108.5 | 114.6 | 110.9 | 10.9 |
| 55 | 10,768.5 | 10,938.5 | 10,992.1 | 10,899.7 | 103.3 | 104.6 | 105.5 | 104.4 | 4.4 |
| 60 | 10,134.2 | 10,655.3 | 10,233.1 | 10,340.9 | 97.2 | 101.9 | 98.2 | 99.1 | −0.9 |
Table 2.
Influence of temperature on the discharge capacity (1C) of a lithium manganate battery.
Table 2.
Influence of temperature on the discharge capacity (1C) of a lithium manganate battery.
| Temperature/(°C) | Discharge Capacity/mAh | | | Relative Test Reference Point Capacity/(%) | | |
|---|
| 1 | 2 | 3 | Mean Value | 1 | 2 | 3 | Mean Value | Rate of Change |
|---|
| −40 | 3605.2 | 3301.9 | 3553.3 | 3486.8 | 38.2 | 34.4 | 37.9 | 36.8 | −63.2 |
| −20 | 6325.6 | 6530.2 | 6456.3 | 6437.4 | 67.1 | 68.1 | 68.8 | 68.0 | −32.0 |
| −10 | 7252.3 | 7653.5 | 7359.3 | 7421.7 | 76.9 | 79.8 | 78.4 | 78.4 | −21.6 |
| 0 | 9273.1 | 9173.9 | 9273.1 | 9240.0 | 98.3 | 95.6 | 98.8 | 97.6 | −2.4 |
| 25 | 9432.5 | 9592 | 9385.1 | 9469.9 | 100 | 100 | 100 | 100 | 0 |
| 40 | 9563.6 | 9525.9 | 9669.1 | 9586.2 | 101.4 | 99.3 | 103.0 | 101.2 | 1.2 |
| 55 | 11,560.3 | 12,315.8 | 11,210.3 | 11,695.5 | 122.6 | 128.4 | 119.4 | 123.5 | 23.5 |
| 60 | 10,012.5 | 11,005.3 | 10,330.1 | 10,449.3 | 106.1 | 114.7 | 110.1 | 110.3 | 10.3 |
Table 3.
Influence of temperature on the discharge capacity (1C) of a lithium cobalt oxide battery.
Table 3.
Influence of temperature on the discharge capacity (1C) of a lithium cobalt oxide battery.
| Temperature/(°C) | Discharge Capacity/mAh | Relative Test Reference Point Capacity/(%) |
|---|
| 1 | 2 | 3 | Mean Value | 1 | 2 | 3 | Mean Value | Rate of Change |
|---|
| −40 | 1036.7 | 1300.1 | 1120.3 | 1152.4 | 10.5 | 13.2 | 11.4 | 11.7 | −88.3 |
| −20 | 4601.2 | 4442.1 | 4310.2 | 4451.2 | 46.7 | 45.2 | 43.8 | 45.2 | −54.8 |
| −10 | 7420.3 | 7120.9 | 7201.3 | 7247.5 | 75.4 | 72.4 | 73.1 | 73.6 | −26.4 |
| 0 | 9020.3 | 9230.2 | 9321.3 | 9190.6 | 91.6 | 93.9 | 94.6 | 93.4 | −6.6 |
| 25 | 9842.3 | 9833.9 | 9850.5 | 9842.2 | 100.0 | 100.0 | 100.0 | 100.0 | 0.0 |
| 40 | 9562.2 | 9632.3 | 9652.3 | 9615.6 | 97.2 | 97.9 | 98.0 | 97.7 | −2.3 |
| 55 | 9666.2 | 9864.6 | 9886.2 | 9805.7 | 98.2 | 100.3 | 100.4 | 99.6 | −0.4 |
| 60 | 9836.9 | 9663.3 | 9604.2 | 9701.5 | 99.9 | 98.3 | 97.5 | 98.6 | −1.4 |
Table 4.
OCV data obtained by interpolation method.
Table 4.
OCV data obtained by interpolation method.
| SOC (%) | Charge (V) | Discharge (V) | OCV Obtained by Interpolation Method (V) |
|---|
| 0 | 40 | 40 | 40 |
| 5 | 47.845 | 45.151 | 46.498 |
| 10 | 49.02 | 46.51 | 47.765 |
| 15 | 49.1816 | 46.67 | 47.9258 |
| 20 | 49.50566 | 46.974 | 48.23983 |
| 25 | 49.84997 | 47.298 | 48.573985 |
| 30 | 50.113 | 47.48 | 48.7965 |
| 35 | 50.275 | 47.663 | 48.969 |
| 40 | 50.336 | 47.784 | 49.06 |
| 45 | 50.356 | 47.8854 | 49.1207 |
| 50 | 50.3766 | 47.946 | 49.1613 |
| 55 | 50.3968 | 48.027 | 49.2119 |
| 60 | 50.437 | 48.06765 | 49.252325 |
| 65 | 50.4778 | 48.1082 | 49.293 |
| 70 | 50.579 | 48.14866 | 49.36383 |
| 75 | 50.6804 | 48.20942 | 49.44491 |
| 80 | 50.883 | 48.371 | 49.627 |
| 85 | 50.9639 | 48.594 | 49.77895 |
| 90 | 51.02468 | 48.7158 | 49.87024 |
| 95 | 51.30823 | 48.736 | 50.022115 |
| 100 | 58.073 | 58.093 | 58.083 |
Table 5.
Comparison data table of OCV obtained by static method and interpolation method.
Table 5.
Comparison data table of OCV obtained by static method and interpolation method.
| SOC (%) | OCV Obtained by Static Method (V) | OCV Obtained by Interpolation Method (V) |
|---|
| 100 | 52.9285 | 58.083 |
| 95 | 49.68799 | 50.022115 |
| 90 | 49.68794 | 49.87024 |
| 85 | 49.6677 | 49.77895 |
| 80 | 49.64743 | 49.627 |
| 75 | 49.46515 | 49.44491 |
| 70 | 49.3841 | 49.36383 |
| 65 | 49.34363 | 49.293 |
| 60 | 49.2626 | 49.252325 |
| 55 | 49.20185 | 49.2119 |
| 50 | 49.16135 | 49.1613 |
| 45 | 49.10058 | 49.1207 |
| 40 | 49.0398 | 49.06 |
| 35 | 48.99932 | 48.969 |
| 30 | 48.7765 | 48.7965 |
| 25 | 48.5537 | 48.573985 |
| 20 | 48.31069 | 48.23983 |
| 15 | 48.0474 | 47.9258 |
| 10 | 47.865 | 47.765 |
| 5 | 46.5689 | 46.498 |
| 0 | 42.5 | 40 |
| Publisher’s Note: MDPI stays neutral with regard to jurisdictional claims in published maps and institutional affiliations. |
© 2021 by the authors. Licensee MDPI, Basel, Switzerland. This article is an open access article distributed under the terms and conditions of the Creative Commons Attribution (CC BY) license (https://creativecommons.org/licenses/by/4.0/).


