
The Impact of Local Anti-Smog Resolution in Cracow (Poland) on the Concentrations of PM10 and BaP Based on the Results of Measurements of the State Environmental Monitoring


Abstract
:1. Introduction
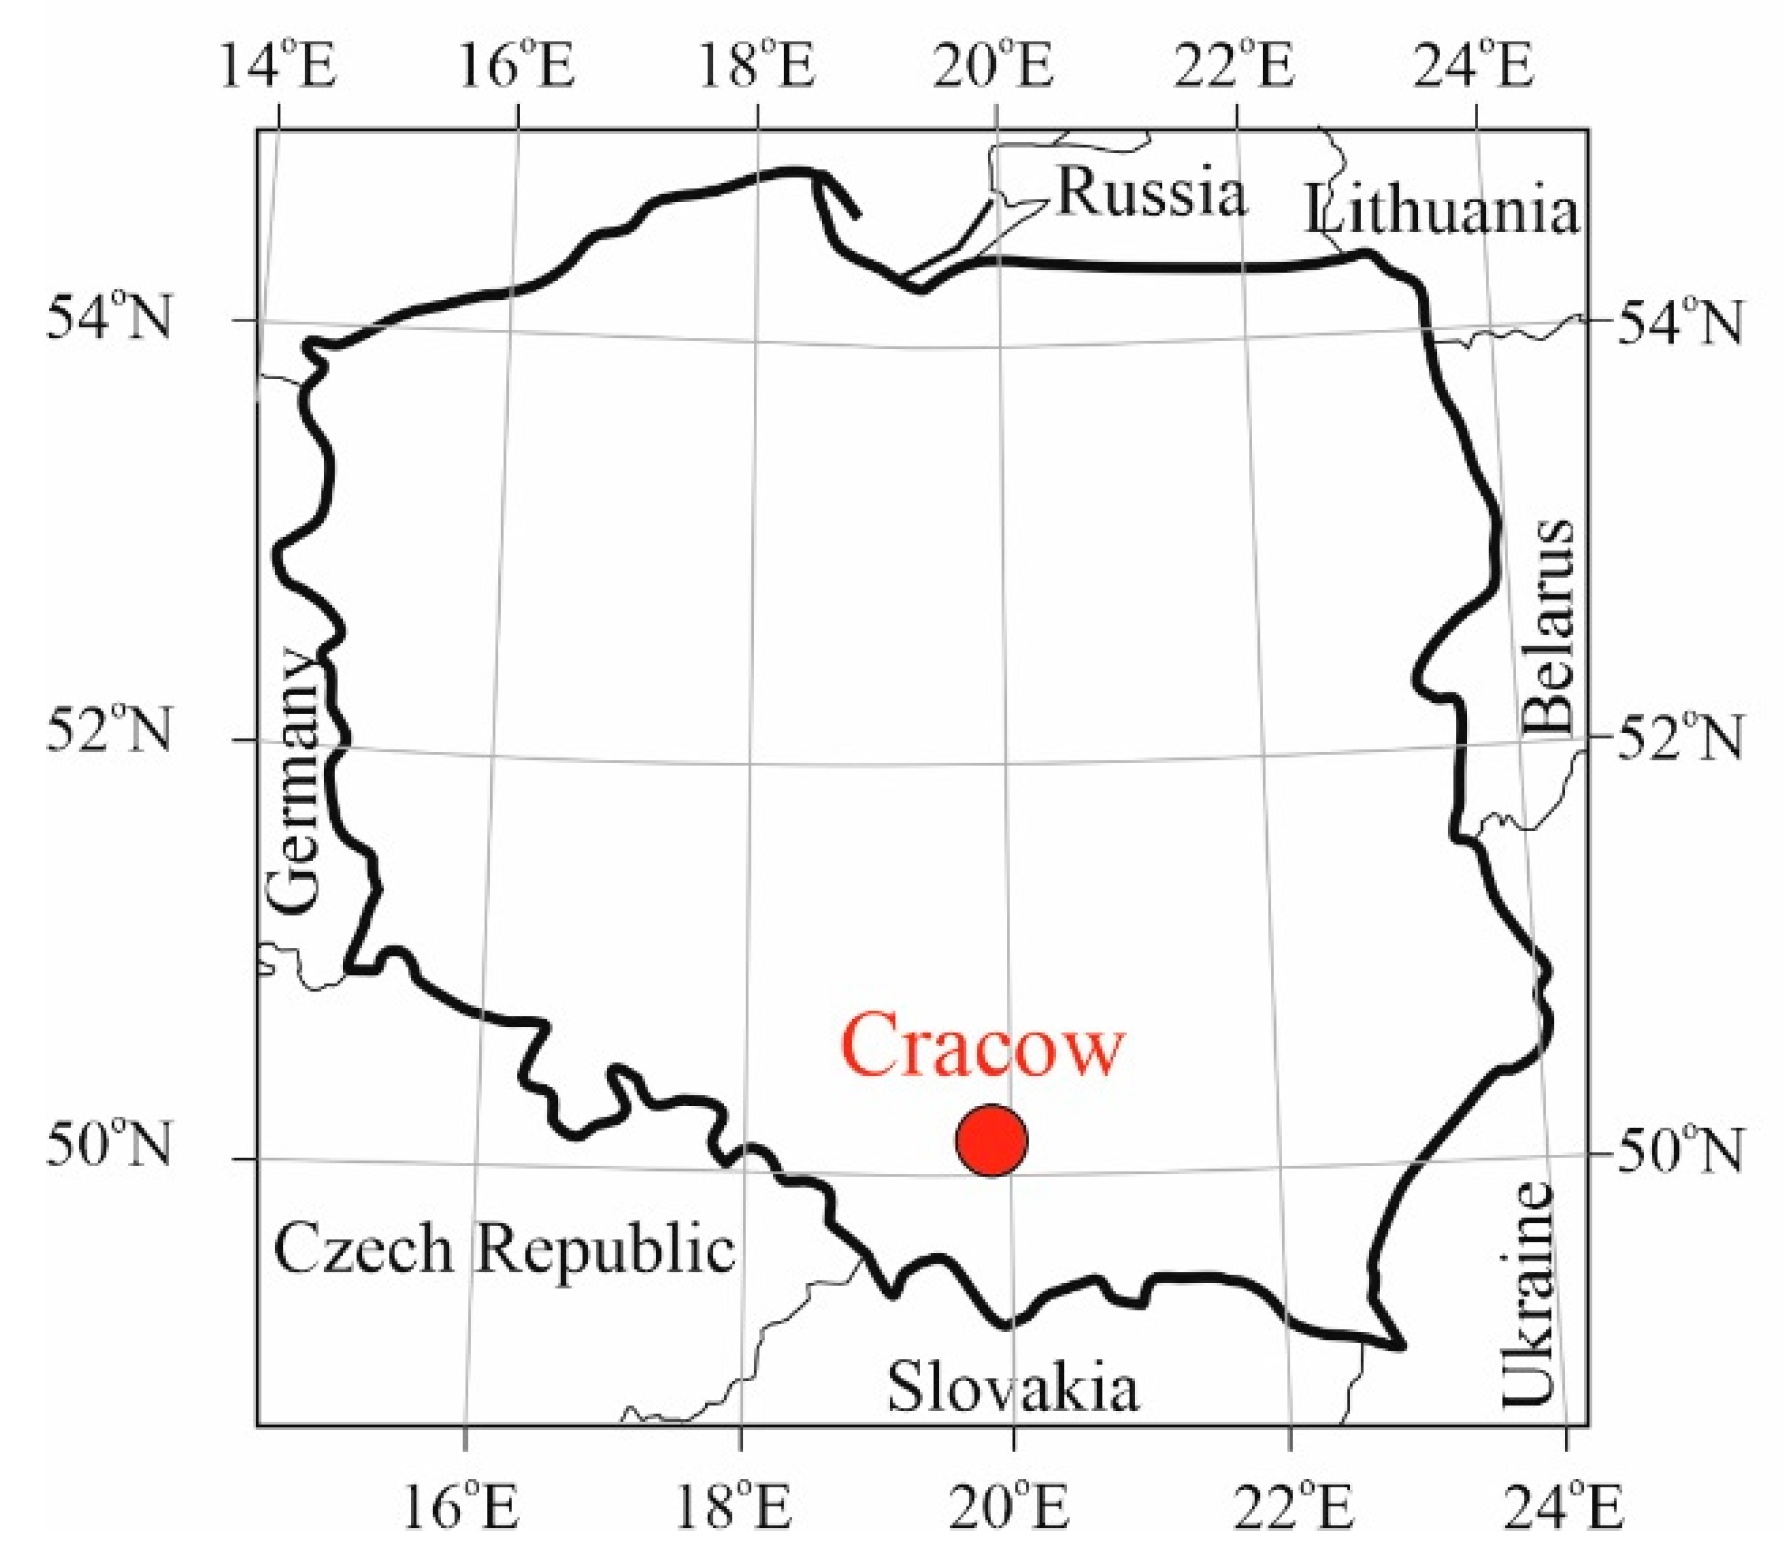
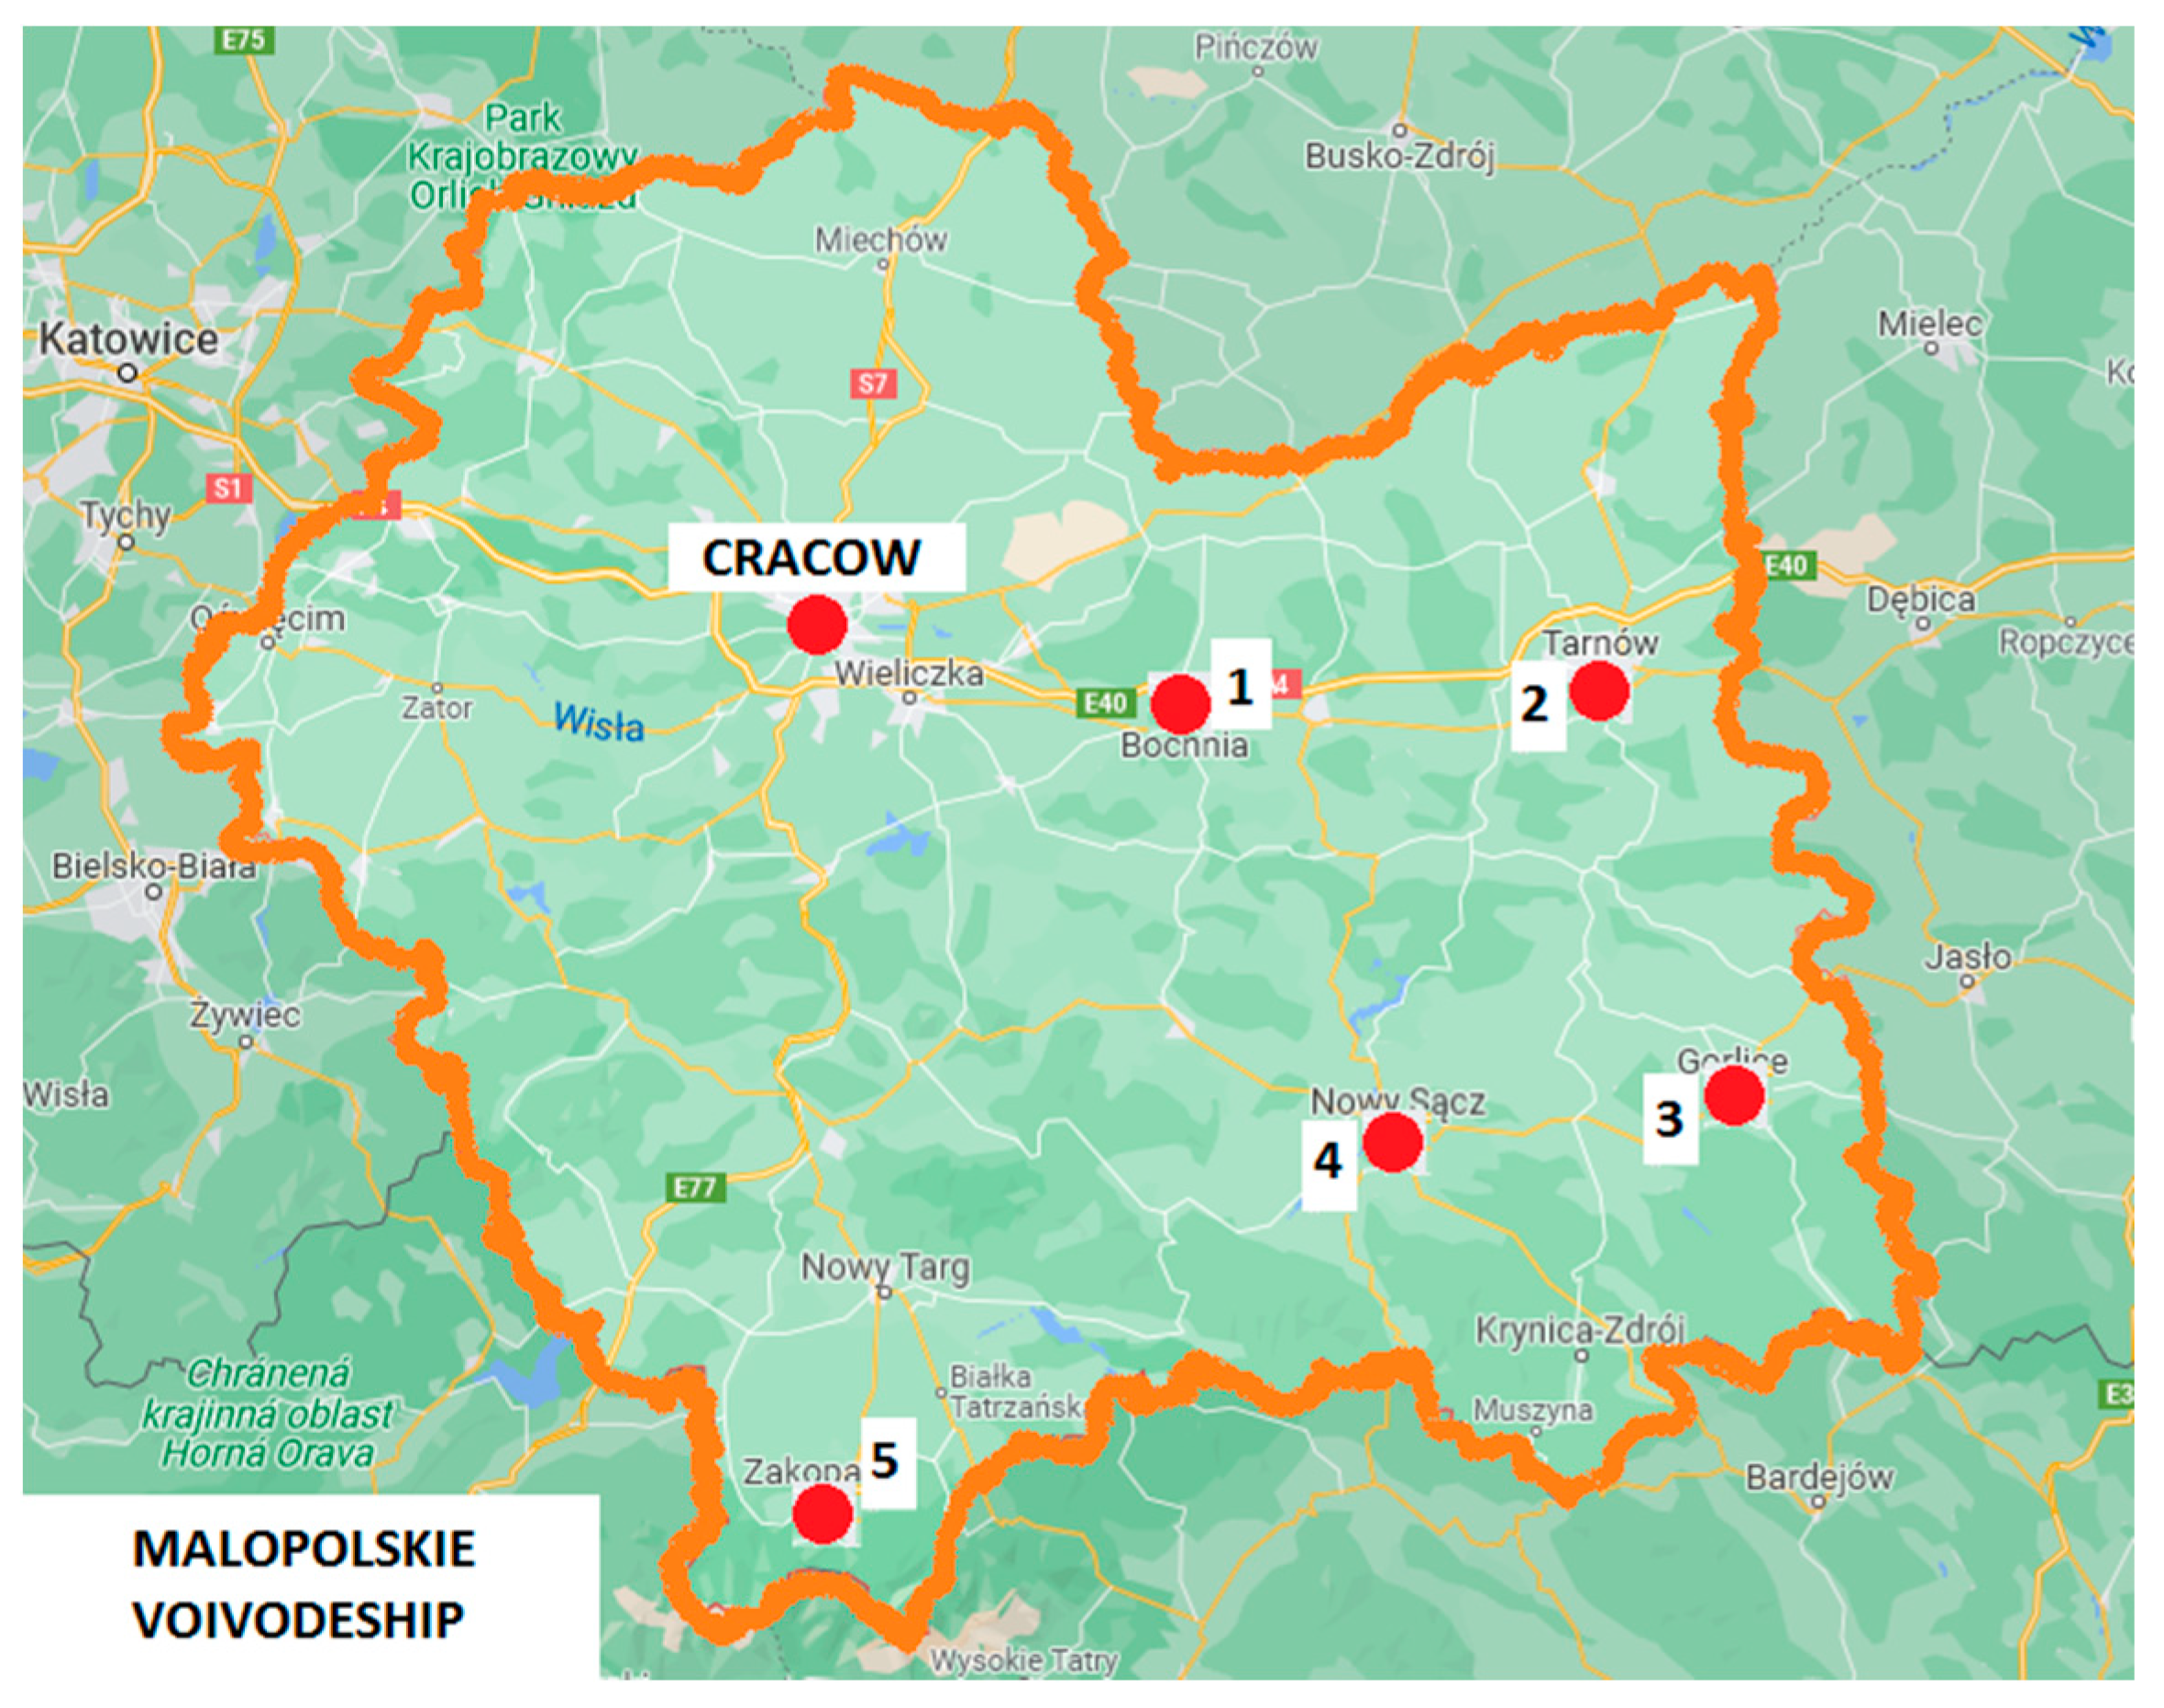
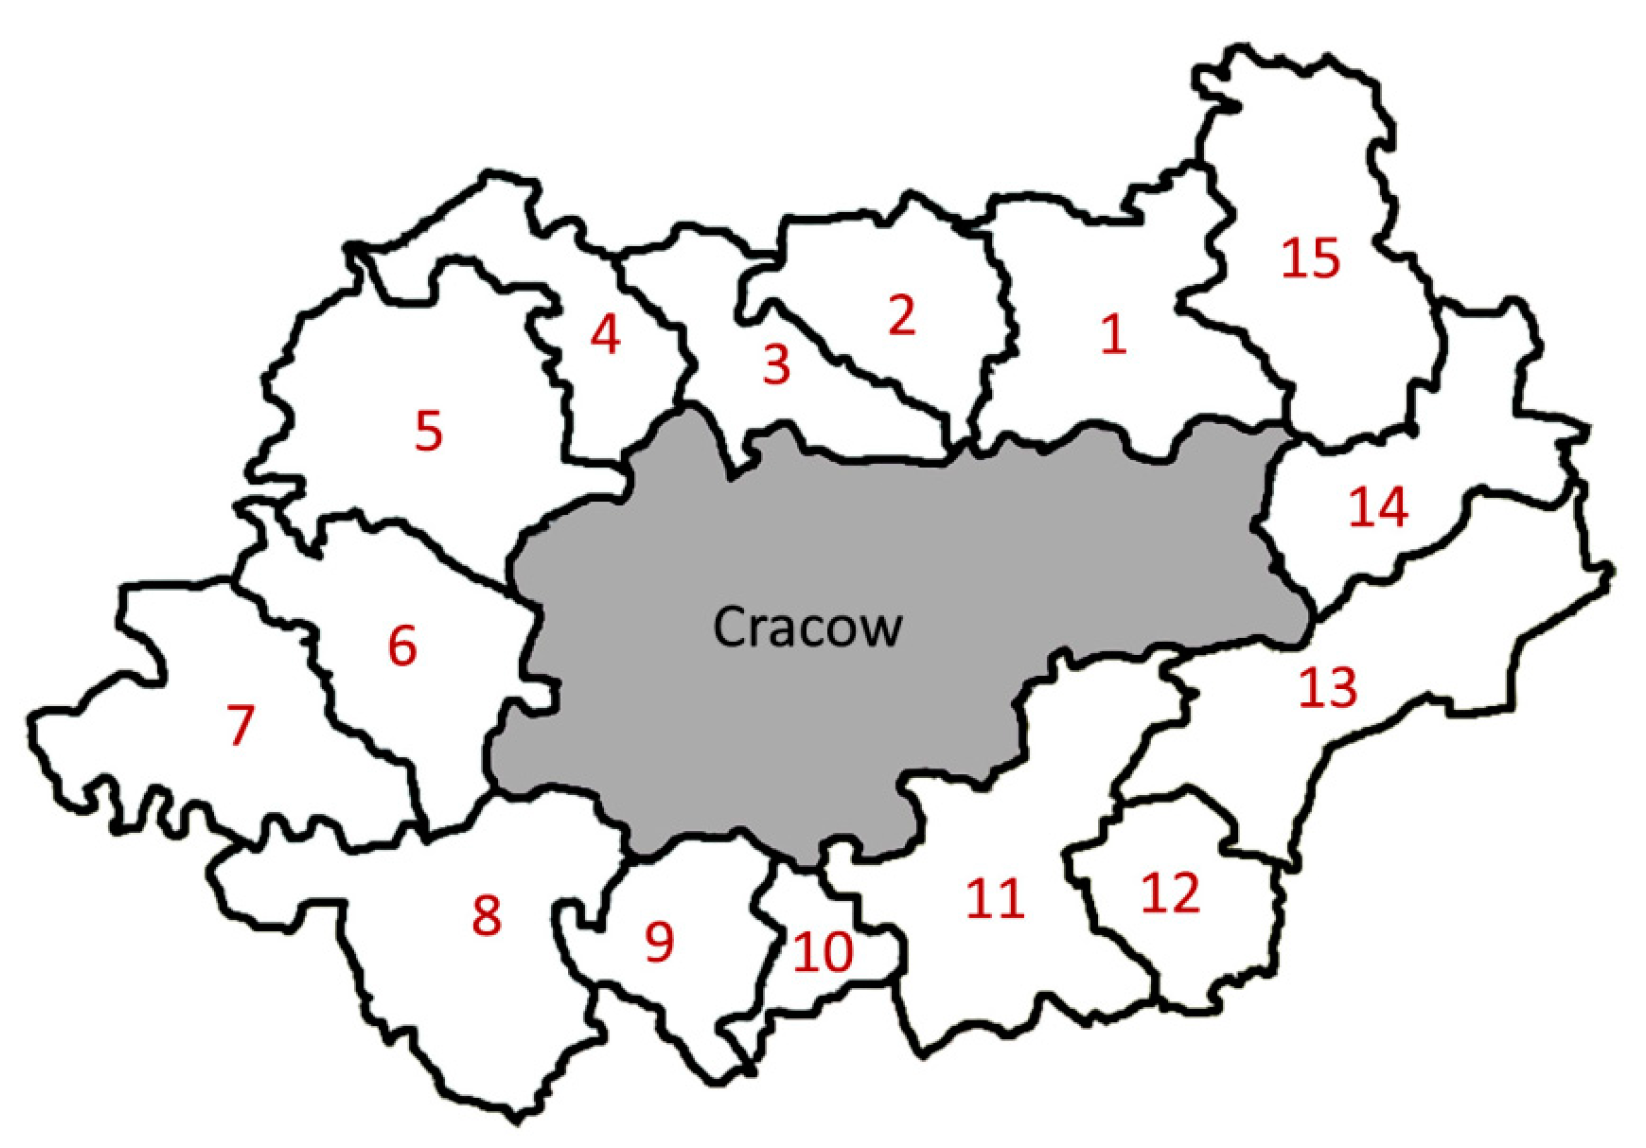
2. Study Area
3. Methodology
4. Results
5. Discussion
6. Conclusions
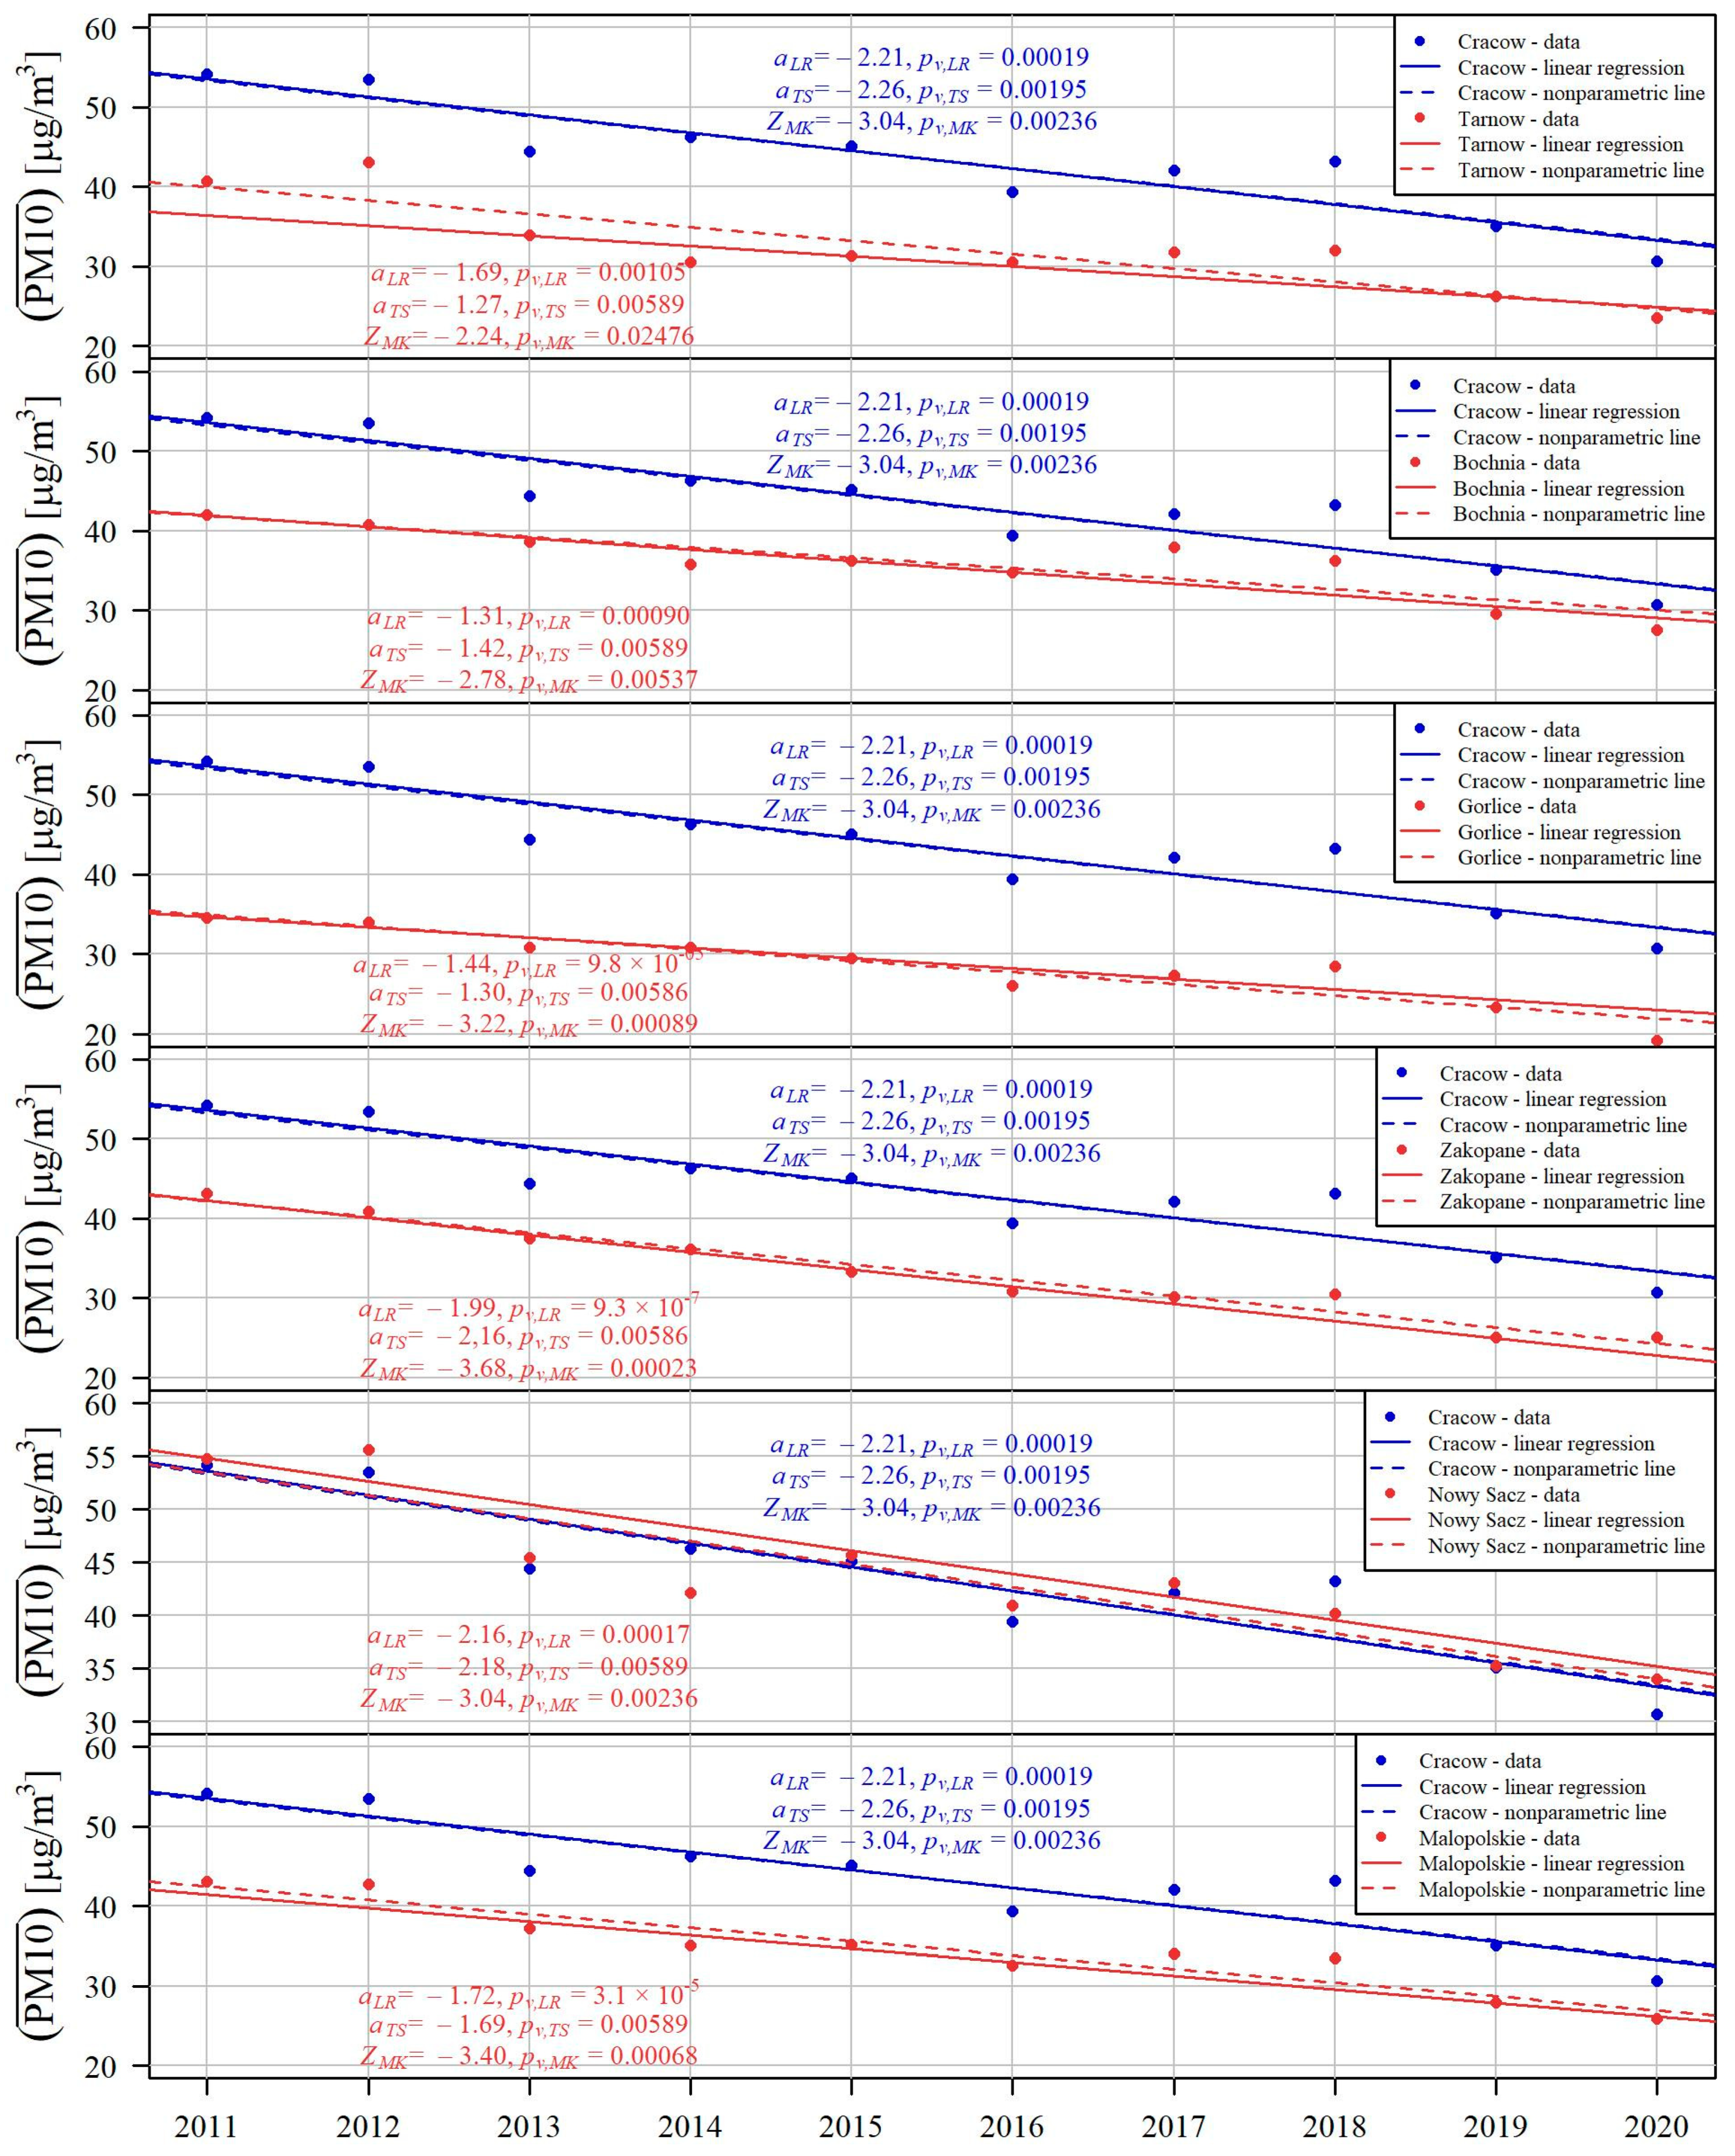
- The implementation of the provisions of the anti-smog resolution for the Malopolskie Voivodeship and the local anti-smog resolution for Cracow results in the general improvement of air quality in Cracow and the Malopolskie Voivodeship in terms of PM10 and BaP (PM10) concentrations.
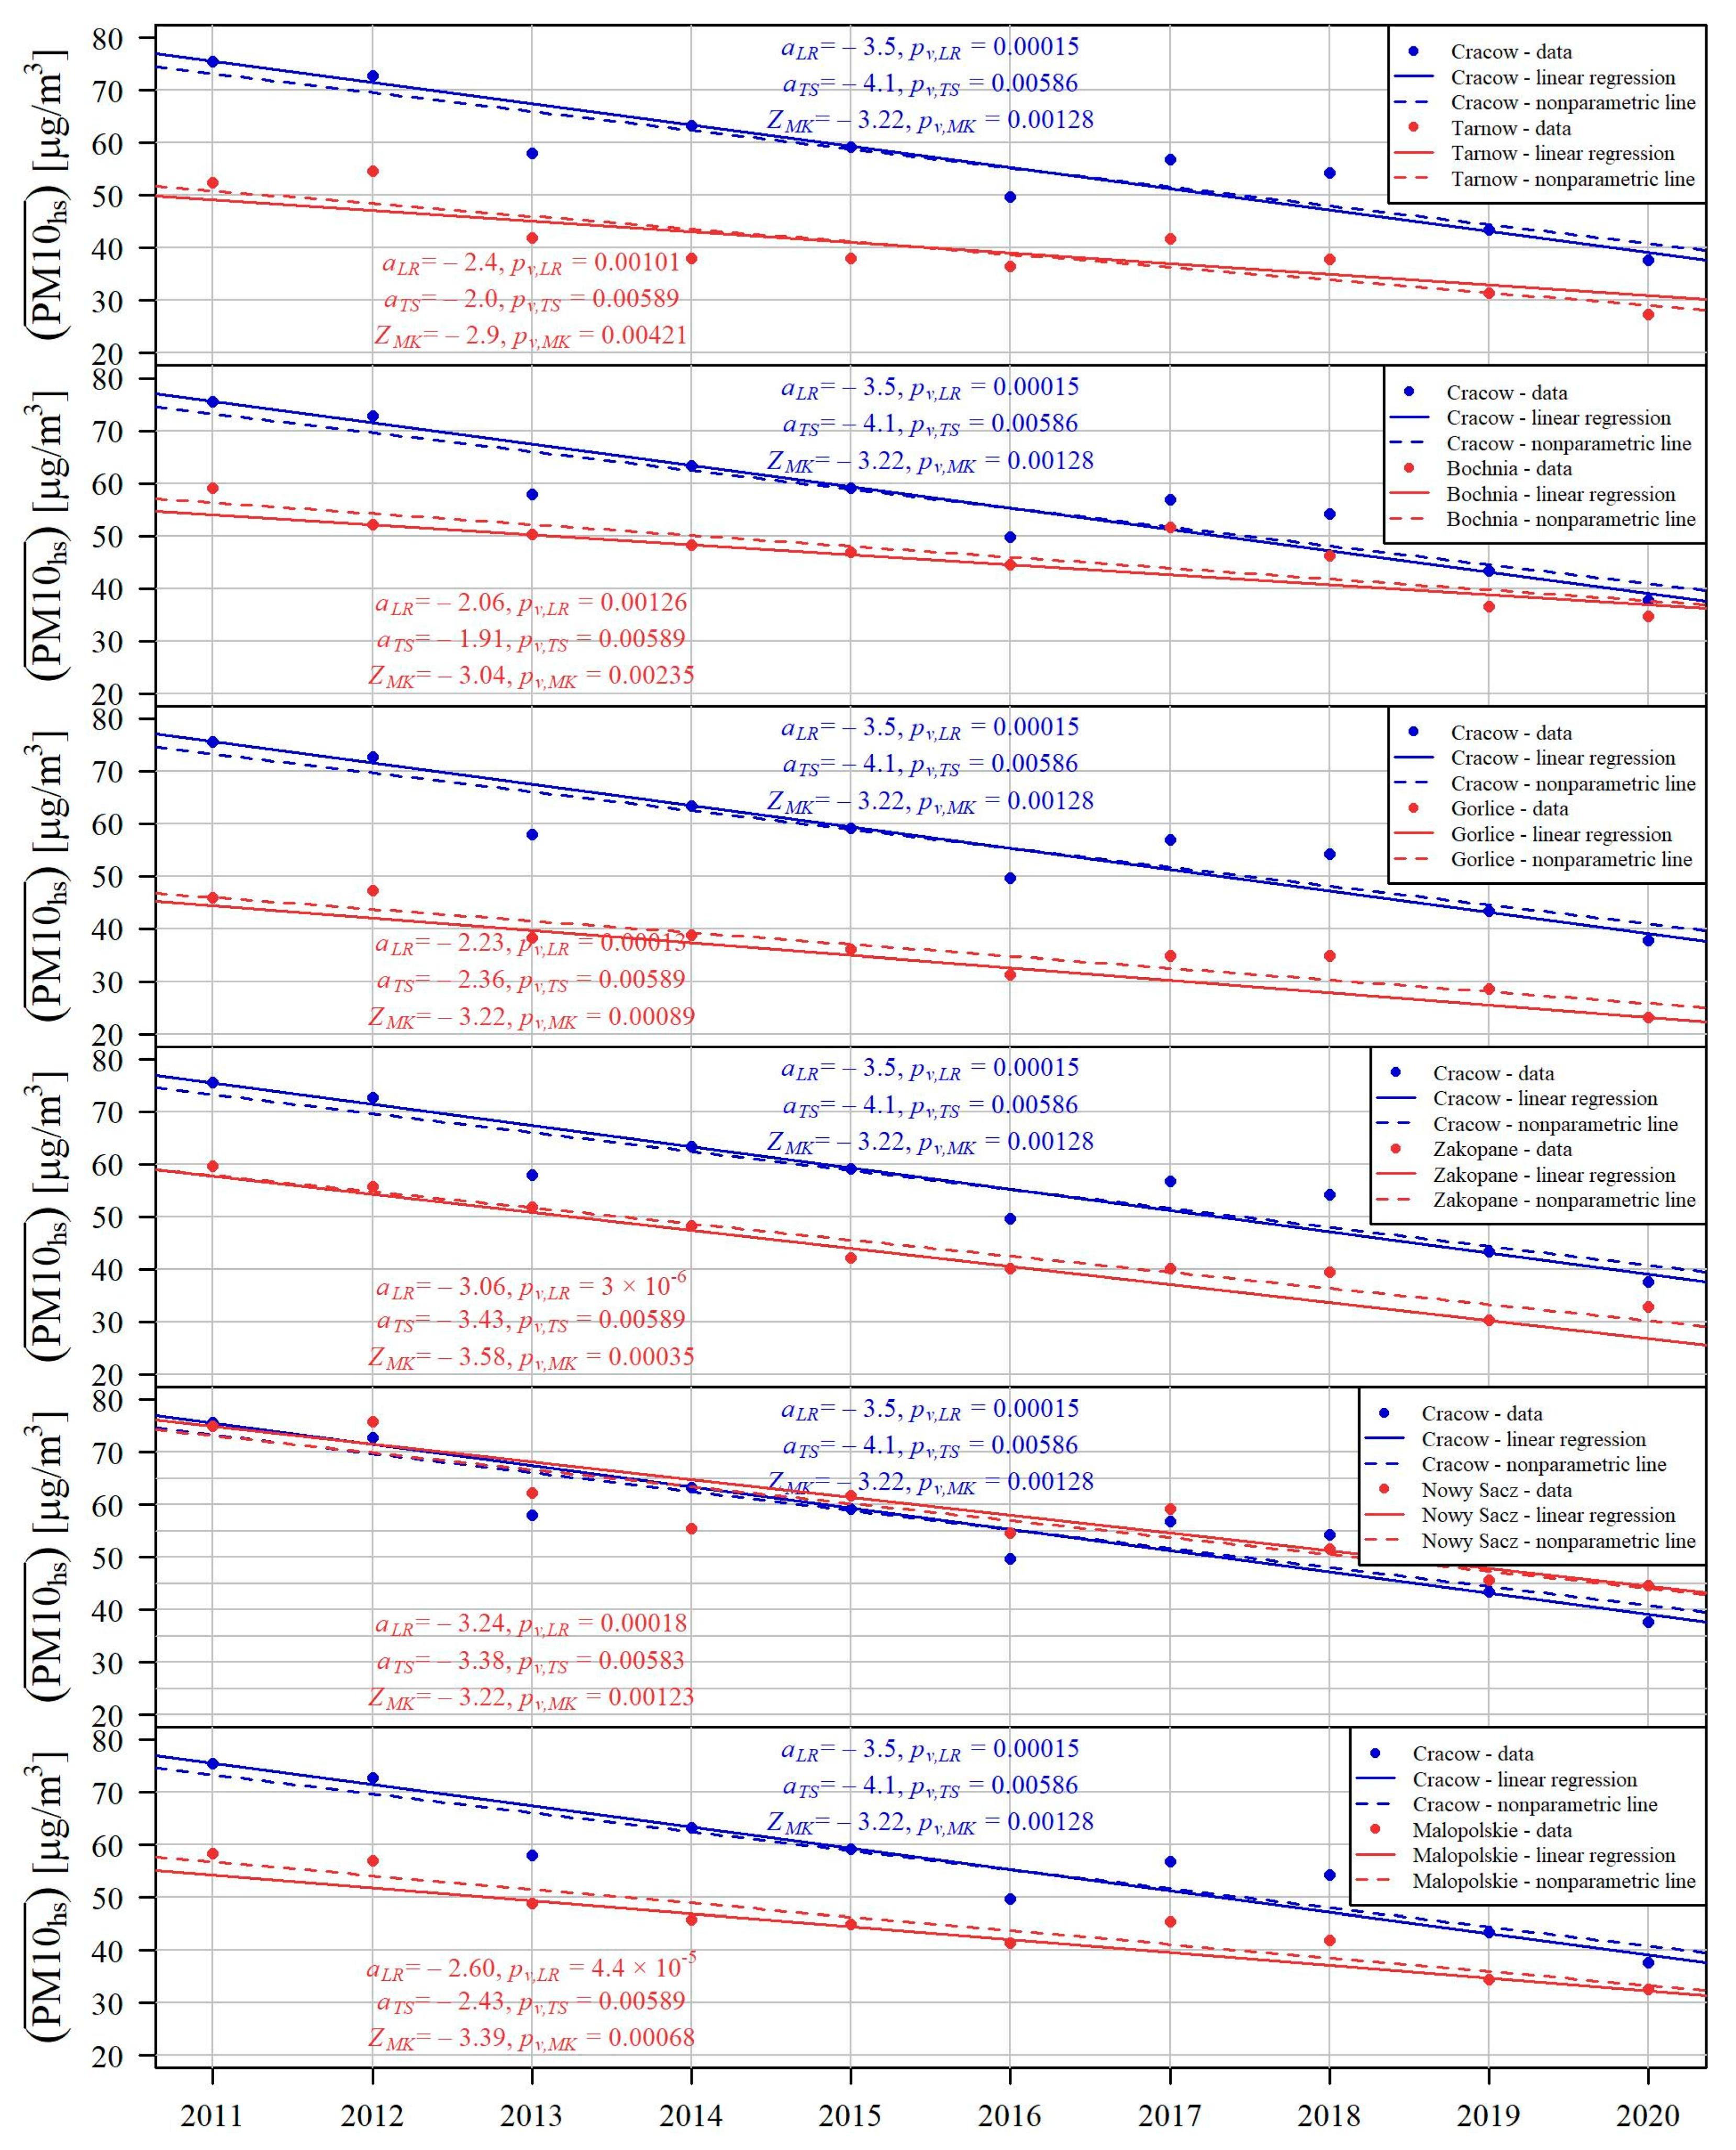
- The rate of decline in the average annual concentrations of PM10 and BaP (PM10) in Cracow is always higher than the rate of decline in each of the analyzed cities, as well as generally for the Malopolskie Voivodeship (represented by the analyzed cities, excluding Cracow). The difference is more pronounced with regard to the months of the heating season.
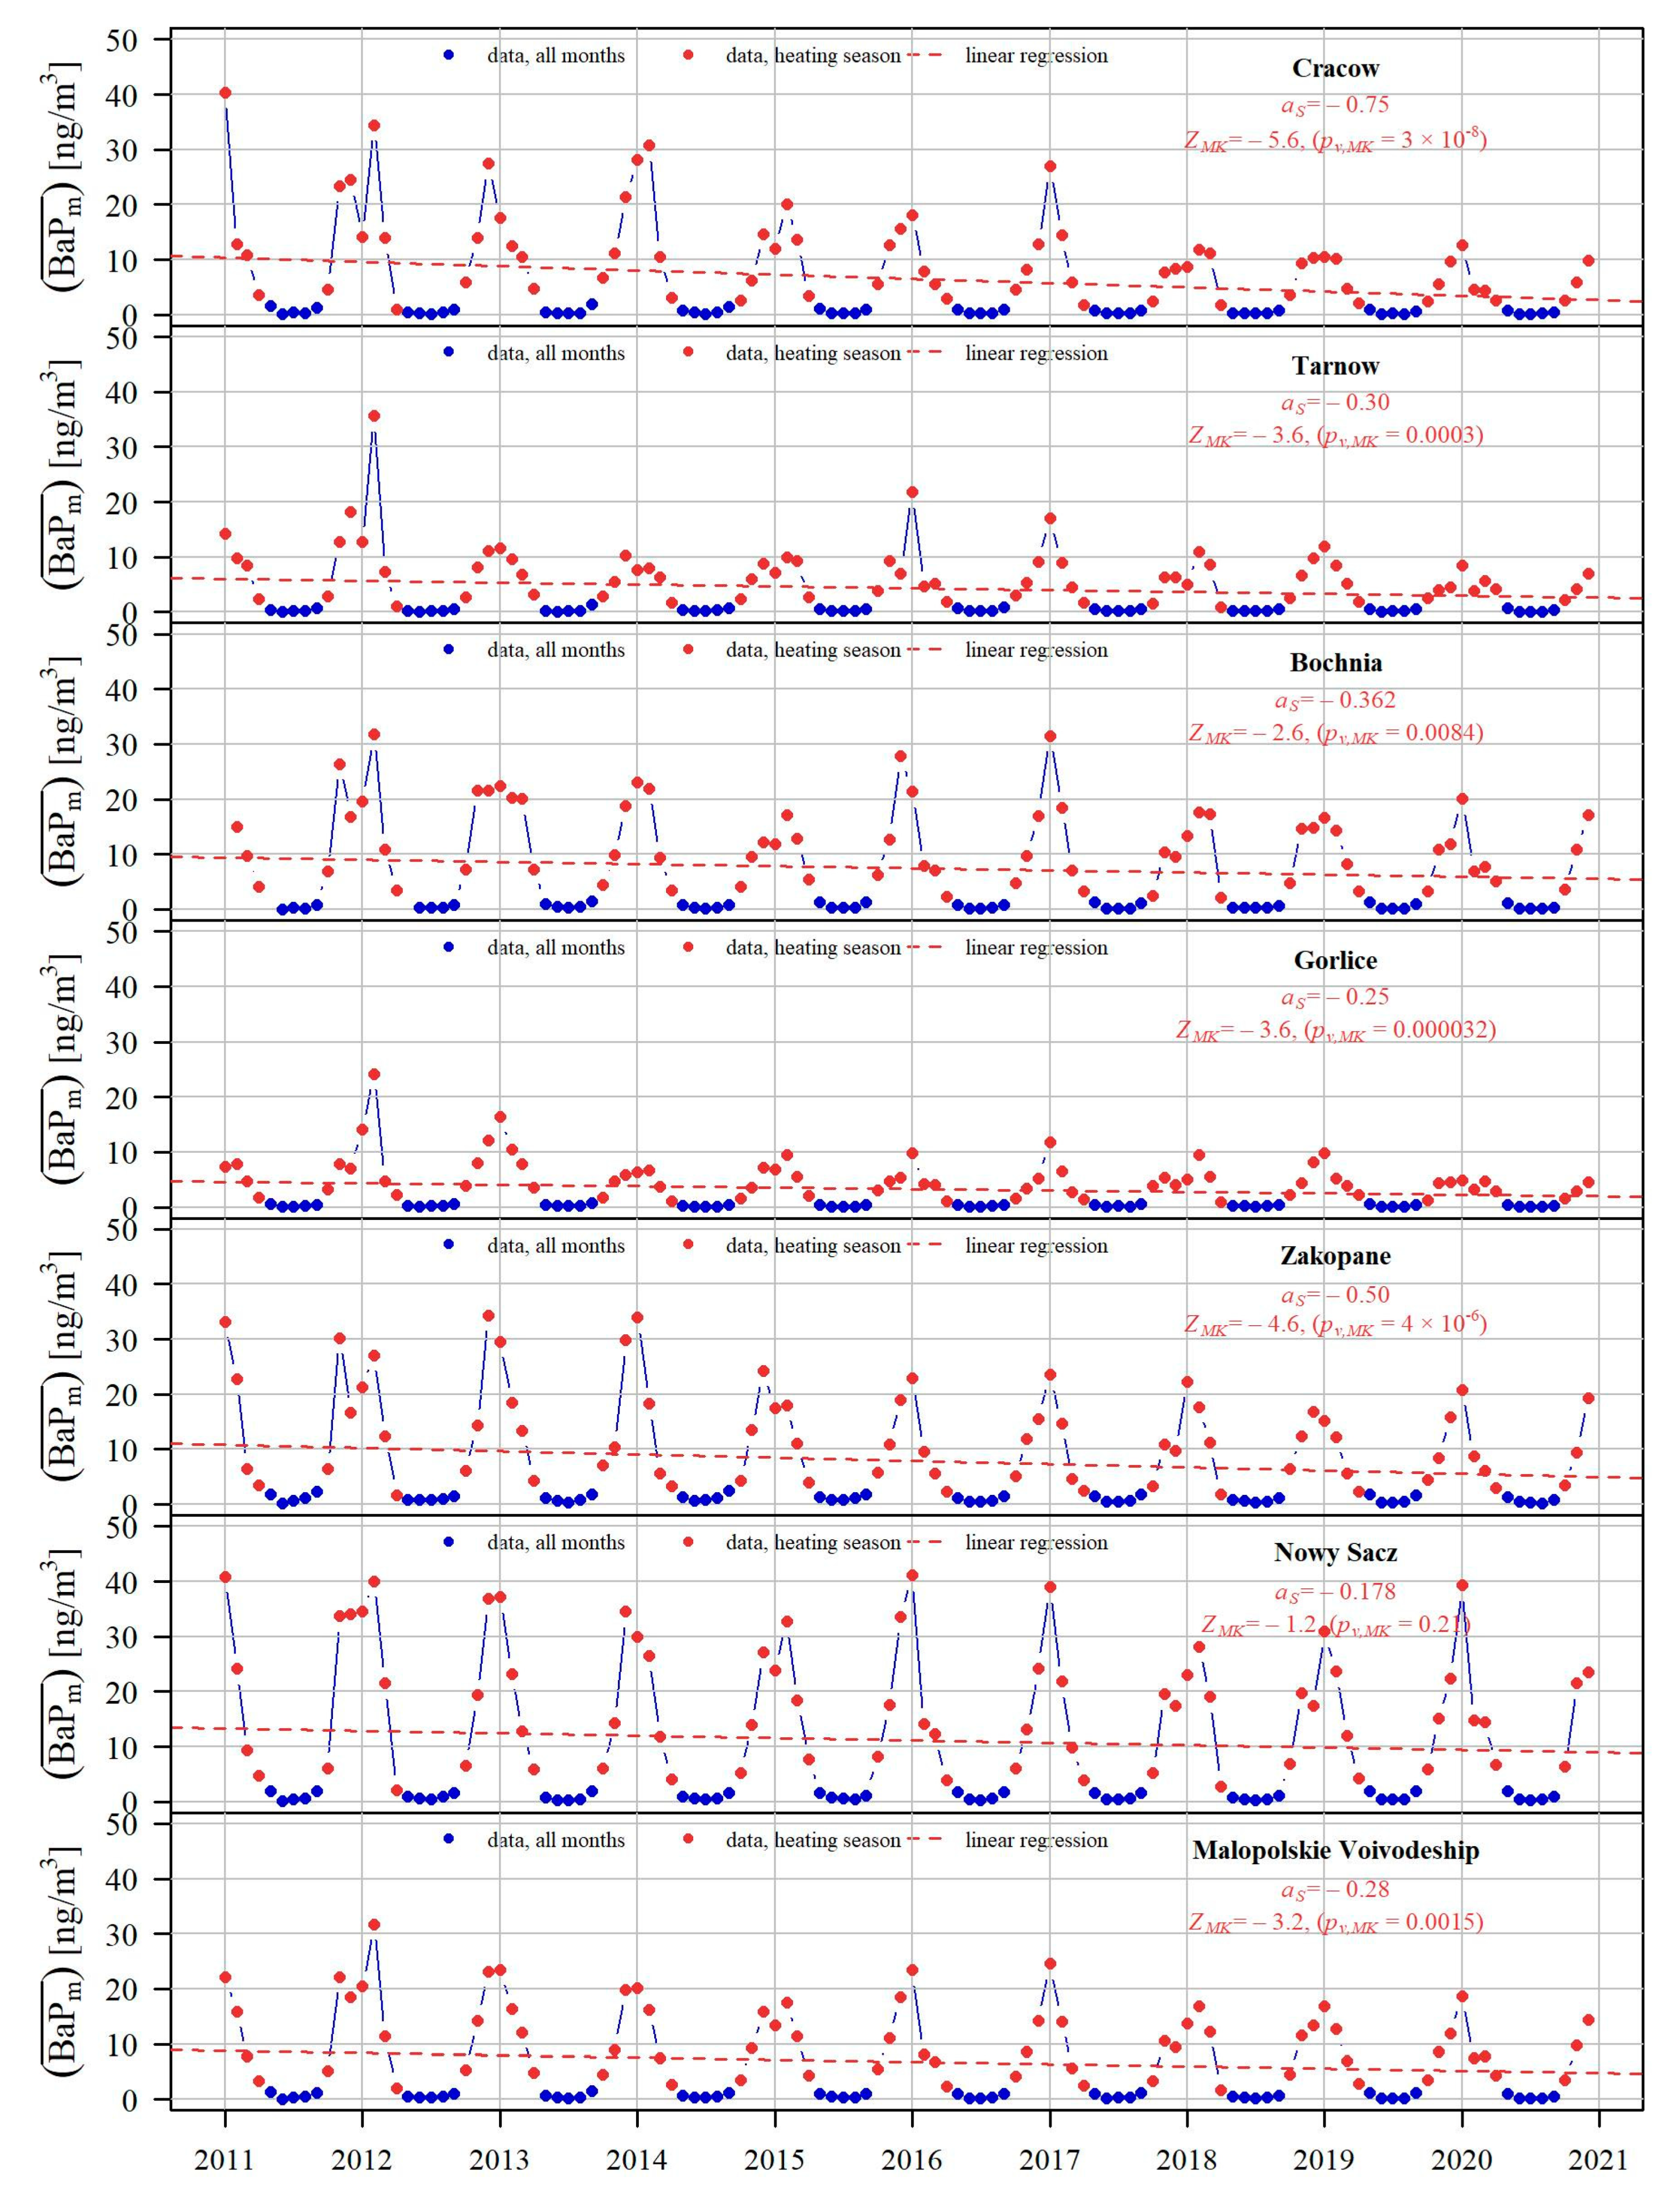
- The rate of changes for the average annual BaP (PM10) concentrations in Cracow, compared to the rate of changes on average in the analyzed cities of the Malopolskie Voivodeship (excluding Cracow), is more intensive than in the case of PM10 concentrations. It is 1.5 times stronger with regard to the months of the heating season and more than twice when analyzing the whole year data.
- The highest seasonal Sen’s slope value of the monthly average concentration of PM10 and BaP (PM10), for the months of the heating season, is also observed in Cracow. The magnitude of the trend on average in the analyzed cities of the Malopolskie Voivodeship (excluding Cracow) is 36% lower in relation to PM10 and 63% lower in relation to BaP (PM10) than in Cracow.
- The rate of changes for monthly averages of BaP (PM10) concentrations in Cracow in the heating season, compared to the rate of changes on average in the analyzed cities of the Malopolskie Voivodeship (excluding Cracow), is more intensive than in the case of PM10 concentrations (1.75 times stronger).
- Since the concentration of BaP (PM10) is a better indicator of the effects of liquidation of high-emission furnaces than the concentration of PM10, it can be concluded that the impact of actions related to the improvement of air quality in Cracow, in the context of changes taking place in selected cities of the Malopolskie Voivodeship, is more visible.
- Cracow’s more radical air quality policy (prohibiting to the use of coal and wood in boilers and fireplaces in Cracow) brings better results than the moderate activities carried out in the Malopolskie Voivodeship.
Author Contributions
Funding
Institutional Review Board Statement
Informed Consent Statement
Data Availability Statement
Conflicts of Interest
References
- WHO Databases. Available online: https://whoairquality.shinyapps.io/AmbientAirQualityDatabase/ (accessed on 15 September 2021).
- WHO—Air Pollution. Available online: https://www.who.int/health-topics/air-pollution#tab=tab_1 (accessed on 15 September 2021).
- European Environment Agency. Air Quality in Europe 2020 Report. Available online: https://www.eea.europa.eu/publications/air-quality-in-europe-2020-report (accessed on 15 September 2021).
- Karagulian, F.; Belis, C.; Dora, C.; Prüss-Ustün, A.; Bonjour, S.; Adair-Rohani, H.; Amann, M. Contributions to cities’ ambient particulate matter (PM): A systematic review of local source contributions at global level. Atmos. Environ. 2015, 120, 475–483. [Google Scholar] [CrossRef]
- Chang, S.; Jiang, Q.; Zhao, Y. Integrating CFD and GIS into the Development of Urban Ventilation Corridors: A Case Study in Changchun City, China. Sustainability 2018, 10, 1814. [Google Scholar] [CrossRef] [Green Version]
- Weber, S.; Kordowski, K.; Kuttler, W. Variability of particle number concentration and particle size dynamics in an urban street canyon under different meteorological conditions. Sci. Total Environ. 2013, 449, 102–114. [Google Scholar] [CrossRef]
- Wang, H.; Zhang, Y.; Tsou, J.; Li, Y. Surface Urban Heat Island Analysis of Shanghai (China) Based on the Change of Land Use and Land Cover. Sustainability 2017, 9, 1538. [Google Scholar] [CrossRef] [Green Version]
- Dzikuć, M.; Łasiński, K. Technical and Economic Aspects of Low Emission Reduction in Poland. Int. J. Appl. Mech. Eng. 2017, 22, 1107–1112. [Google Scholar] [CrossRef] [Green Version]
- Kaczmarczyk, M.; Sowiżdżał, A.; Tomaszewska, B. Energetic and Environmental Aspects of Individual Heat Generation for Sustainable Development at a Local Scale—A Case Study from Poland. Energies 2020, 13, 454. [Google Scholar] [CrossRef] [Green Version]
- The Anti-Smog Resolution for the Małopolskie Voivodeship. Available online: https://bip.malopolska.pl/umwm,a,1283900,uchwala-nr-xxxii45217-sejmiku-wojewodztwa-malopolskiego-z-dnia-23-styczna-2017-r-w-sprawie-wprowadze.html/ (accessed on 15 September 2021).
- Local Anti-Smog Resolution for Cracow. Available online: https://bip.malopolska.pl/umwm/Article/get/id,1159347.html (accessed on 15 September 2021).
- Ki-Hyun, K.; Zang-Ho, S. Long-term changes in PM10 levels in urban air in relation with air quality control efforts. Atmos. Environ. 2011, 45, 3309–3317, ISSN 1352-2310. [Google Scholar] [CrossRef]
- Sicard, P.; Agathokleous, E.; De Marco, A.; Paoletti, E.; Calatayud, V. Urban population exposure to air pollution in Europe over the last decades. Environ. Sci. Eur. 2021, 33, 28. [Google Scholar] [CrossRef]
- Fang, C.; Tan, X.; Zhong, Y.; Wang, J. Research on the Temporal and Spatial Characteristics of Air Pollutants in Sichuan Basin. Atmosphere 2021, 12, 1504. [Google Scholar] [CrossRef]
- Han, C.; Lim, Y.-H.; Yorifuji, T.; Hong, Y.-C. Air quality management policy and reduced mortality rates in Seoul Metropolitan Area: A quasi-experimental study. Environ. Int. 2018, 121, 600–609. [Google Scholar] [CrossRef]
- Kim, S.-Y.; Kim, H.; Lee, J.-T. Health Effects of Air-Quality Regulations in Seoul Metropolitan Area: Applying Synthetic Control Method to Controlled-Interrupted Time-Series Analysis. Atmosphere 2020, 11, 868. [Google Scholar] [CrossRef]
- Blumberga, A.; Bazbauers, G.; Vancane, S.; Ijabs, I.; Nikisins, J.; Blumberga, D. Unintended Effects of Energy Efficiency Policy: Lessons Learned in the Residential Sector. Energies 2021, 14, 7792. [Google Scholar] [CrossRef]
- Lopez-Aparicio, S.; Grythe, H. Evaluating the effectiveness of a stove exchange programme on PM2.5 emission reduction. Atmos. Environ. 2020, 231, 117529. [Google Scholar] [CrossRef]
- Mardones, C. Ex-post evaluation and cost-benefit analysis of a heater replacement program implemented in southern Chile. Energy 2021, 227, 120484. [Google Scholar] [CrossRef]
- Schreiberová, M.; Vlasáková, L.; Vlček, O.; Šmejdířová, J.; Horálek, J.; Bieser, J. Benzo[a]pyrene in the Ambient Air in the Czech Republic: Emission Sources, Current and Long-Term Monitoring Analysis and Human Exposure. Atmosphere 2020, 11, 955. [Google Scholar] [CrossRef]
- Barzeghar, V.; Sarbakhsh, P.; Hassanvand, M.S.; Faridi, S.; Gholampour, A. Long-term trend of ambient air PM10, PM2.5, and O3 and their health effects in Tabriz city, Iran, during 2006–2017. Sustain. Cities Soc. 2020, 54, 101988. [Google Scholar] [CrossRef]
- Central Statistical Office. Available online: https://stat.gov.pl/ (accessed on 15 September 2021).
- Bokwa, A. Environmental Impacts of Long-Term Air Pollution Changes in Kraków, Poland. Pol. J. Environ. Stud. 2008, 17, 673–686. [Google Scholar]
- Błażejczyk, K. Air exchange and regeneration system as a factor in the improvement of aerosanitary and bioclimatic conditions (in Polish: System wymiany i regeneracji powietrza jako czynnik poprawy warunków aerosanitarnych i bioklimatycznych.) Środowisko przyrodnicze Krakowa. Zasoby-Ochrona-Kształtowanie. In Instytut Geografii i Gospodarki Przestrzennej; Bascik, M., i Degórska, B., Eds.; 2015; Volume 10.3, pp. 187–190. Available online: https://www.kkm.biblioteka.krakow.pl/laureaci/bascik-degorska-srodowisko-przyrodnicze-krakowa/ (accessed on 12 October 2021).
- Chief Inspectorate for Environmental Protection. Annual Assessment of Air Quality in the Małopolskie Voivodeship. Voivodeship Report for 2020. Available online: http://powietrze.gios.gov.pl/pjp/publications/card/25101 (accessed on 15 September 2021).
- EIONET Central Data Repository. Poland’s Informative Inventory Report 2021. Ministry of Climate and Environment. Available online: https://cdr.eionet.europa.eu/pl/eu/nec_revised/iir/envyei5sq/IIR_2021_Poland.pdf/manage_document (accessed on 30 October 2021).
- Chief Inspectorate for Environmental Protection. Assessment of Air Quality in Zones in Poland for 2020. Cumulative National Report on the Annual Assessment of Air Quality in Zones Carried Out by the CIEP in Accordance with the Principles Set Out in Art. 89 of the Act-Environmental Protection Law. Available online: http://powietrze.gios.gov.pl/pjp/publications/card/32100 (accessed on 30 October 2021). (In Polish)
- National Center for Emissions Management. Available online: https://www.kobize.pl/ (accessed on 30 October 2021).
- Chief Inspectorate for Environmental Protection. Measurement Data Bank. Available online: http://powietrze.gios.gov.pl/pjp/archives and https://www.gios.gov.pl/pl/ (accessed on 30 October 2021).
- Kendall, M.G. Rank Correlation Methods, 4th ed.; Scientific Research: London, UK, 1975. [Google Scholar]
- Mann, H.B. Nonparametric tests against trend. Econometrica 1945, 13, 245–259. [Google Scholar] [CrossRef]
- Hamed, K.H.; Rao, A.R. A modified Mann–Kendall trend test for autocorrelated data. J. Hydrol. 1998, 204, 182–196. [Google Scholar] [CrossRef]
- Theil, H. A rank invariant method for linear and polynomial regression analysis. Nederl. Akad. Wetensch. Proc. Ser. A 1950, 53, 386–392 (Part I), 521–525 (Part II), 1397–1412 (Part III). [Google Scholar]
- Sen, P.K. Estimates of Regression Coefficient Based on Kendall’s tau. J. Am. Stat. Ass. 1968, 63, 1379–1389. [Google Scholar] [CrossRef]
- Helsel, D.R.; Hirsch, R.M.; Ryberg, K.R.; Archfield, S.A.; Gilroy, E.J. Statistical methods in water resources: U.S. Geological Survey Techniques and Methods. In Supersedes USGS Techniques of Water-Resources Investigations; U.S. Geological Survey: Reston, VA, USA, 2020; 458p. [Google Scholar] [CrossRef]
- The R Project for Statistical Computing. R: A Language and Environment for Statistical Computing; R Foundation for Statistical Computing: Vienna, Austria; Available online: https://www.r-project.org/ (accessed on 6 December 2021).
- Institute of Meteorology and Water Management-National Research Institute (IMGW-PIB). Available online: https://danepubliczne.imgw.pl (accessed on 31 October 2021).
- Chief Inspectorate for Environmental Protection. Annual Assessment of Air Quality in the Małopolskie Voivodeship. Voivodeship Report for 2019. Available online: http://powietrze.gios.gov.pl/pjp/publications/card/19100 (accessed on 31 October 2021).
- Filonchyk, M.; Hurynovich, V.; Yan, H. Impact of COVID-19 Pandemic on Air Pollution in Poland Based on Surface Measurements and Satellite Data. Aerosol Air Qual. Res. 2021, 21, 200472. [Google Scholar] [CrossRef]
- Municipal Heat Energy Company in Cracow (MPEC Kraków). Available online: https://www.mpec.krakow.pl/ (accessed on 9 September 2021).
- Information Service of the City of Cracow. Available online: https://www.krakow.pl (accessed on 22 October 2021).


| Month | I | II | III | IV | V | VI | VII | VIII | IX | X | XI | XII |
|---|---|---|---|---|---|---|---|---|---|---|---|---|
| Number of days | 31 | 28 | 31 | 30 | 5 | 0 | 0 | 0 | 5 | 31 | 30 | 31 |
| Nr | City | International Station Code | Station Code | Station Address | WGS84 φ N | WGS84 λ E |
|---|---|---|---|---|---|---|
| 1 | Cracow | PL0501A | MpKrakBujaka | Kraków, ul. Bujaka | 50.010575 | 19.949189 |
| 2 | Bochnia | PL0549A | MpBochKonfed | Bochnia, ul. Konfederatów Barskich | 49.969017 | 20.439511 |
| 3 | Tarnow | PL0502A | MpTarBitStud | Tarnów, ul. Bitwy pod Studziankami | 50.020169 | 21.004167 |
| 4 | Gorlice | PL0478A | MpGorlKrasin | Gorlice, ul. Krasińskiego | 49.658889 | 21.163336 |
| 5 | Nowy Sacz | PL0550A | MpNoSaczNadb | Nowy Sącz, ul. Nadbrzeżna | 49.619281 | 20.714403 |
| 6 | Zakopane | PL0126A | MpZakopaSien | Zakopane, ul. Sienkiewicza | 49.293564 | 19.960083 |
| Nr | City | All Year (PM10) | Heating Season (PM10hs) | ||||
|---|---|---|---|---|---|---|---|
| ZMK | Significance | aTS [μg/m3/year] | ZMK | Significance | aTS [μg/m3/year] | ||
| 1 | Cracow | −3.04 | ** | −2.26 | −3.22 | ** | −4.05 |
| 2 | Tarnow | −2.24 | * | −1.27 | −2.86 | ** | −2.03 |
| 3 | Bochnia | −2.78 | * | −1.42 | −3.04 | ** | −1.91 |
| 4 | Gorlice | −3.22 | ** | −1.30 | −3.22 | ** | −2.36 |
| 5 | Zakopane | −3.66 | ** | −2.16 | −3.58 | ** | −3.43 |
| 6 | Nowy Sacz | −3.04 | ** | −2.18 | −3.22 | ** | −3.38 |
| 7 | Malopolskie Voivodeship | −3.40 | ** | −1.69 | −3.39 | ** | −2.43 |
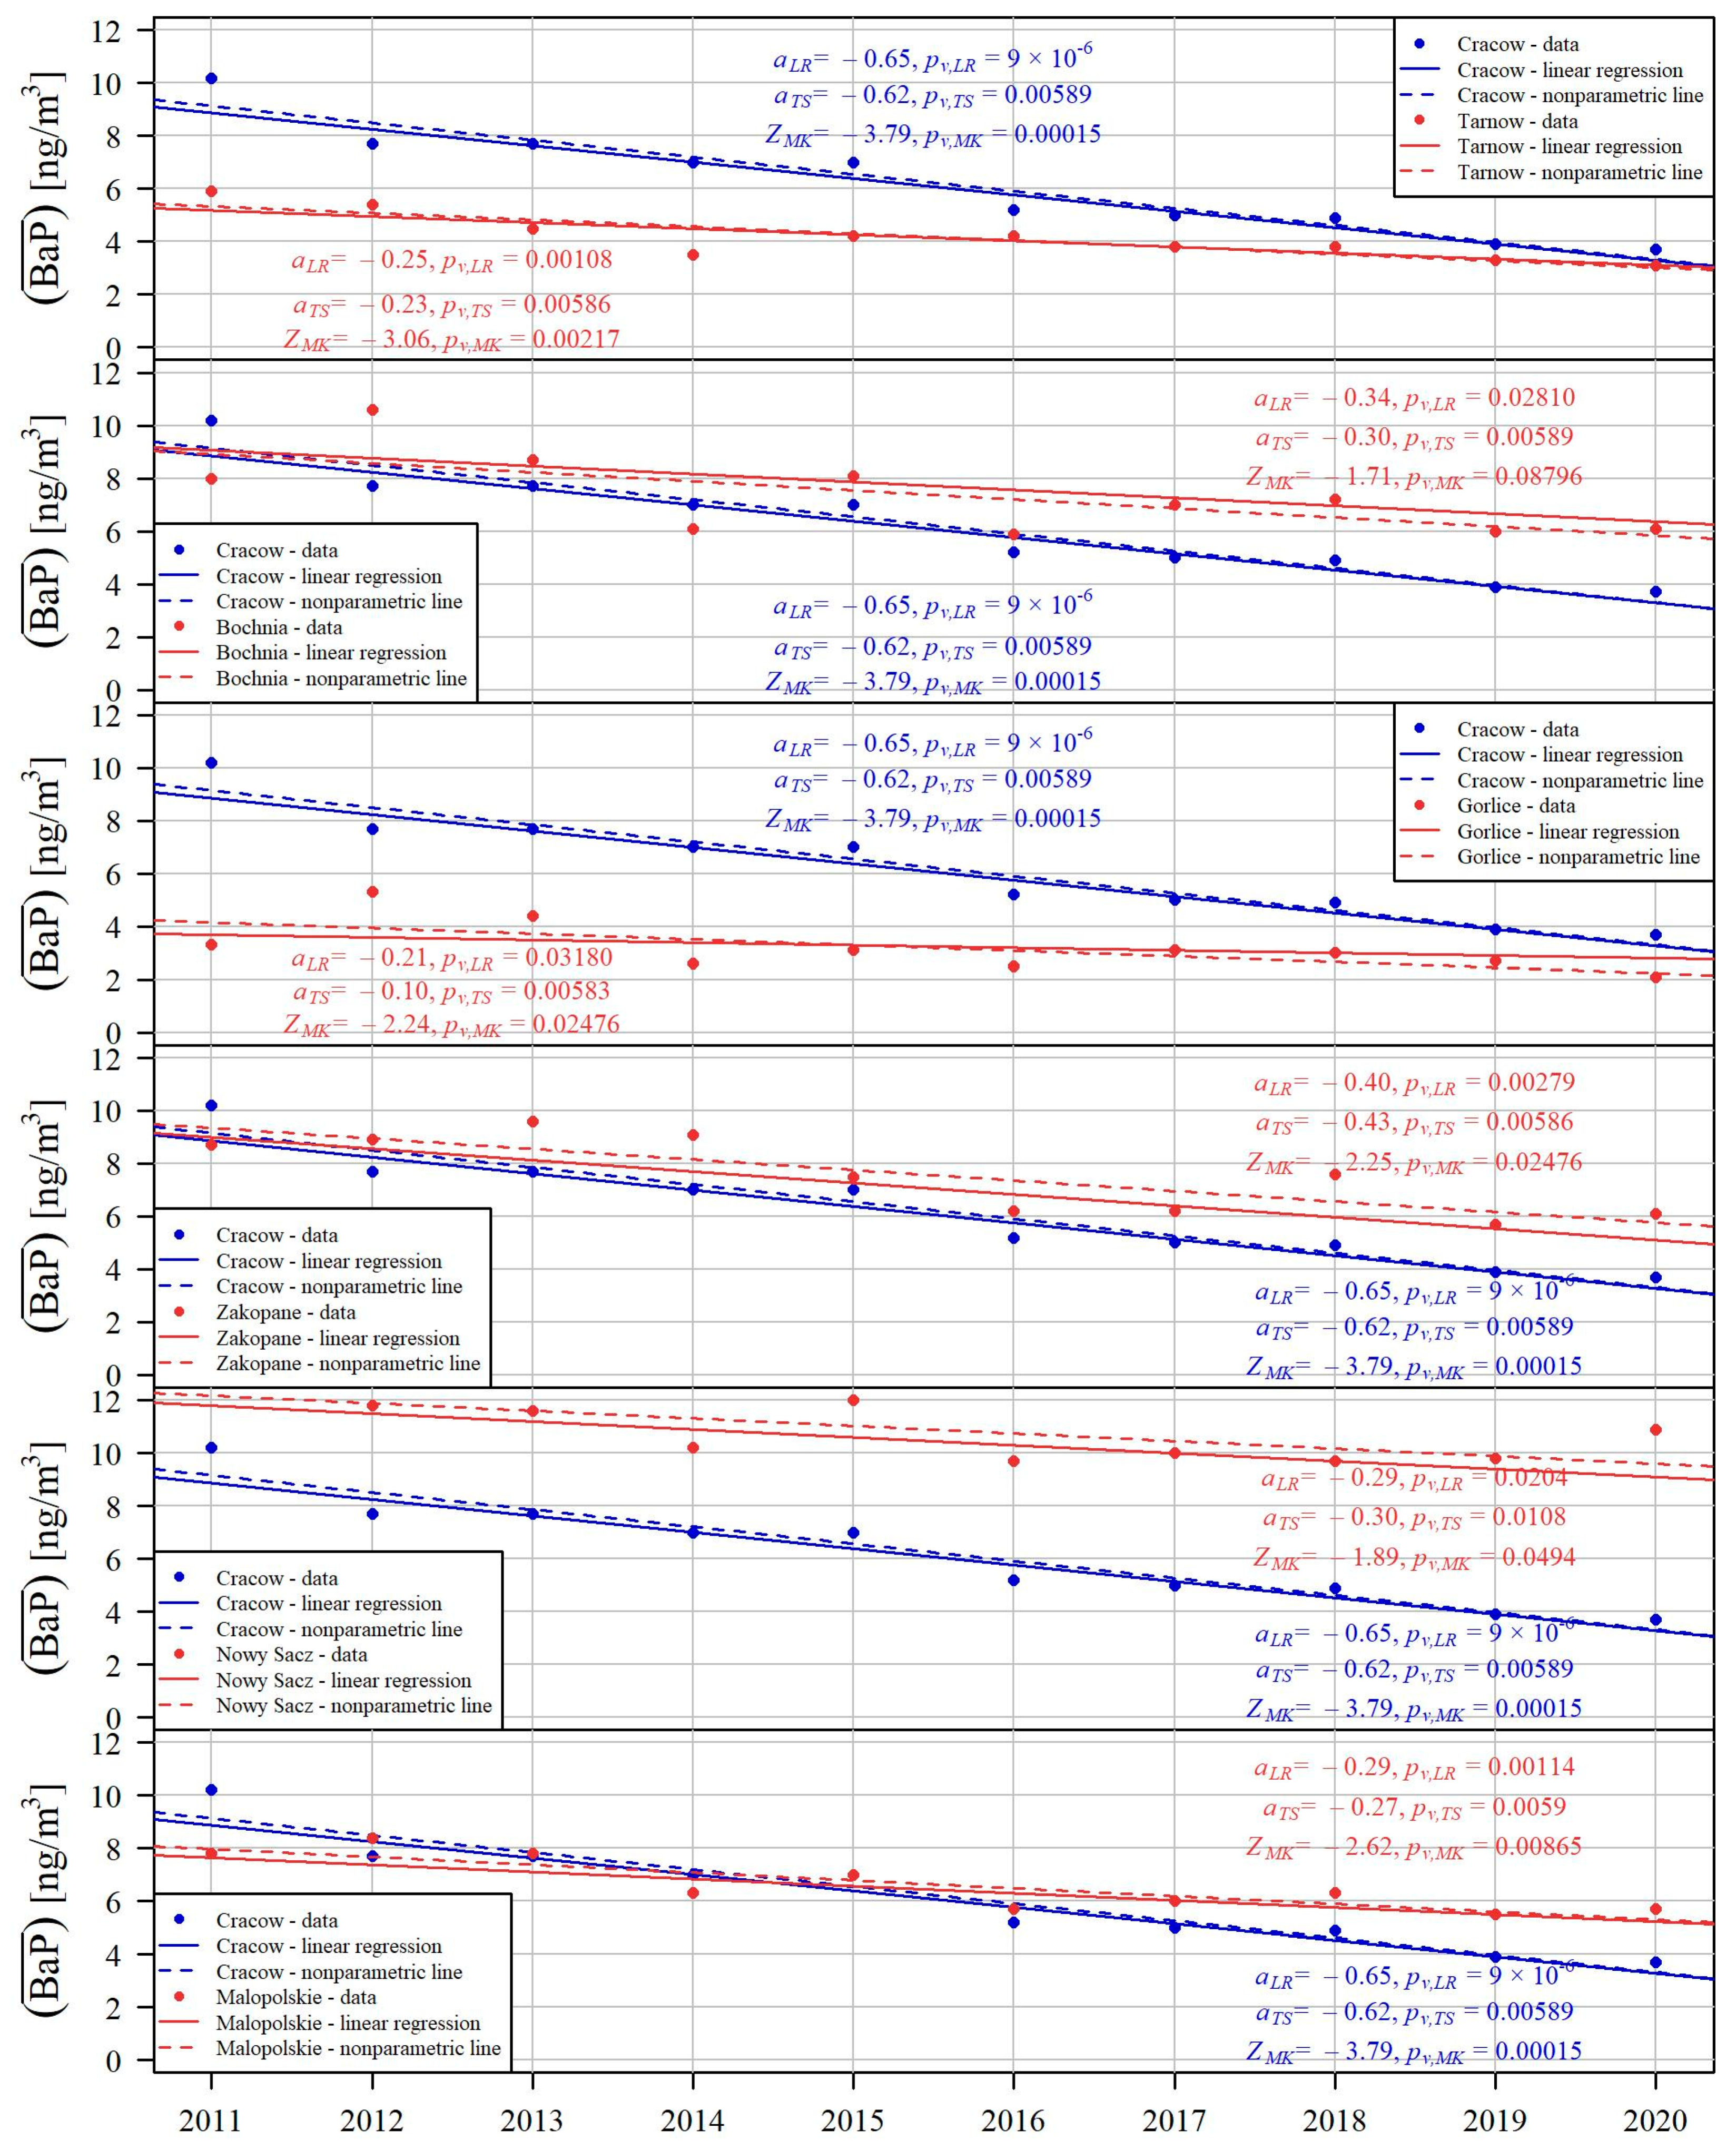
| Nr | City | All Year (BaP (PM10)) | Heating Season (BaPhs (PM10)) | ||||
|---|---|---|---|---|---|---|---|
| ZMK | Significance | aTS [ng/m3/year] | ZMK | Significance | aTS [ng/m3/year] | ||
| 1 | Cracow | −3.79 | ** | −0.62 | −3.58 | ** | −1.30 |
| 2 | Tarnow | −3.06 | ** | −0.23 | −2.68 | * | −0.51 |
| 3 | Bochnia | −1.71 | −0.30 | −2.15 | * | −0.59 | |
| 4 | Gorlice | −2.24 | * | −0.10 | −2.25 | * | −0.18 |
| 5 | Zakopane | −2.25 | * | −0.43 | −3.04 | ** | −1.05 |
| 6 | Nowy Sacz | 1.89 | * | −0.30 | −1.98 | * | −0.41 |
| 7 | Malopolskie Voivodeship | −2.62 | * | −0.27 | −2.86 | ** | −0.52 |
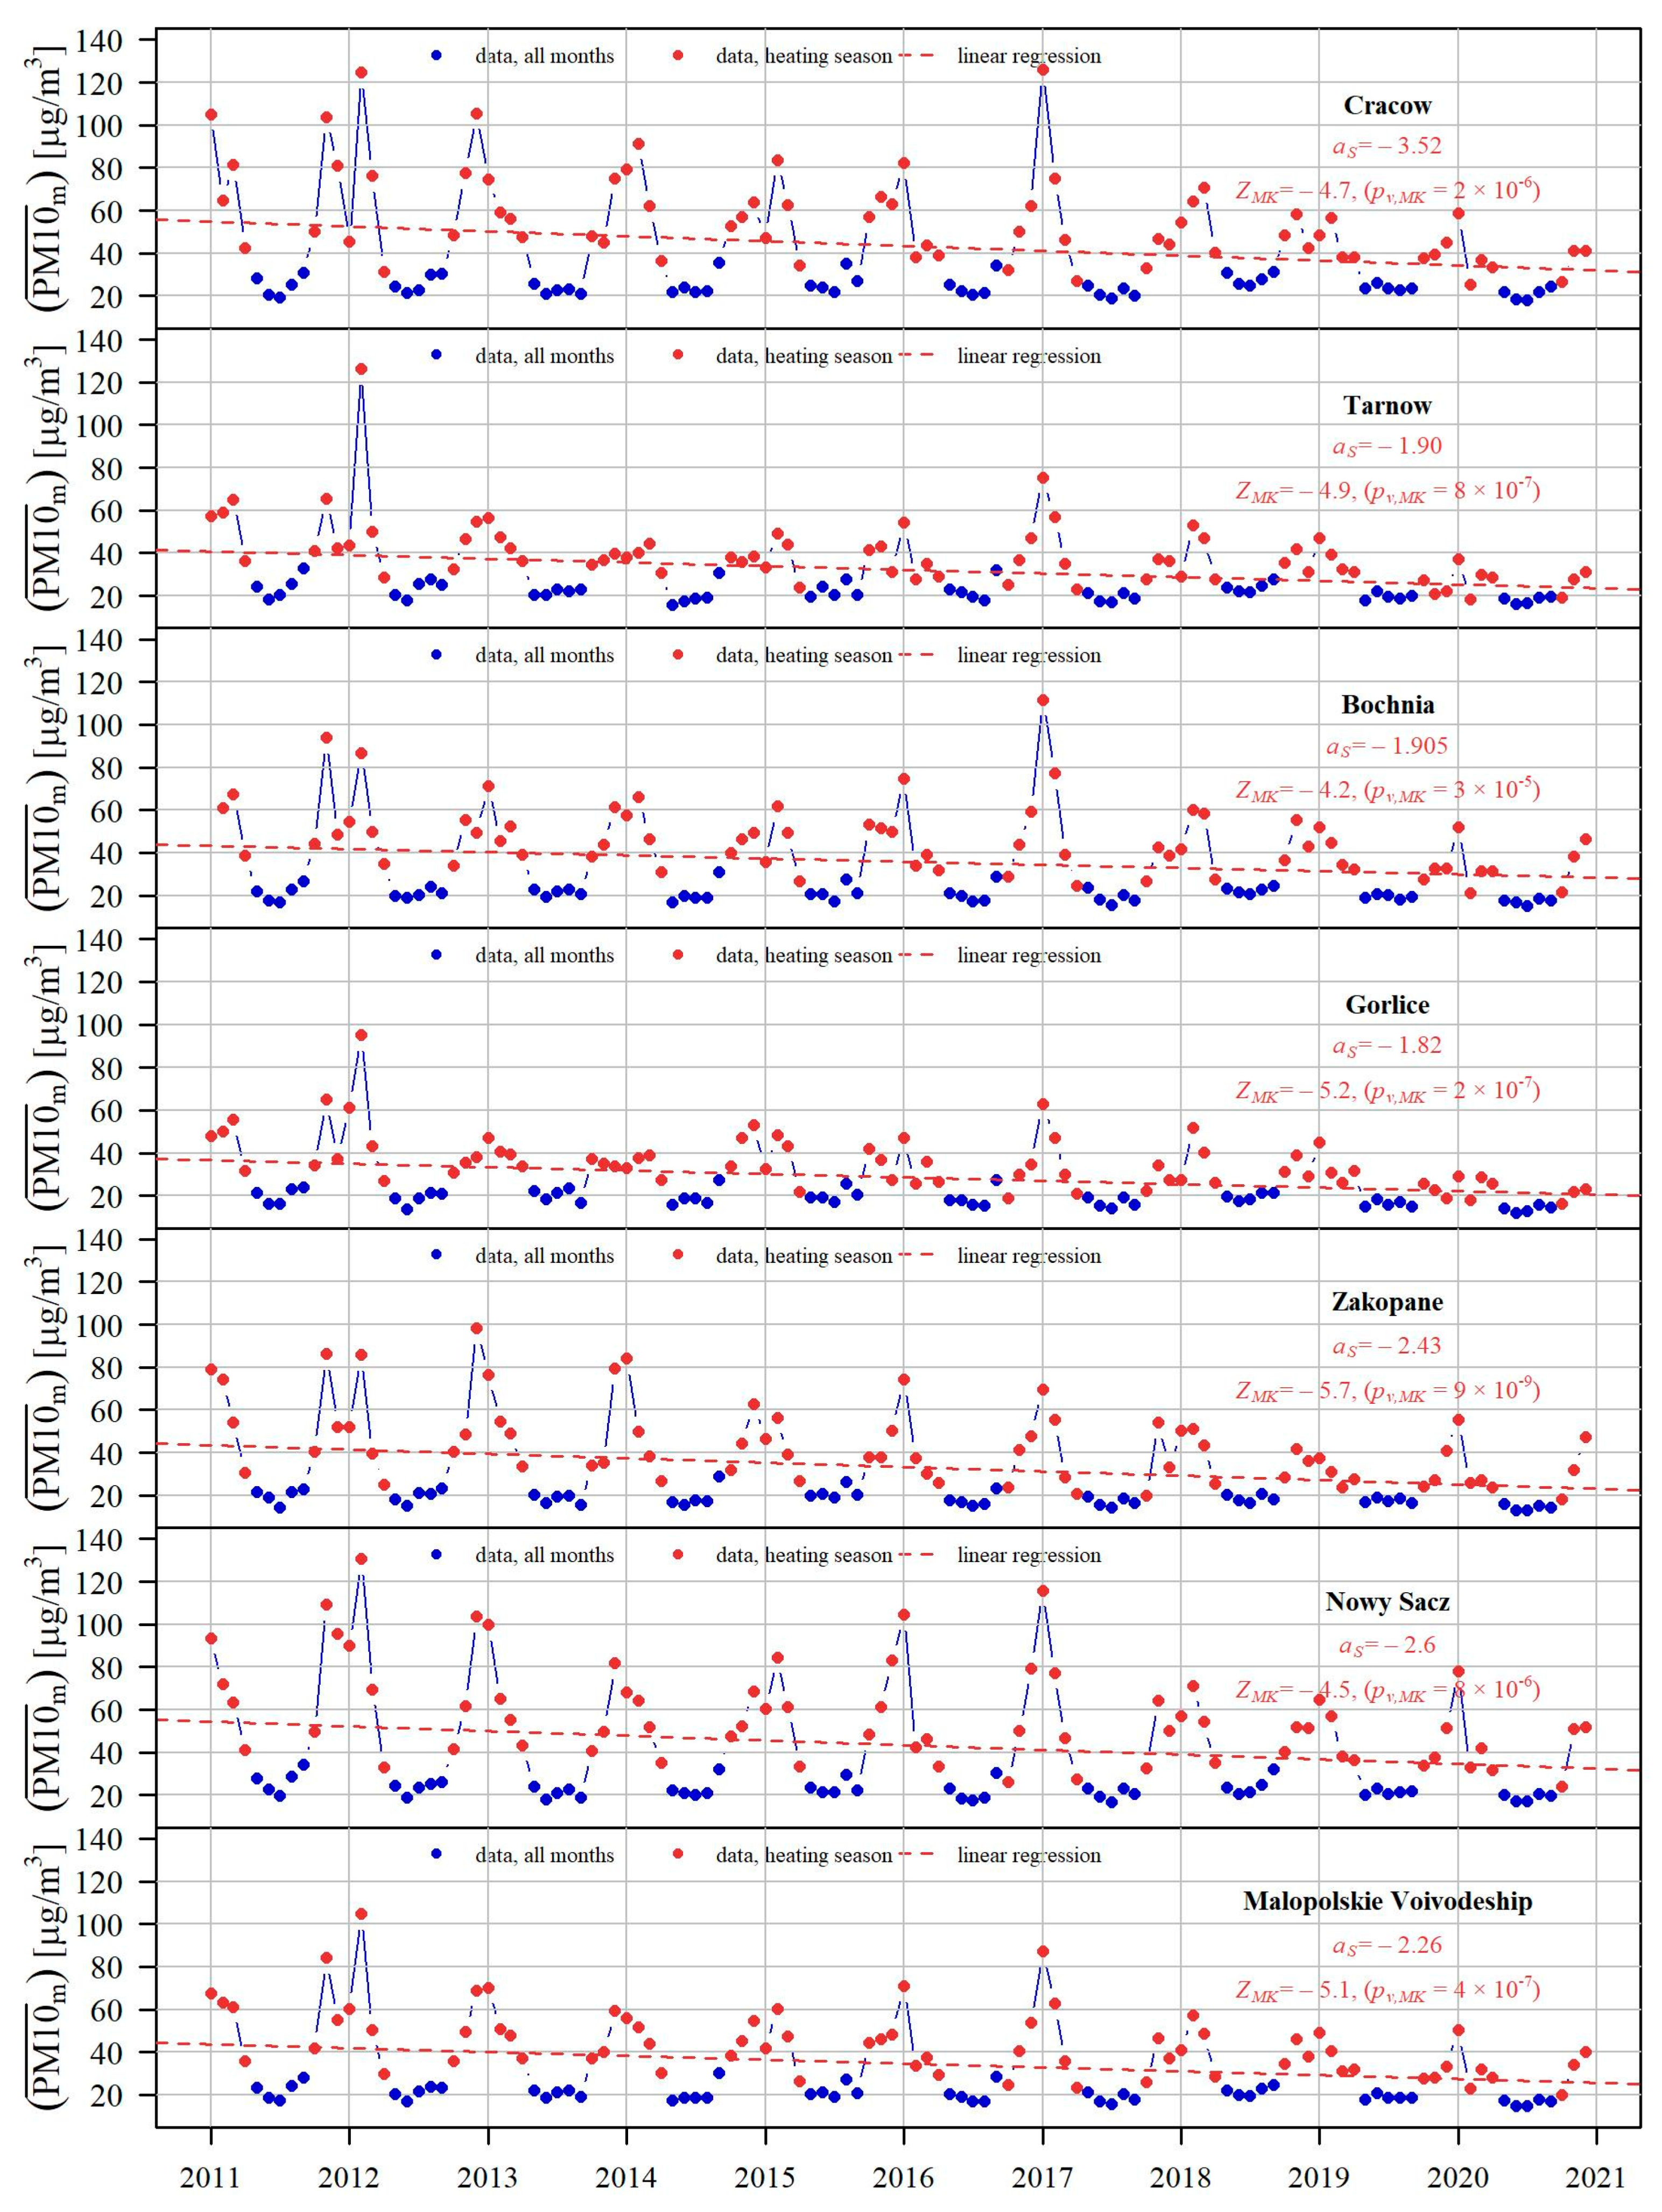
| Nr | City | PM10m | BaPm | ||||
|---|---|---|---|---|---|---|---|
| ZMK | Significance | aS [μg/m3/year] | ZMK | Significance | aS [ng/m3/year] | ||
| 1 | Cracow | −4.7 | ** | −3.52 | −5.6 | ** | −0.75 |
| 2 | Tarnow | −4.9 | ** | −1.90 | −3.6 | ** | −0.30 |
| 3 | Bochnia | −4.2 | ** | −1.91 | −2.6 | * | −0.36 |
| 4 | Gorlice | −5.2 | ** | −1.82 | −3.6 | ** | −0.25 |
| 5 | Zakopane | −5.7 | ** | −2.43 | −4.6 | ** | −0.50 |
| 6 | Nowy Sacz | −4.5 | ** | −2.60 | −1.2 | −0.18 | |
| 7 | Malopolskie Voivodeship | −5.1 | ** | −2.26 | −3.2 | ** | −0.28 |
Publisher’s Note: MDPI stays neutral with regard to jurisdictional claims in published maps and institutional affiliations. |
© 2021 by the authors. Licensee MDPI, Basel, Switzerland. This article is an open access article distributed under the terms and conditions of the Creative Commons Attribution (CC BY) license (https://creativecommons.org/licenses/by/4.0/).
Share and Cite
Flaga-Maryańczyk, A.; Baran-Gurgul, K. The Impact of Local Anti-Smog Resolution in Cracow (Poland) on the Concentrations of PM10 and BaP Based on the Results of Measurements of the State Environmental Monitoring. Energies 2022, 15, 56. https://doi.org/10.3390/en15010056
Flaga-Maryańczyk A, Baran-Gurgul K. The Impact of Local Anti-Smog Resolution in Cracow (Poland) on the Concentrations of PM10 and BaP Based on the Results of Measurements of the State Environmental Monitoring. Energies. 2022; 15(1):56. https://doi.org/10.3390/en15010056
Chicago/Turabian StyleFlaga-Maryańczyk, Agnieszka, and Katarzyna Baran-Gurgul. 2022. "The Impact of Local Anti-Smog Resolution in Cracow (Poland) on the Concentrations of PM10 and BaP Based on the Results of Measurements of the State Environmental Monitoring" Energies 15, no. 1: 56. https://doi.org/10.3390/en15010056
APA StyleFlaga-Maryańczyk, A., & Baran-Gurgul, K. (2022). The Impact of Local Anti-Smog Resolution in Cracow (Poland) on the Concentrations of PM10 and BaP Based on the Results of Measurements of the State Environmental Monitoring. Energies, 15(1), 56. https://doi.org/10.3390/en15010056