Article

The Impact of Alumina Nanofluids on Pool Boiling Performance on Biphilic Surfaces for Cooling Applications

by
Ricardo Santos
1,
Ana Sofia Moita
1,2,*,
Ana Paula C. Ribeiro
3,* and
António Luís N. Moreira
1
1
IN+—Center for Innovation, Technology and Policy Research, Instituto Superior Técnico, Universidade de Lisboa, Avenida Rovisco Pais, 1049-001 Lisboa, Portugal
2
CINAMIL—Centro de Investigação Desenvolvimento e Inovação da Academia Militar, Academia Militar, Instituto Universitário Militar, Rua Gomes Freire, 1169-203 Lisboa, Portugal
3
Centro de Química Estrutural, Instituto Superior Técnico, Universidade de Lisboa, Avenida Rovisco Pais, 1049-001 Lisboa, Portugal
*
Authors to whom correspondence should be addressed.
Energies 2022, 15(1), 372; https://doi.org/10.3390/en15010372
Submission received: 24 November 2021 / Revised: 24 December 2021 / Accepted: 1 January 2022 / Published: 5 January 2022
(This article belongs to the Special Issue Industrial Applications of Nanofluids in the Energy Sector)

Abstract

:
This work aims to study the impact of nanofluids with alumina particles on pool boiling performance. Unlike most studies, which use a trial-and-error approach to improve boiling performance parameters, this study details the possible effects of nanoparticles on the effective mechanisms of boiling and heat transfer. For this purpose, biphilic surfaces (hydrophilic surfaces with superhydrophobic spots) were used, which allow the individual analysis of bubbles. Surfaces with different configurations of superhydrophobic regions were used. The thermophysical properties of fluids only vary slightly with increasing nanoparticle concentration. The evolution of the dissipated heat flux and temperature profiles for a nucleation time frame is independent of the fluid and imposed heat flux. It can be concluded that the optimal concentration of nanoparticles is 3 wt%. Using this nanoparticle concentration leads to lower surface temperature values than those obtained with water, the reference fluid. This is due to the changes in the balance of forces in the triple line, induced by increased wettability as a consequence of the deposited particles. Wherefore, smaller and more frequent bubbles are formed, resulting in higher heat transfer coefficients. This effect, although relevant, is still of minor importance when compared to that of the use of biphilic surfaces.

1. Introduction

Technological development observed in the last decades has led to the constant search for new, improved, and more efficient mechanisms in many high technology industries, such as electronics, communication, and manufacturing. Increasing server rack density and chip density, new use cases such as harsh edge computing environments, and pressure to reduce energy consumption during data center cooling are expected to drive the cooling market [1].
However, the higher performance of the devised equipment raises the need for innovative cooling systems capable of dissipating the high heat fluxes associated. The cooling market is projected to grow from USD 243 million in 2021 to USD 700 million by 2026, at a CAGR of 23.6% from 2021 to 2026 [2].
At the same time, the global heat transfer fluids (HTFs) market size is expected to grow from USD 3.1 billion in 2020 to USD 4.9 billion by 2025, at a Compound Annual Growth Rate (CAGR) of 9.9%. This high growth is due to the increasing awareness regarding energy conservation and high demand in chemical, oil and gas, and renewable energy end-use industries [2].
The defense industry also has similar needs, but where the equipment is exposed to very harsh environmental conditions. This is particularly relevant in the portable electronic equipment and, for instance, in the use of drones, which has dramatically widened its range of application in several military operations, particularly since 2018 [3]. In this context, air-based cooling systems fail completely in meeting the required heat transfer rate inherent to more powerful and compact equipment. Hence, liquid coolants are more reasonable to be used [4].
Nevertheless, conventional heat transfer liquids like water, ethylene glycol, and engine oil still have poor thermophysical properties [5]. Hereupon researchers tried to enhance the thermal conductivity of these coolants by suspending solid particles in the fluid [6,7,8].
As it is well known, solid particles, such as metals, have high thermal conductivity, and therefore, liquids containing them are expected to present better thermal properties. Numerous theoretical and experimental studies have been conducted with micro and larger-sized particles since Maxwell’s work, more than one hundred years ago [9]. However, such large particles do not have an interest in practical applications due to problems like sedimentation, erosion, fouling, and increased pressure drop [10]. Modern technology provided the tools to produce nanometric scale particles, which are suspended in a base fluid, constitute a nanofluid, as it was first named by Choi [11]. This new type of fluid reduces the problems associated with common slurries and presents enhanced thermophysical properties compared to common coolants [12]. However, problems related to the accurate characterization of nanofluid properties, their stability, and the reproducibility of the thermophysical properties depending on the preparation method gave rise to a number of critical reviews on the use of nanofluids, e.g., Khan and Ali [13], Kamel and Lezsovits [14], Ciloglu and Bolukbasi [15], and Murshed et al. [16], particularly for pool boiling applications.
In fact, the use of liquid phase change has been intensively explored for cooling applications to take advantage of the latent heat of evaporation. Despite the aforementioned problems when using nanofluids, most that most pool boiling studies have focused on heat transfer enhancement strategies based on surface modification (topography) [16]. Several authors have already explored the use of nanofluids in pool boiling applications [17]. However, in light of the literature analyzed, it is still not clear how nanofluids affect pool boiling most important parameters, such as the critical heat flux (CHF) and the boiling heat transfer coefficient (BHTC). You et al. [18] reported three times to increase in CHF using alumina (Al2O3)/water nanofluid with no apparent change in BHTC. Additionally, Tu et al. [19] reported an improvement of 64% in BHTC, and Wen and Ding [20] 40% enhancement for 1.25 wt%, both using Al2O3/water nanofluids. On the other hand, Das et al. [21] observed deterioration in boiling performance using the same fluid. This type of inconsistency appears quite often throughout the literature. Thus, it is imperative to conduct more research on pool boiling, where several factors, properly specified, must be considered and fully characterized.
Despite these contradictory results, it is possible to establish some conclusions:
  • Pool boiling performance is affected by nanofluids thermophysical properties, and therefore by its size, concentration, and type of particles used;
  • During the nanofluids boiling process, there is a continuous accumulation of particles in the surface, depending on concentration and boiling time;
  • The enhancement or deterioration of boiling heat transfer is dependent on the surface particle interaction. Factors like surface topography, wettability, and capillary wicking play an important role in this matter;
  • The use of additives, like surfactants, stabilizes the fluid and, depending on its concentration, can increase boiling heat flux;
  • Almost all researchers state that nanofluids increase CHF. However, the same does not happen with the BHTC. Results show that this parameter can be deteriorated, increased, or remain unchanged with the use of nanofluids.
In this context, the present paper addresses a critical perspective on the use of alumina nanofluids in pool boiling performance for cooling applications. Special emphasis is given to the effect that nanoparticles deposition plays on wettability, and how it can contribute to the improvement or deterioration of heat transfer processes. Alumina was selected as it is an inexpensive nanofluid, stable, and easy to prepare, so it is appropriate for industrial applications. On the other hand, the use of alumina nanofluids is widely reported in the literature, thus enabling more critical analysis of the results. Finally, the use of alumina nanofluids is combined with the use of biphilic surfaces, which is still scarcely reported in the literature. The results obtained here may complement our previous studies on biphilic surfaces [22] in which single superhydrophobic regions on a hydrophilic surface were tested in pool boiling conditions.

2. Materials and Methods

2.1. Materials and Methods

The scheme in Figure 1 identifies the main components of the experimental arrangement. The main component of the experimental setup is the boiling chamber (index 1 of Figure 1), where the experiments are conducted.
The boiling chamber is filled through a funnel (index 2), with a tube and a valve connecting them. Subsequently, the fluid is degassed and heated by means of two resistances, namely a coil and a cartridge heater. The experiments are performed under controlled temperature and pressure conditions, always being monitored. To assure that the temperature is held constant, a proportional integral derivative (PID) controller is connected both to a type K thermocouple and the cartridge heater, turning off the resistance when a defined value is reached. An open system, with the vapor formed during boiling, flowing through a tube into a recipient, where it condensates (index 3), maintains the boiling tank at atmospheric pressure. A pressure sensor (OMEGA DYNE, Inc., Sunbury, Ohio) at the top of the tank and a type K thermocouple near the surface are connected to data acquisition equipment (DAQ), transmitting the information to a computer (index 4). In the base of the tank, it is located the test surface, a stainless-steel sheet (AISI304), where the nucleation phenomena take place (index 5). The surface is heated by the Joule effect, applying direct current supplied by an HP 6274B DC power supply (index 6). The boiling process is captured using two different cameras: a Phantom v4.2 high-speed camera (index 7), allocated next to and facing a window of the tank; and an Onca MWIR-InSb-320 (Xenics) infrared (IR) camera placed under it (index 8). The boiling chamber is illuminated by a LED backlight (index 9). Both cameras are connected to the same computer (index 10), where the images can be visualized in real-time and saved for subsequent analysis.

2.2. Surface Preparation

The test surfaces were mainly stainless-steel thin foils (20 μm thick) to which superhydrophobic patterns (1.5 mm diameter spots) were applied. The surfaces were prepared following the procedure described below:
  • A stainless-steel sheet (AISI304) was cut with well-defined dimensions (50 × 38 mm);
  • Two small steel blocks, properly sanded and cleaned, were welded to the ends of two copper wires;
  • The blocks were welded to the steel sheet ends;
  • A thin layer of high-temperature silicone was poured on the thermal glass, where the test surface previously cleaned with acetone was glued. The surface was properly pressed against the glass to remove possible air pockets. The silicone was allowed to dry and cure for twelve hours;
  • The free ends of the copper wires were fixed to a female electrical connector, isolated from the base of the reservoir with ceramic washers;
  • Kapton insulating tape was glued at the end of the stainless-steel sheet to preclude the occurrence of boiling in undesired places;
  • A metal sheet with the patterns to form the superhydrophobic regions (wholes done by laser) were used to serve as stencil;
  • Three layers of the superhydrophobic coating were applied at 30 min intervals. After the last layer, the surface is allowed to dry and cure for 12 h;
  • The stencil is then removed, revealing the superhydrophobic patterns. Excessive spray and other impurities are cleaned using acetone and distilled water.

2.3. Nanofluids Preparation

The working fluids used in this work were water and Al2O3/water nanofluids with different concentration values (0.05 wt%, 0.5 wt%, 1 wt%, 1.5 wt%, 2 wt%, 2.5 wt%, and 3 wt%). The alumina nanoparticles have diameters between 40 and 50 nm. The nanofluids produced had a white color and were opaque, which disables the use of the high-speed camera for the largest nanoparticles concentrations. Given that all nanofluids used were of the same type (alumina/water mixtures), for simplicity, they will only be referred by their concentration in weight percentage.
The nanofluids were prepared using the two-step method [23]. As the concentration values used are expressed in weight percentage, the first two steps were to weigh both nanoparticles and water needed to achieve the desired concentration. For this purpose, the UWE HGS-1500 scale was used to weigh the distilled water, and a more precise balance (KERN ABJ-NM/ABS-N) was used to weight the nanoparticles. Then, water and nanoparticles are mixed in a recipient and are well manually stirred. The third step is additional stirring, using a magnetic stirrer (Rotilabo MH-15), working at 1100 rpm for 15 min. Once the stirring was completed, the fluid was homogenized and was ready for the final step, the ultrasonication. The ultrasonic probe of the sonicator (Hielscher UPT200Ht) was inserted into the fluid recipient and left to operate at 60% amplitude for 90 min. To find the optimum amplitude and sonication time, several sedimentation tests were performed. Nanofluids exhibited good stability due to the sonication performed and confirmed by UV spectroscopy showing, therefore, that they were in the correct condition to perform the experiment.

2.4. Surface and Fluids Characterization

Once the surface and the working fluid had been prepared, it was important to characterize the fluid surface tension and the interaction between the fluid and the surface (wettability). This characterization was performed before and after the boiling test so that it could be assessed whether the experiment influences these properties and to assure that wetting properties of the surface remain similar at the beginning of every experiment. Both parameters were measured using an optical tensiometer (THETA from Attension).
In order to define surface wettability, the static contact angle (θ) was measured on the hydrophilic region, and this same angle, as well as the quasi-static advancing (θa) and receding (θr) angles, and hysteresis (Δθ) were measured for the superhydrophobic regions. To measure the contact angle, using the sessile drop method [24], droplets with 1.5 μL volume were placed on the surfaces, and a video with 10 s at 12 fps was recorded. Then, the frames were analyzed with the OneAttension software, which uses a drop detection algorithm based on the Young–Laplace equation [25]. The final angle value for the hydrophilic and superhydrophobic regions was an average of 3 to 4 measurements distributed within the area of interest, to be representative of each area [25].
Regarding the quasi-static angles, the process was similar, with the exception that after the droplet is placed on the surface, additional fluid was inflated or deflated at a very low flow rate (0.5 μL/s and 1 μL/s, respectively). The value of the quasi-static advancing and receding angles are given by the first frame where the triple line between the droplet and the surface advances or recedes, respectively. The difference between these two angles is the hysteresis. The fluids’ surface tension (σ) was measured using the same principles used for wettability; however, instead of placing the droplet on the surface, this was left suspended at the tip of the needle. The surface tension was calculated according to the droplet weight, using a balance of forces. The effective density ( ρ e f f ), specific heat ( C p , eff), viscosity ( μ e f f ), and thermal conductivity ( k e f f ), were calculated using Equations (1)–(4), respectively. So, the density of the nanofluids was estimated based on the physical principle of the mixture rule [26]. The specific heat was calculated using the same principle used for density and assuming thermal equilibrium between the nanoparticles and the basefluid phase [26]. Effective dynamic viscosity was evaluated from Einstein’s model [27], and the thermal conductivity was determined using Maxwell’s model [9]. Water and alumina properties were taken from Incropera et al. [28]. In these equations, ρ stands for density, V represents volume and ϕ p = V p V f + V p . The subscripts f and p refer to the basefluid and nanoparticles, respectively.
ρ e f f = ( m V ) e f f = m f + m p V f + V p = ρ f V f + ρ p V p V f + V p = ( 1 ϕ p ) ρ f + ϕ p ρ p
( ρ C p ) e f f = ρ e f f ( Q m T ) = ρ e f f ( m C p ) f T + ( m C p ) p T ( m f + m p ) T     C p , e f f = ( 1 ϕ p ) ( ρ C p ) f + ϕ p ( ρ C p ) p ( 1 ϕ p ) ρ f + ϕ p ρ p
μ e f f = ( 1 + 2.5 ϕ p ) μ f
k e f f = k f k p + 2 k f + 2 ϕ p ( k p k f ) k p + 2 k f ϕ p ( k p k f )
Table 1 summarizes the main thermophysical properties of the working fluids used in the present work as determined from the aforementioned equations.

2.5. Pool Boiling Experiments

Heat flux was imposed by the Joule effect on the heating surface. Several current intensities were used during the experiments, so one could evaluate the boiling performance for different imposed heat fluxes. The resistance ( R ) of the stainless-steel sheet is given by the following equation [29]:
R = ρ L w z = 0.05 Ω
where the sheet resistivity is ρ = 76 × 10 8   Ω · m , its length L = 0.05   m , width w = 0.038   m , and thickness z = 20 × 10 6   m . The power supplied ( P ) is given by the product of the resistance of the sheet by the second power of the current intensity ( I ):
P = R × I 2
Using the simple equation that defines the heat flux, power over surface area ( A s ), is now possible to relate the imposed heat flux ( q ) with current, and sheet properties, as follows:
q = P A s = R × I 2 A s
The different current intensities and respective power and heat fluxes are depicted in Table 2.
As aforementioned, a high-speed video and a high-speed thermal camera were synchronized to collect data during the boiling experiment. The frame rate of both cameras was set to 1300 fps. The resolution of the video camera was 45 micron/pixel, while the resolution of the thermographic camera was 127 micron/pixels. Nevertheless, the high-speed camera could not be used with the nanofluids with higher concentrations since they were opaque, and consequently, it was impossible to observe nucleations using this camera. Therefore, it was only be used for setup validation purposes, as well as to establish a parallelism between bubble detachment and thermographic data.
Bubble dynamics and thermal images were treated using an in-house routine developed in MATLAB, as in [22,30].

2.6. Uncertainty Analysis

The uncertainties associated with the different equipment used are given in Table 3.
The uncertainty in bubble diameter estimation relies mainly on two parameters: the conversion factor from pixels to millimeters ( C f ) and the associated error ( C f ), and the error in detecting bubble boundary ( e b b ) [30]. The first is obtained with a millimetric scale and was estimated as ± 5%. The second depends on the threshold chosen in the image processing routine, which was of the order of ± 2 pixels for less defined bubble boundaries. Then, the uncertainty associated with the bubble diameter can be calculated as:
e ( d ) = d d = ( C f C f ) 2 + ( 2 e b b d C f ) 2
Another error appears when it is defined the tangent line to the bubble, to calculate the contact angle. The worst-case comes when, after two pixels are counted horizontally, the line has a vertical offset of one pixel. This situation leads to an absolute error of 11.31° [30].
Regarding thermographic analysis, there are essentially two major sources of uncertainty: the type K thermocouple, which measures the temperature at which the background video is recorded, and the ADU scale reading and subsequent conversion to temperatures. The error associated with the thermocouple ( T t ) is ± 0.5 °C. The error in converting the ADU scale to temperatures ( T c ) is ± 0.5 °C. Hence, the uncertainty inherent in calculating temperatures can be estimated by:
e ( T ) = T T = ( T t T ) 2 + ( T c T ) 2
The maximum error obtained is e ( T ) = 0.707%, leading to uncertainty of ± 0.707 °C.

3. Results and Discussion

The present section is divided into three main subsections. Hence, the first subsection will discuss the alumina nanofluid properties and how they are affected by the concentration of the nanoparticles. Emphasis is given to the effect of nanoparticles deposition on wettability. The second section discusses the overall effect of the nanofluids on the pool boiling performance. Boiling processes are studied on a hydrophilic stainless-steel surface with a 1.5 mm circular superhydrophobic region. This surface configuration was chosen as previous work [22] showed significantly improved control on the basic nucleation phenomena, isolating influencing parameters and being able to focus on the impact of the nanoparticles’ concentration. Once this effect is well defined, the final section will discuss the combination of both effects (surface modification, using the biphilic pattern suggested in [17] with the nanofluids.

3.1. Thermophysical Properties of the Alumina Nanofluids

The effective density ( ρ e f f ), specific heat ( C p , e f f ), viscosity ( μ e f f ), and thermal conductivity ( k e f f ), were calculated using Equations (1)–(4). The results are depicted in Table 4.
Looking at the table, it can be noticed that the largest variations, relative to water, occur for the nanofluid with the highest nanoparticle concentration. Density, viscosity, and thermal conductivity increased with nanoparticle concentration increment, while the specific heat decreased. However, the differences were quite small, and even for the highest nanoparticle concentration, they were only around 2%.
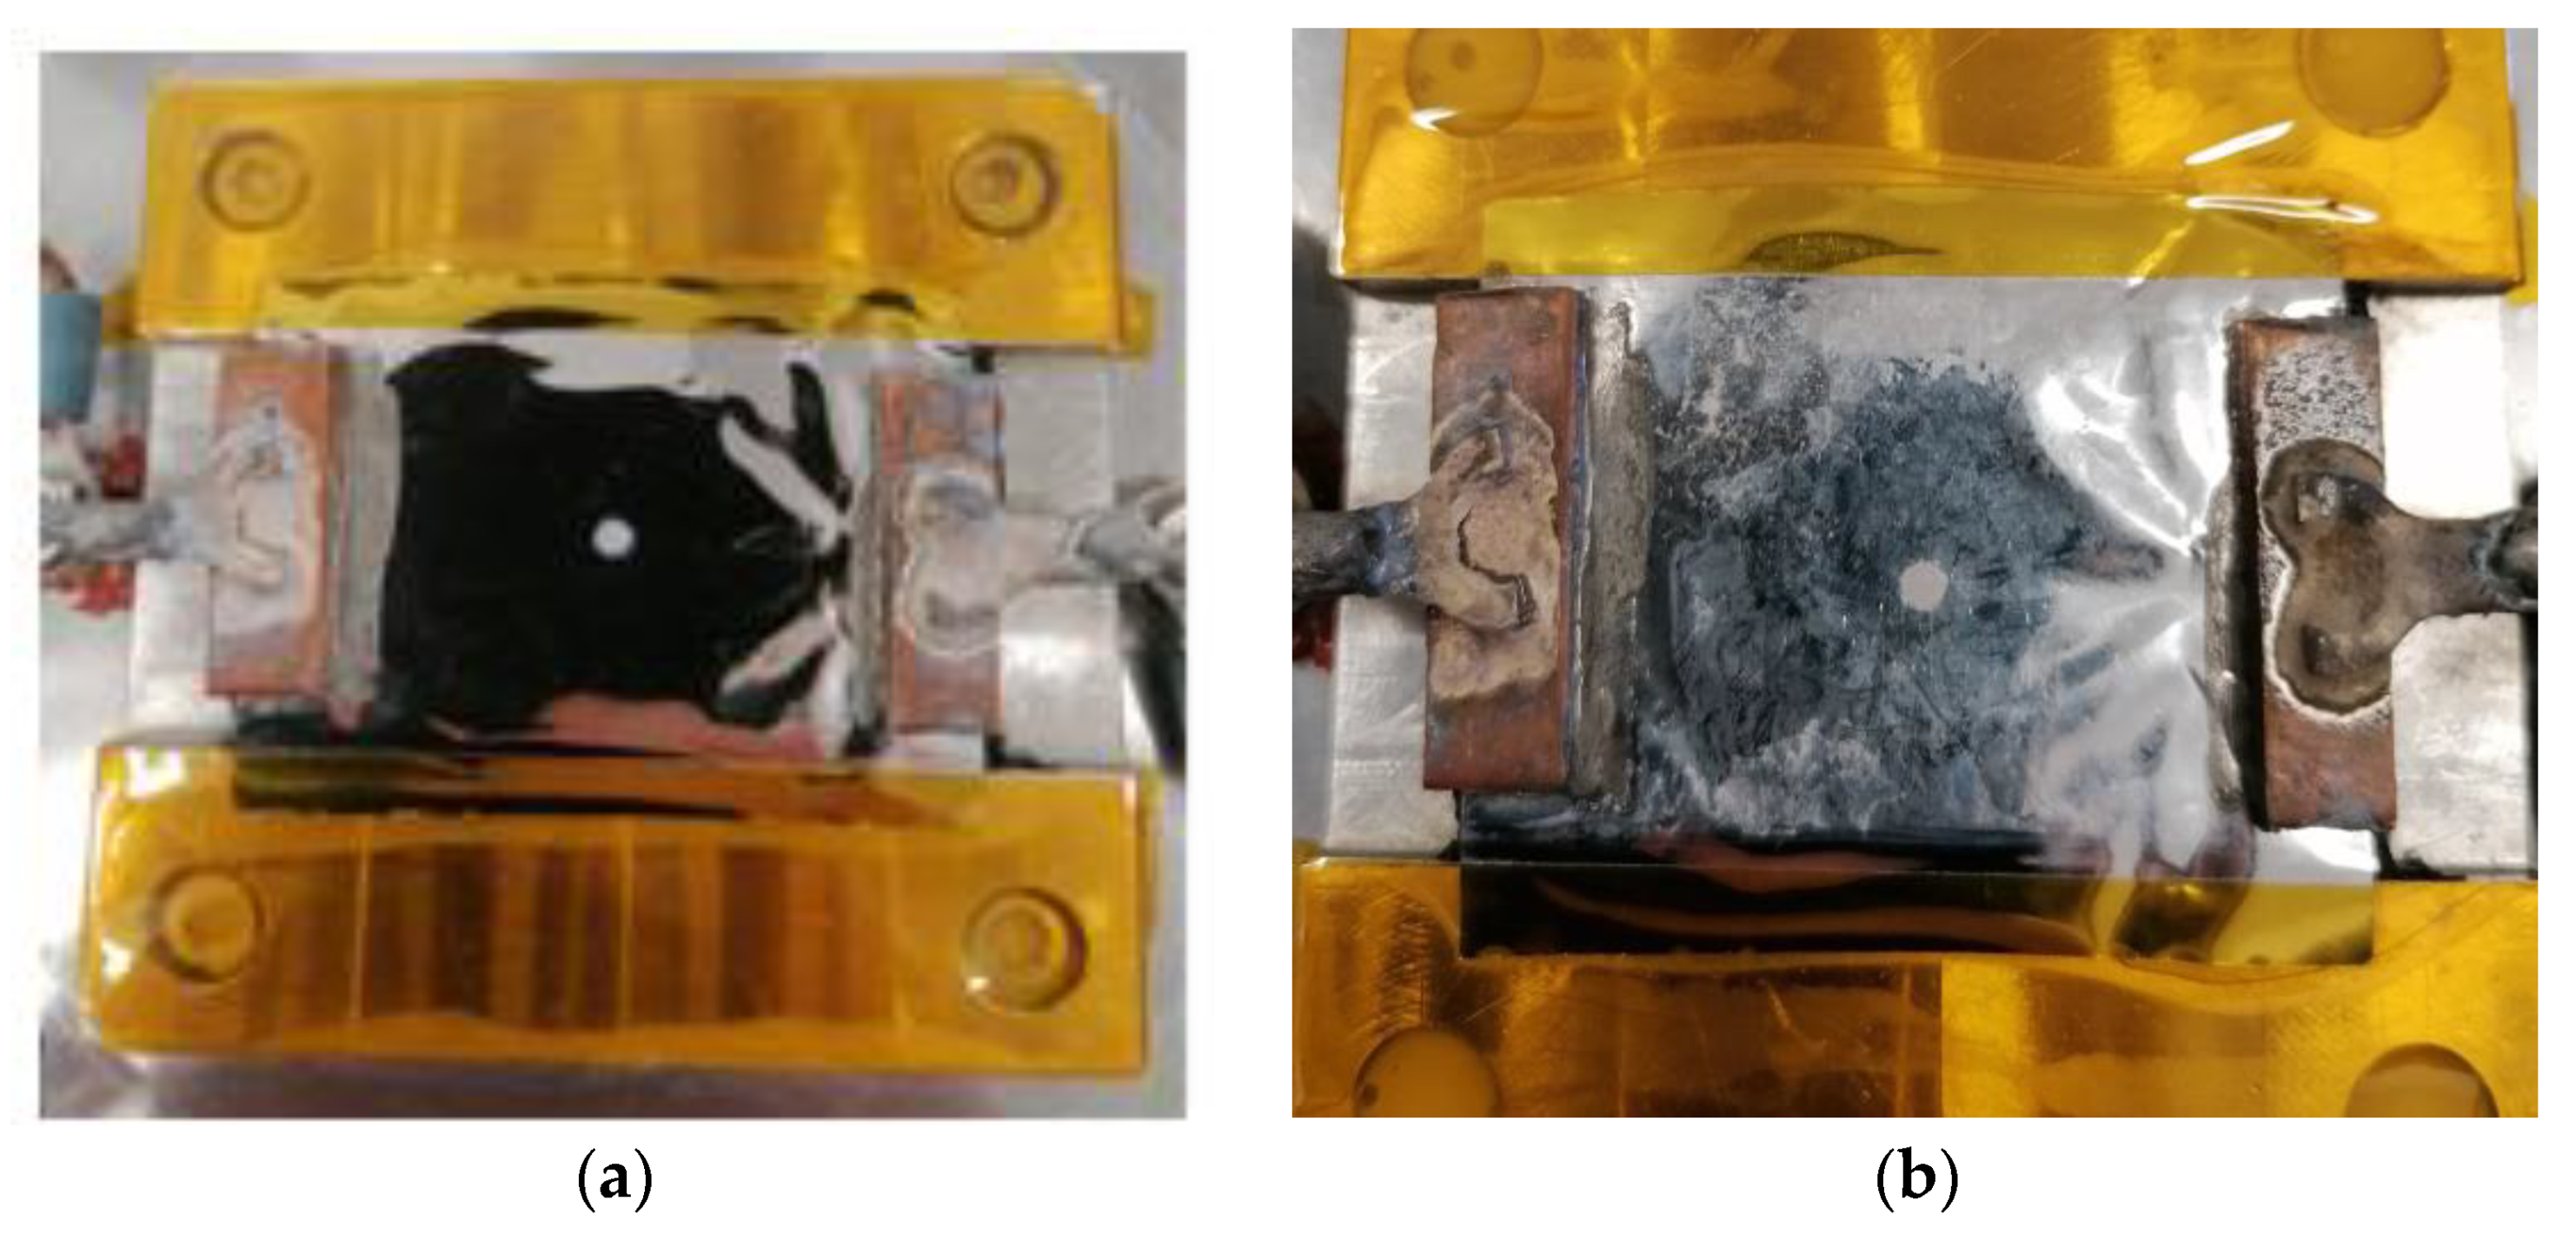
During the experimental test, particles got deposited in several parts of the tank. In particular, tank walls, heat resistance, and most of all, the tank base, which was included in the test surface. The deposition of nanoparticles will lead to a decrease in concentration, so the percentage increase that was previously estimated will actually be much lower due to this phenomenon. In fact, nanoparticle deposition will change not only the concentration but even more relevant aspects, which are the surface-related parameters, including wettability. The modification of surface appearance is visible after the experimental test, as shown in Figure 2.
Table 5 depicts the mean surface tension values, measured before and after the experimental tests, for all working fluids.
Analyzing the values in the table it is not possible to establish a relation between nanoparticle concentration and surface tension variation. Additionally, the differences were small, and there were errors associated with the measurement, easily noticed by the standard deviation (SD) values. Such discrepancy was reported for the same nanofluid, due to different nanoparticle concentrations in each measure, especially after the experiment, in which the fluid loses some stability. Furthermore, according to the literature, the surface tension is much more susceptible to change with temperature rather than nanoparticle concentration. Hence, one can conclude that the surface tension is not significantly altered by nanoparticle concentration. This is in agreement with previous works, e.g., Malý et al. [31].
The measured contact angles for both the hydrophilic and superhydrophobic regions before the experimental test are summarized in Table 6.
The contact angle for the hydrophilic region varies between 60° and 90°, which is expected for this type of surface. There was no apparent relation between the concentration of the nanoparticles and the variation of the contact angle. Nevertheless, higher contact angles were obtained when using nanofluids, which indicates that the existence of nanoparticles constitutes an obstacle for liquid spreading over the surface. Notwithstanding, all fluids exhibited a large SD, which indicated that the contact angle varied a lot, depending on the spot where it was measured. This is a known factor due to hysteresis [25].
Regarding the static contact angle for the superhydrophobic regions, it can be noticed that all fluids had values above 150° and hysteresis less than 10°; therefore, these regions were indeed superhydrophobic. The static and quasi-static angles were comprised between 155° and 161°; hence, the use of nanofluids does not affect these contact angles.
The measured nanofluid contact angles, for both hydrophilic and superhydrophobic regions, after the experimental test are shown in Table 7.
Comparing with the values measured before the experiment, it can be seen that the values of the superhydrophobic contact angle remained practically unchanged. There was only a small decrease as a result of the deterioration of the spot throughout the experiment. On the other hand, the values of the hydrophilic contact angle decrease substantially. After the test, the contact angle was comprised between 30° and 60°. On average, there was a 30° decrement as a result of the nanoparticles deposited during the experiment, which formed a porous layer above the surface that promotes liquid spreading. This reduction is in accordance with the literature [22], and as described before, surfaces with higher wettability promote bubble detachment, as the balance of forces in the triple line is altered.

3.2. Thermophysical Properties of the Alumina Nanofluids

The lack of synchronization between the high-speed camera and the infrared camera, due to nanofluids opacity, observed for higher nanoparticles concentrations, makes it impossible to distinguish and individualize each nucleation. However, this problem can be overcome by establishing a relation between bubble formation and thermographic parameters, such as the dissipated heat flux and the mean surface temperature for a certain area. It is worth reminding that, for this part of the investigation, the surface in the study is a stainless-steel surface with a 1.5 mm circular superhydrophobic region. To do this, an experiment was conducted using water, with both cameras synchronized. Then, the dissipated heat flux and the mean surface temperature were determined for a circular area with twice the diameter of the superhydrophobic spot.
The temporal evolution of the dissipated heat flux and mean surface temperature for one video recorded with an imposed heat flux of 1290 W/m2 is depicted in Figure 3. The plots also include the instant when a bubble detaches from the surface, and consequently, a new nucleation beginning (red lines).
Looking at Figure 3, both dissipated heat flux and mean surface temperature exhibited a cyclical variation, marked by bubble detachment; that is, each nucleation presented a similar behavior throughout the stages of bubble formation. It is important to notice that these parameters show completely opposite behaviors. This trend observed was also observed for the experiments with nanofluids.
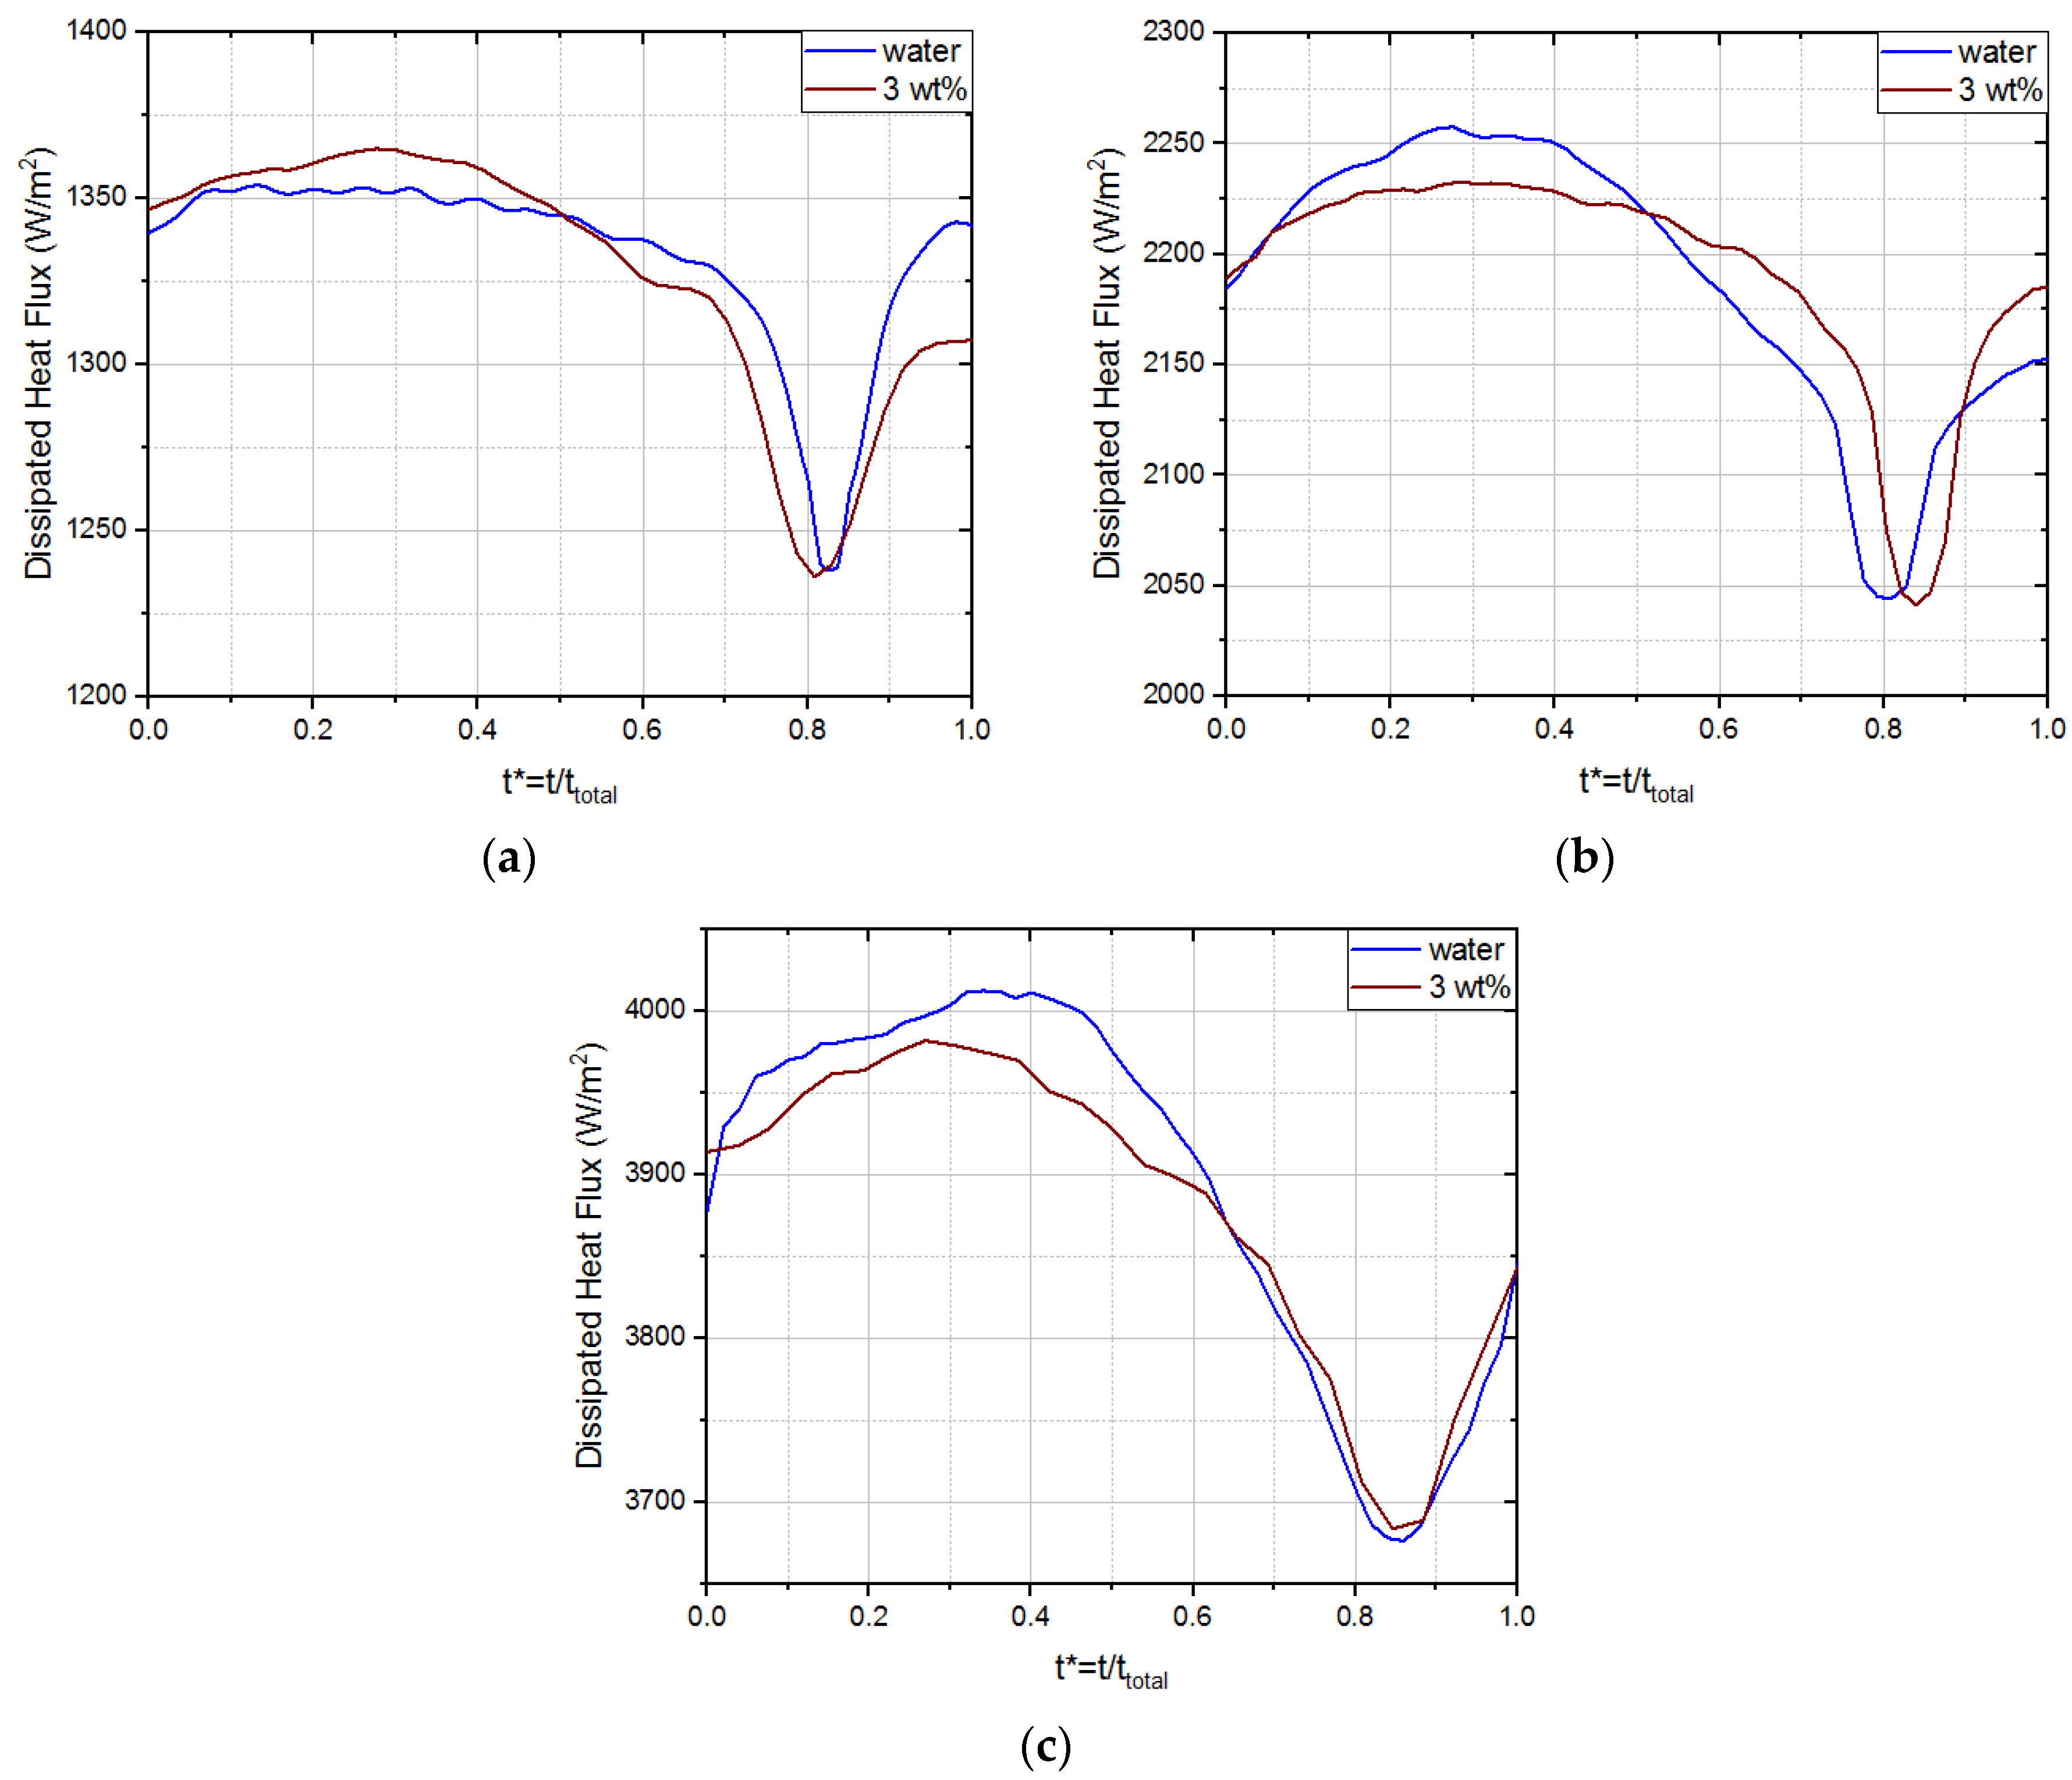
In order to analyze the heat transfer promoted by the formation of bubbles in the superhydrophobic region, the dissipated heat flux was evaluated for a nucleation time frame for different imposed fluxes. The obtained results for water and the nanofluid with the maximum concentration, as a function of dimensionless time, are shown in Figure 4. Examining the three graphs, it can be concluded that the dissipated heat flux curve was not altered when using nanofluids.
The results suggest that the behavior of the dissipated heat flux curve was independent of the imposed current intensity and the working fluid. The dissipated heat flux increased in the early stages of bubble nucleation, promoted by previously bubble detachment, as a result of fresh liquid renewal near the superhydrophobic region. A maximum value was reached somewhere between the hemisphere formation phase and the beginning of vertical elongation (for a non-dimensional time of t* = 0.1 and t* = 0.4, where t*/ttotal, being t the time instant of the frame in analysis, counting from the instant when bubble nucleation starts, and the total time that the bubble takes to form and detach from the surface).
As the bubble growth progresses, the layer of superheated vapor inside the bubble increases significantly, reducing the ability to dissipate heat at its base. Consequently, the dissipated heat flux will decrease until the final stages of the vertical elongation phase (t* = 0.8 to t* = 0.9). Finally, in the necking phase, the dissipated heat flux undergoes a new and substantial increment, caused by the decrease in the vapor mass directly above the spot, which is now occupied by liquid—allied to the fact that necking also promotes vapor movement inside the bubble, increasing the convective heat transfer coefficient. This rise continues until bubble separation.
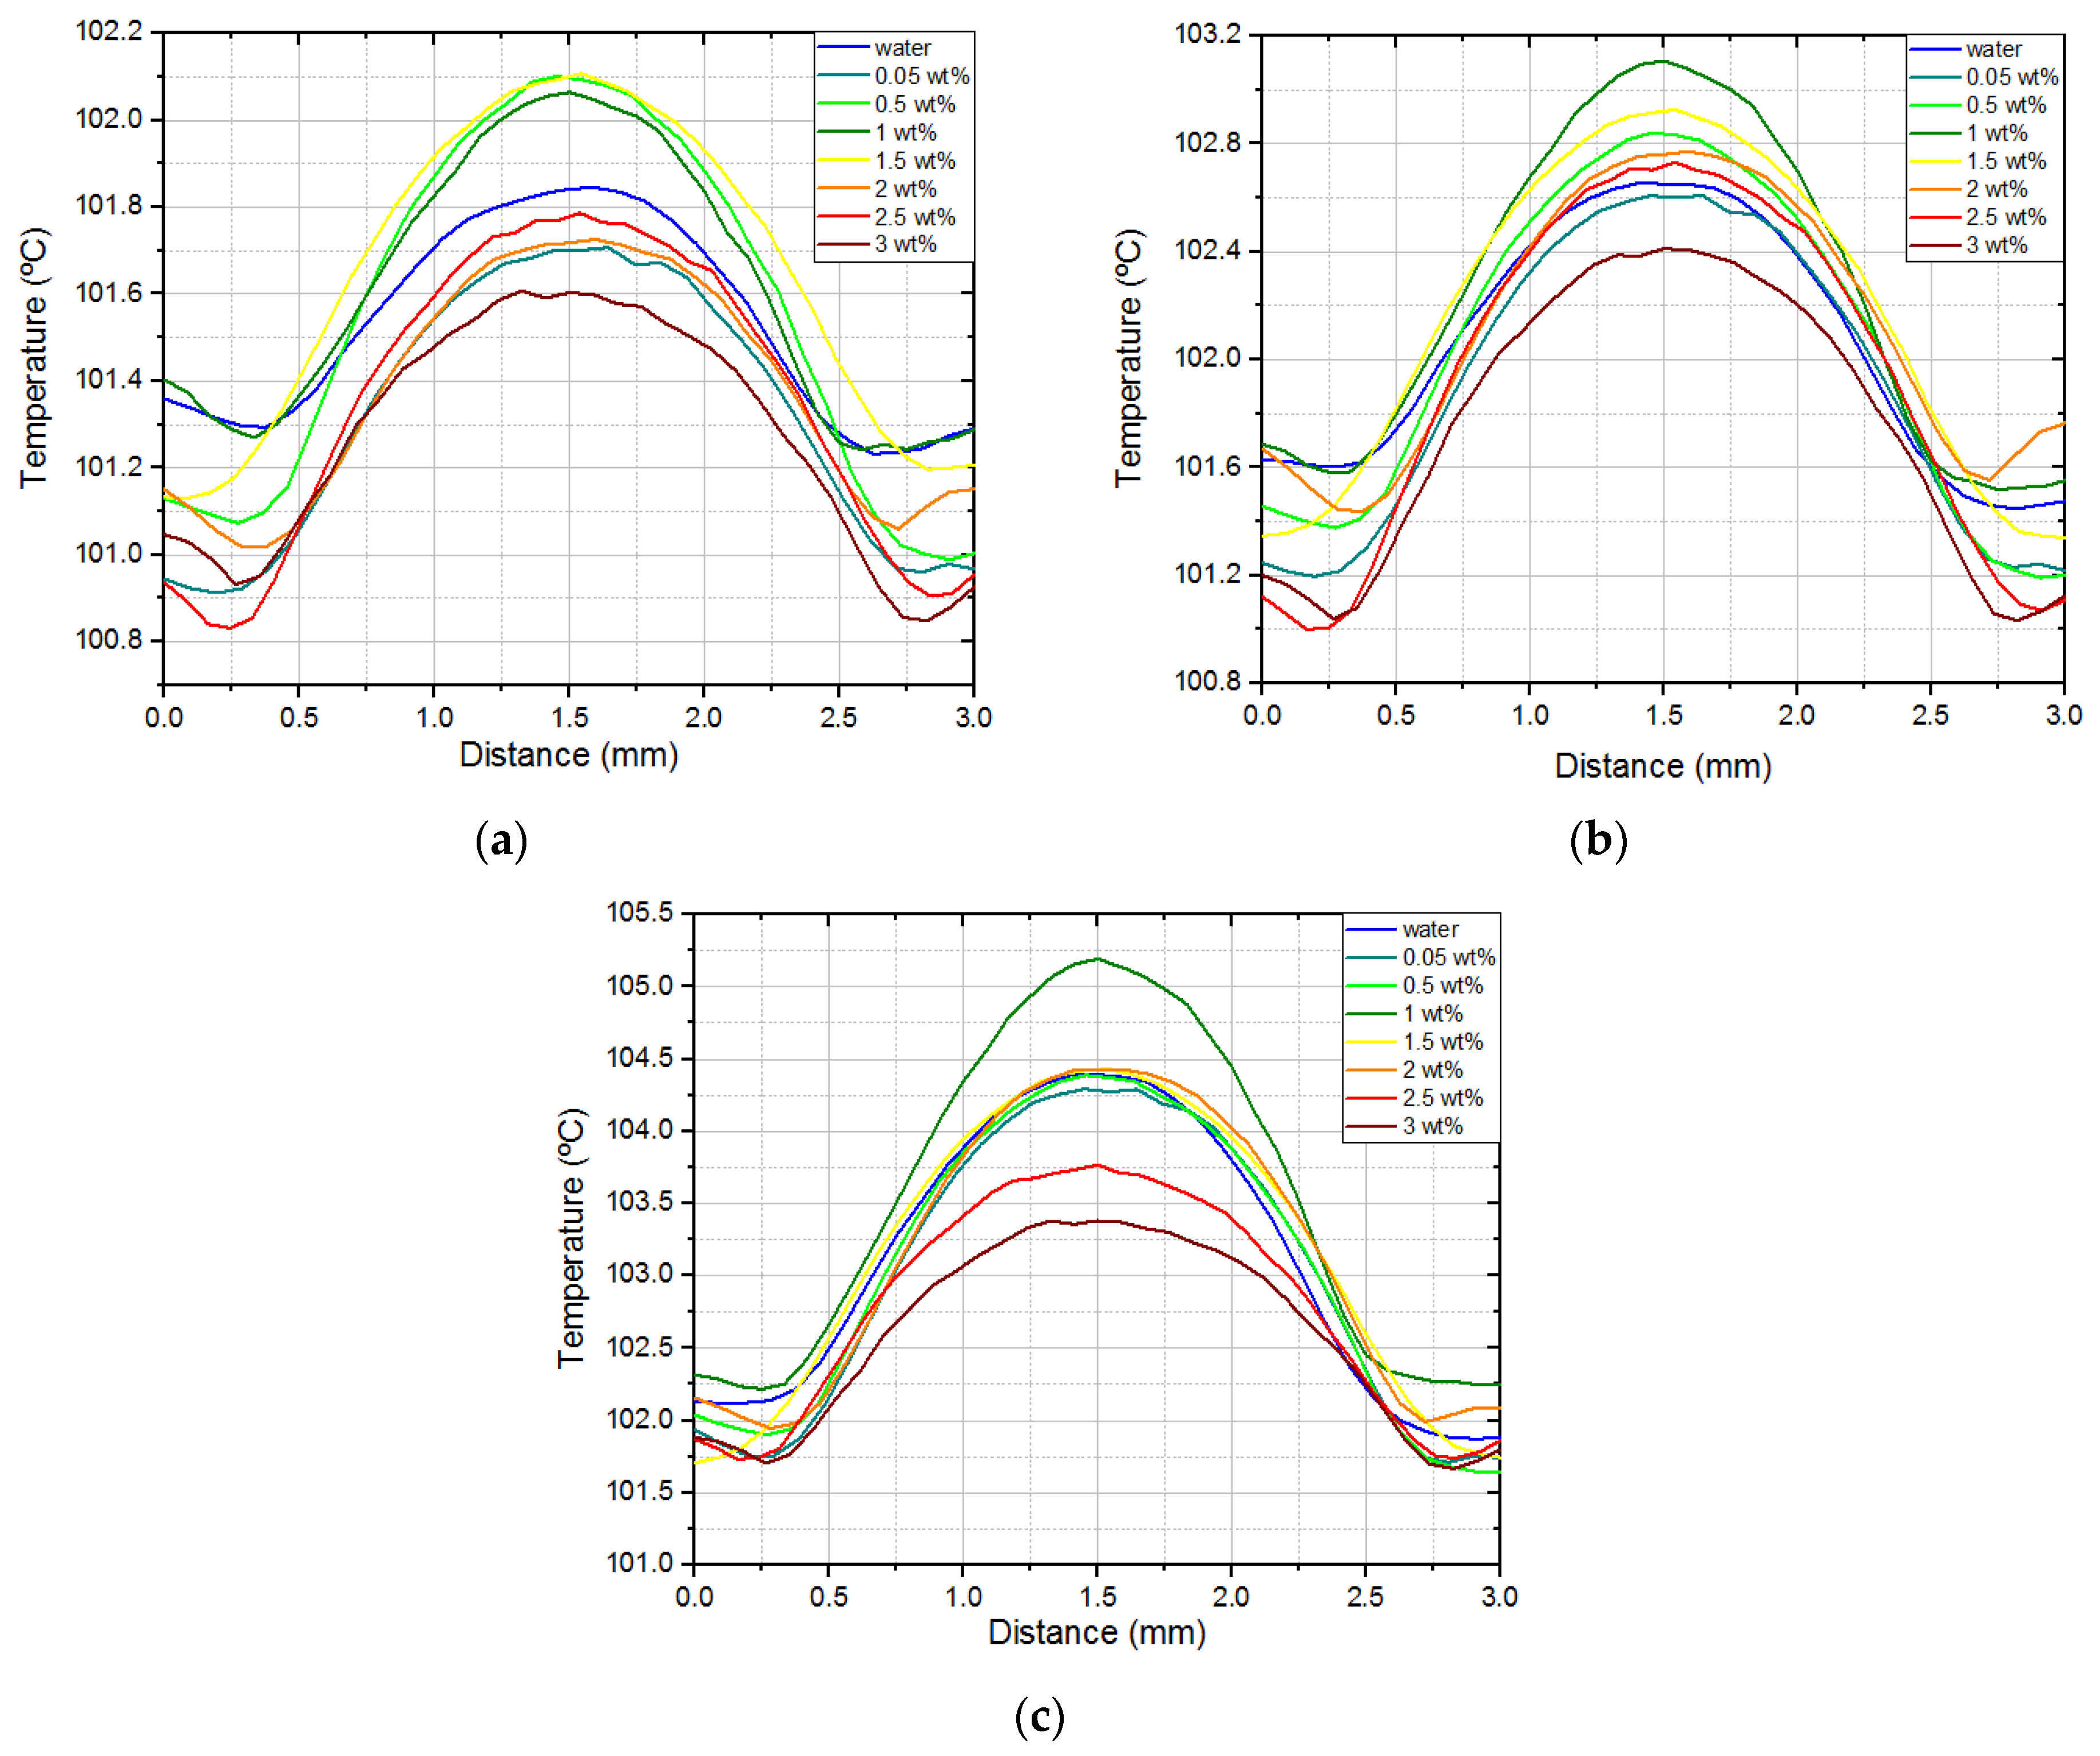
Averaging the temperature profiles of all nucleations along a horizontal line that goes over the center of the superhydrophobic region, with twice its diameter, it is possible to draw a mean temperature profile. This procedure was done for the imposed heat fluxes of 1290 W/m2, 2132 W/m2, and 3790 W/m2. Those temperature profiles are shown in Figure 5. The highest temperature occurs in the center of the superhydrophobic region, substantially decreasing in the hydrophilic region. All working fluids presented a similar behavior when rising the imposed heat flux. A substantial increment in temperature was observed in the center of the superhydrophobic region and not that significant in the hydrophilic region. This shows that heat dissipation is much more efficient in the hydrophilic region, given that the convective heat transfer coefficient of water in this region is much higher than the one of vapors inside the bubble.
The comparison between the different fluids studied did not show any evident relation between the nanoparticles concentration augmentation and temperature variations. Moreover, the temperature differences were small and were within the range of uncertainty. However, the temperature differences are more significant for the superhydrophobic region, at higher imposed heat fluxes, where there was a temperature increase for 1 wt% concentration (worse results) and a decrement for 2.5 wt% and 3 wt% concentration (better results).
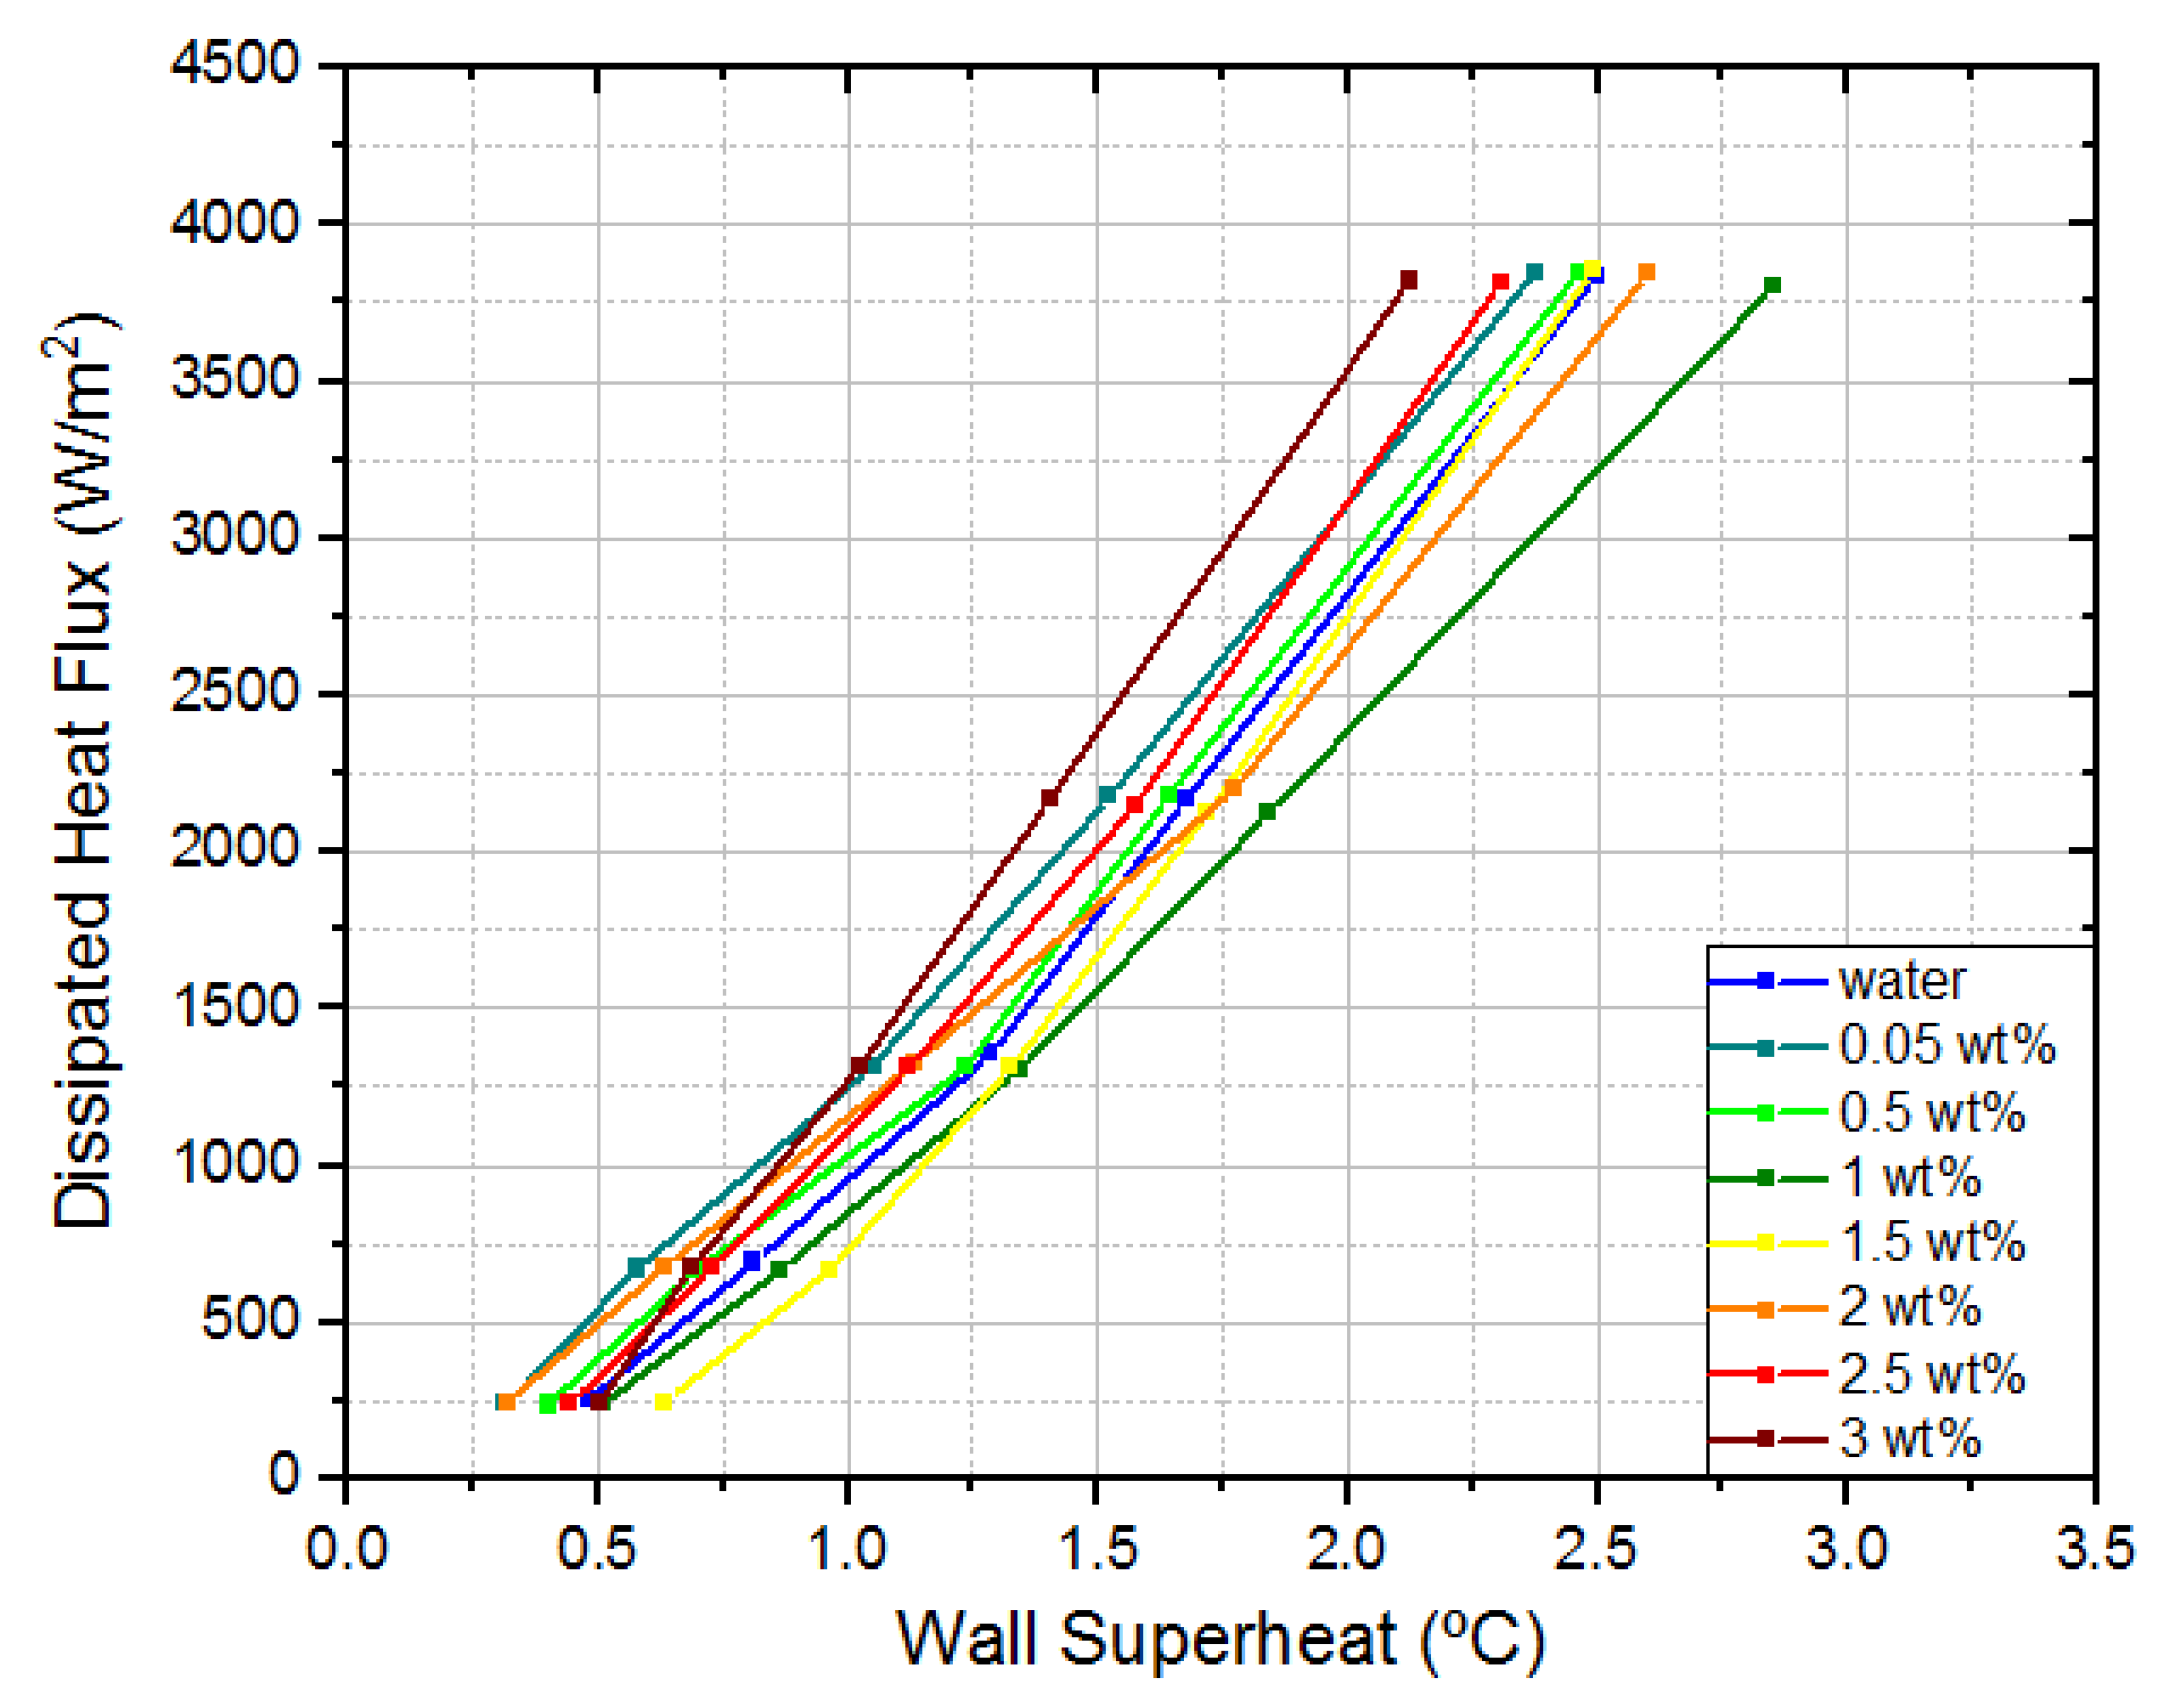
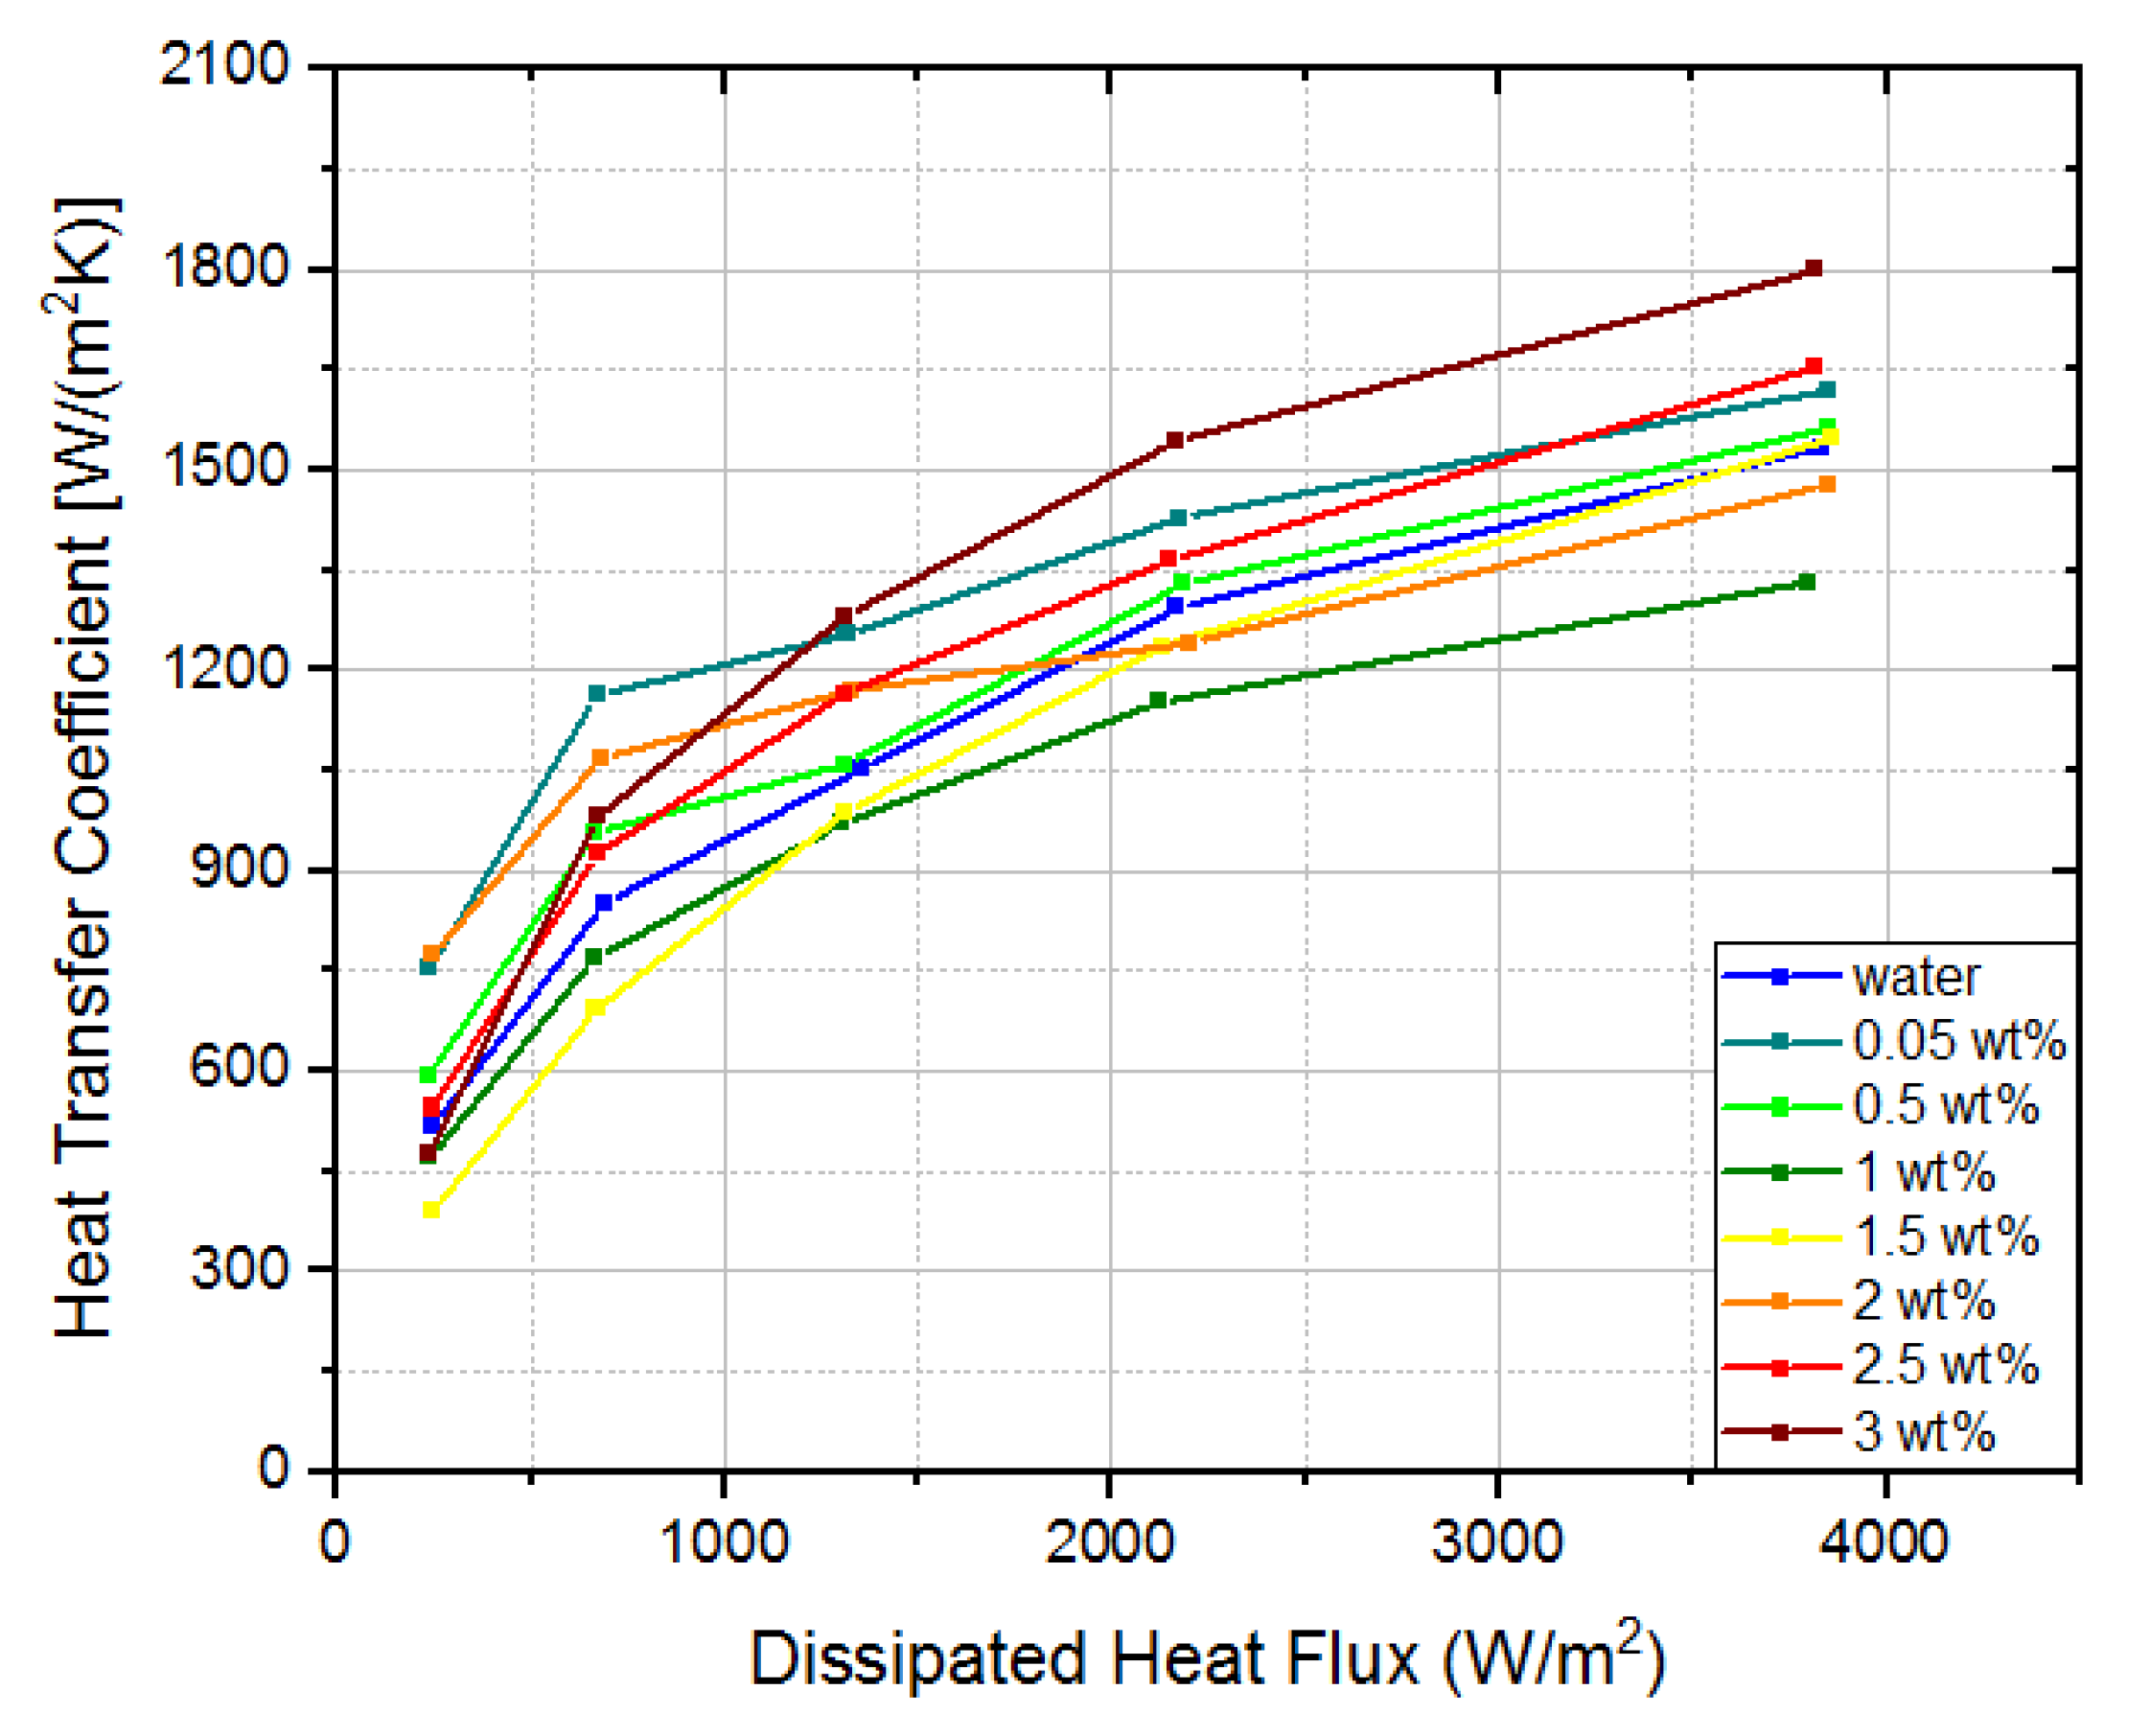
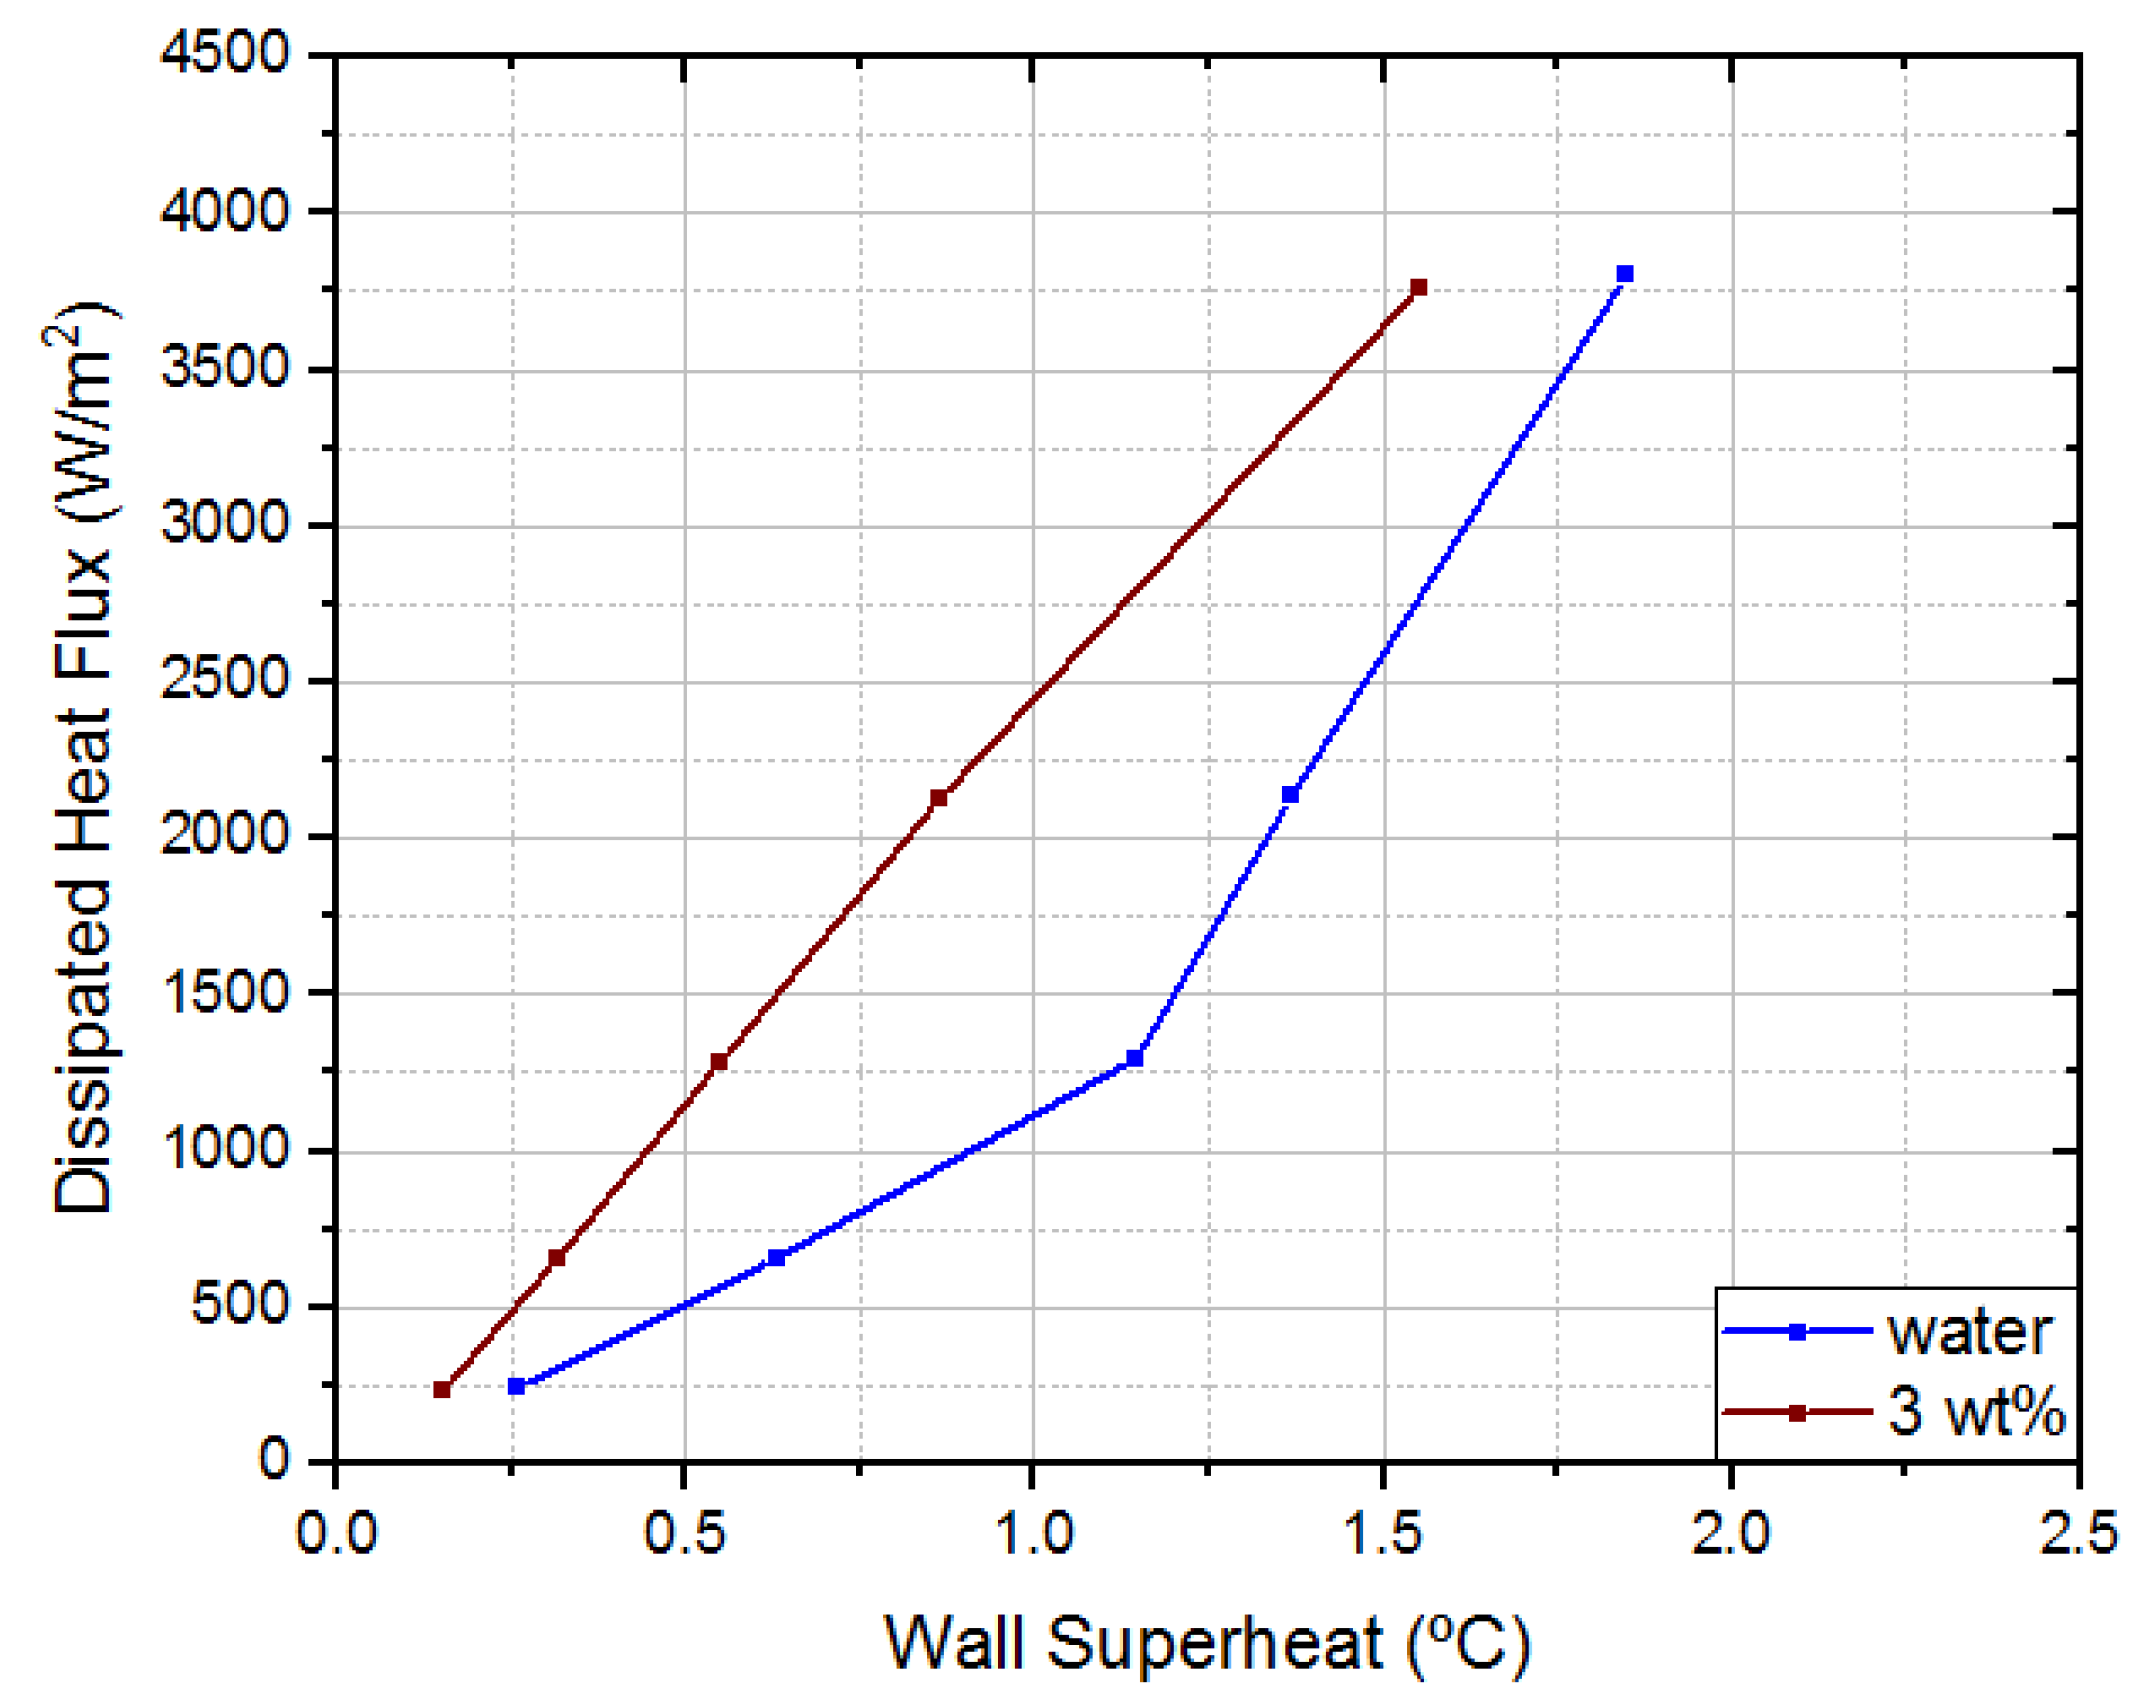
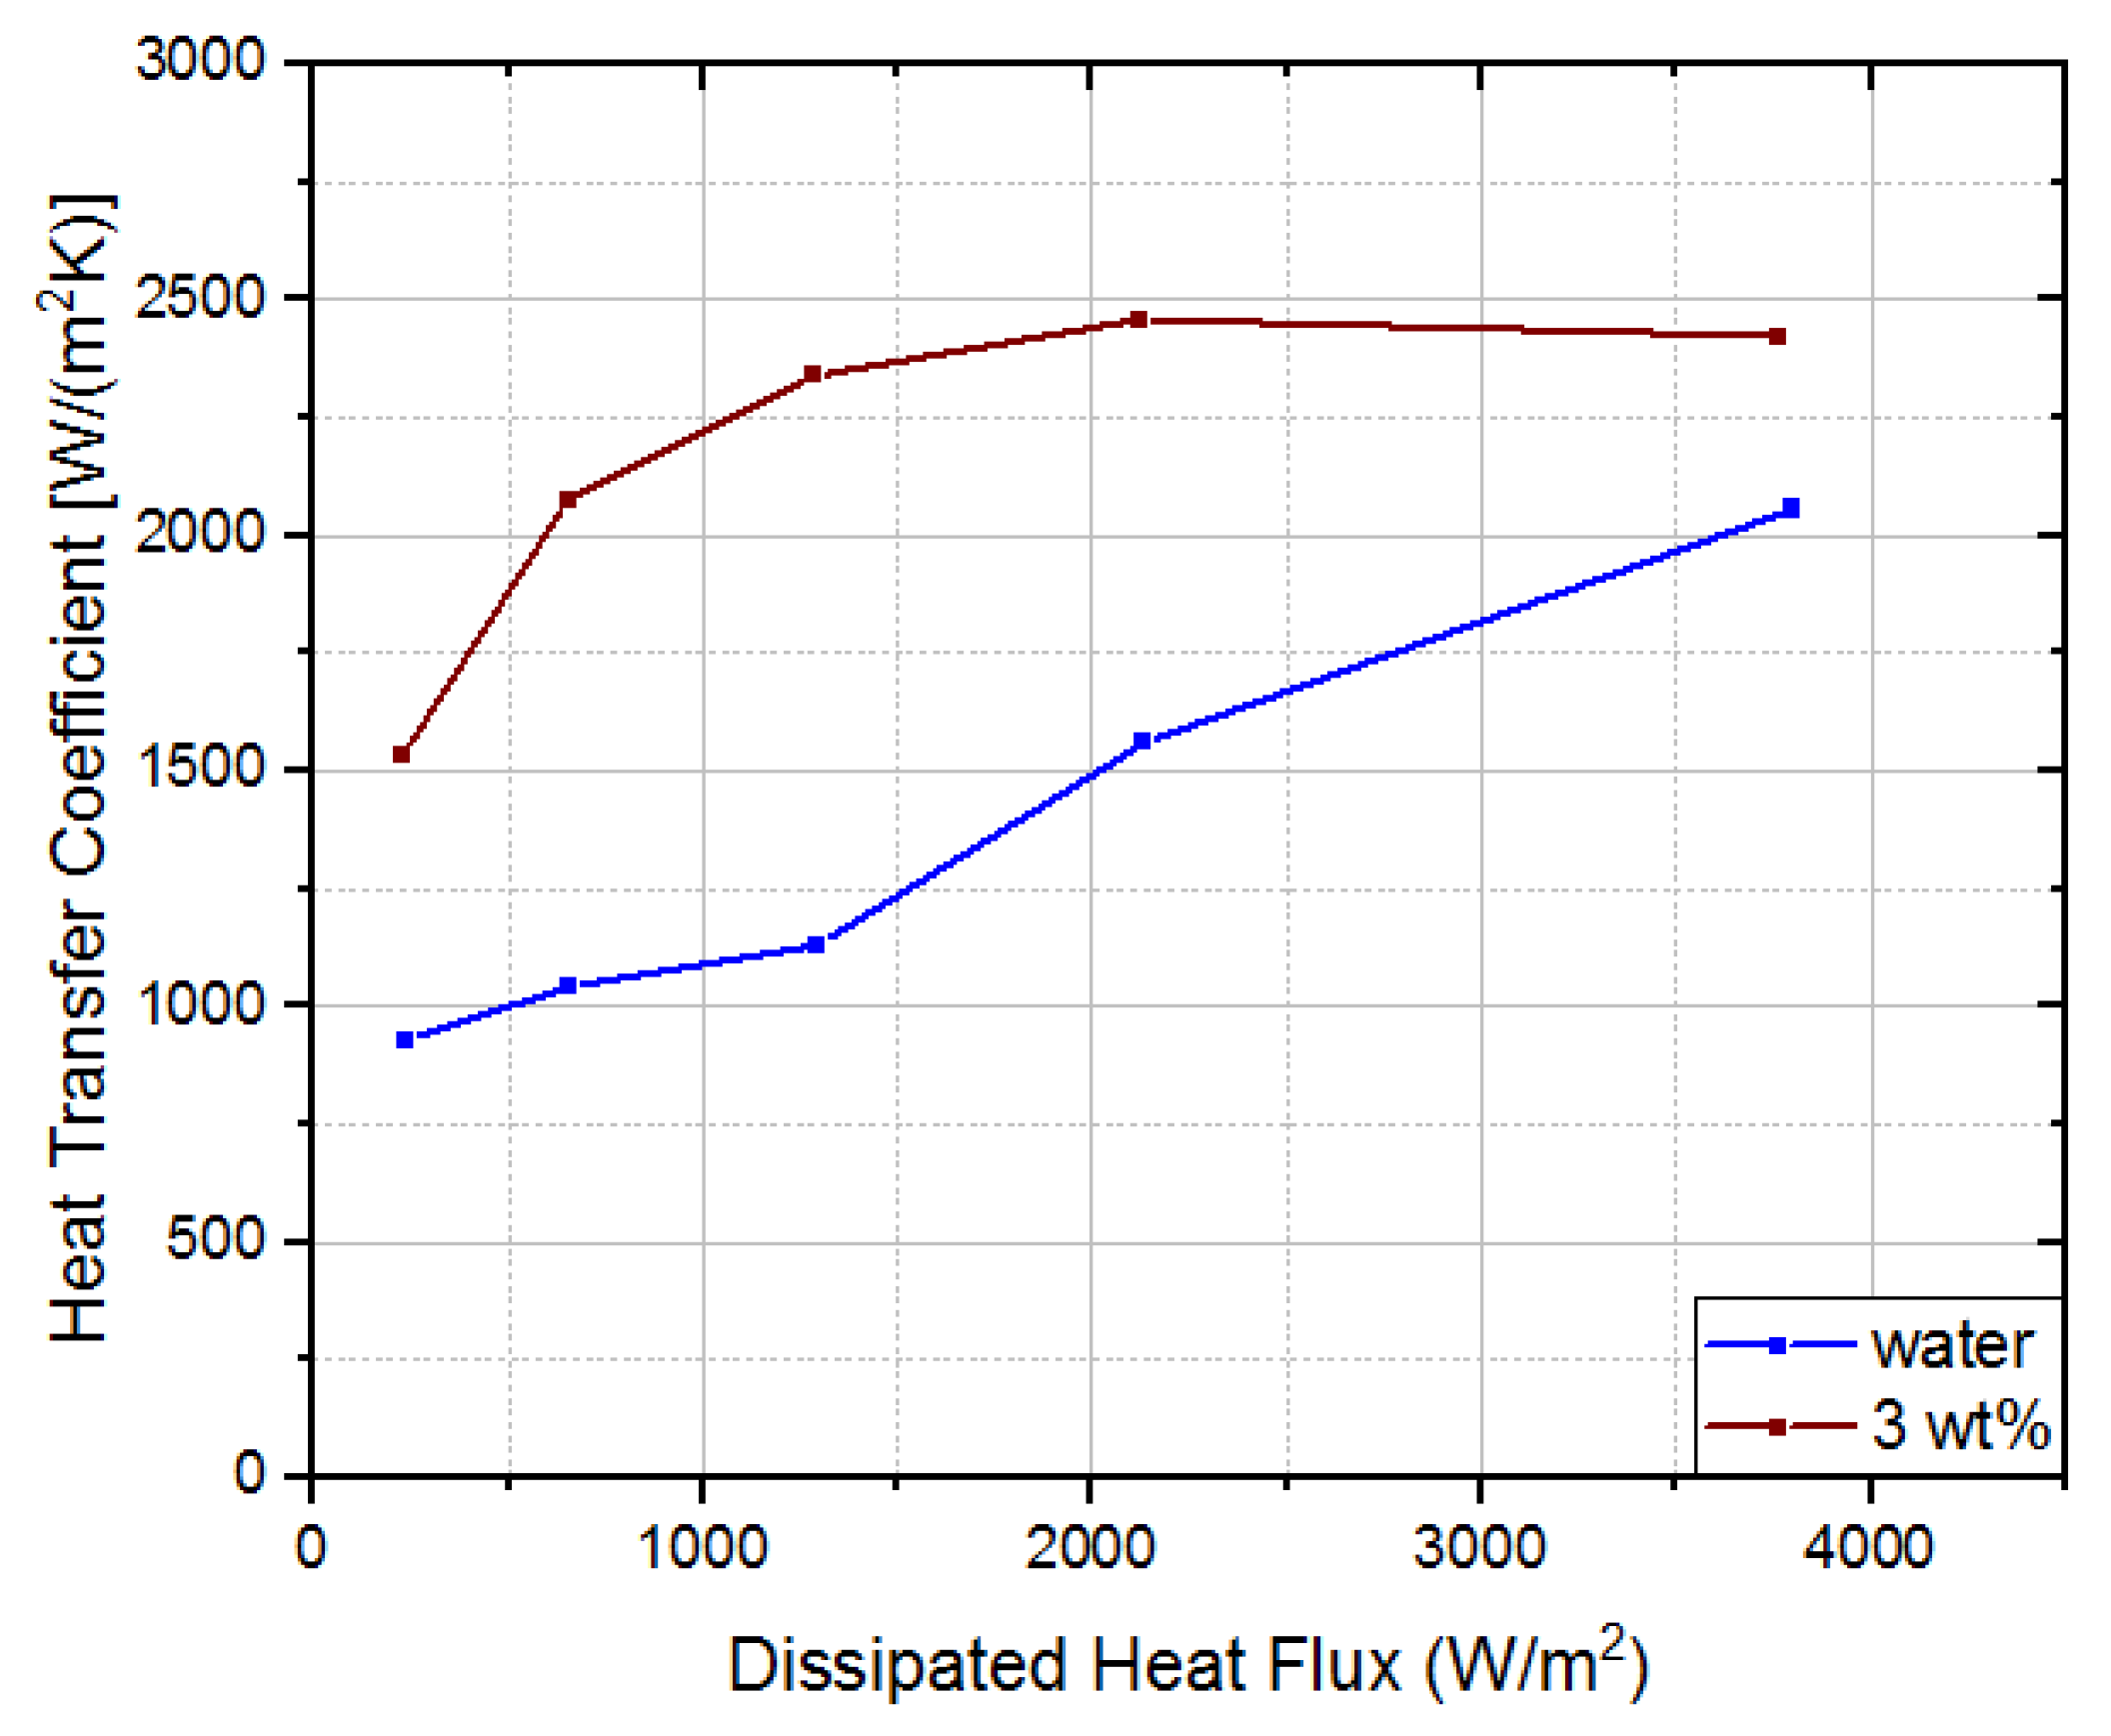
Once completed the analysis of the dissipated heat flux and temperature profiles, it was possible to draw the typical pool boiling curves: wall superheat versus dissipated heat flux (Figure 6) and dissipated heat flux versus heat transfer coefficient (Figure 7).
Looking at Figure 6, it can be easily concluded that nanofluids only mildly influenced the dissipated heat flux. Additionally, it could be verified that nanofluids do not significantly affect wall superheat. The largest variations occur at the highest dissipated heat flux for 1 wt% and 3 wt% concentration. In the first case, the wall superheat was 0.35 °C higher than water. In the second case, the wall superheat was 0.38 °C lower than water. This means that, for the same dissipated heat flux, the temperature in the interest region was 0.38 °C lower than for water, which represents a 15% decrease.
To assess boiling performance, it is important to analyze heat transfer coefficient variations. As illustrated in Figure 7, heat transfer coefficient increased progressively with heat flux increment as a result of higher bubble frequency. The worst case is for 1 wt% concentration, which exhibited a 202 W/(m2K) decrement in the heat transfer coefficient, compared with water. Hence, for the same imposed heat flux, higher temperatures are obtained. On the other hand, using a 3 wt% concentration was verified a 265 W/(m2K) heat transfer coefficient increment, which corresponds to a 17% increase. This shows a higher ability to dissipate heat; therefore, lower surface temperatures were reported (even though absolute temperature differences are small).

3.3. Combining Nanofluids with Biphilic Surfaces

Once the impact of the alumina nanofluids was analyzed, the best performing nanofluid was then combined with a biphilic surface, using a pattern of superhydrophobic regions with 1.5 mm in diameter, 1.5 mm apart, following the recommendation of [
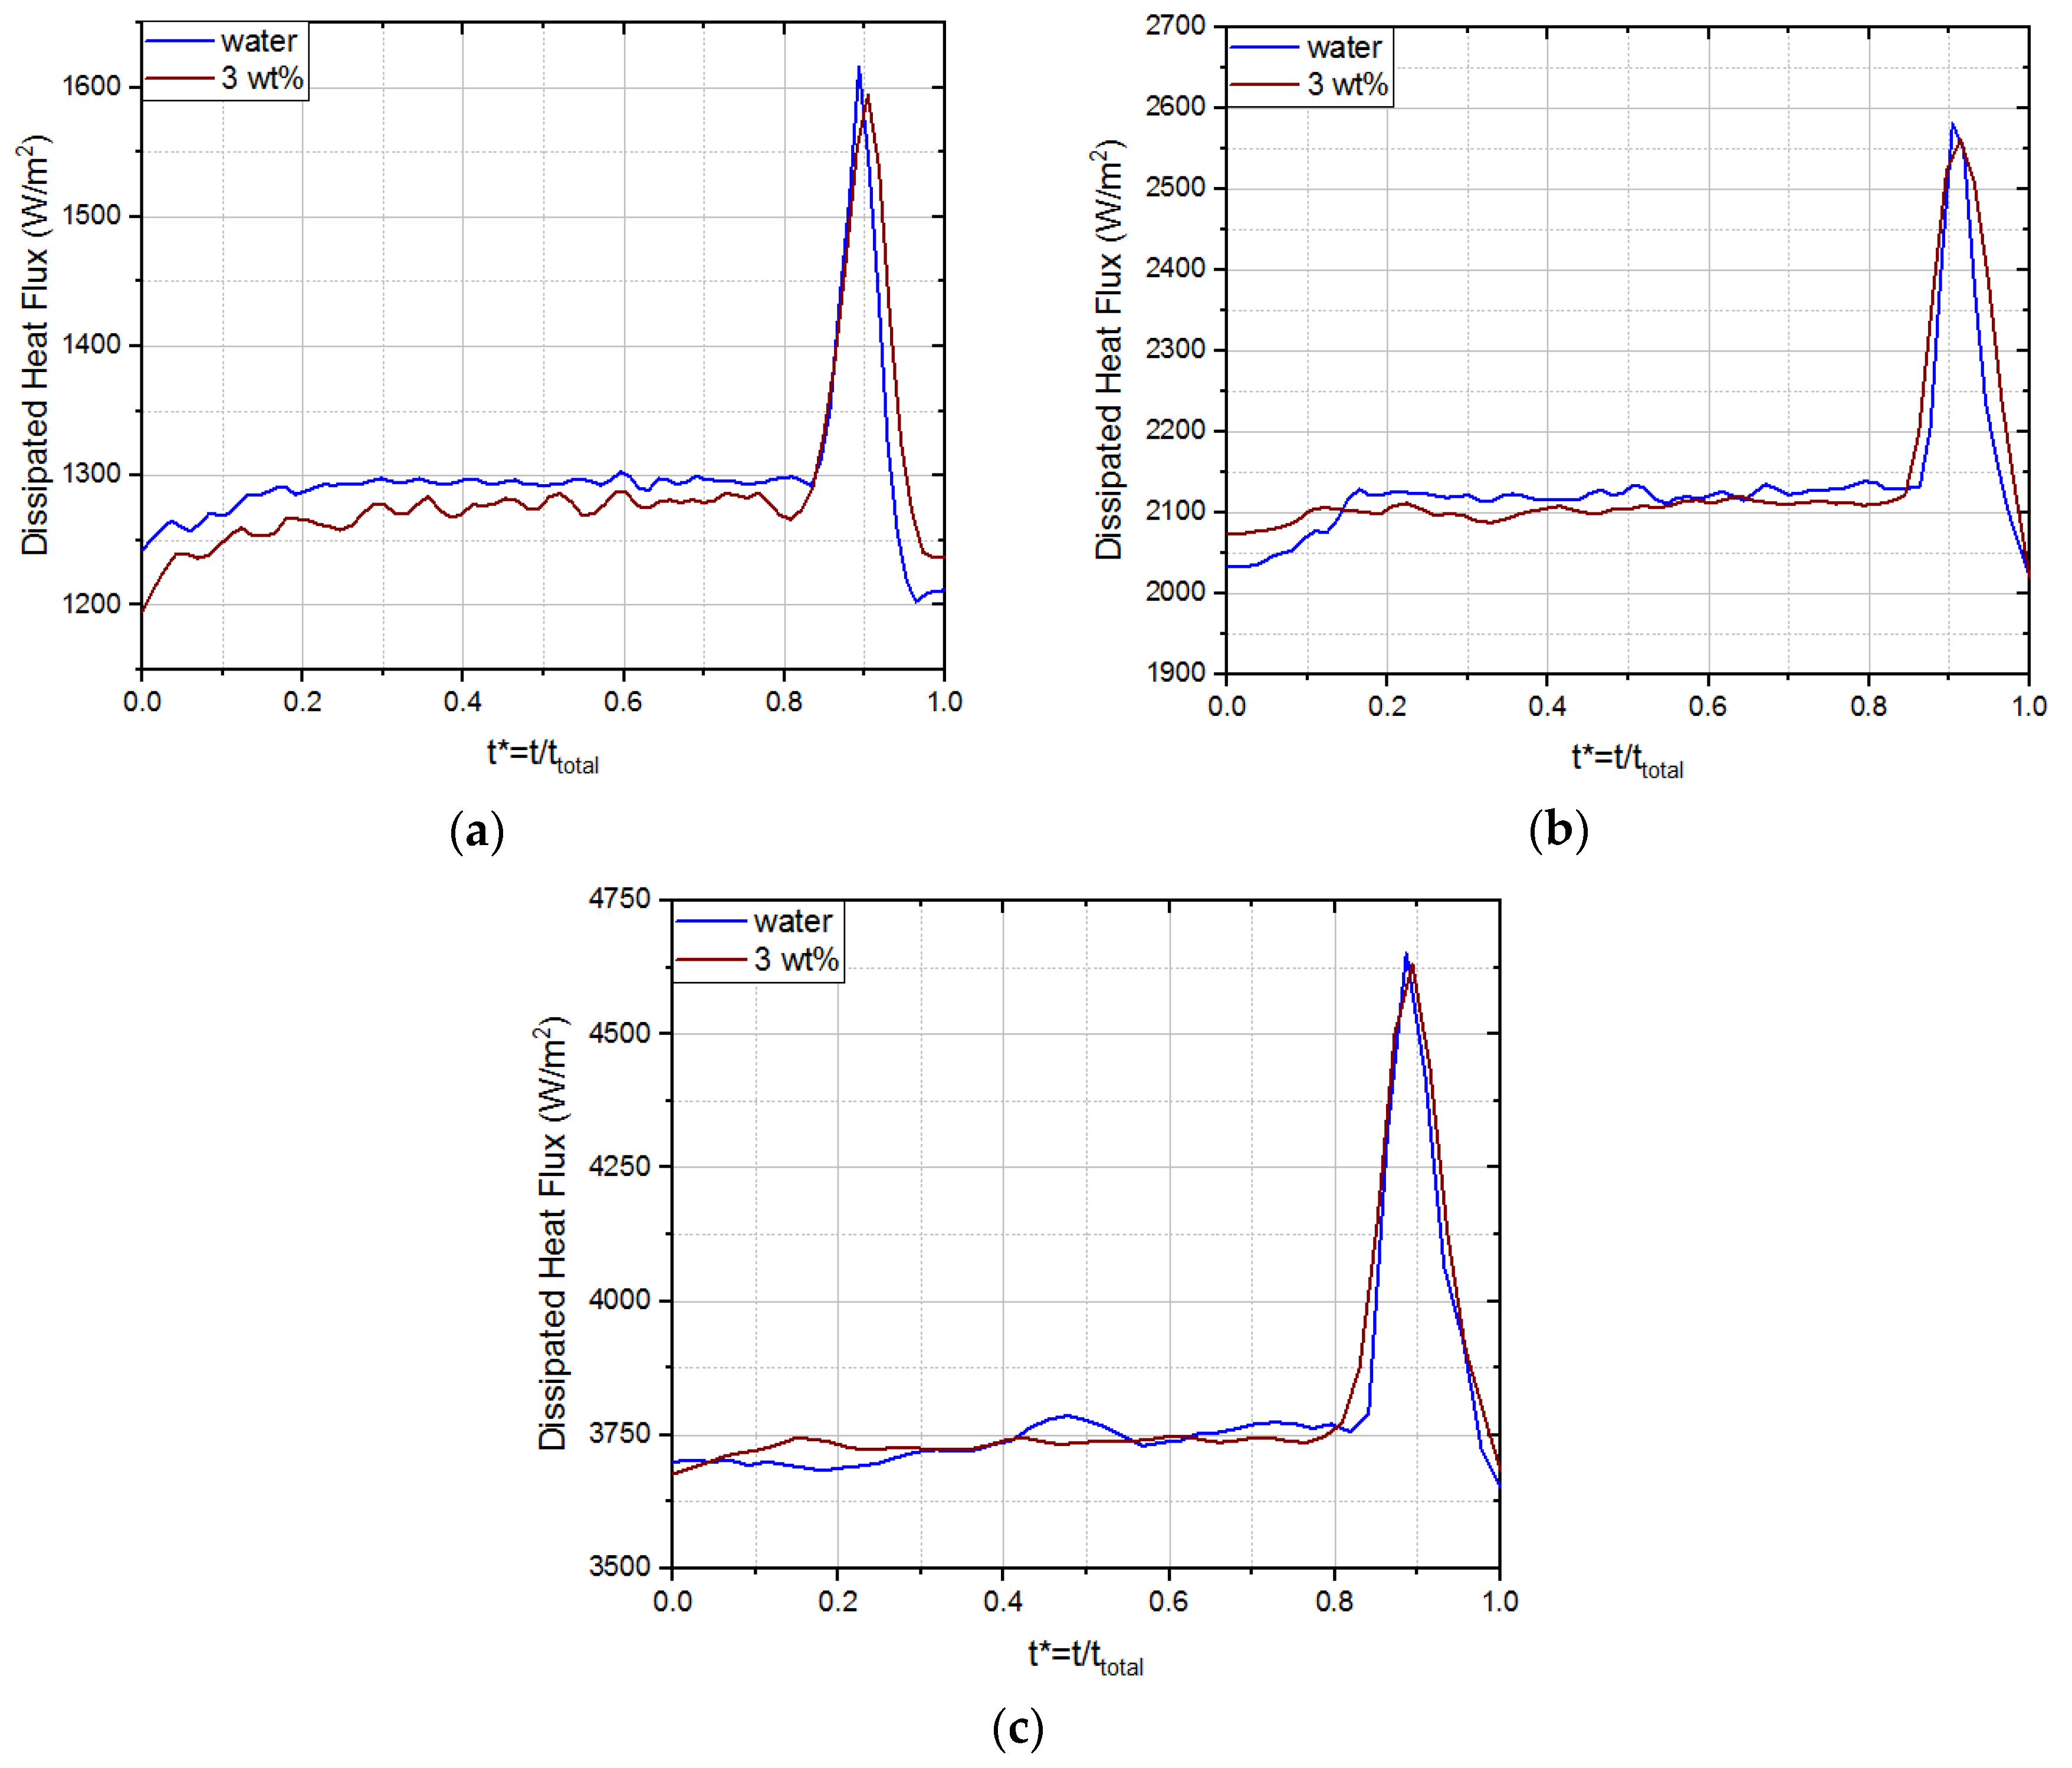
17]. The existence of multiple superhydrophobic regions promotes the onset of boiling for very low superheat degrees (1–3 K) and the circulation of the cold flow on the hydrophilic region. Additionally, the bubble coalescence also promoted fluid motion, resulting in greater heat transfer coefficient. In order to evaluate the impact of bubble coalescence in boiling heat transfer, the dissipated heat flux was analyzed for a nucleation time frame, for the different imposed heat fluxes. The analysis performed here covers a circular area around the central superhydrophobic spot with twice its diameter. The dissipated heat flux obtained for water and 3 wt% concentration nanofluid, as a function of the dimensionless time, are depicted in Figure 8.
Looking at the three different graphs, it is clear that the dissipated heat flux was not altered when using nanofluids. Additionally, the curves depict a similar behavior, regardless of the imposed current intensity. Initially, there was a small increase (up to 50 W/m2) in the dissipated heat flux, as a result of previously bubble detachment, that promotes fresh liquid renewal near the superhydrophobic regions. Then, it stabilized somewhere between hemisphere formation and bubble vertical elongation beginning (t* = 0.2 and t* = 0.4). Posteriorly, unlike what happens for the single bubble case, in the final phase of bubble growth (between t* = 0.8 and t* = 0.9), the dissipated heat flux started to rise abruptly as a result of bubble interaction. At this stage of bubble formation, bubbles came close to each other, touching in their maximum diameter point. This phenomenon induced great fluid motion between bubbles, and the dissipated heat flux reaches its maximum value at t* = 0.9. However, as bubbles continued to grow, they fully joined with each other, at t* = 0.95, in what is called bubble coalescence. In this phase, a single and larger bubble is formed. The space between bubbles that was occupied by liquid is then fulfilled by vapor. The dissipated heat flux drops again quickly as a result of vapor lower convective heat transfer coefficient and remains that way until bubble detachment.
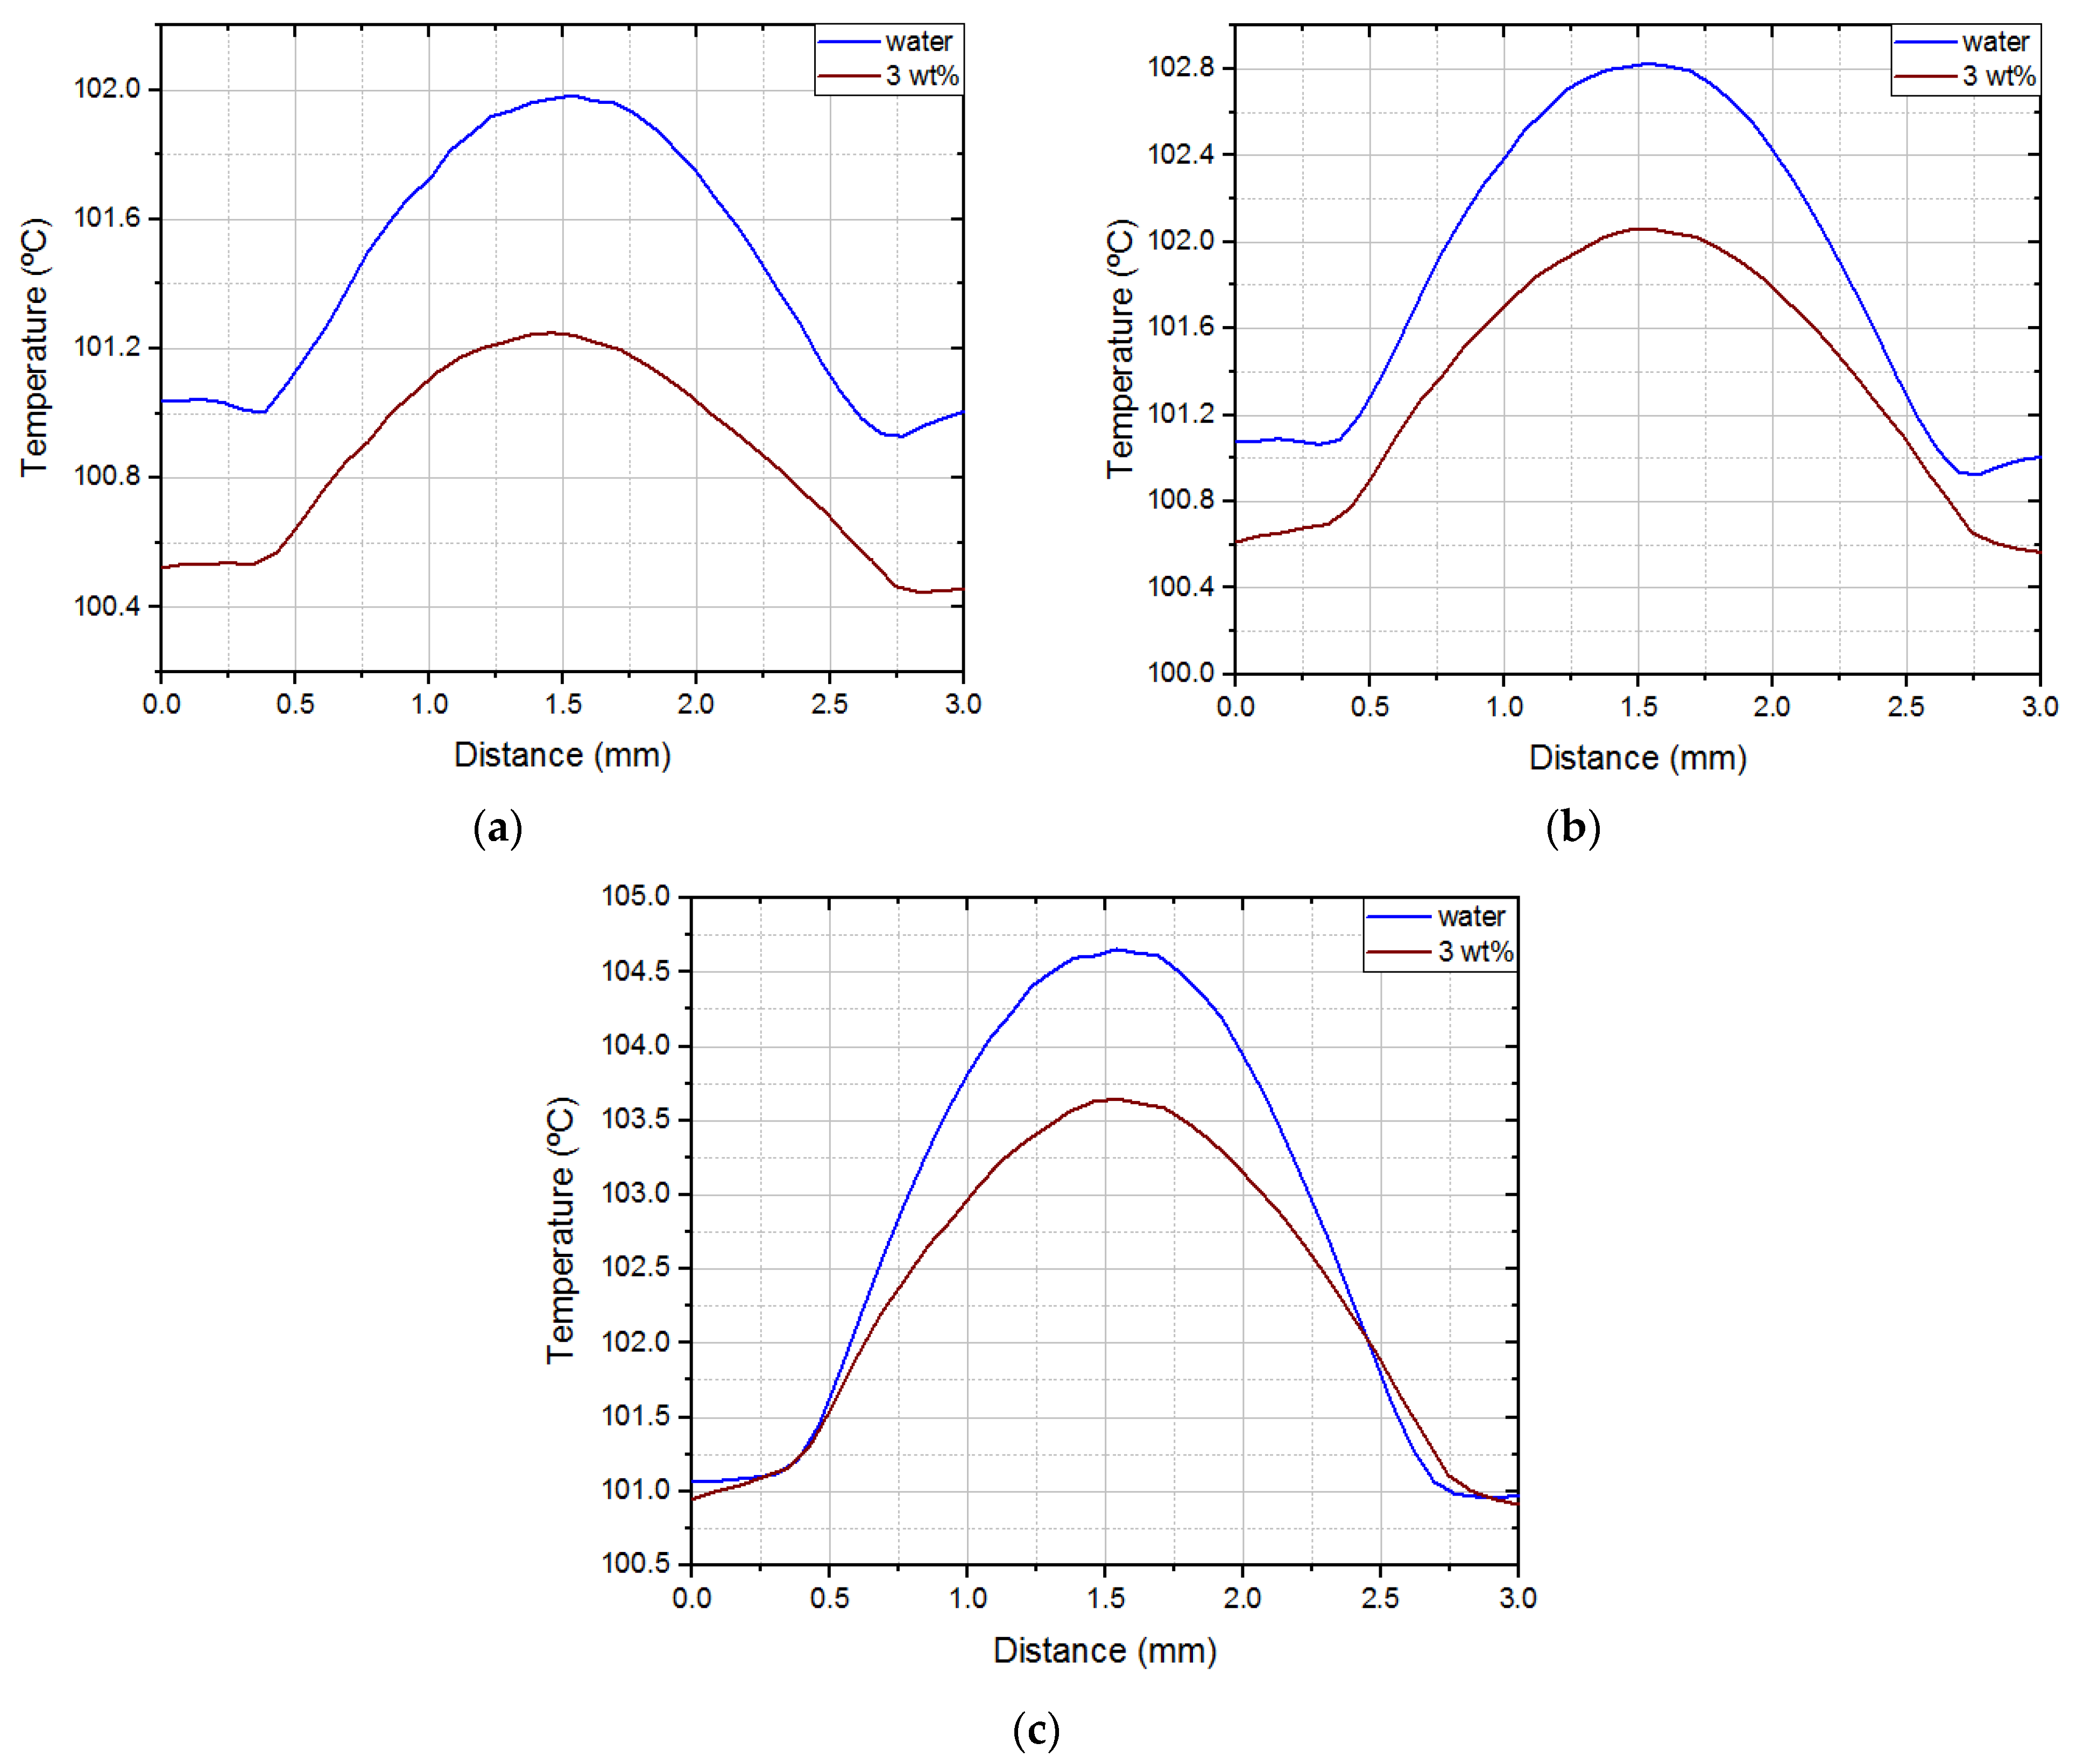
Averaging the temperature profiles of all nucleations and videos, it is possible to draw a mean surface temperature profile for both fluids. The results are shown in Figure 9.
For all imposed heat fluxes, there was a temperature decrement relative to water when using the 3 wt% concentration nanofluid. Notwithstanding, the temperature differences were small (no more than 5 °C), so further testing is necessary to make definite conclusions. Still, the constant temperature reduction in the center of the superhydrophobic spot suggests that the use of nanoparticles can lead to smaller bubbles. Either suspended or deposited nanoparticles can contribute to changes in the balance of forces in the triple line. As a result, bubble volume can decrease, and bubble frequency increase. On the other hand, the temperature decrement in the hydrophilic region, for lower imposed heat fluxes, may be due to deposited nanoparticles that improve heat transfer by conduction.
Averaging the temperature and dissipated heat flux, the typical wall superheat versus heat flux graph can be drawn, as depicted in Figure 10.
Looking at the figure, lower temperatures are obtained at the surface when using a 3 wt% concentration nanofluid. The largest difference occurred for 1290 W/m2, for which the surface temperature was 0.6 °C lower when using the nanofluid. This corresponds to a 52% reduction. Temperature differences tended to attenuate as the imposed heat flux was increased. Heat transfer coefficient evolution, as a function of the dissipated heat flux, is represented in Figure 11.
Comparing the two fluids is clear that the 3 wt% concentration nanofluid shows better boiling performance throughout the curve. This was particularly evident at lower imposed heat fluxes. The maximum difference was obtained for 1290 W/m2, where an 1108 W/(m2K) increase was observed relative to water. This represents an impressive 98% increment. Part of this substantial gain may be due to increased conductive and convective heat transfer as a result of deposited and suspended nanoparticles. Nevertheless, the prominent factor for heat transfer coefficient enhancement shall be the formation of smaller and more frequent bubbles, as a consequence of the deposited nanoparticles that improve wettability and lead to changes in the balance of forces in the triple line. Despite the large improvement for lower imposed heat fluxes, further studies are now required to extend these conclusions drawn to the basic conditions that allow studying the fundamental processes of nucleation, e.g., to extend the boiling curve to elevated heat fluxes.
So, in agreement with our previous studies, e.g., [17,22], biphilic surfaces show a better performance than hydrophilic or superhydrophobic surface alone since, as they combine extreme wetting characteristics, they promote the boiling to be triggered at very low superheat values in the superhydrophobic regions, while promoting fluid flow within these regions (in the remaining hydrophilic surface). Furthermore, the derived pattern allows for a controlled bubble coalescence, which enhances the induced convection during bubble detachment.

4. Conclusions

The present paper focused on the impact of alumina nanofluids within various concentrations on pool boiling over biphilic surfaces. The results show that the addition of alumina nanoparticles to water at a 3 wt% concentration has the potential to enhance pool boiling performance for the studied conditions. Using this nanofluid, the surface temperature decreases in the center of the bubble, which suggests that smaller and more frequent bubbles are generated. The most plausible reason for this to happen is the deposited nanoparticles that result in surface wettability increment. Both deposited and suspended nanoparticles can change the balance of forces in the triple line, affecting bubble growth, its dimensions, and frequency. Additionally, nanoparticles can improve the convective heat transfer due to enhanced turbulence, and the conductive heat transfer near the surface, due to their higher thermal conductivity. This effect, although relevant, is still of minor importance when compared to that of the use of biphilic surfaces. The biphilic pattern clearly promotes fluid flow within the superhydrophobic regions, as well as a controlled coalescence, which further promotes induced convection of fresh fluid near the surface.
Despite various challenges mentioned in this work, such as dispersion stability, the studied nanofluids are improved working fluids that can be used for various energy applications, especially when talking about energy performance in industrial applications. Therefore, we can conclude that this study is a step further to understand the behavior of nanofluids in experimental setups, also in industrial devices, or real facilities.

Author Contributions

Conceptualization, A.S.M.; methodology, A.S.M. and A.P.C.R.; validation, A.S.M.; formal analysis, R.S. and A.P.C.R.; investigation and resources, A.S.M. and A.L.N.M.; data curation, A.S.M.; writing—original draft preparation, A.S.M.; writing—review and editing, A.S.M., supervision, A.S.M. and A.L.N.M.; project administration, A.S.M.; funding acquisition, A.S.M. and A.L.N.M. All authors have read and agreed to the published version of the manuscript.

Funding

Authors are grateful to Fundação para a Ciência e Tecnologia (FCT) for partially financing the research through projects JICAM/0003/2017, PTDC/EME-SIS/30171/2017 and PTDC/EME-TED/7801/2020. A.P.C.R. thanks FCT and Instituto Superior Técnico for the Scientific Employment contract IST-ID/119/2018.

Conflicts of Interest

The authors declare no conflict of interest.

References

  1. Data Center Cooling Market by Solution (Air Conditioning, Chilling Unit, Cooling Tower, Economizer System, Liquid Cooling System, Control System & Others), Service, Type of Cooling, Data Center Type, Industry & Region—Global Forecast to 2025. Available online: https://www.marketsandmarkets.com/Market-Reports/data-center-cooling-solutions-market-1038.html (accessed on 22 November 2021).
  2. Immersion Cooling Market. Available online: https://www.marketsandmarkets.com/Market-Reports/immersion-cooling-market-107040948.html (accessed on 22 November 2021).
  3. United Nations. Transforming Our World: The 2030 Agenda for Sustainable Development. 2019. Available online: https://sustainabledevelopment.un.org/post2015/transformingourworld (accessed on 22 November 2021).
  4. Hoseinzadeh, S.; Heyns, P.; Kariman, H. Numerical investigation of heat transfer of laminar and turbulent pulsating Al2O3/water nanofluid flow. Int. J. Numer. Methods Heat Fluid Flow 2020, 30, 1149–1166. [Google Scholar] [CrossRef]
  5. Murshed, S.; Leong, K.C.; Yang, C. Thermophysical and electrokinetic properties of nanofluids—A critical review. Appl. Therm. Eng. 2008, 28, 2109–2125. [Google Scholar] [CrossRef]
  6. Hoseinzadeh, S.; Sahebi, S.A.R.; Ghasemiasl, R.; Majidian, A.R. Experimental analysis to improving thermosyphon (TPCT) thermal efficiency using nanoparticles/based fluids (water). Eur. Phys. J. Plus 2017, 132, 197. [Google Scholar] [CrossRef]
  7. Asgary, S.; Vaghri, E.; Daemi, M.; Esmaili, P.; Ramezani, A.H.; Memon, S.; Hoseinzadeh, S. Magnetron sputtering technique for analyzing the influence of RF sputtering power on microstructural surface morphology of aluminum thin films deposited on SiO2/Si substrates. Appl. Phys. A 2021, 127, 752. [Google Scholar] [CrossRef]
  8. Hoseinzadeh, S.; Otaghsara, S.T.; Khatir, M.Z.; Heyns, P. Numerical investigation of thermal pulsating alumina/water nanofluid flow over three different cross-sectional channel. Int. J. Numer. Methods Heat Fluid Flow 2020, 30, 3721–3735. [Google Scholar] [CrossRef]
  9. Maxwell, J.C. A Treatise on Electricity and Magnetism; Clarendon Press: Oxford, UK, 1881. [Google Scholar]
  10. Trisaksri, V.; Wongwises, S. Critical review of heat transfer characteristics of nanofluids. Renew. Sustain. Energy Rev. 2007, 11, 512–523. [Google Scholar] [CrossRef]
  11. Choi, S.U.; Eastman, J.A. Enhancing Thermal Conductivity of Fluids with Nanoparticles; Argonne National Lab.: Lemont, IL, USA, 1995. [Google Scholar]
  12. Nikulin, A.; Moita, A.; Moreira, A.; Murshed, S.; Huminic, A.; Grosu, Y.; Faik, A.; Nieto-Maestre, J.; Khliyeva, O. Effect of Al2O3 nanoparticles on laminar, transient and turbulent flow of isopropyl alcohol. Int. J. Heat Mass Transf. 2019, 130, 1032–1044. [Google Scholar] [CrossRef]
  13. Khan, A.; Ali, H.M. A comprehensive review—Pool boiling using nanofluids. Therm. Sci. 2019, 23, 3209–3237. [Google Scholar] [CrossRef]
  14. Kamel, M.S.; Lezsovitsf, F. Boiling Heat Transfer of Nanofluids: A Review of Recent Studies. Therm. Sci. 2019, 23, 109–124. [Google Scholar] [CrossRef] [Green Version]
  15. Ciloglu, D.; Bolukbasi, A. A comprehensive review on pool boiling of nanofluids. Appl. Therm. Eng. 2015, 84, 45–63. [Google Scholar] [CrossRef]
  16. Murshed, S.S.; de Castro, C.N.; Lourenço, M.; Lopes, M.; Santos, F. A review of boiling and convective heat transfer with nanofluids. Renew. Sustain. Energy Rev. 2011, 15, 2342–2354. [Google Scholar] [CrossRef]
  17. Freitas, E.; Pontes, P.; Cautela, R.; Bahadur, V.; Miranda, J.; Ribeiro, A.P.C.; Souza, R.R.; Oliveira, J.D.; Copetti, J.B.; Lima, R.; et al. Pool Boiling of Nanofluids on Biphilic Surfaces: An Experimental and Numerical Study. Nanomaterials 2021, 11, 125. [Google Scholar] [CrossRef] [PubMed]
  18. You, S.M.; Kim, J.H.; Kim, K.H. Effect of nanoparticles on critical heat flux of water in pool boiling heat transfer. Appl. Phys. Lett. 2003, 83, 3374–3376. [Google Scholar] [CrossRef]
  19. Tu, J.; Dinh, N.; Theofanous, T. An experimental study of nanofluid boiling heat transfer. In Proceedings of the 6th International Symposium on Heat Transfer, Bejing, China, 15–19 June 2004. [Google Scholar]
  20. Wen, D.; Ding, Y. Experimental investigation into the pool boiling heat transfer of aqueous based γ-alumina nanofluids. J. Nanopart. Res. 2005, 7, 265–274. [Google Scholar] [CrossRef]
  21. Das, S.K.; Putra, N.; Roetzel, W. Pool boiling characteristics of nano-fluids. Int. J. Heat Mass Transf. 2003, 46, 851–862. [Google Scholar] [CrossRef]
  22. Pontes, P.; Cautela, R.; Teodori, E.; Moita, A.; Liu, Y.; Moreira, A.; Nikulin, A.; del Barrio, E.P. Effect of pattern geometry on bubble dynamics and heat transfer on biphilic surfaces. Exp. Therm. Fluid Sci. 2020, 115, 110088. [Google Scholar] [CrossRef]
  23. Ali, N.; Teixeira, J.A.; Addali, A. A Review on Nanofluids: Fabrication, Stability, and Thermophysical Properties. J. Nanomater. 2018, 2018, 6978130. [Google Scholar] [CrossRef]
  24. Schustera, J.M.; Schvezova, C.E.; Rosenbergera, M.R. Influence of experimental variables on the measure of contact angle in metals using the sessile drop method. Procedia Mater. Sci. 2015, 8, 742–751. [Google Scholar] [CrossRef]
  25. Moita, A.S.; Laurência, C.; Ramos, J.A.; Prazeres, D.M.; Moreira, A. Dynamics of droplets of biological fluids on smooth superhydrophobic surfaces under electrostatic actuation. J. Bionic Eng. 2016, 13, 220–234. [Google Scholar] [CrossRef]
  26. Ilyas, S.U.; Pendyala, R.; Marneni, N. Settling Characteristics of Alumina Nanoparticles in Ethanol-Water Mixtures. Appl. Mech. Mater. 2013, 372, 143–148. [Google Scholar] [CrossRef]
  27. Woolard, E.W.; Einstein, A.; Furth, R.; Cowper, A.D. Investigations on the Theory of the Brownian Movement. Am. Math. Mon. 1928, 35, 318. [Google Scholar] [CrossRef]
  28. Incropera, F.P.; DeWitt, D.P.; Bergaman, T.L.; Lavine, A.S. Fundamentals of Heat and Mass Transfer; John Wiley & Sons: Hoboken, NJ, USA, 2006. [Google Scholar]
  29. Teodori, E.; Pontes, P.; Moita, A.S.; Moreira, A.L.N. Thermographic analysis of interfacial heat transfer mechanisms on droplet/wall interactions with high temporal and spatial resolution. Exp. Therm. Fluid Sci. 2018, 96, 284–294. [Google Scholar] [CrossRef]
  30. Teodori, E.; Valente, T.; Malavasi, I.; Moita, A.; Marengo, M.; Moreira, A. Effect of extreme wetting scenarios on pool boiling conditions. Appl. Therm. Eng. 2017, 115, 1424–1437. [Google Scholar] [CrossRef] [Green Version]
  31. Maly, M.; Moita, A.S.; Jedelsky, J.; Ribeiro, A.P.C.; Moreira, A. Effect of nanoparticles concentration on the characteristics of nanofluid sprays for cooling applications. J. Therm. Anal. 2019, 135, 3375–3386. [Google Scholar] [CrossRef] [Green Version]
Figure 1. Schematic view of the experimental setup: (1) boiling chamber, (2) funnel, (3) condensed fluid recipient, (4) computer, (5) tank base, (6) DC power supply, (7) high-speed camera, (8) infrared camera, (9) LED, and (10) Personal computer.
Energies 15 00372 g001
Figure 2. Test surface: (a) clean; (b) with deposited nanoparticles, after the experiment with 3 wt% concentration nanofluid.
Energies 15 00372 g002
Figure 3. Temporal evolution of the: (a) dissipated heat flux, (b) mean surface temperature. The interest area has a diameter of 3 mm, the fluid is water, and the imposed heat flux is 1290 W/m2.
Energies 15 00372 g003
Figure 4. Average dissipated heat flux for a nucleation time frame, for different imposed heat fluxes, using water and 3 wt% concentration Al2O3/water nanofluid. The superhydrophobic region is 1.5 mm in diameter. (a) 1290 W/m2 (7 A). (b) 2132 W/m2 (9 A). (c) 3790 W/m2 (12 A).
Energies 15 00372 g004
Figure 5. Mean surface temperature profiles for all working fluids. The superhydrophobic region is 1.5 mm diameter. The imposed heat fluxes are: (a) 1290 W/m2 (7 A), (b) 2132 W/m2 (9 A), and (c) 3790 W/m2 (12 A).
Energies 15 00372 g005
Figure 6. Wall superheat versus dissipated heat flux. The superhydrophobic region is 1.5 mm in diameter.
Energies 15 00372 g006
Figure 7. Dissipated heat flux versus heat transfer coefficient. The superhydrophobic region is 1.5 mm in diameter.
Energies 15 00372 g007
Figure 8. Average dissipated heat flux for a nucleation time frame, for different imposed heat fluxes, using water and 3 wt% concentration Al2O3/water nanofluid. Multiple superhydrophobic spots configuration. (a) 1290 W/m2 (7 A). (b) 2132 W/m2 (9 A). (c) 3790 W/m2 (12 A).
Energies 15 00372 g008
Figure 9. Mean surface temperature profiles. Septuple superhydrophobic region with 1.5 mm diameter spots. The imposed heat fluxes are: (a) 1290 W/m2 (7 A), (b) 2132 W/m2 (9 A), and (c) 3790 W/m2 (12 A).
Energies 15 00372 g009
Figure 10. Wall superheat versus dissipated heat flux. Septuple superhydrophobic region with 1.5 mm diameter spots.
Energies 15 00372 g010
Figure 11. Dissipated heat flux versus heat transfer coefficient. Septuple superhydrophobic region with 1.5 mm diameter spots.
Energies 15 00372 g011
Table 1. Working fluids thermophysical properties at saturation temperature ( 373.15   K = 100   ° C ) and atmospheric pressure ( 1.013 × 10 5   Pa ).
Fluidρeff (kg/m3)Cp,eff (kJ/(kg·K))μeff (mPa·s)keff (W/(m·K))
water957.854.2170.2790.680
0.05 wt%958.234.2150.2790.680
0.5 wt%961.654.2000.2800.682
1 wt%965.474.1840.2810.685
1.5 wt%969.334.1670.2820.687
2 wt%973.214.1510.2830.690
2.5 wt%977.134.1340.2830.692
3 wt%981.074.1170.2840.695
Table 2. Power and heat flux values imposed by varying the current intensity.
I   ( A ) 357912
P   ( W ) 0.451.252.454.057.2
q ( W / m 2 ) 237658129021323790
Table 3. Equipment uncertainties.
EquipmentUncertainty
Scales±0.01 g, ±0.1 mg
OMEGA DYNE sensor ± 1.6 mbar
PID controller ± 1 °C
Power Supply ± 0.5 A
Type K thermocouples ± 0.5 °C
Theta Tensiometer ± 0.1 ° ,   ± 0.01 mN/m
Onca MWIR-InSb-320 camera ± 0.5 °C
Table 4. Thermophysical properties of the working fluids, at saturation temperature ( 373.15   K = 100   ° C ) and atmospheric pressure ( 1.013 × 10 5   Pa ).
Fluid ρ e f f   ( kg / m 3 ) C p , e f f   ( kJ / ( kg · K ) ) μ e f f   ( mPa · s ) k e f f   ( W / ( m · K ) )
water957.854.2170.2790.680
0.05 wt%958.234.2150.2790.680
0.5 wt%961.654.2000.2800.682
1 wt%965.474.1840.2810.685
1.5 wt%969.334.1670.2820.687
2 wt%973.214.1510.2830.690
2.5 wt%977.134.1340.2830.692
3 wt%981.074.1170.2840.695
Table 5. Mean surface tension of all working fluids at a temperature of 20 °C.
Before the Experimental TestAfter the Experimental Test
Fluid σ (mN/m) (SD) σ (mN/m) (SD)
water72.4(0.8)--
0.05 wt%72.8(0.5)71.0(0.3)
0.5 wt%73.4(0.7)70.7(1.4)
1 wt%71.7(0.8)70.4(3.8)
1.5 wt%68.7(1.0)71.4(2.1)
2 wt%69.7(0.5)67.7(0.7)
2.5 wt%72.2(0.7)72.1(1.1)
3 wt%70.4(0.3)73.2(0.6)
Table 6. Mean contact angles of all working fluids, for the hydrophilic and superhydrophobic regions, before the experimental test, at a temperature of 20 °C.
HydrophilicSuperhydrophobic
Fluid θ   ( ° ) (SD) θ   ( ° ) (SD) θ a   ( ° ) (SD) θ r   ( ° ) (SD) θ   ( ° )
water64.3(5.7)159.9(1.4)159.3(1.2)158.3(1.5)1.0
0.05 wt%77.3(3.8)156.5(0.6)158.5(0.3)158.6(1.0)0.1
0.5 wt%71.7(4.9)160.3(2.0)159.0(0.4)160.3(1.1)1.3
1 wt%82.5(5.8)156.9(0.7)158.3(0.2)160.4(1.8)2.1
1.5 wt%82.1(7.4)158.3(1.1)157.9(1.1)159.7(1.7)1.8
2 wt%84.8(5.8)160.6(3.6)159.5(3.5)157.6(1.3)1.9
2.5 wt%75.1(2.9)159.6(1.2)159.7(1.9)159.1(0.6)0.6
3 wt%64.4(7.3)160.7(2.0)159.9(0.9)159.4(0.5)0.5
Table 7. Mean contact angles of nanofluids, for the hydrophilic and superhydrophobic regions, after the experimental test, at a temperature of 20 °C.
HydrophilicSuperhydrophobic
Nanofluid θ (°)(SD) θ (°)(SD) θ a   ( ° ) (SD) θ r   ( ° ) (SD) θ   ( ° )
0.05 wt%57.8(2.1)159.7(2.0)160.4(1.6)159.2(1.0)1.2
0.5 wt%40.7(8.4)159.7(1.5)158.7(0.4)159.6(0.8)0.9
1 wt%50.8(8.8)156.9(1.7)157.8(1.7)158.6(1.4)0.8
1.5 wt%59.6(10.7)155.4(1.2)157.0(0.8)153.2(1.3)3.8
2 wt%54.6(12.2)155.7(1.7)155.9(0.2)155.0(1.5)0.9
2.5 wt%41.5(9.1)153.8(1.1)153.1(1.1)153.7(2.3)0.6
3 wt%37.5(11.4)156.4(3.6)155.9(1.7)155.2(1.1)0.7
Publisher’s Note: MDPI stays neutral with regard to jurisdictional claims in published maps and institutional affiliations.

