1. Introduction
Peak load means the maximum demand in a power system for a certain period. It can occur at any time depending on the required power of the system and can stay for a small proportion of the operating period. Due to the increasing number of electricity consumers, the peak demand is changing continuously for the power system around the world. Balancing the supply and demand during the peak periods is a key challenge for the power provider to ensure uninterrupted power flow [
1,
2,
3]. A grid-connected power system needs to purchase more electricity during the peak periods. Generally, the price of electricity during the peak periods is very high with respect to the off-peak periods. The price of electricity is directly imposed to the consumers which increases the monthly electricity bill. Power losses, power quality decreases, increasing generation cost, higher O&M cost, system frequency deviation etc., [
4,
5,
6] are some common issues arising during the peak periods.
The disparity of the base and peak demands for a small-scale power system i.e., isolated microgrid system are noticeable which results in unstable power reliability. At around a 90% load condition, a gas turbine generator can operate optimally. During the peak period, the conventional GTG operates below or above its optimum level. It results in more fuel consumption which can increase the power generation cost and decrease the fuel efficiency [
7]. During the peak periods, the transmission and distribution (T&D) of high generated power through the T&D line results in higher power losses which is not prospected for a small-scale power system.
To eliminate the mentioned constraints, the power system and the end-users should be opted the peak load shaving service. Peak load shaving can be achieved by associating the general capacity addition concepts [
8,
9] which are commonly used in power system. During the peak periods, the peak demand can be mitigated by operating a reserve generator where a gas-fired generator, a coal-fired generator, or a diesel generator can be used as a reserve generator. The installation cost of these types of generators are comparatively low but it increases the overall operation cost of the system [
10,
11]. The capacity addition technique causes several disadvantages including a higher rate of fuel consumption, increasing the power generation cost, and increasing the emission of carbon and other greenhouse gasses.
An IMG system is a limited capacity power system which has rarely been used with a peaking generator. The IMG system was developed to handle both base and peak demand to maintain the overall performance of the system [
12]. Implementation of the distributed resources (DR) such as, PV, wind generator, BESS, super capacitor, and flywheel is another technique to mitigate the peak demand. The handy devices can store the surplus power generated during the off-peak times and able to supply the stored energy to the loads when the demand profile stands with the peak times. Integration of electric vehicle (EV) to the power system and demand side management (DSM) are another two possible techniques for peak shaving application [
13]. Integrating EV is a very expensive and complex process because of the large number of parked EVs to deliver power during the peak periods. Integration of EV is also a challenging process because of the need to synchronize many electric vehicles for controlling the optimal charge-discharge operation. DSM is another difficult process because it requires proper maintenance and usages of the information and communications technology (ICT) infrastructure. Using ICT can increase the complexity of the system. The consumer may not obey the rules of the power provider, or the rules can hamper the comfort level of the end-users.
Considering the limitations of all the methods, integration of the hybrid PV-BESS system is a more suitable technique to achieve the peak demand reduction service. For optimal power sharing, a complete IMG model with hybrid PV-BESS system is required and for peak shaving application, a controlling algorithm to handle the optimal power sharing with battery storage is the primary requirement [
13]. This research tends to evaluate two different peak shaving techniques on their performance of peak reduction. The main contributions of this research are listed as follows:
This paper mainly presents a comparative analysis of a peak load shaving algorithm namely categorical variable decision tree algorithm (CVDTA) with the most common peak shaving technique namely the general capacity addition technique to evaluate the improved peak shaving performance.
This paper aims to find out the suitable peak shaving technique among them for practical implementation. A diesel engine generator is considered as a peaking generator for the capacity addition technique where the hybrid PV-BESS coupled system is regarded as a peak shaving apparatus for the CVDTA algorithm.
MATLAB/Simulink software is used to analyze the performance of the methods. Actual time-varying load data and the PV power generation data are used for simulation case studies.
The peak shaving techniques are validated for a real isolated microgrid system. Result reveals the effectiveness of the CVDTA algorithm which is more effective for peak minimization rather than the capacity addition technique.
This paper is organized as follows: An extensive literature assessment on existing peak load shaving strategies and the applications are provided (
Section 2). A comprehensive overview of decision tree algorithm including categorical variable decision tree algorithm is presented (
Section 3). The performance evaluation methods of this comparative study and the real-time data analysis with the IMG model are discussed (
Section 4). The simulation results and discussions of the CVDTA algorithm and the capacity addition technique with actual data are demonstrated (
Section 5). A comparative analysis between the CVDTA algorithm and the general capacity addition technique is presented to evaluate the updated operation (
Section 6). This research study is concluded with the key findings, and possible future directions are proposed (
Section 7).
2. Literature Review
Different peak shaving strategies have been found in existing literature with EV, DSM, DR, and peaking generator. A summary of some existing research can be found in
Table 1.
A non-linear programming method is proposed to achieve the peak shaving service with PV-BESS coupled system in [
14]. Two different load forecasting techniques are applied in this research where the inaccurate load forecasting and the seasonal weather changing lead to an unsuitable charge-discharge operation of BESS. These factors result in poor outcomes on peak shaving. A peak shaving approach is presented in [
15] for reducing the evening peak using PV and BESS. The technique is able to control the power sharing with BESS unit and can minimize the evening peak. The method is failed to handle multiple PV-BESS coupled systems. Another peak shaving method [
16] is proposed to deal with multiple PV-BESS system and the technique can minimize the evening peak. Hence, the strategy is unable to ensure the optimal use of PV system.
Two different methods for controlling the charging operation of EVs namely V1G and V2H have been proposed to minimize the demand profile [
17]. Both techniques can handle the charging operation with different scenarios of consumers and the power generations profiles. The methods can smooth the load profile by achieving the load minimization service. An online coordination algorithm is found in [
18] to analyze the charging impact of EV for peak minimization. The method requires less communication and maintenance to operate and achieve the peak shaving goal. Similar concept is discussed in ref. [
19].
A microgrid energy management technique with demand response for DSM to achieve the peak shaving service can be found in [
20]. Different controllable units with generation systems are considered with the research to secure the maximum benefit from the grid-tied microgrid system. The method can ensure the optimal management of the system and get the peak minimizing application. Another DSM algorithm [
21] for a grid-tied smart house is proposed to evaluate the possibility of smart communication. The renewable energy recourses are also considered in this research. Utilizing all the possibilities, the technique can enable economic benefit and smooth the operation of the system.
A peak shaving technique with diesel generator for commercial electricity consumers in Brazil can be found in [
8]. This study considered two different scenarios for the consumers in a Brazilian university. The technique with diesel generator is economically un-attractive for commercial usages. A sequential linear algorithm is proposed for a diesel generator to reduce the demand profile and monthly electricity bill in [
22]. The proposed technique can determine the suitable size of the peaking generator. Hence, it shows an issue with excessive use of diesel.
Table 1.
Summary of some existing research on peak shaving.
Table 1.
Summary of some existing research on peak shaving.
| Author | Technique Utilized | Limitation | Reference |
|---|
| E. Reihani et al. | Non-linear programming method | Inaccurate load forecasting and the seasonal weather changing lead to an unsuitable charge-discharge operation which result in poor outcomes on peak shaving. | [14] |
| R. A. Thokar et al. | Weighted sum approach with moth search optimization | This technique is failed to handle multiple PV-BESS coupled systems. | [15] |
| M. R. Jannesar et al. | Genetic algorithm with linear programing method | The strategy is unable to ensure the optimal use of PV system. | [16] |
| Y. Yao et al. | V1G and V2H Technique | First technique operates properly where the second technique is limited. Both are not feasible for IMG system for peak shaving application. | [17] |
| N. Leemput et al. | Peak shaving coordination algorithm | Due to the usages of limited data and knowledge of departure period, this method can affect on the peak shaving outcomes and cannot be reliable for practical use. | [18] |
| J. Shen et al. | EMS with demand response | This technique can deal with grid-tied power system whereas it is not practically feasible for IMG system. | [20] |
| A. Tascikaraoglu et al. | DSM control algorithm | This technique can handle the demand for grid-tied smart home system where it is limited and practically not feasible for IMG system. | [21] |
| B. Brkic et al. | Sequential linear program-based optimization algorithm | This technique can determine the appropriate size of peaking generator, but it is not economically feasible. | [22] |
The above investigation on the existing literature shows some possible strategies ap-plied for peak shaving application. Implementation of the hybrid PV-BESS system is more advantageous where the capacity addition technique (adding a peaking generator) is a common and simple method for peak shaving application [
23]. This research work tends to compare these two strategies to evaluate the improved operation of the peak shaving application.
3. Overview of Decision Tree Algorithm
A Decision Tree Algorithm (DTA) is a non-parametric supervised learning algorithm which is used for classification as well as prediction. Using if-then-else conditions, a decision tree algorithm learns desired results or curves analyzing the fed in data source. Based on the conditional depth, the decision tree algorithm becomes simpler or complex to develop as well as the designed model to evaluate the algorithm. A decision tree algorithm consists of mainly two nodes. Sometimes the number of nodes ca vary based on the conditions. The final result of this algorithm comes from the tree nodes as well as the leaf nodes. The tree nodes are also known as root nodes. Leaf nodes evaluate different classifications/decisions where the root nodes perform as a results predictor. Tree nodes (root nodes) are the one who give the calculational outcomes [
24]. This algorithm is able to process any stored data which contains of errors or missing values.
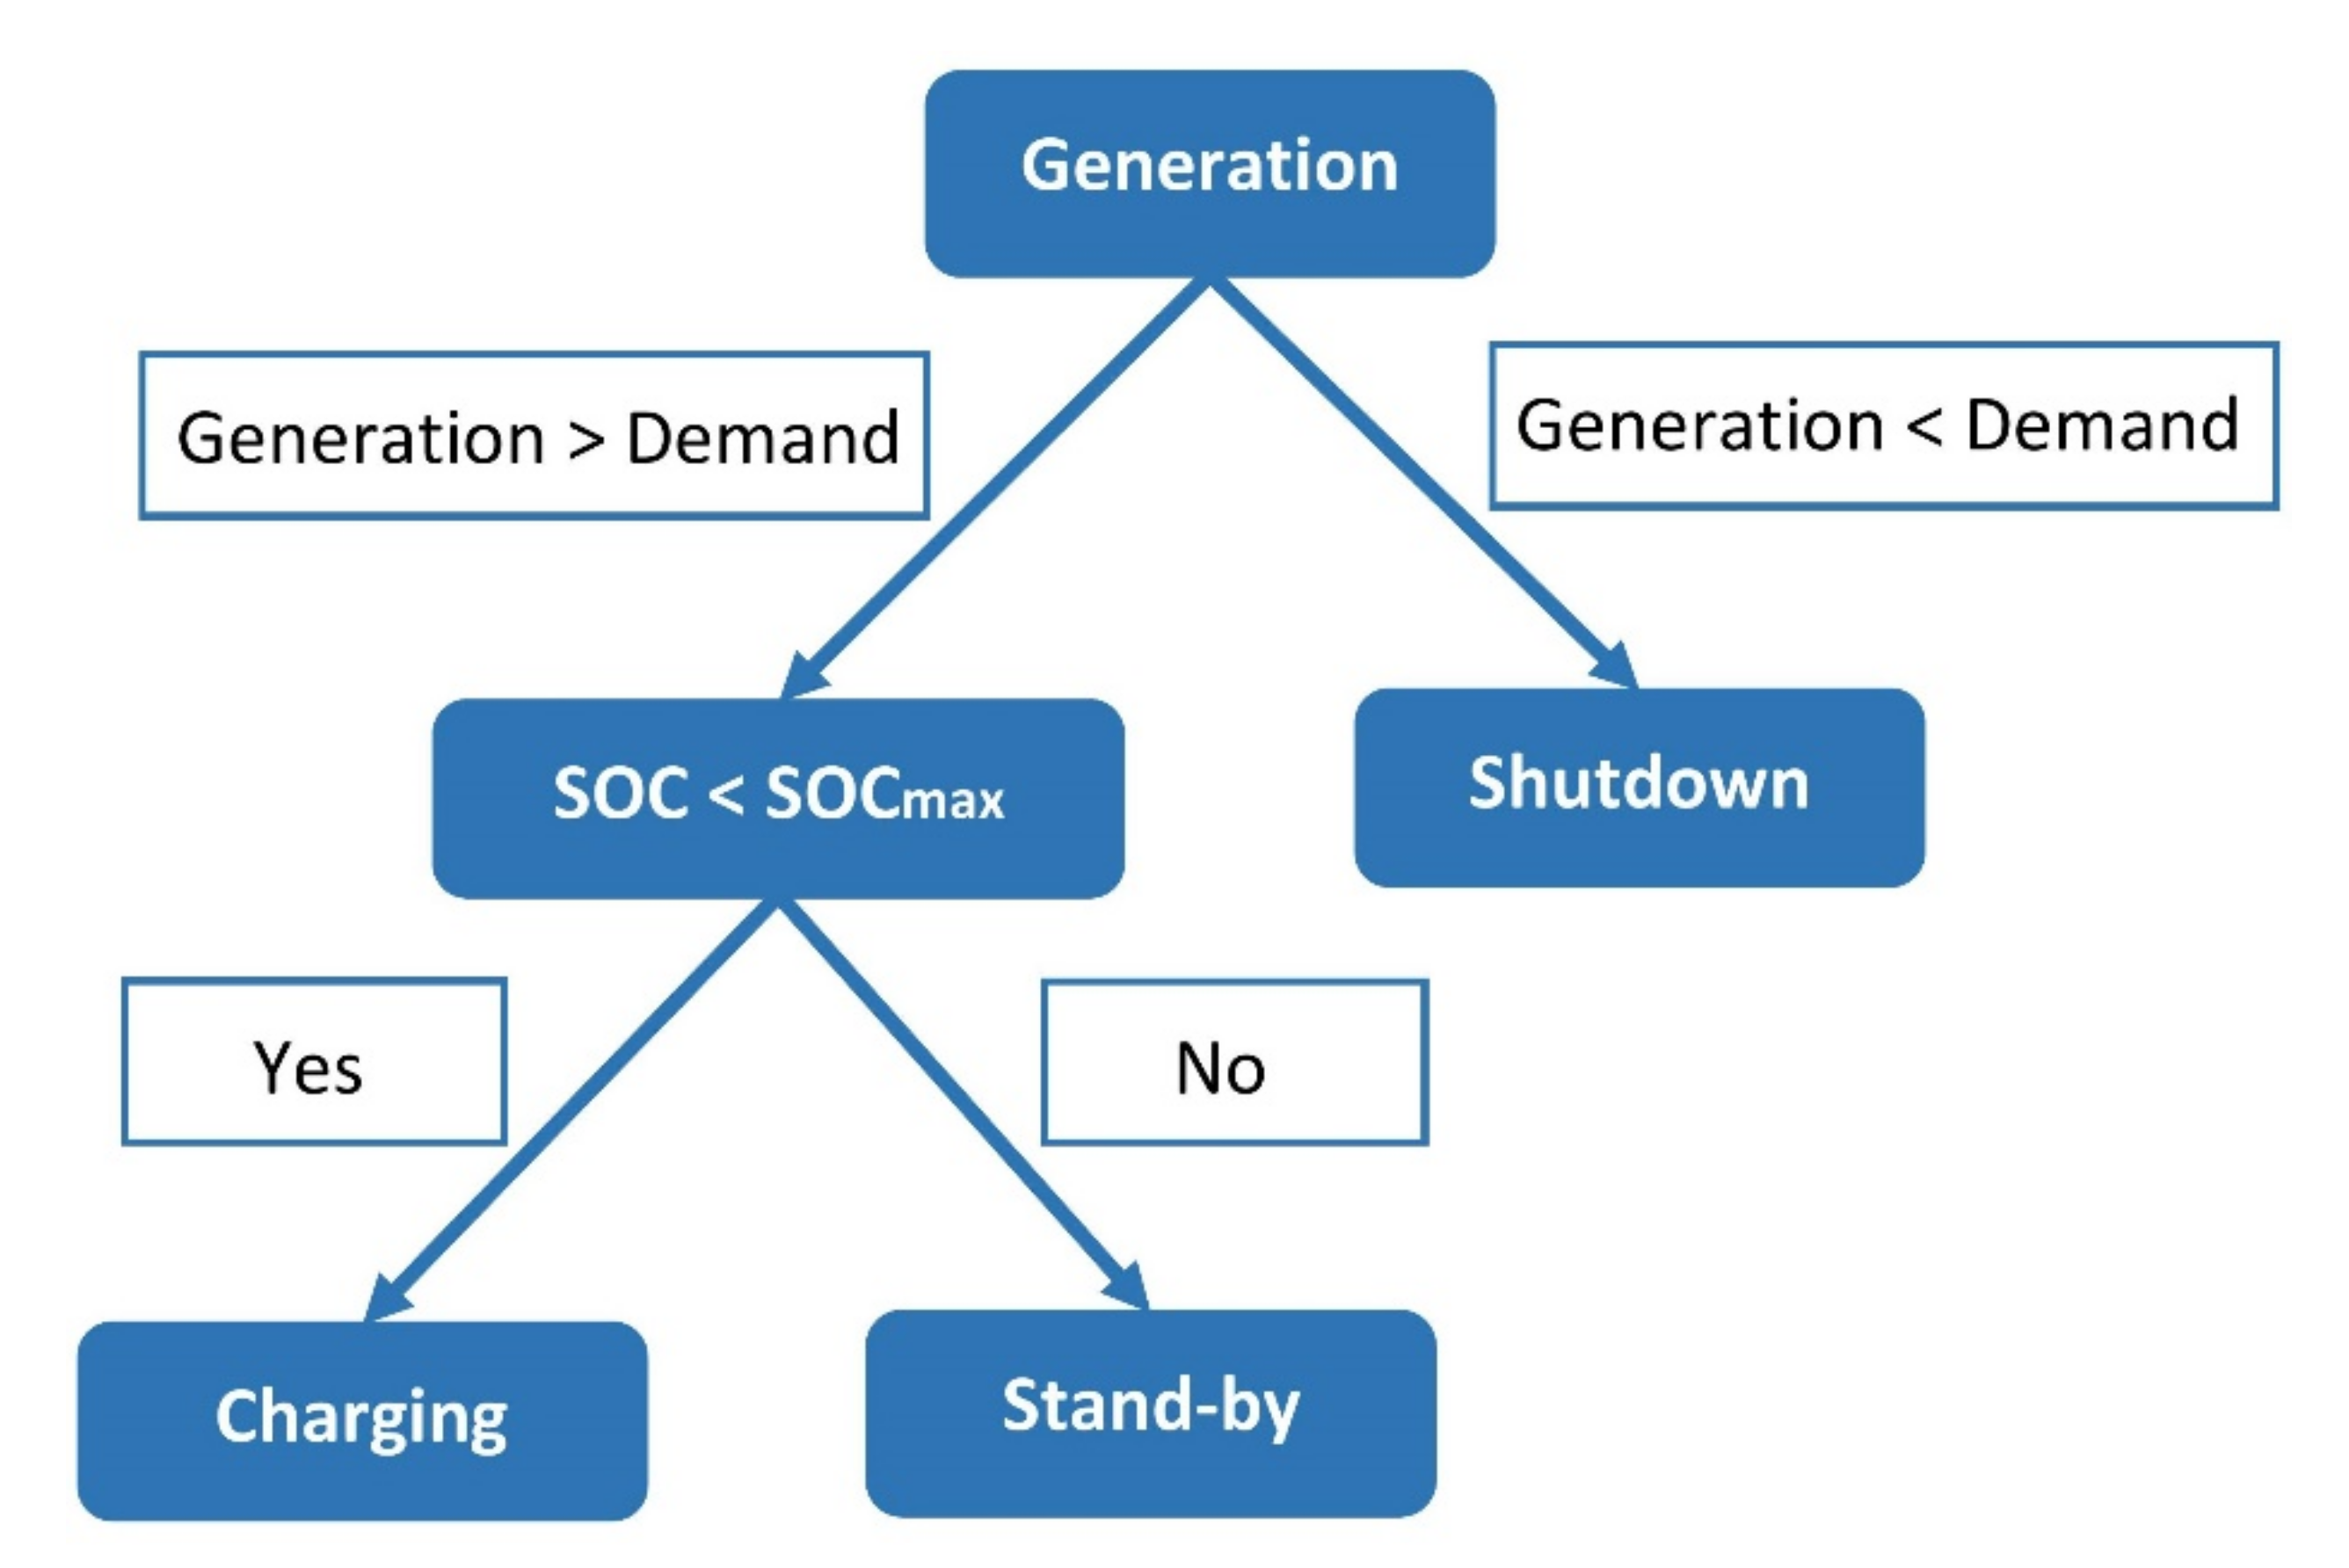
An example of a decision tree algorithm based on ref. [
25] is shown in
Figure 1. The decision tree algorithm is used to explore the charging operation of a battery storage system. The battery storage will start charging based on the generation power of the system and the demand profile. When the generation power is less than the demand of the system then the power system will motivate to shut down. On the other hand, when the generation is higher than the demand then the battery will absorb power from the system of will remain stand by based on the state of change (SOC) of the battery. The generation power, system demand, and SOC data are fed in database. Based on the database, the algorithm can easily detect and classify the system operation. Based on operational variables and operational conditions, this algorithm can be classified into various types.
3.1. Types of Decision Tree Algorithm
Decision tree algorithm can be classified based on operational variables and operational conditions. Different types of decision tree algorithm are presented in this section.
3.1.1. Based on Operational Condition
Based on operational conditions, decision tree algorithm is mainly four types [
25,
26] as follows:
ID3 decision tree algorithm: The abbreviation of ID3 is Iterative Dichotomiser 3. It is developed in 1986 and proposed by Ross Quinlan. Among the other decision tree algorithm, this ID3 decision tree algorithm is the simplest and most important. This algorithm builds a decision tree in a greedy manner by selecting the best characteristic that maximizes Information Gain or minimizes Entropy. This algorithm consists of understandable prediction which an important feature of this algorithm.
C4.5 decision tree algorithm: C4.5 decision tree algorithm is mainly used for classification of stored database. This algorithm is the updated algorithm of the ID3 decision tree algorithm. It can work with both categorical and continuous variables. Information gain is used to predict the accurate decision of this decision tree algorithm.
CART decision tree algorithm: CART stands for Classification and Regression Trees. Breiman developed the CART decision tree algorithm at first. This algorithm mainly explains the step to detect the outcomes of a variable based on the other variables. The algorithm has the ability to gain regression trees.
CHAID decision tree algorithm: CHAID stands for Chi-square Automatic Interaction Detector. This algorithm mainly discovers the relationship between categorical response variables with other categorical predictor variables. Gorden V Kass developed this algorithm at first in South Africa in 1980. This algorithm works according to adjusted significance testing which is also known as Bonferroni testing.
3.1.2. Based on Operational Variable
Based on the operational variable, the decision tree algorithm is mainly two types [
27,
28] as follows:
Categorical variable decision tree algorithm: A categorical variable decision tree algorithm consists of categorical target variables which divided into “yes or no” categories. The variables directly reflect the results into yes or no. The are no in between variables. It means this type of algorithm does not contain any assumptions. For example: Let A, B, and C represent three people. “A” took a loan from a bank and “B” is his friend. “C” is a banker who is responsible to collect the money from “A”. “C” directly comes to “A” and asks him whether he is able to pay the current instalment or not. “A” will directly answer whether he can pay the loan or not by “yes or no” condition. There is no consideration of “B”. This type of variable with a decision tree algorithm is defined as a categorical variable decision tree algorithm.
Continuous variable decision tree algorithm: A continuous variable decision tree algorithm consists of continuous target variables where assumption is considered. The decision of the algorithm depends in between variables with “yes or no”. For example: Let A, B and C represent three people. “A” took a loan from a bank and “B” is his friend. “C” is a banker who is responsible to collect the money from “A”. “C” will not directly come to “A”. “C” will come to “B” and ask about the financial condition of “A” whether he is able to pay the loan or not. “B” will give some explanation about the financial condition of “A”. Based on the explanation of “B”, “C” will assume a statement that “A” could pay the loan or “A” could not pay the loan. Here, some assumption has been considered to get to the final decision. This type of variable with a decision tree algorithm is defined as a continuous variable decision tree algorithm.
4. Performance Evaluation Method
The categorical variable based decision tree algorithm is a decision tree-based algorithm where all the variables are defined and it makes a decision based on the isolated microgrid system requirements. The peak shaving approach is to minimize the demand profile based on the power generation of the system and the demand profile in a certain period. The decision tree algorithm is a suitable technique to minimize the peak demand which can perform the peak smoothing operation based on the power system consequences. A real microgrid system is considered in this research where the used data are actual and collected from a real microgrid system. The proposed categorical variable decision tree algorithm consists of significant advantages for peak shaving application. It requires less effort to prepare the data during the pre-processing. If few sets of data miss from the data table, this algorithm does not affect the optimal operation. The embodiment of the algorithm with the simulation model is intuitive and easy to understand as well as explain. The decision tree algorithm can provide almost accurate results compared with others on peak shaving application. Considering the advantages, CVDTA is taken under consideration for peak load shaving as a new strategy. Besides it, the existing most common and popular peaks shaving technique namely the general capacity addition technique is considered for comparing the CVDTA algorithm because to validate the improved operation. The other existing algorithms are not considered to compare with the CVDTA technique because this research aims to open a gateway for innovation in peak shaving application for IMG system. The major target of this research is to come out from the conventional capacity addition technique along with the other existing algorithms to a new approach for peak minimization.
This section presents a comprehensive description of the peak shaving algorithm (CVDTA) and the general capacity addition technique. The operating conditions of these methods are discussed elaborately with proper example. Data collection and interpretation with the designed model are also presented in this section.
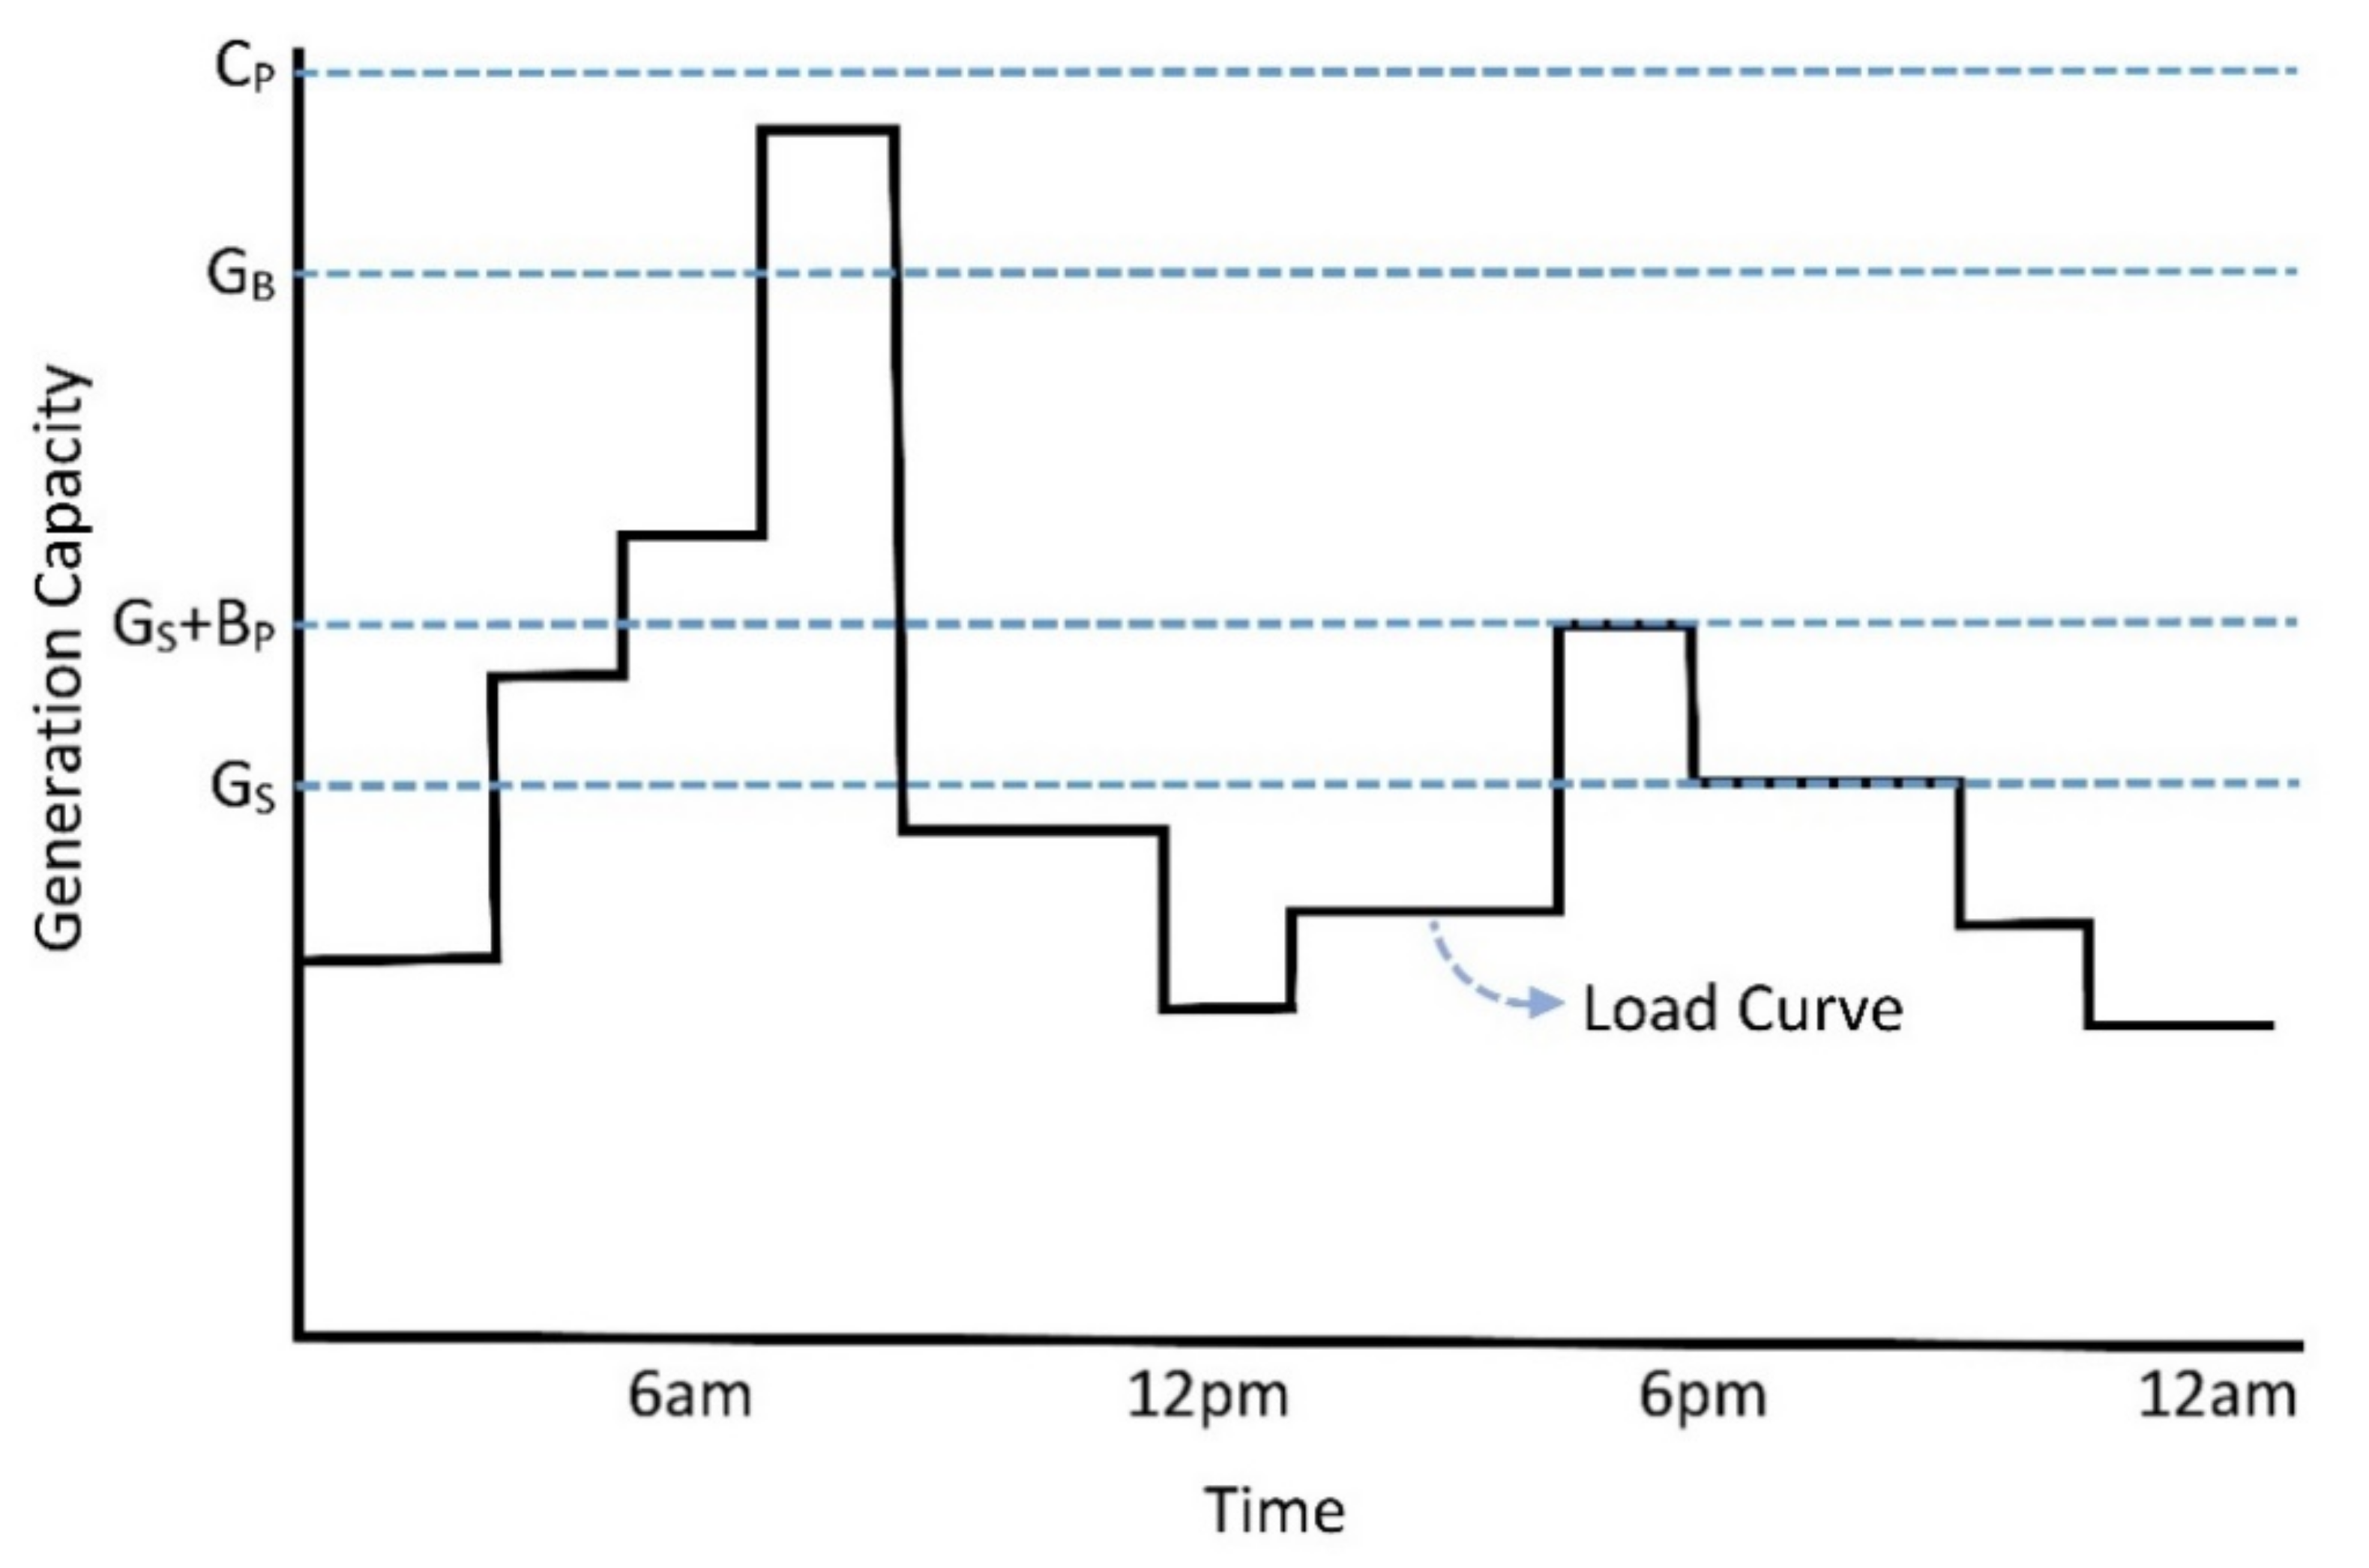
4.1. Peak Shaving Technique: Categorical Variable Decision Tree Algorithm
The categorical variable decision tree algorithm (CVDTA) can be found in [
13] where the operating techniques are discussed in detail hence the comparative analysis with the capacity addition technique is not investigated. The CVDTA algorithm can deal with the hybrid PV-BESS system. It consists of two different operational loops (Loop A and B) where Loop B works with PV generation and Loop A works without PV generation. Both operational loops have four different operational modes according to some mathematical conditions. Two operational modes (operational mode 2 and 4) control the charging operation and other two operational modes (operational mode 1 and 3) control the discharging operation of BESS unit. Graphical view of various operational modes with the operation periods of the proposed algorithm are shown in
Figure 2. Various operational modes with the operational conditions of the proposed algorithm are recorded in
Table 2.
Let,
= The installed capacity of IMG system.
= The demand of the IMG system.
= The optimum generation power of two GTGs.
= The optimum generation power of primary GTG.
= The output power from the BESS unit.
= The output power from the PV unit.
Operational mode 1: For the operational mode 1, when is true, the required extra power will be delivered from the PV generation unit. If PV power generation is not sufficient, the BESS will be allowed to discharge power to meet the demand and the second generator will be turn on.
Operational mode 2: For the operational mode 2, when is true, the BESS will be allowed to absorb power from the system, and the PV unit will operate with the primary GTG. This time, the second generator can be turn off or can be turn on based on the power generation of PV unit and the demand profile of the system.
Operational mode 3: For the operational mode 3, when is true, the required excess power will be delivered from the PV unit. If the PV power generation is not sufficient, the BESS will be allowed to inject power to meet the demand and the second generator will be turn off.
Operational mode 4: For the operational mode 4, when is true, the PV unit will be operated with the primary generator and the BESS unit will be absorbed power from the system. This time, the second generator can be turn off.
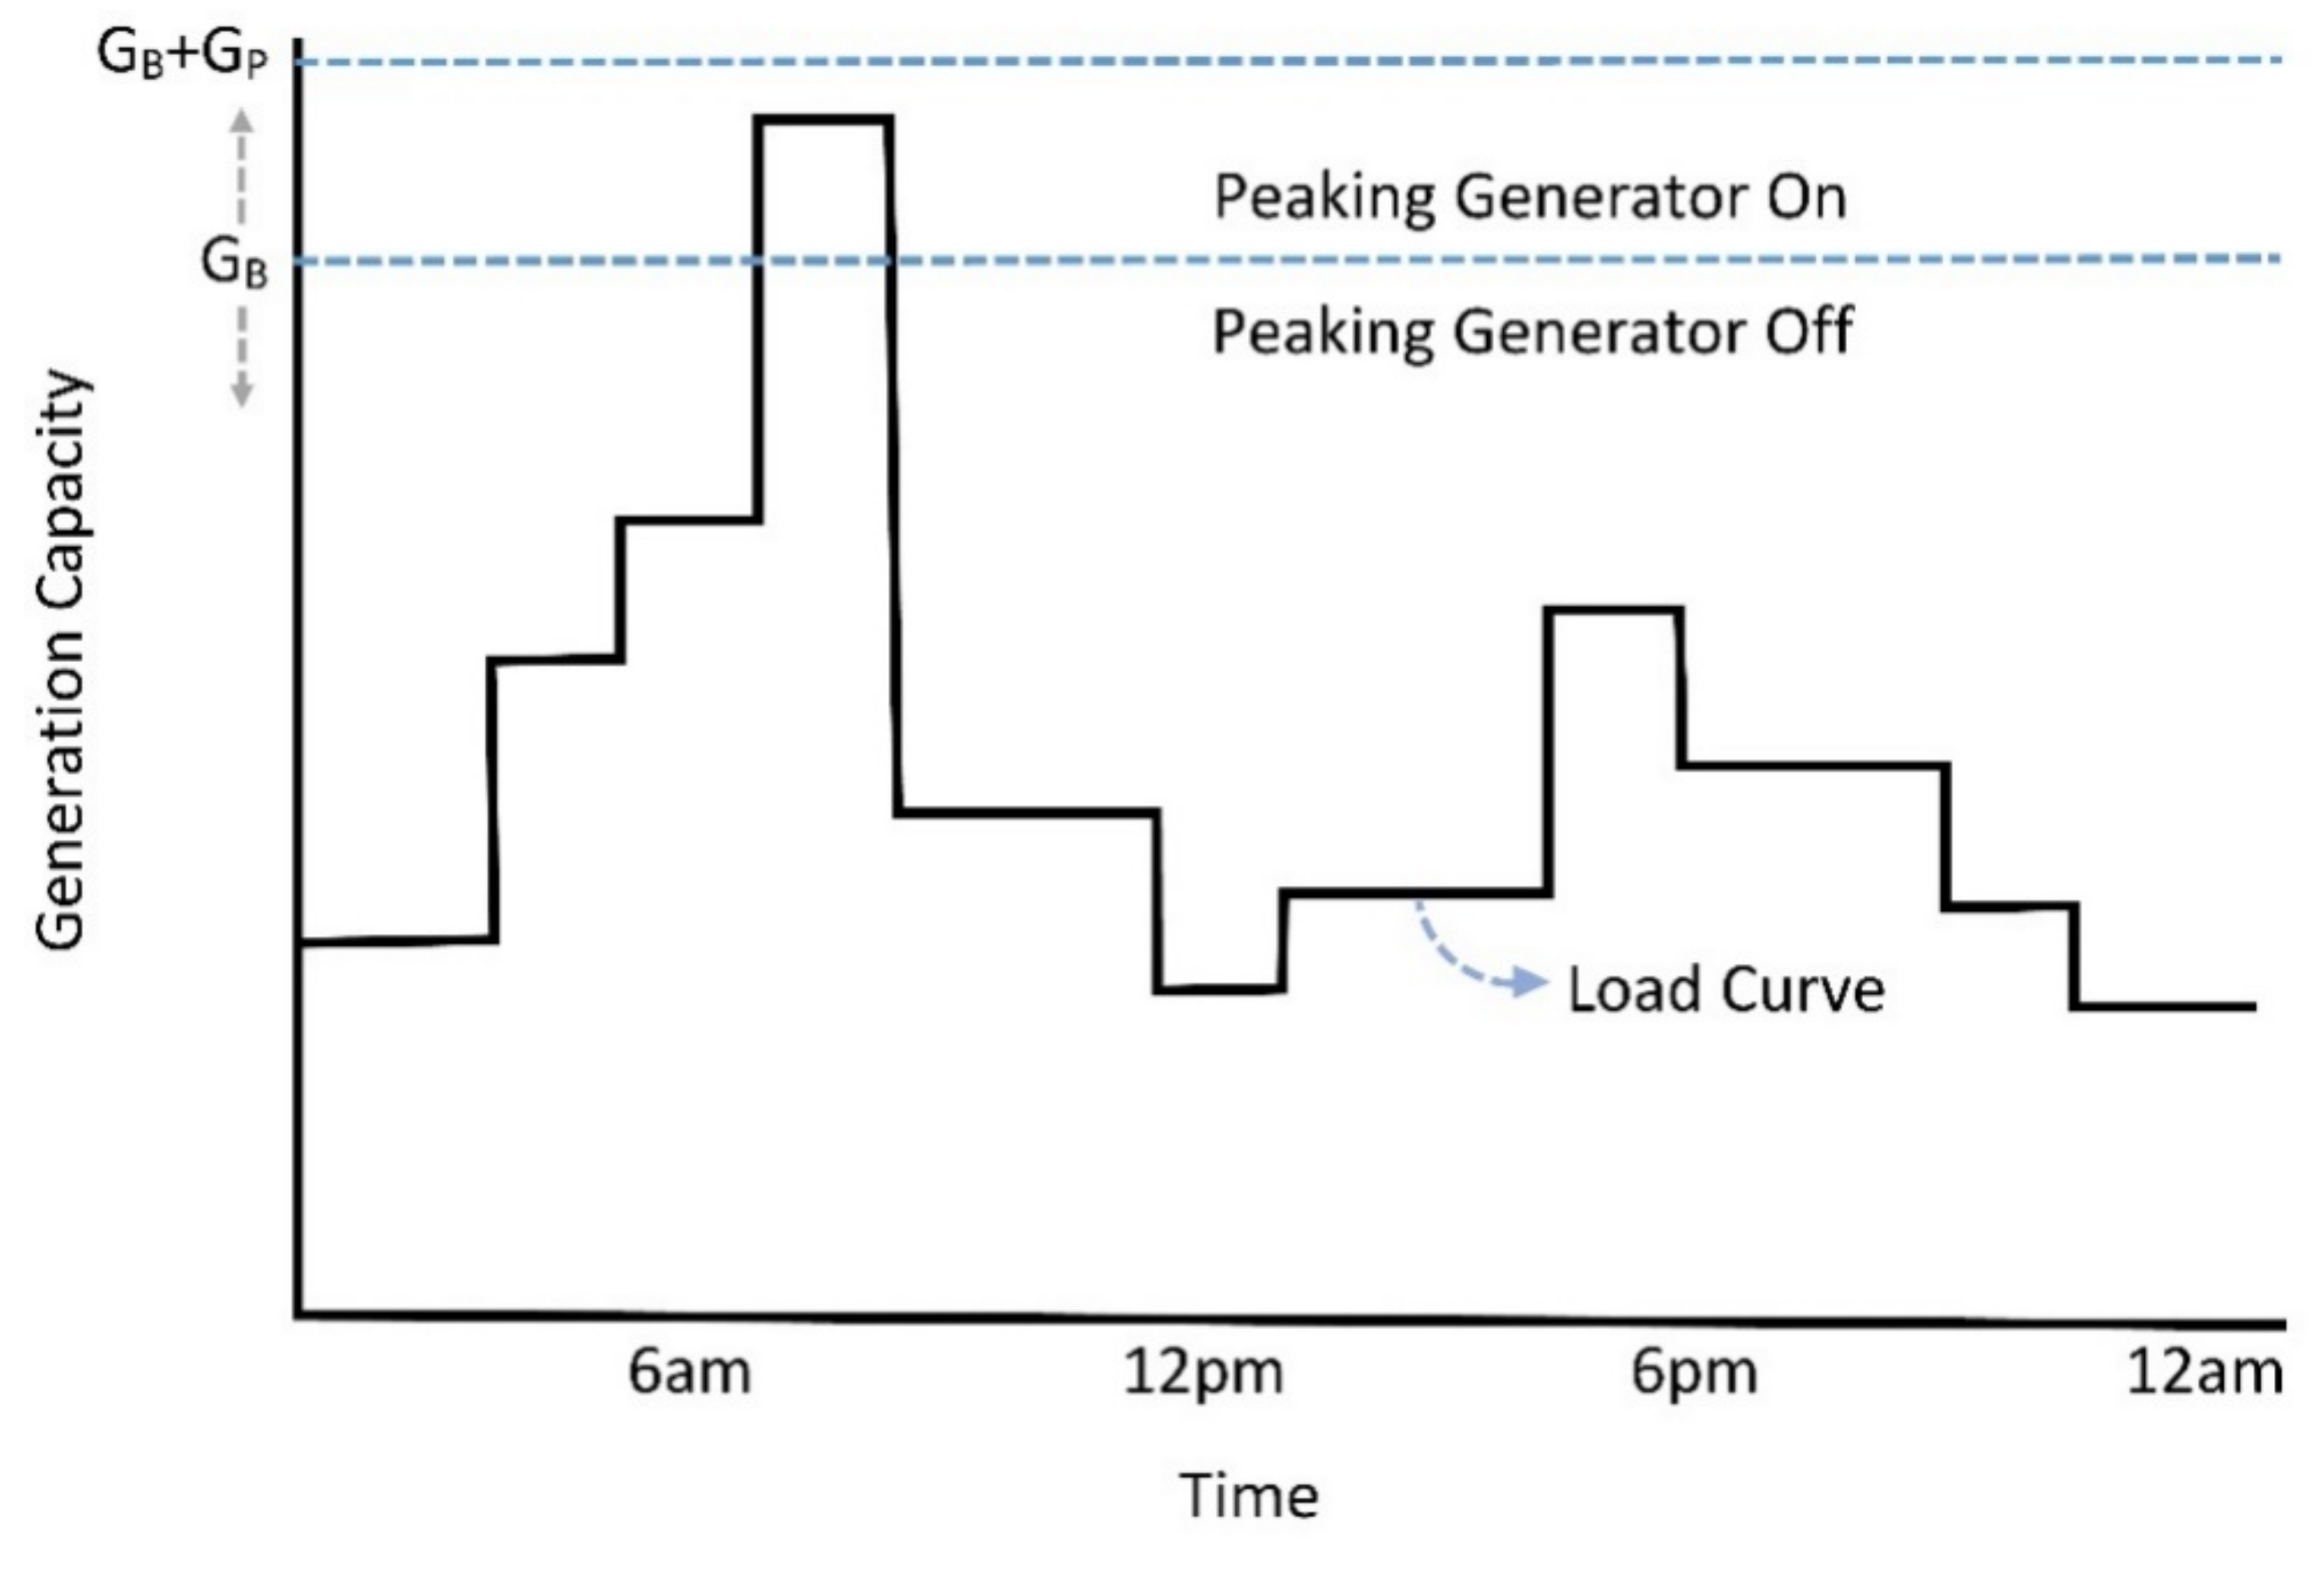
4.2. Peak Shaving Technique: General Capacity Addition Technique
The general capacity addition technique is commonly used in the power system because this technique is easier to operate and control. Using diesel engine generator, the peak minimization technique can be found in [
8,
9,
22]. This strategy operates under two different operational phases and the operational phases with the operation periods are shown in
Figure 3. The operational procedure is straightforward and simple. When the peak demand is appeared, the peaking generator will be turn on to supply power. The operational conditions for different operational phases of the general capacity addition technique are recorded in
Table 3.
Let,
= The demand of the IMG system.
= The optimum generation power of two GTGs.
= The generation power of the peaking generator.
First operational phase: For the first operational phase, when is true, the peaking generator will be turn-on to supply the required extra power to minimize the demand profile. In this operating phase, the peaking generator will operate along with both GTGs.
Second operational phase: For the second operational phase, when is true, the peaking generator will be turn-off. In this operating phase, only the GTGs will be operated together to supply power to the loads.
4.3. Data Analysis and IMG Model Description
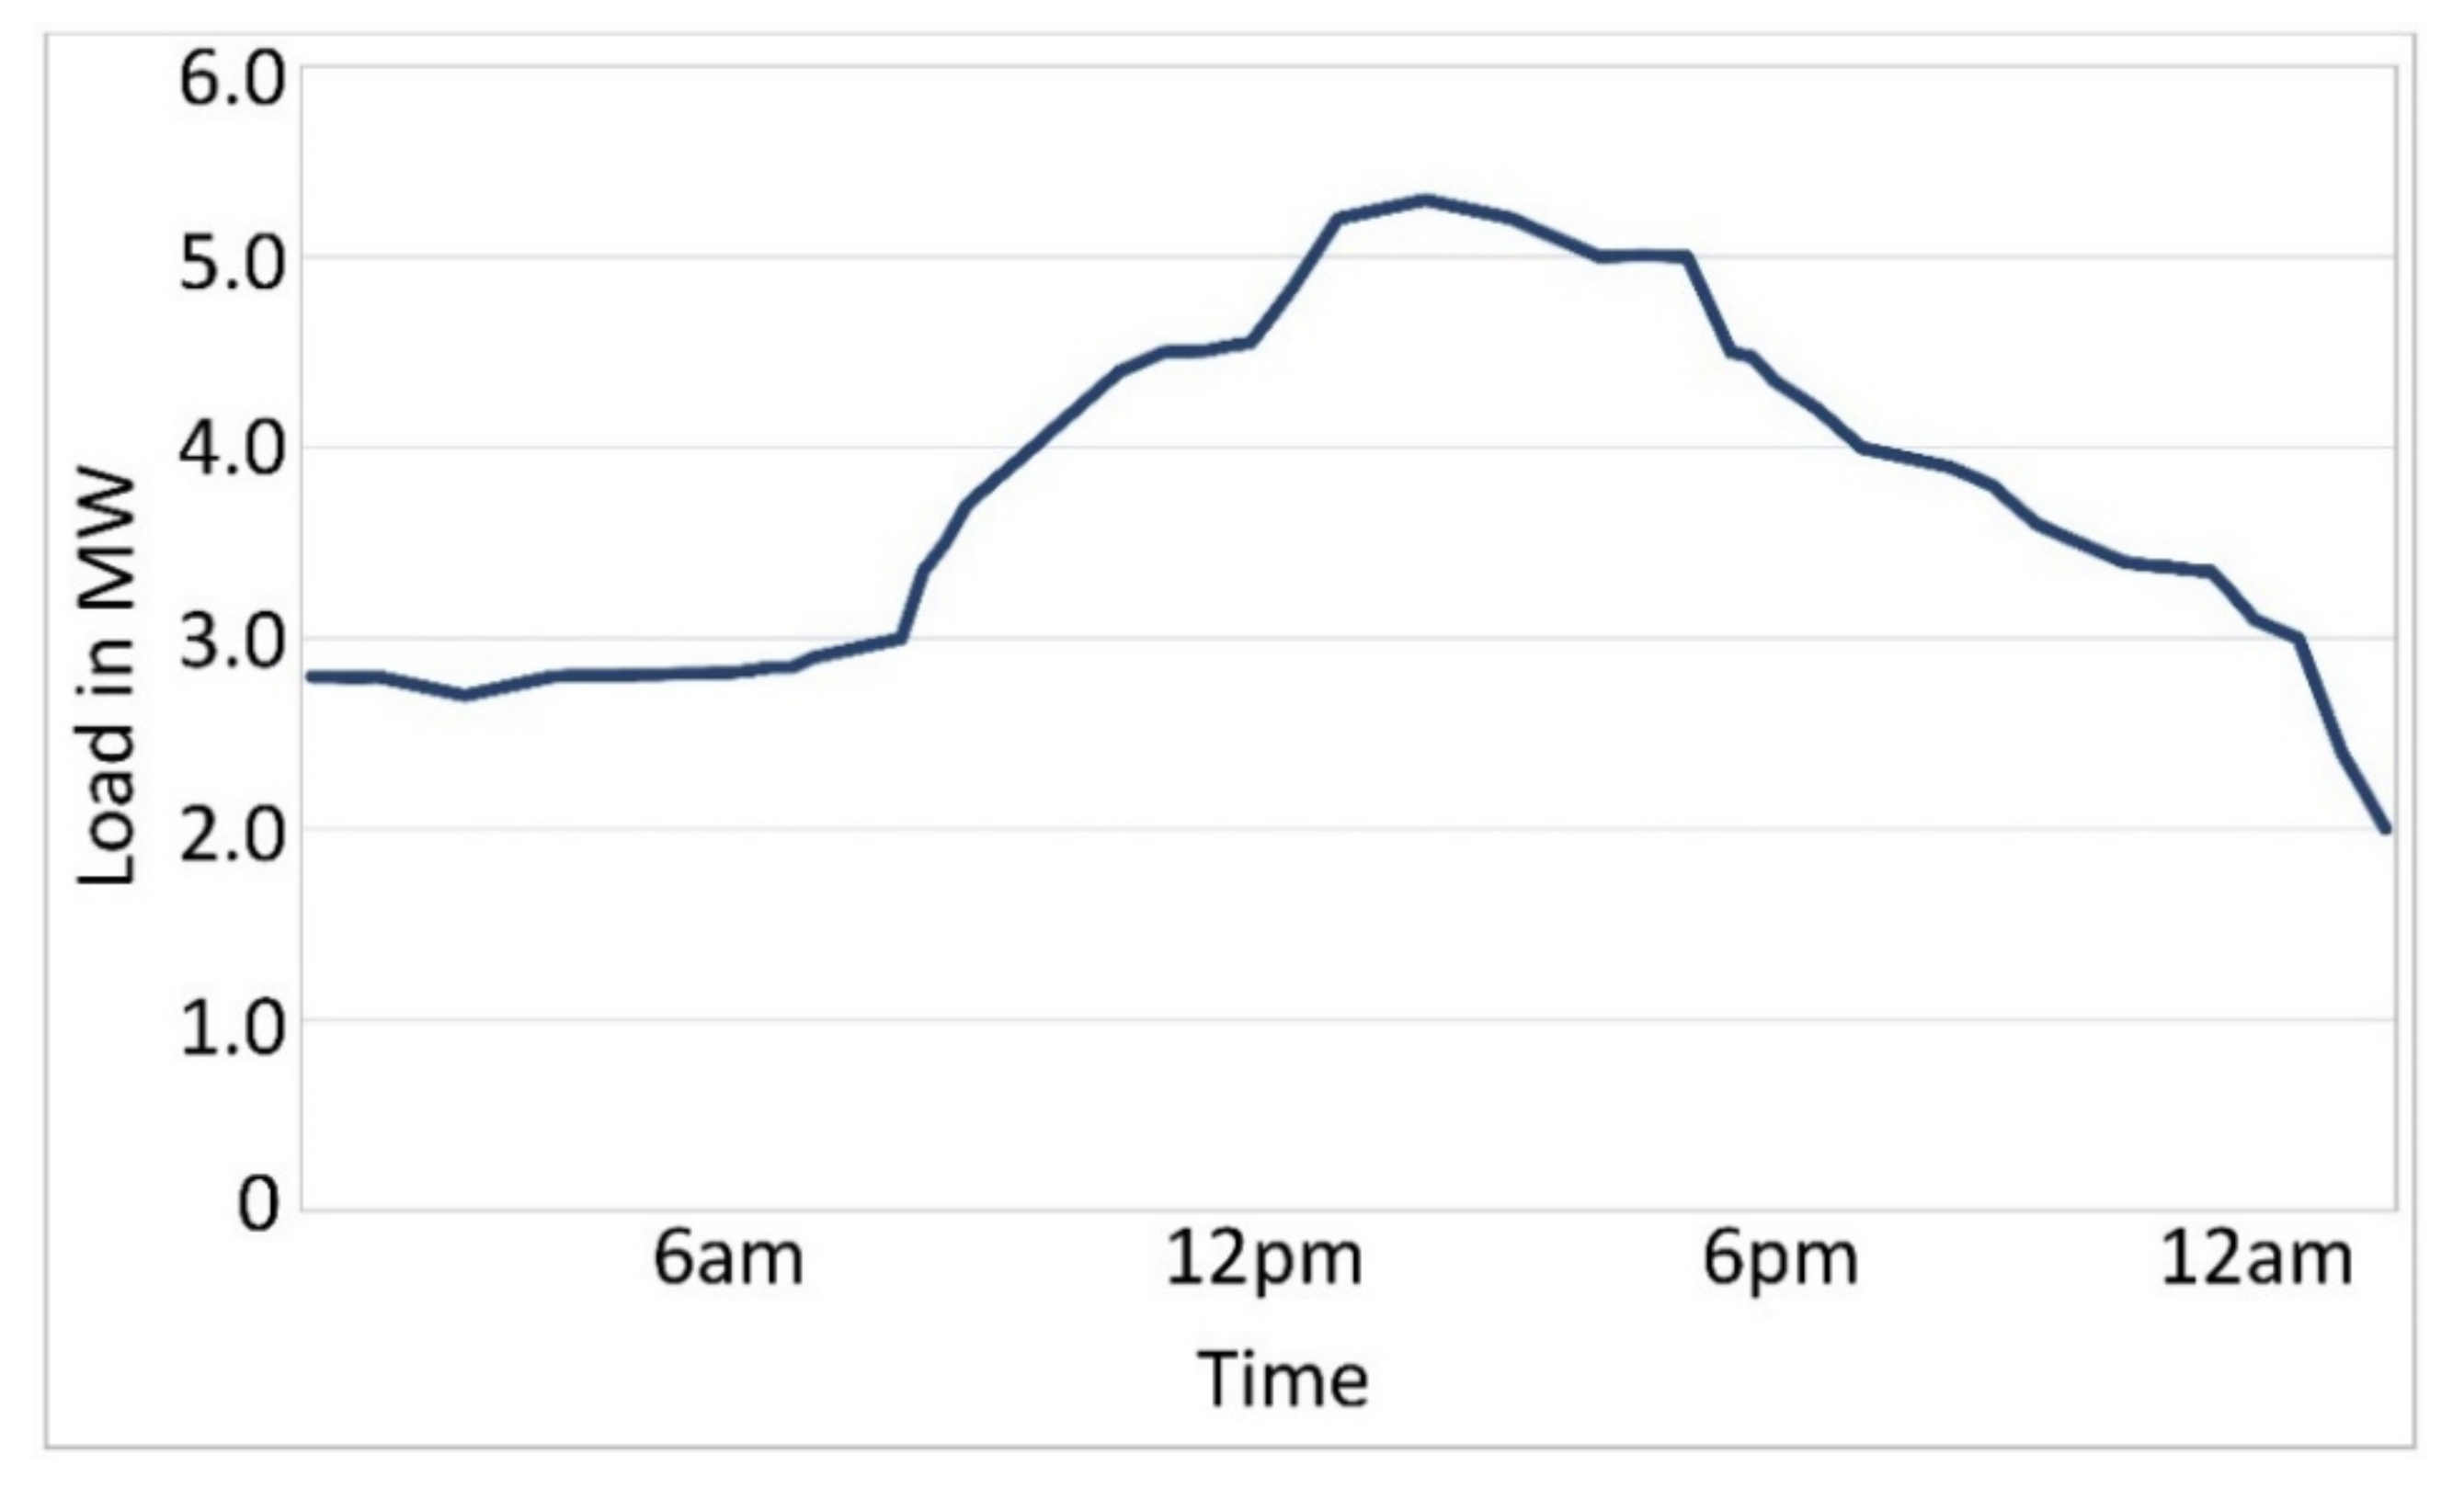
The data collection and interpretation are performed to conduct the simulation case studies for the comparative analysis. The actual time-varying load data and the actual PV power propagation data are collected from the test isolated microgrid system. The variable load data is shown in
Figure 4. The load data represents a semester break load profile for the test IMG system and the load profile changes according to the activities during operating hours. The maximum demand for semester break load profile is around 5.3 MW. From 8 a.m. to 9 a.m. and 5:30 p.m. to 7:30 p.m., the load profile varies from 3.8 MW to 4.2 MW. These periods are considered as the morning and the evening peak periods of the test microgrid system. After the morning peak period, the demand profile starts increasing gradually and around at 1 pm it reaches at the maximum point. After the maximum demand, the demand profile starts decreasing gradually.
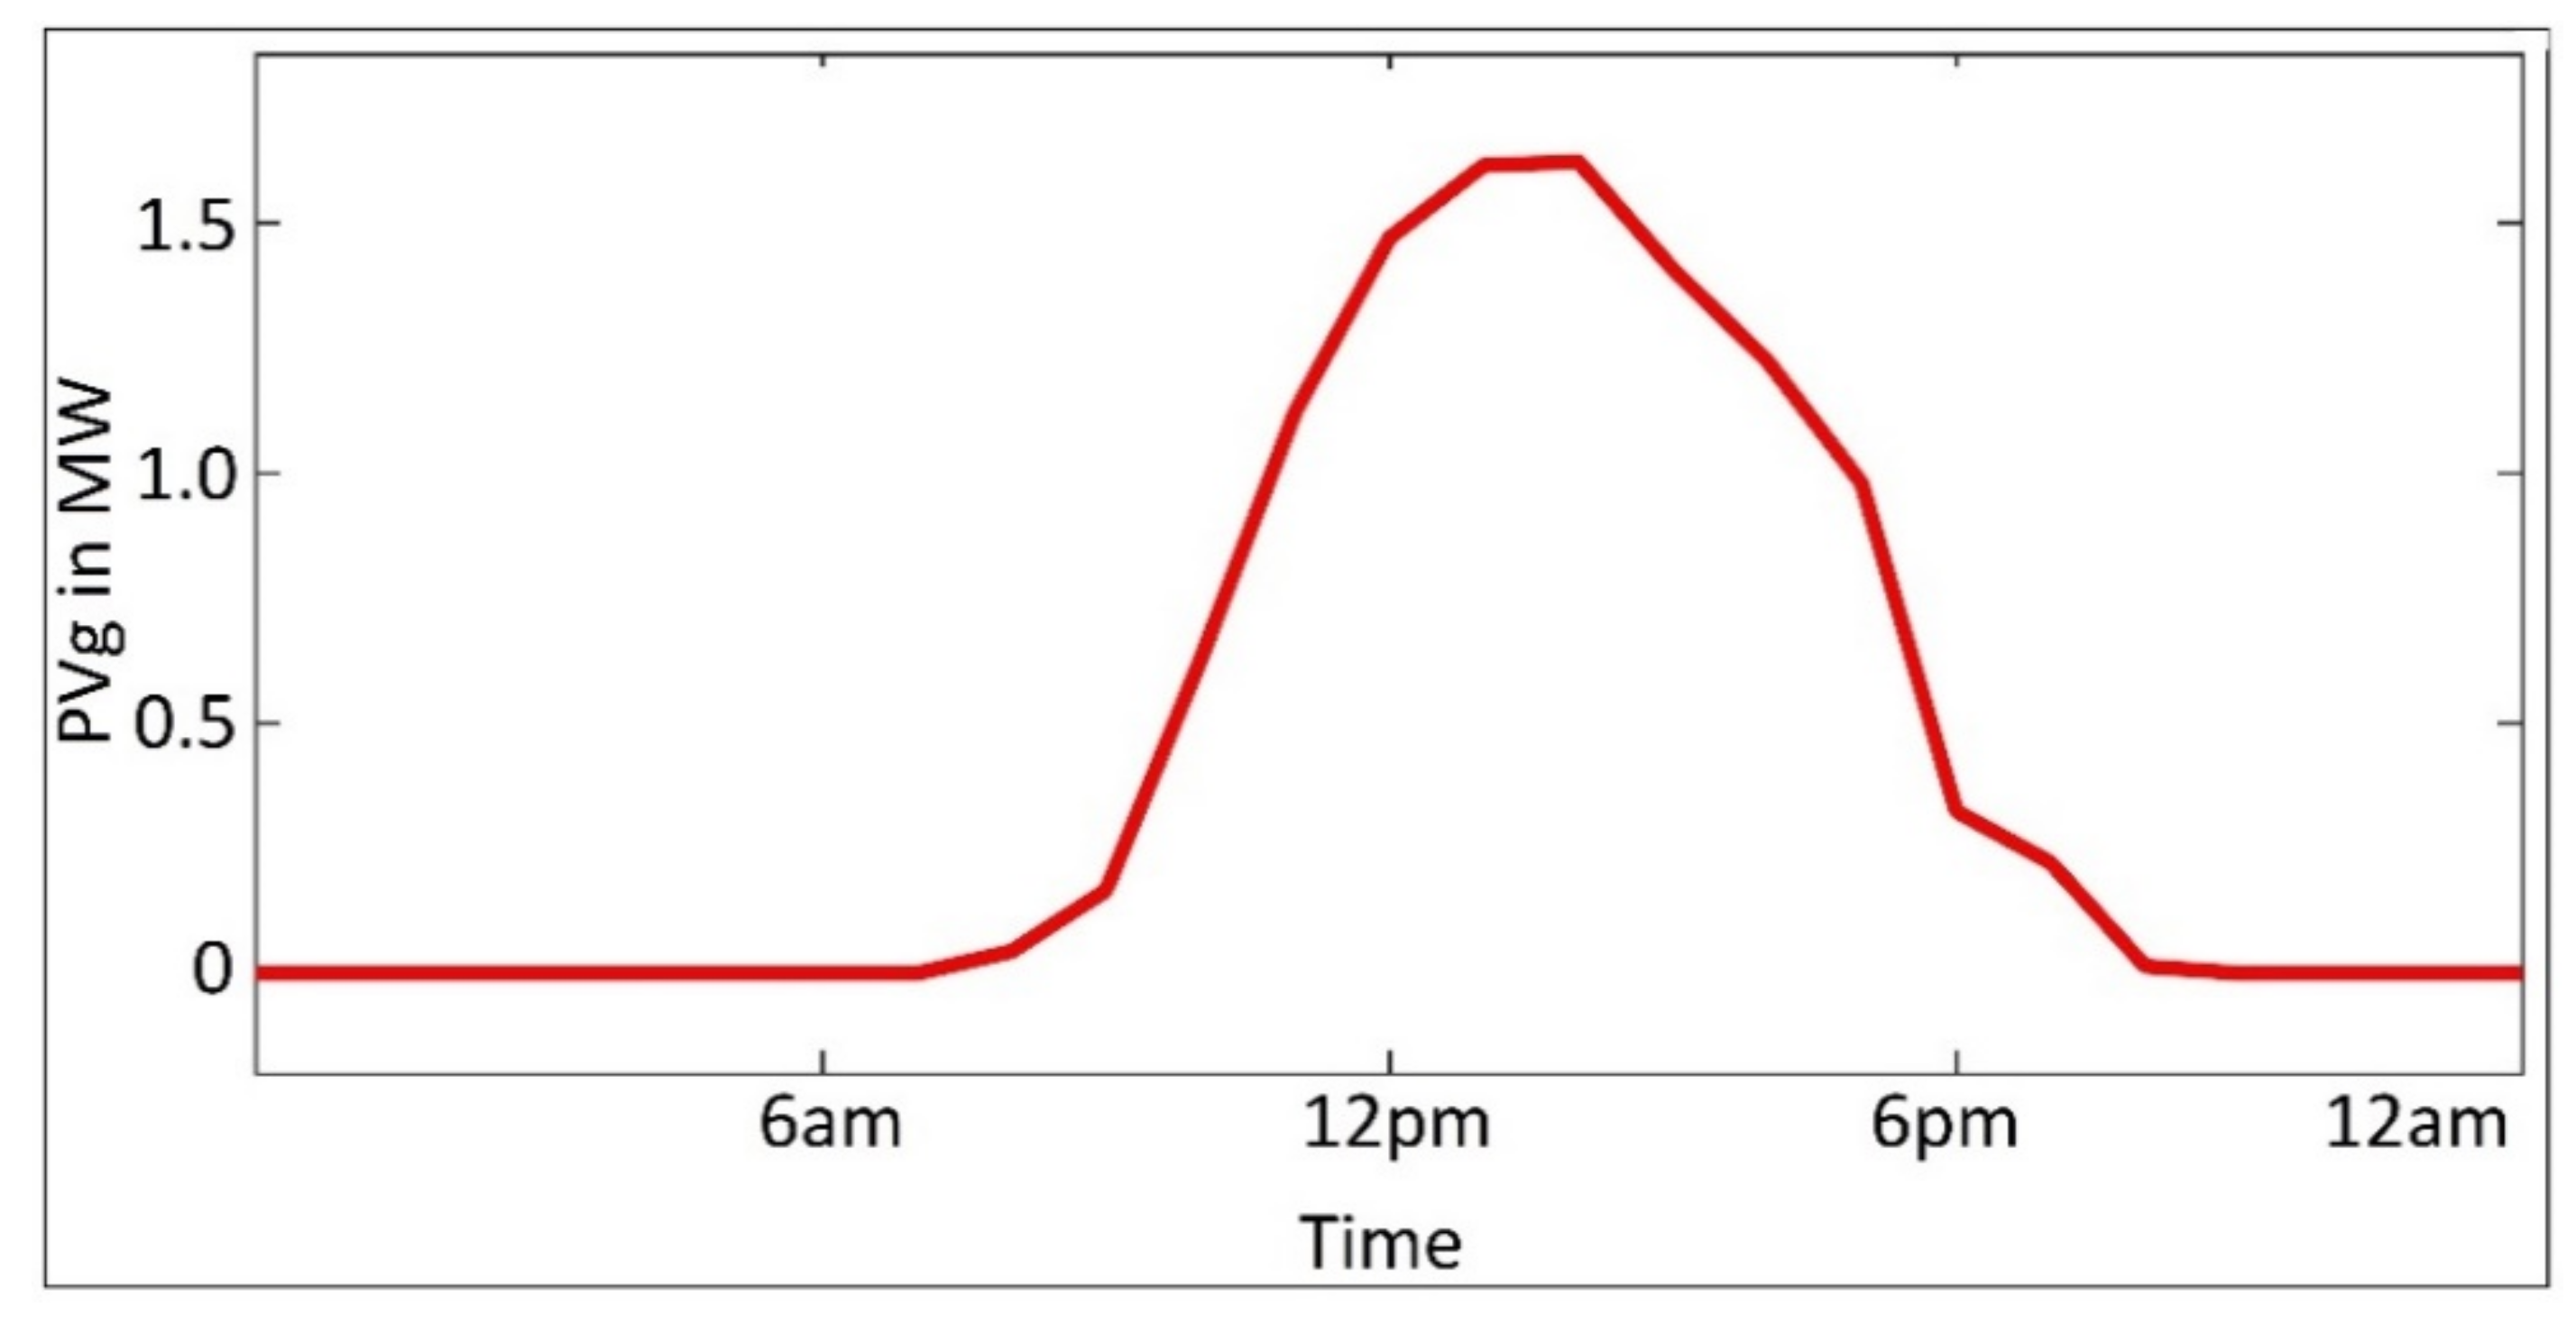
The average data for PV generation is considered in this study which is calculated based on the three years actual data, and it is shown in
Figure 5.
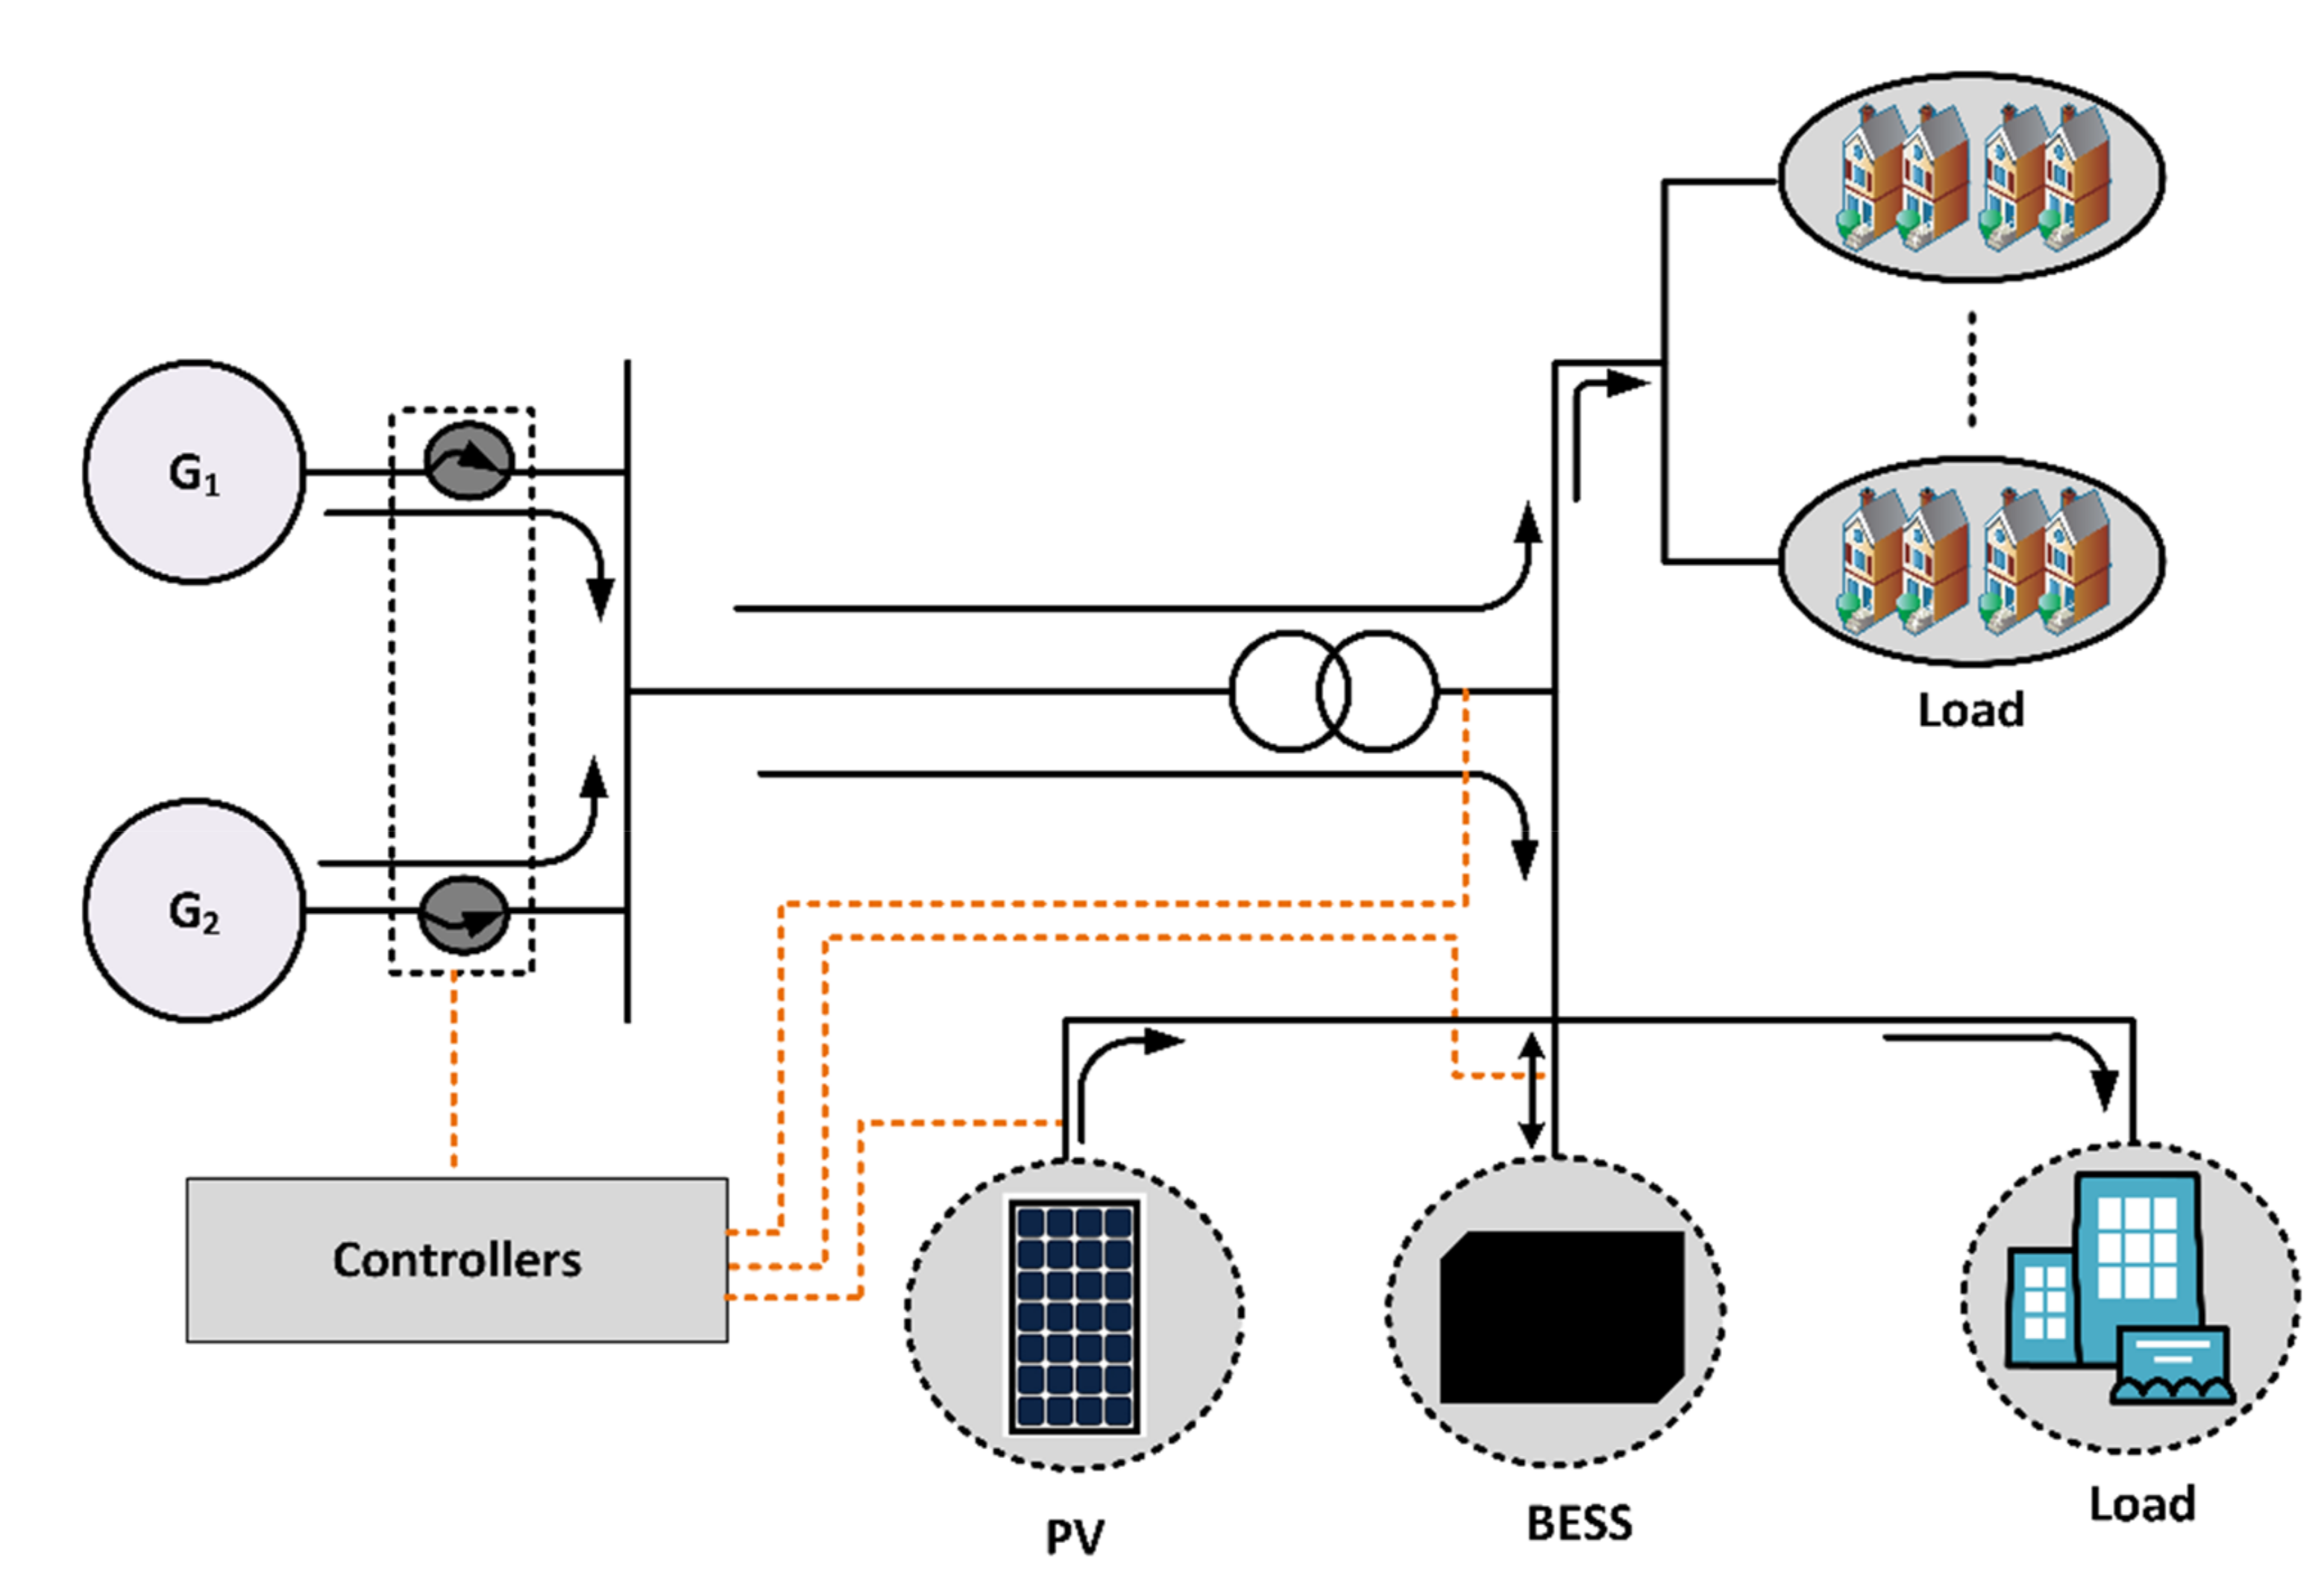
The test microgrid system consists of two GTGs which have 4.2 MW rated power capacity. The details of MATLAB/Simulink model to investigate the proposed algorithm can be found in [
29]. A schematic diagram of a developed IMG model with photovoltaic and battery storage system is shown in
Figure 6. The model consists of four major sub-models namely PV, BESS, variable load profile and GTG dispatch models. The PV unit is considered as 2 MW and two PV modules are connected in parallel to get the required power. The maximum power point tracking (MPPT) DC/AC converter with ripple compensating filter is connected to each PV module where the converters having same properties. Modified current controlled perturb and observe (P&O) algorithm is applied with the MPPT converter to achieve the maximum output power from the PV unit. The BESS unit is considered as 400 kW which operates for 2 h and 15 min. A bidirectional converter and a charge-discharge controlling model are connected to the BESS unit to maintain the power system requirements. The variable load model is designed with three phase load block and timer is associated with the load block. The pulse from the timer block results in the load changing time to time. An economic generation dispatch model is designed based on the demand profile and the generation power. Mathematical relational operators are used to design the GTG dispatch model. For the capacity addition technique, the diesel generator is considered as 800 kW because the difference between the installed capacity of IMG system (8.4 MW) and the optimum generation capacity of the two GTGs (7.6 MW) is 800 kW.
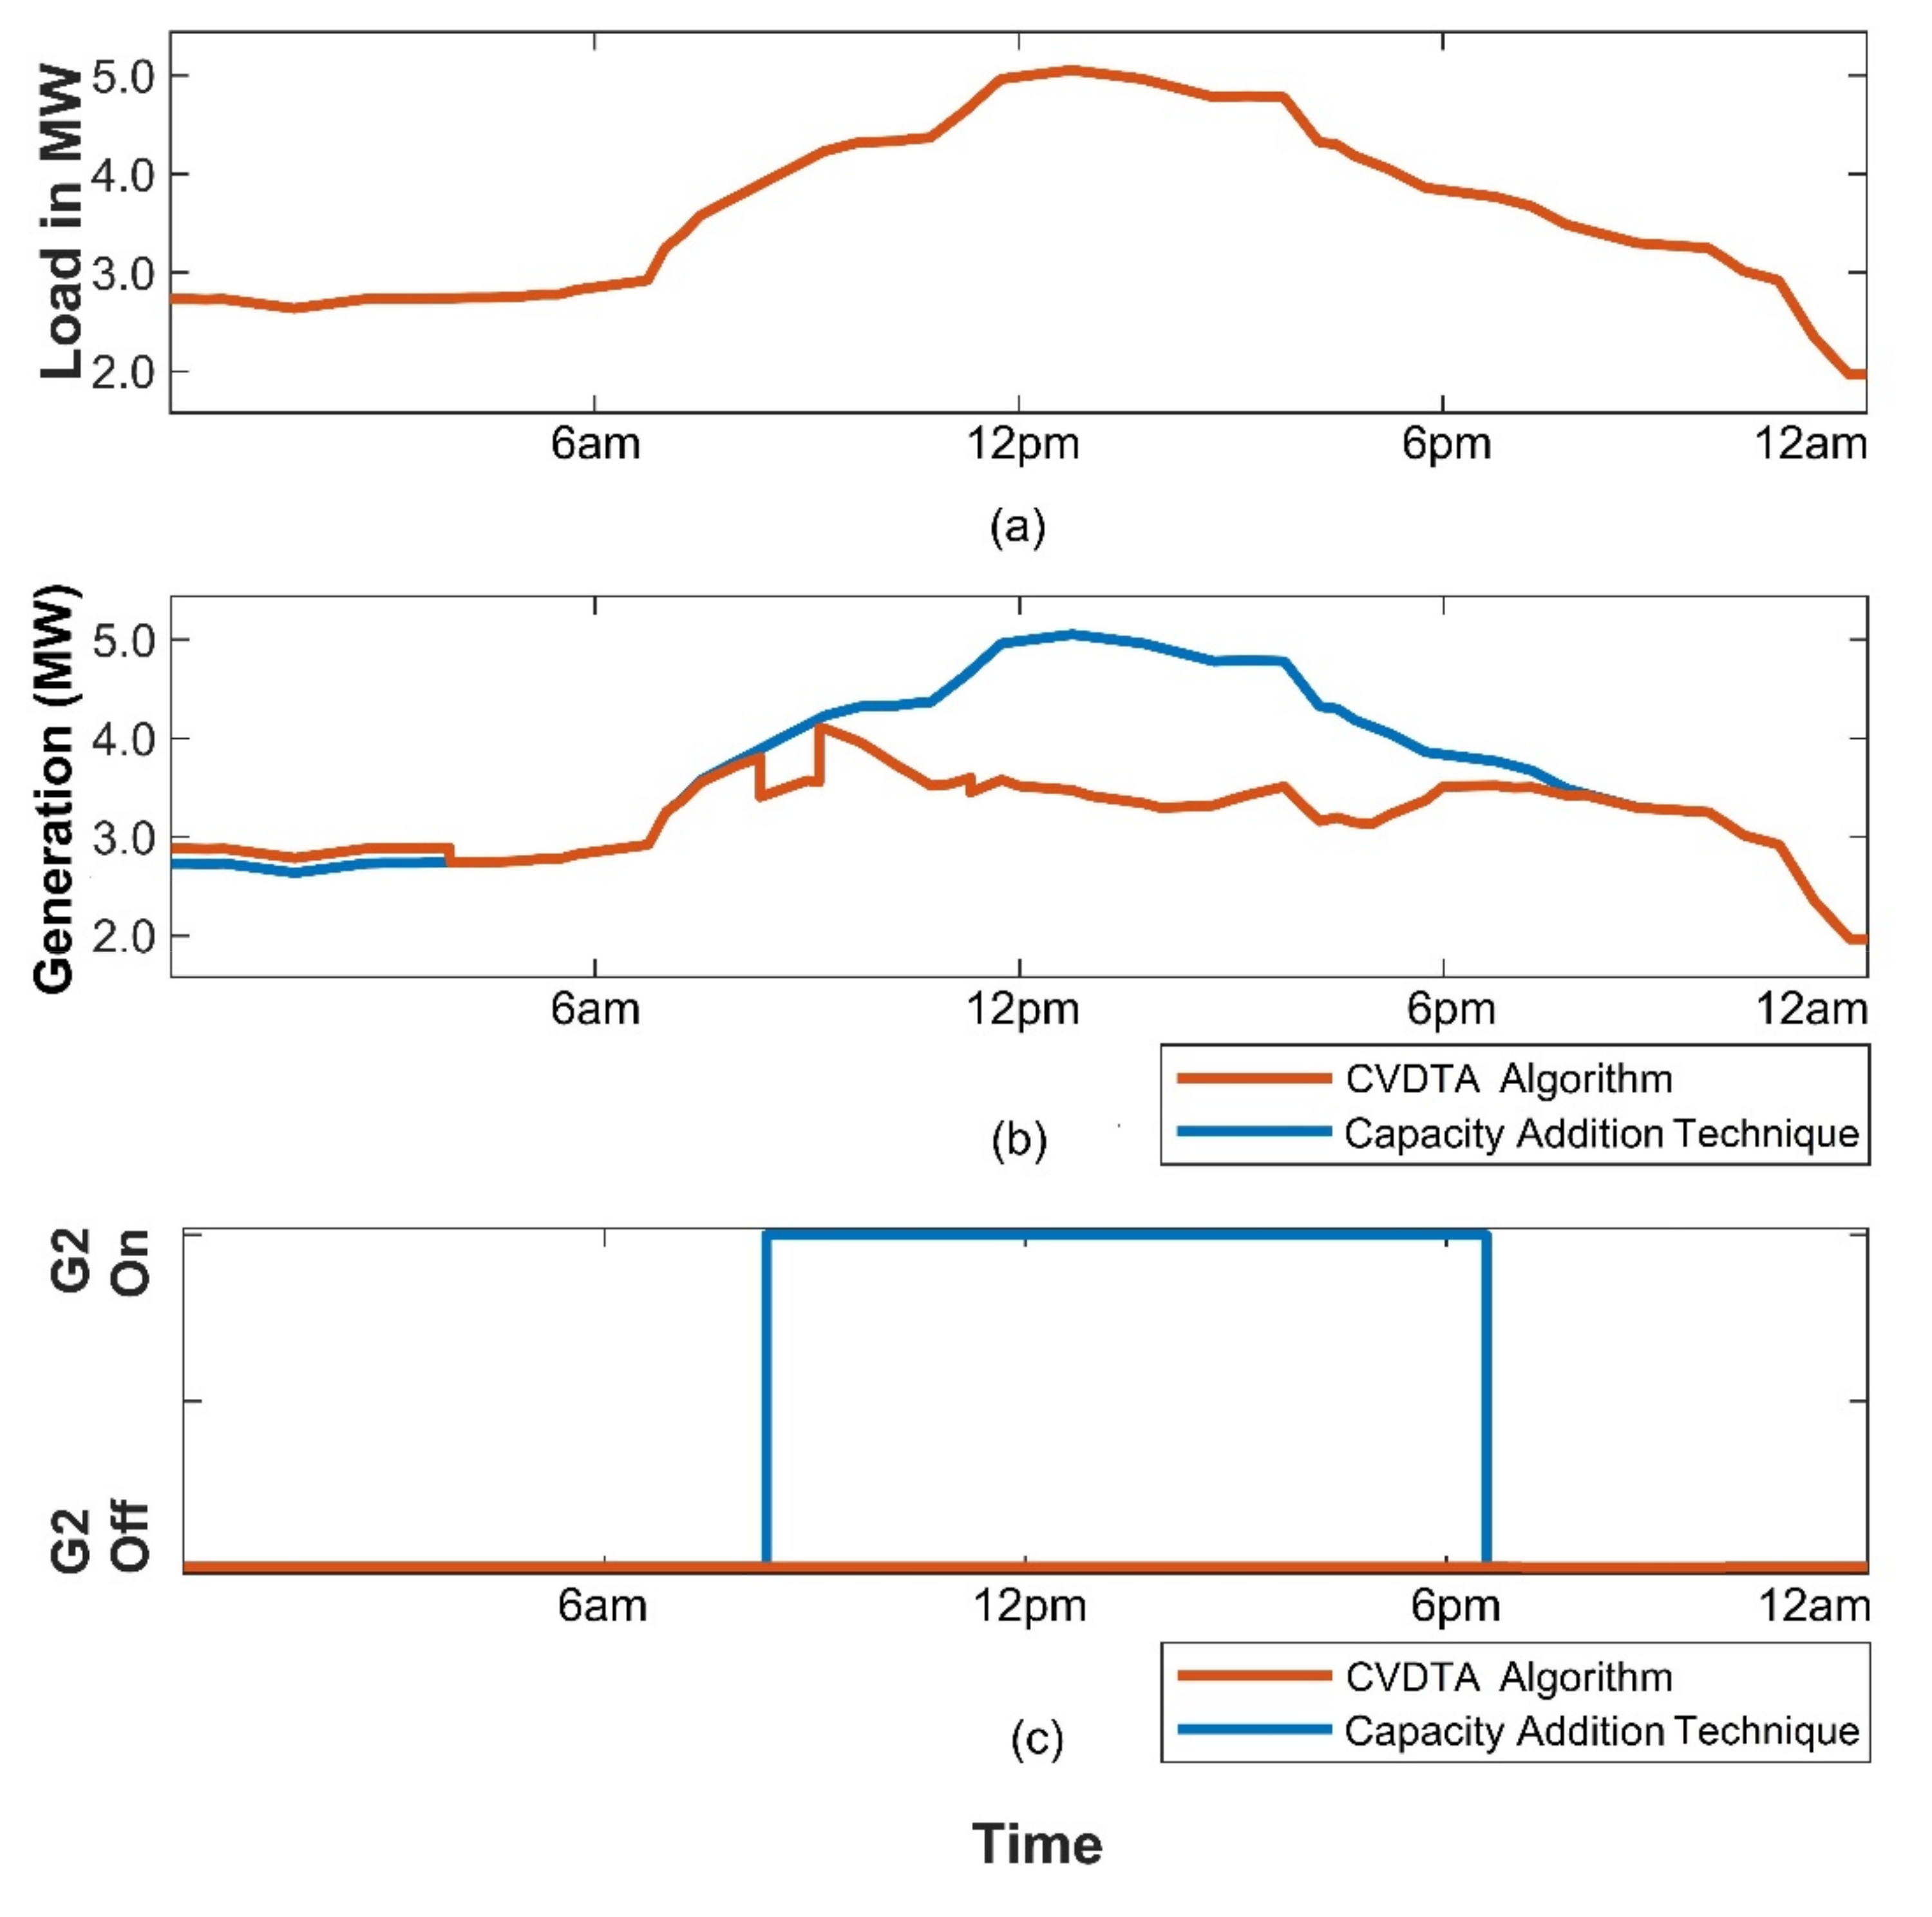
5. Results and Discussion
The simulation case studies have been conducted for a semester break load profile with the average value of PV generation data. The comparative analysis has been conducted between the categorical variable decision tree algorithm and the conventional capacity addition technique to evaluate the improved performance on peak shaving application of the CVDTA algorithm.
5.1. Peak Shaving Performance of the CVDTA Algorithm
The simulation result of the time-varying semester break load profile and the PV generation (average value) are shown in
Figure 7a,b accordingly. The charge-discharge operation of battery storage unit from the generation systems is demonstrated in
Figure 7c.
The quick observation of the demand profile exhibits the different operational modes with different operational time periods. From 12 a.m. to 4 a.m. and from 6:45 p.m. to 12 a.m., the operational mode 4 takes place in the semester break load profile. Besides it, from 8:30 a.m. to 9:30 a.m. and 4:30 p.m. to 6:45 p.m., the load profile is under the operational mode 3. From 9:30 a.m. to 4:30 p.m., the demand profile stands with the operational mode 2.
From 12 a.m. to 4 a.m., the operational mode 4 takes place and the battery storage system starts power absorption from the generation system. From 9:30 a.m. to 11 a.m., the load profile is in the operational mode 2 and the BESS unit is allowed to absorb surplus power generated by the generation system.
On the contrary, from 8:30 a.m. to 9:30 a.m., the demand profile stands with the operational mode 3, but the generation power of PV unit is not adequate to accommodate the demand. This time, the BESS unit is allowed to operate for delivering the required power to minimize the demand. Again, from 4:30 p.m. to 6:45 p.m., the load profile is under the operational mode 3 and the PV power generation is sufficient the fulfil the demand whereas the peak shaving operation is performed by the PV unit.
A gas turbine generator usually performs an optimum and economic operation when the demand profile is closer to its optimum level. The charging operation of the BESS unit from surplus power and the discharging of the stored energy during the peak period or the shortage of power generation can bring the load profile close to the optimum level of GTG. The above charge-discharge operation of battery energy storage system unit can ensure the economic operation of the power system.
The operation of the load minimization and the economic generation dispatch are exhibited in
Figure 7d,e accordingly. From the figure, the quick observation reveals that the supporting generator does not need to turn on during the whole daytime because of the emergence of hybrid PV-BESS system and the adequate power generation from PV unit.
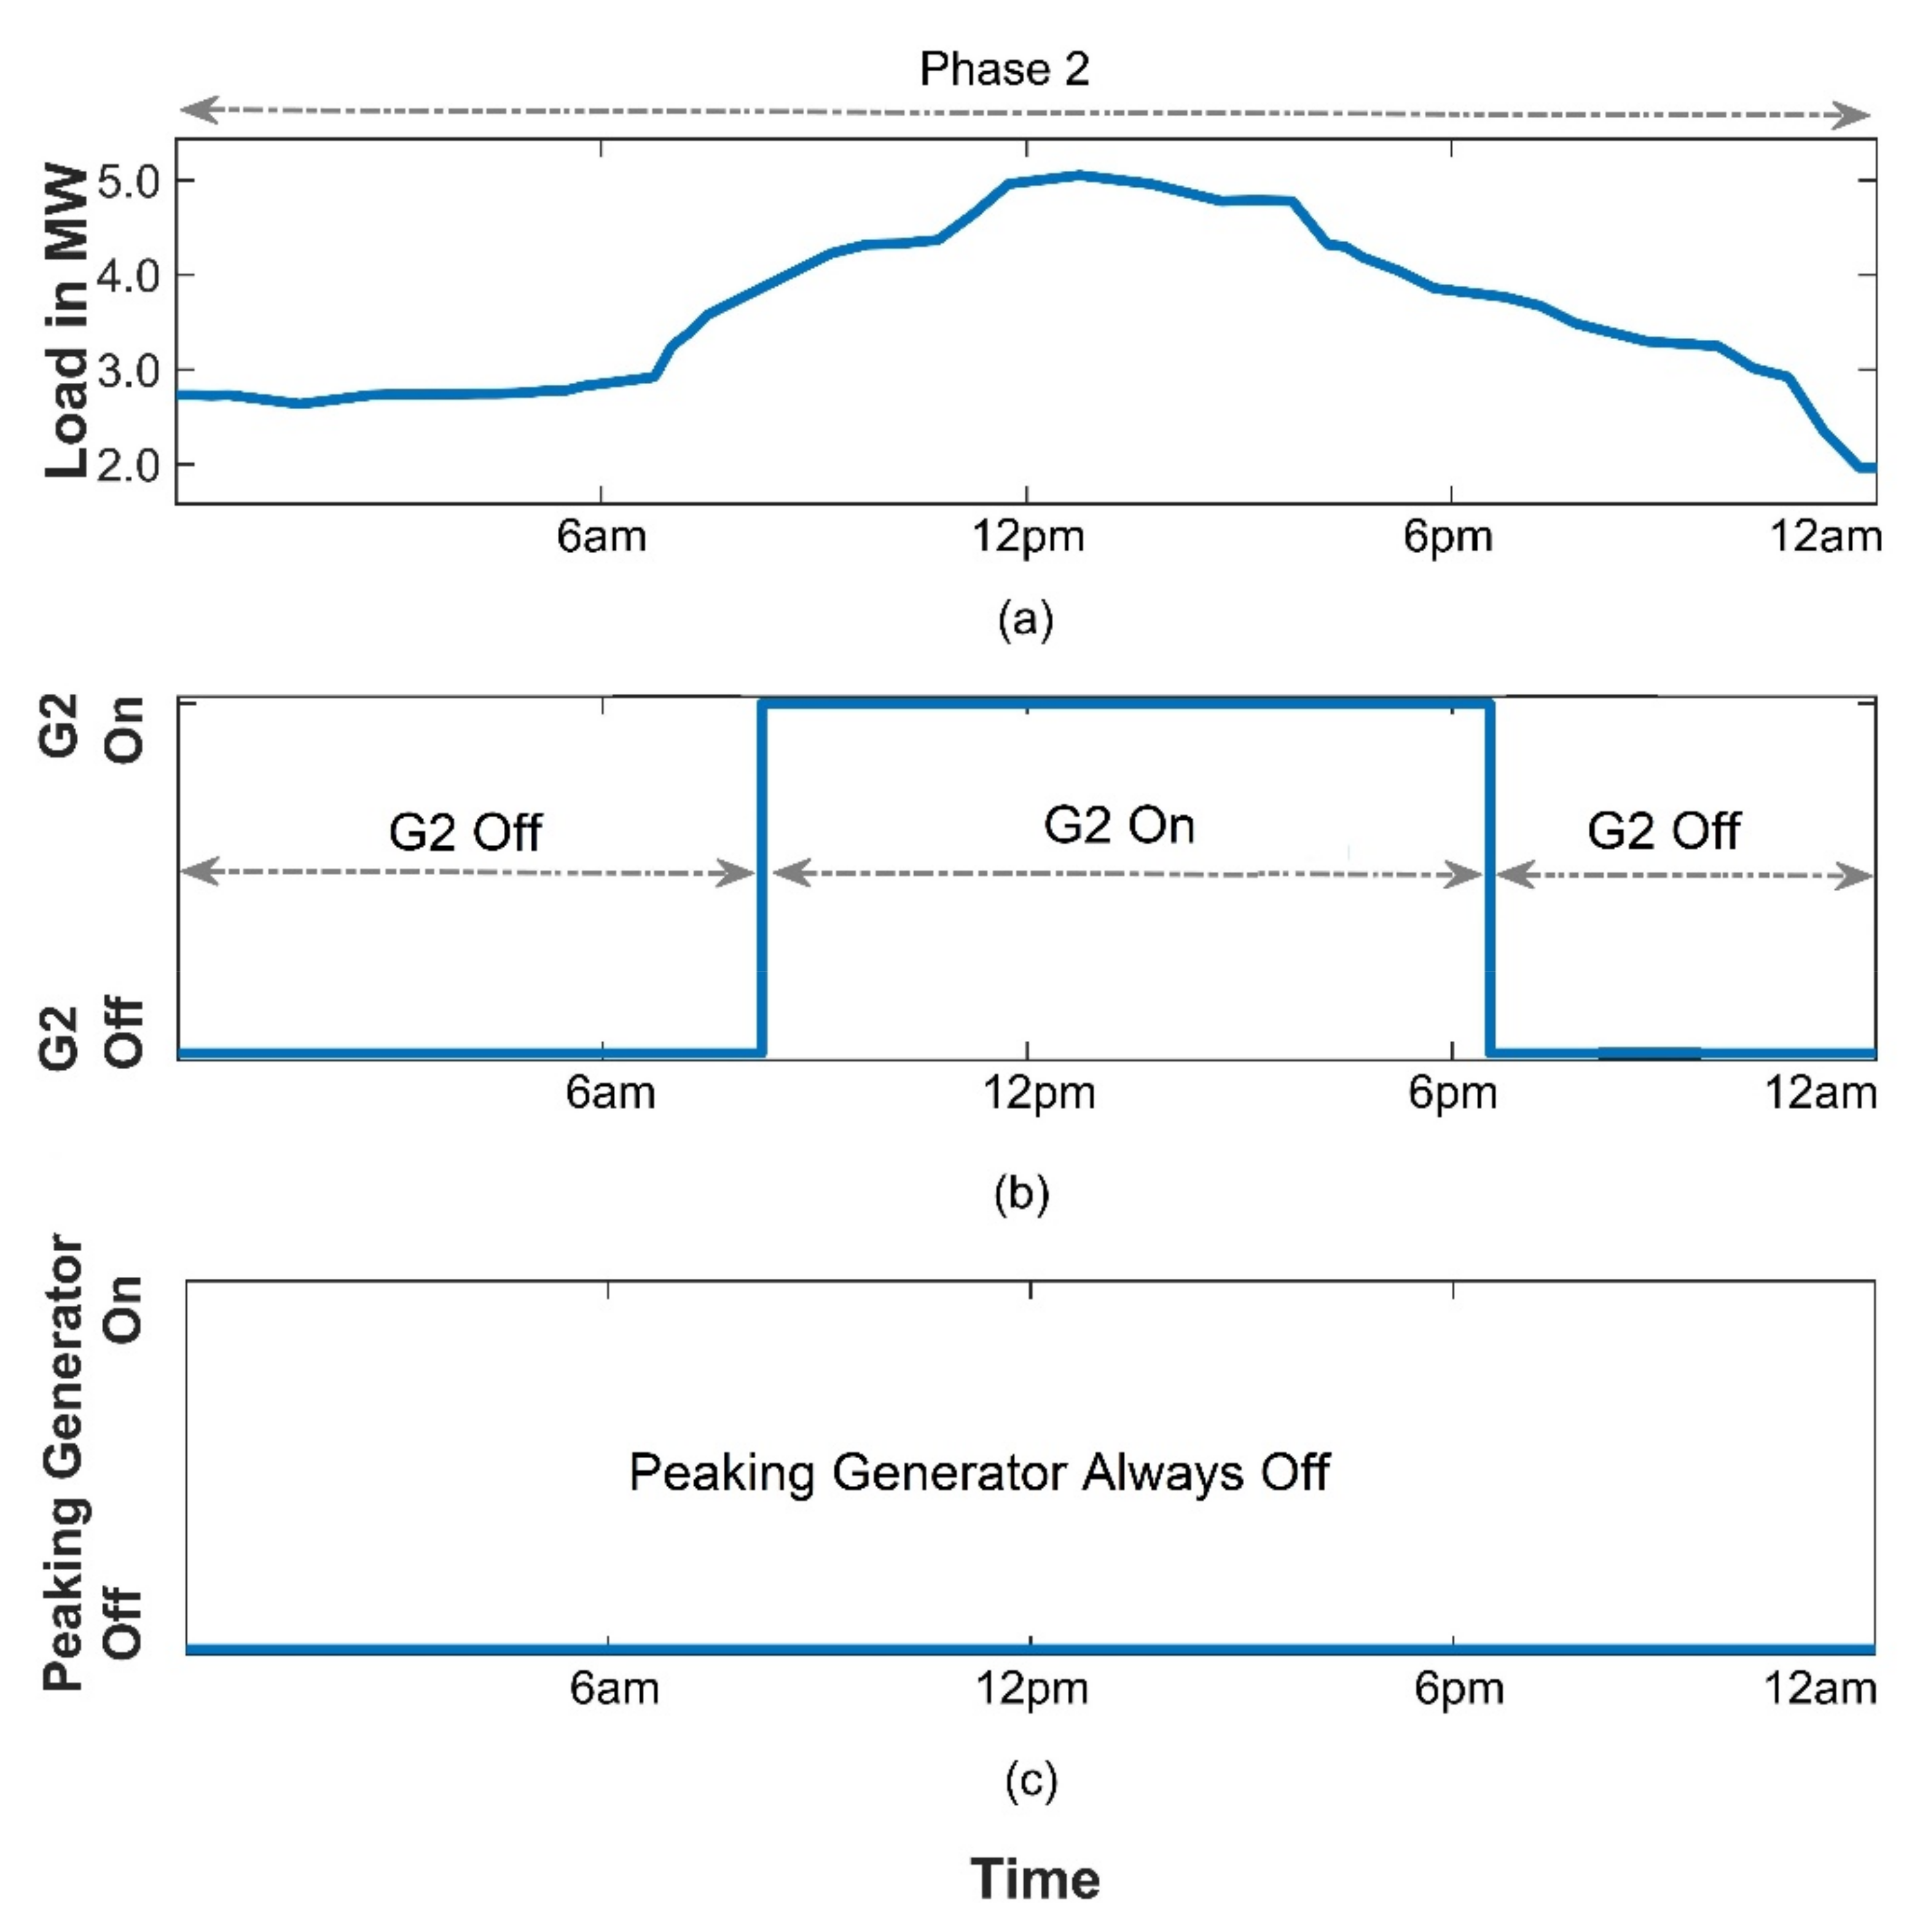
5.2. Peak Shaving Performance of the Capacity Addition Technique
The variable semester break load profile, the operation of economic generation dispatch, and the operation of the peaking generator are shown in
Figure 8a–c, respectively.
The quick observation on the variable load profile exhibits that the demand profile is under the operational phase 2 during the whole operational periods. The demand profile of the test microgrid is categorized into four different operational modes for the CVDTA algorithm whereas two different operational phases are considered for the general capacity addition technique. During the whole period, the load curve is in three operational modes into five different operational periods whereas the load curve stands with only operational phase 2 for the capacity addition technique.
The maximum demand for the semester break load profile is around 5.3 MW and the GTGs are able to generate 7.6 MW optimally. The diesel engine generator considers as a peaking generator, and it operates only when the peak period appears in the system. Since the demand profile is always lower than the optimum generation of the gas turbine generators, the peaking generator does not need to operate during the whole operational periods. The second GTG needs to operate along with the primary generator to supply power to the loads.
6. Comparative Analysis
The variable semester break load profile, the operation of the load shaving, and the operation of the economic generation dispatch are shown in
Figure 9a–c accordingly. A summary of the comparative analysis is shown in
Table 4. The CVDTA algorithm consists of four different operational modes which are able to detect any small portion of peak periods and can minimize them accordingly. The morning and the evening peak periods are occurred in the system which are not the highest demands but need to minimize to achieve the economic operation. The CVDTA algorithm easily can minimize the peak demand at the morning period and the evening period where the capacity addition method is failed. Using the hybrid PV-BESS system as a peak shaving device, the CVDTA algorithm can smoothly perform the peak shaving operation.
During the morning and evening peak periods, the PV and battery storage system operate to deliver power to the load and the second generator does not need to turn on where the second generator needs to operate for the general capacity addition technique. For the CVDTA algorithm, the second generator does not need to operate during the whole daytime hence, the second generator needs to functionate the entire daytime (from 8 a.m. to 6:45 p.m.) including morning and evening peak periods for the capacity addition technique.
Usually, the capacity addition technique uses a conventional generator as peaking generator such as diesel generator, gas-fired generator, coal-fired generator, etc., which are reliable for the environment pollution. Using the conventional generator can increase the O&M cost, system losses, power generation cost, etc. The CVDTA algorithm considers the hybrid PV-BESS system as peak minimizing device which are environment friendly and not reliable for the environment pollution. The BESS unit can absorb power from the system during the off-peak hours and it can inject the stored energy during the peak hours which can maintain the load profile within the optimum level of the GTGs. The fuel efficiency can be increased, power losses and power generation cost can be decreased by this operation.
7. Conclusions and Future Direction
The peak shaving application strongly influences the optimal power-sharing and the economic functioning of an isolated microgrid system. This paper presents a comparative analysis of two different peak shaving techniques namely the categorical variable decision tree algorithm (CVDTA) and the general capacity addition technique to find out the appropriate technique for peak shaving application. The comparative analysis is conducted through MATLAB/Simulink environment and actual data are used for simulation case studies. The key findings of this comparative analysis are given below:
The CVDTA algorithm has four operational modes which are able to shave the demand profile better than that of the capacity addition technique.
The CVDTA algorithm can assure the economic operation for an IMG system as it considers the economic generation dispatch operation where the capacity addition technique is limited.
The CVDTA algorithm can handle any type of uncertainties associated with peak shaving application where the capacity addition technique is confined.
The capacity addition technique is responsible for environment pollution by emitting more green-house gasses where the CVDTA algorithm ensures an environment-friendly power system by using renewable energy resource.
The CVDTA algorithm can ensure less O&M cost, power losses and overall power generation cost of the system than the capacity addition technique.
For the long-term operation, the CVDTA algorithm is more beneficial for practical application than that of the capacity addition technique.
The cost comparison is another important factor for the peak load shaving application. The practical implementation of a peak shaving technique highly relies on cost-effectiveness. A comparative cost-benefit analysis can be the further extension of this work.
Author Contributions
Conceptualization, M.M.R. and M.U.; methodology, M.M.R.; software, M.M.R.; validation, A.R., M.U., M.R.S. and S.A.S.; formal analysis, M.M.R., M.U. and M.R.S.; investigation, M.M.R., A.R., S.A.S., M.F.I., S.M.S.H.R. and M.A.; writing—original draft preparation, M.M.R.; writing—review and editing, A.R., M.U., M.R.S., S.A.S., M.F.I., S.M.S.H.R. and M.A.; funding acquisition, A.R. and S.A.S. All authors have read and agreed to the published version of the manuscript.
Funding
The conducted research work funded by Dept of Electrical Engineering and Industrial Automation of Engineering Institute of Technology.
Data Availability Statement
The data utilized in this research can be obtained from the corresponding author upon request for determining the outcomes.
Acknowledgments
The authors would like to thank the Universiti Teknologi PETRONAS for providing the technical and other support to conduct this research.
Conflicts of Interest
The authors declare that they have no conflict of interest.
Abbreviations
| IMG | Isolated Microgrid |
| PV | Photovoltaic |
| BESS | Battery Energy Storage System |
| RE | Renewable Energy |
| DTA | Decision Tree Algorithm |
| CVDTA | Categorical Variable Decision Tree Algorithm |
| O&M | Operation and Maintenance |
| SOC | State of Charge |
| GTG | Gas Turbine Generator |
| T&D | Transmission and Distribution |
| DR | Distributed Resources |
| EV | Electric Vehicle |
| DSM | Demand Side Management |
| MPPT | Maximum Power Point Tracking |
| P&O | Perturb and Observe |
| EMS | Energy Management Strategy |
References
- Chen, L.; Xu, Q.; Yang, Y.; Song, J. Optimal energy management of smart building for peak shaving considering multi-energy flexibility measures. Energy Build. 2021, 241, 110932. [Google Scholar] [CrossRef]
- Chua, K.H.; Lim, Y.S.; Morris, S. Energy storage system for peak shaving. Int. J. Energy Sect. Manag. 2016, 10, 3–18. [Google Scholar] [CrossRef]
- Rana, M.M.; Romlie, M.F.; Abdullah, M.F. Peak Load Shaving in Isolated Microgrid by Using Hybrid PV-BESS System. Int. J. Emerg. Trends Eng. Res. 2020, 8, 7–14. [Google Scholar] [CrossRef]
- Teki, V.K.; Maharana, M.K.; Panigrahi, C.K. Study on home energy management system with battery storage for peak load shaving. Mater. Today Proc. 2021, 39, 1945–1949. [Google Scholar] [CrossRef]
- Telaretti, E.; Dusonchet, L. Battery storage systems for peak load shaving applications: Part 1: Operating strategy and modification of the power diagram. In Proceedings of the 2016 IEEE 16th International Conference on Environment and Electrical Engineering, Florence, Italy, 7–10 June 2016. [Google Scholar]
- Zhang, Y.; Fu, L.; Zhu, W.; Bao, X.; Liu, C. Robust model predictive control for optimal energy management of island microgrids with uncertainties. Energy 2018, 164, 1229–1241. [Google Scholar] [CrossRef]
- Koh, S.L.; Lim, Y.S. Evaluating the economic benefits of peak load shifting for building owners and grid operator. In Proceedings of the 2015 International Conference on Smart Grid and Clean Energy Technologies, Offenburg, Germany, 20–23 October 2015. [Google Scholar]
- Ferreira, M.R.M.; Ribeiro, L.A.d.S.; Matos, J.G.d. Economic Analysis of a Peak Shaving System with Diesel Generator. In Proceedings of the 2019 IEEE 15th Brazilian Power Electronics Conference and 5th IEEE Southern Power Electronics Conference (COBEP/SPEC), Santos, Brazil, 1–4 December 2019. [Google Scholar]
- Pandiaraj, K.; Fox, B.; Morrow, D.J.; Persaud, S.; Martin, J.P. Centralised control of diesel gen-sets for peak shaving and system support. IEE Proc.-Gener. Transm. Distrib. 2002, 149, 126–132. [Google Scholar] [CrossRef]
- Ouammi, A. Peak Loads Shaving in a Team of Cooperating Smart Buildings Powered Solar PV-Based Microgrids. IEEE Access 2021, 9, 24629–24636. [Google Scholar] [CrossRef]
- Zupancic, J.; Lakic, E.; Medved, T.; Gubina, A.F. Advanced peak shaving control strategies for battery storage operation in low voltage distribution network. In Proceedings of the 2017 IEEE Manchester PowerTech, Manchester, UK, 18–22 June 2017. [Google Scholar]
- Ishraque, M.F.; Shezan, S.A.; Nur, J.N.; Islam, M.S. Optimal Sizing and Assessment of an Islanded Photovoltaic-Battery-Diesel Generator Microgrid Applicable to a Remote School of Bangladesh. Eng. Rep. 2021, 3, e12281. [Google Scholar] [CrossRef]
- Rana, M.M.; Romlie, M.F.; Abdullah, M.F.; Uddin, M.; Sarkar, M.R. A novel peak load shaving algorithm for isolated microgrid using hybrid PV-BESS system. Energy 2021, 234, 121157. [Google Scholar] [CrossRef]
- Reihani, E.; Ghorbani, R. Load commitment of distribution grid with high penetration of photovoltaics (PV) using hybrid series-parallel prediction algorithm and storage. Electr. Power Syst. Res. 2016, 131, 224–230. [Google Scholar] [CrossRef]
- Shezan, S.A.; Ishraque, M.F. Assessment of a Micro-grid Hybrid Wind-Diesel-Battery Alternative Energy System Applicable for Offshore Islands. In Proceedings of the 2019 5th International Conference on Advances in Electrical Engineering (ICAEE), Dhaka, Bangladesh, 26–28 September 2019; pp. 457–462. [Google Scholar]
- Shezan, S.A.; Hasan, K.N.; Rahman, A.; Datta, M.; Datta, U. Selection of Appropriate Dispatch Strategies for Effective Planning and Operation of a Microgrid. Energies 2021, 14, 7217. [Google Scholar] [CrossRef]
- Yao, Y.; Gao, W.; Li, Y. Optimization of PHEV charging schedule for load peak shaving. In Proceedings of the 2014 IEEE Conference and Expo Transportation Electrification Asia-Pacific (ITEC Asia-Pacific), Beijing, China, 31 August–3 September 2014. [Google Scholar]
- Leemput, N.; Geth, F.; Claessens, B.; Van Roy, J.; Ponnette, R.; Driesen, J. A case study of coordinated electric vehicle charging for peak shaving on a low voltage grid. In Proceedings of the 2012 3rd IEEE PES Innovative Smart Grid Technologies Europe (ISGT Europe), Berlin, Germany, 14–17 October 2012. [Google Scholar]
- Ouammi, A. Peak load reduction with a solar PV-based smart microgrid and vehicle-to-building (V2B) concept. Sustain. Energy Technol. Assess. 2021, 44, 101027. [Google Scholar] [CrossRef]
- Shen, J.; Jiang, C.; Liu, Y.; Qian, J. A Microgrid Energy Management System with Demand Response for Providing Grid Peak Shaving. Electr. Power Compon. Syst. 2016, 44, 843–852. [Google Scholar] [CrossRef]
- Tascikaraoglu, A.; Boynuegri, A.R.; Uzunoglu, M. A demand side management strategy based on forecasting of residential renewable sources: A smart home system in Turkey. Energy Build. 2014, 80, 309–320. [Google Scholar] [CrossRef]
- Brkic, B.; Vasak, M. Analysis of a diesel-generator-assisted peak power reduction in a production plant. In Proceedings of the 2020 IEEE 11th International Symposium on Power Electronics for Distributed Generation Systems (PEDG), Dubrovnik, Croatia, 28 September–1 October 2020. [Google Scholar]
- Uddin, M.; Romlie, M.F.; Abdullah, M.F.; Abd Halim, S.; Abu Bakar, A.H.; Chia Kwang, T. A review on peak load shaving strategies. Renew. Sustain. Energy Rev. 2018, 82, 3323–3332. [Google Scholar] [CrossRef]
- Somvanshi, M.; Chavan, P.; Tambade, S.; Shinde, S.V. A review of machine learning techniques using decision tree and support vector machine. In Proceedings of the 2016 International Conference on Computing Communication Control and Automation (ICCUBEA), Pune, India, 12–13 August 2016. [Google Scholar]
- Rokach, L.; Maimon, O. Top-Down Induction of Decision Trees Classifiers—A Survey. IEEE Trans. Syst. Man Cybern. Part C 2005, 35, 476–487. [Google Scholar] [CrossRef] [Green Version]
- Teli, S.; Kanikar, P. A Survey on Decision Tree Based Approaches in Data Mining. Int. J. Adv. Res. Comput. Sci. Softw. Eng. 2015, 5, 613–617. [Google Scholar]
- CFI. Available online: https://corporatefinanceinstitute.com (accessed on 15 August 2021).
- Jiao, S.R.; Song, J.; Liu, B. A Review of Decision Tree Classification Algorithms for Continuous Variables. J. Phys. Conf. Ser. 2020, 1651, 012083. [Google Scholar] [CrossRef]
- Rana, M.M.; Romlie, M.F.; Abdullah, M.F.; Uddin, M.; Rahman, M.O. Modeling of an isolated microgrid with hybrid PV-BESS system for peak load shaving simulation. Int. J. Adv. Technol. Eng. Explor. 2021, 8, 352–361. [Google Scholar] [CrossRef]
| Publisher’s Note: MDPI stays neutral with regard to jurisdictional claims in published maps and institutional affiliations. |
© 2022 by the authors. Licensee MDPI, Basel, Switzerland. This article is an open access article distributed under the terms and conditions of the Creative Commons Attribution (CC BY) license (https://creativecommons.org/licenses/by/4.0/).


 ,
, 


