1. Introduction
Photovoltaics in Poland is developing dynamically, mainly due to the current support system for this industry. Still in force this year and until April 2022, the current support scheme allows to settle accounts with the electricity supplier as a prosumer on a net-metering basis. A household can therefore receive, free of charge, 80% or 70% (depending on the power of the installation) of the energy introduced to the grid from the photovoltaic installation, and the settlement period is set for 1 year. Only the use of more energy than results from this settlement causes the necessity to purchase electricity at market price. However, new regulations based on a net-billing mechanism have been discussed, and recently, a new financing scheme has been established for Poland.
The development of renewable energy sources (RES) is important to meet the targets of the energy mix for Poland; therefore, not only for pv installations, but also other forms of RES are subsidized. For households in particular, heat pump installations are widely supported. The incentives for RES installations at the level of households for several years have been the following: direct co-financing of the installations up to the level of 60% of the total installations’ costs, tax exemptions, and in the case of pv installations, favourable settlement conditions based on net-metering. Therefore, especially in the last several years, pv household installations have flourished, creating business opportunities for installers and boosting economic growth in this area. At the same time, the well-known issues related to grid quality and capacity have not been sufficiently addressed. The increasing supply of rooftop pv energy to the grid is not appropriately synchronized with energy demand, thus causing a pressure of excess energy generation on the grid. For that reason, rooftop pv panels installation is perceived by energy operators as not a reliable source of energy delivery. Moreover, the net-metered customers are considered not fully participating in grid overhead costs. Therefore, the International Renewable Energy Agency (IRENA) advocates for more mature compensation mechanisms that capture the true value of renewable electricity [
1] (p. 6). As such, the net-billing is recognized, because it is a market-based compensation mechanism, where prosumer compensation is based on the actual market value of the kilowatt-hours (kWh) consumed or injected into the grid [
1].
From the year 2010 until 2019, the capacity generated by solar energy RES technologies in form of power plants and other installations in Poland increased from zero to 1300 MW, according to IRENA [
2], whereas the total RES capacity in Poland in the same period increased of about 430% from 2178 to 9326 MW. In 2019, the existing electricity generation by photovoltaics was at a level of 0.7 TWh [
3], and according to the National Energy and Climate Plan for the years 2021–2030, it should increase to 6.8 TWh in 2030 and to 14.8 TWh in 2040 [
4,
5]. The observation of the EU RES market confirms that the policies in many countries have supported the development of wind and photovoltaic energy as the cheapest and most willingly undertaken investments by investors. The decreasing costs of easily available technology and favourable support schemes offered by the government (income tax reduction) and the local authorities (installations surcharges) added to the increasing popularity of these investments at the household scale in Poland. At the same time, feed-in-tariffs and net-metering have intensified the small-scale prosumers’ production [
6]. It was observed that rooftop photovoltaic installations are the primary source of energy generation at a residential level [
7], and it was estimated that they can cover up to 24.4% of EU electricity consumption [
8].
In order to fulfil the requirements of the Renewable Energy Directive 2018/2001/EU [
9] raising to the level of 32%, the overall EU target for Renewable Energy Sources consumption by 2030 and the Draft of Polish Energy Policy until 2040 was released by the Ministry of Climate and Environment. In this document, under the Strategic Direction No. 2 “Development of the power capacity and transmission infrastructure”, it is stated that “the achievement of the share of RES in electricity generation will be mainly based on photovoltaics (from 2022)” and also that “grid infrastructure development will involve extension of the domestic transmission grid under seven investment programmes” [
10] (p. 3). In view of the above, it is important to establish whether the new support scheme planned to be introduced in 2022 will be perceived by the investors as more or less beneficial to the current support scheme.
Within a net-billing scheme, also called net-purchase and sale, both imports and exports of energy by the prosumer are recorded, and they are subsequently charged or compensated at different rates [
7,
11]. Net-billing schemes are already implemented, for example in Indonesia, Italy, Mexico, Portugal and in New York in the United States of America [
1]. Benefits from this scheme are related to the increased system flexibility by intensifying prosumers to self-consume and inject electricity in the grid when prices are high as well as withdraw electricity from the grid when prices are low [
1]. Under a net-metering scheme, prosumers are incentivized to produce electricity at a level that may not be optimal for the electricity system overall, sometimes being overcompensated for the renewable electricity fed into the grid, thus leading to the vicious circle of overproduction [
12].
The recently discussed Poland RES Act, which is planned to come into force next year, introduces changes in the method of billing from the net-metering to the net-billing. The energy produced at a given moment by the photovoltaic installation and not used by the producer will be sold on a free competitive market. At the same time, in periods of demand for energy, exceeding the production capacity of a photovoltaic installation, it will be necessary to purchase energy on a freely competitive market. Considering that a standard household is characterized by a different period of greatest energy demand than the period of the highest energy production by the photovoltaic installation (depending on the time of day and season), the volume of purchase/sale transactions will be significant compared to the total electricity consumption by the household. Additionally, knowing that the selling price of energy by a prosumer in a free-competitive market is significantly lower than the purchasing price, the introduction of such regulations will significantly affect the profitability of investments in photovoltaics. At the stage of designing the changes in the mentioned RES Act, the “transitional scheme” was also considered, where the pv energy producer could receive from the pv installation all energy fed into the power grid (not 80% or 70% as in the current scheme), but it would be necessary for them to cover the costs of the distribution fee.
In that view, the aim of this paper is to determine changes in the profitability of a photovoltaic installation for a household in Poland after the introduction of a new financial supporting scheme based on net-billing (indicated in the polish RES Act to be passed 2021). The distinctive feature of the pv profitability analysis in this paper is that the heating system, based on RES (heat pump) vs. conventional gas boiler, is included. The analysis carried out is specific for residential buildings. The calculations are performed for a heating system based on: (1) gas boiler and pv panels and (2) heat pump and pv panels. The values of technical and financial parameters significant for the investments, determining the profitability of the investments, assuming new financing conditions, are indicated.
The financial efficiency of the pv installation is not only dependent on the pv technology and the construction of the support scheme, the latest being detailed and analysed in this paper in relation to the recent RES law changes in Poland, but also on energy storage. In the paper, it is assumed that the grid takes the surplus energy when it is not required. However, the domestic energy storage, such as batteries to store the surplus energy, could be considered an important alternative, influencing the profitability of the pv installation, much more in the net-billing, than in the net-metering scheme. The possibility to store the surplus energy has the financial advantages for the prosumers under the net-billing financing scheme compared to using the grid as energy storage. The magnitude of this impact would vary depending on the level of regulated selling and purchasing energy prices. At the same time, domestic energy storage mitigates the issues of overgeneration. However, the domestic battery storage is not taken into account within the scenarios in this paper, because the purpose of this study is to compare the profitability of investments in photovoltaics under polish conditions, focusing on the changes in the photovoltaic support scheme, which is being developed in Poland. This timely issue of changing the method of pv financing is the most widely commented and analysed matter concerning photovoltaics in Poland. At the same time, it should be noted that in Poland, although photovoltaics is developing dynamically, the market of energy storage systems is a fledgling. Even for commercial installations, it is an extremely rarely used solution, including in home installations. According to the Polish Energy Group [
13], as for July 2021, there were two energy storage facilities in Poland with a total power of 2.6 MW and a total capacity of 4.95 MWh. The lack of energy storage in the Polish power system thus far is a derivative of the lack of legal regulations and the issue of double calculation of distribution fees [
14]. In comparison, in 2019 in Germany, there were 160,000 energy storage facilities, including both households and companies, which constitute almost 10% of the total number of installations, with high-growth dynamics in recent years (34,000 in 2016 and 100,000 in 2018) [
15]. Implementation of energy storage in home pv systems on a large scale will enable to reduce pv supply picks of about 40% in the grid scale, according to the Frauenhofer Institute study [
16]. Therefore, the development of home energy storage is an interesting alternative to the grid worth pursuing in the future. For the time being, considering the ambiguity of messages from companies assembling photovoltaic installations and the government’s messages regarding the profitability of such an investment, the authors focused on the issue of change in pv support scheme, which is perceived as the most important factor for the photovoltaics sector development within the next few years in Poland. The analysis is performed in relation to the most common kinds of heating systems in the country. Therefore, the coupling of solar pv with a heat pump is considered and no other alternatives, such as solar thermal installation generating the heat to be stored by the pump.
There are many available photovoltaic architectures, and the technology that is used can have a significant impact on installation costs and pv modules’ efficiencies. In this paper, it is assumed that the photovoltaic system will consist of monocrystalline photovoltaic modules with a power range of 340–390 Wp, using the half-cut technology, and the manufacturer from the Tier-1 list. It is assumed that the installation would be equipped with a three-phase inverter with a European efficiency coefficient in the range of 97–98%, from a Polish company (e.g., Fronius). The installation will be equipped with AC and DC overvoltage protections. The installation will be mounted on an aluminium frame on the southern slope of the roof made of steel tiles, with an inclination angle of 30–40°.
2. Materials and Methods
2.1. Research Method
The profitability analysis was conducted with the use of Net Present Value calculation (NPV) and the return on investment period. NPV allows for comparison of costs and benefits from an investment. In particular, investments and maintenance costs as well as revenue streams are taken into account and compared. The analysis helps to rank defined investment options according to the net benefits in order to choose the most profitable one. At the same time, the return on investment period informs investors and policy makers on the timeframe within which the given investment under a particular support scheme will start being profitable.
After the results from the profitability analysis are obtained, the sensitivity analysis is conducted in order to check the impact of influential factors on the received outcomes. In this case, average annual increase in the purchasing or selling prices of electricity, purchasing prices of natural gas as well as inflation rate are taken into account. In the paper, the sensitivity analysis is conducted in a specific way such that the boundary values, for the factors ensuring the NPV value equal to the NPV value for the most profitable solution, are established.
The calculations are made for a representative single-family building located in Poland. The technical parameters of the representative building are determined on the basis of statistical data [
17]. The demand for electricity is calculated for a heating system:
- (1)
without a heat pump;
- (2)
with a heat pump;
Using statistical data to determine the average electricity demand of a household. Power calculations are made for two cases: 100% coverage of electricity demand by a photovoltaic installation (a) only in the first year of its operation and (b) in the last year of its operation, based on the paper: [
18]. For all cases, the investment profitability analysis was carried out, using the above-mentioned methodology.
2.2. Assumptions and Parameters of the PV Installation Profitability Calculation Model
The analysis is carried out for two versions of photovoltaic installations, for a single-family building:
Photovoltaic installation ensuring coverage of 100% of electricity demand, assuming that the building is heated with a gas boiler;
Photovoltaic installation ensuring coverage of 100% of electricity demand, assuming that the building is heated with an air/water heat pump (electricity also used for heating purposes).
Two cases are analysed for both versions:
- A.
Covering 100% of the demand for electricity only in the first year of operation of the installation and the need to buy more and more energy each year (as a result of panel degradation);
- B.
Covering 100% of the electricity demand even in the last year of operation of the installation.
With the above assumptions, four theoretical systems (1A, 1B, 2A, 2B) were created and analysed in the paper.
Based on statistical data, the following parameters of the building are assumed to be representative for the area of Poland. Indicators for rural households are adopted, because the majority of households live in single-family houses in rural areas. The installation of photovoltaic panels by individual households in practice only applies to single-family houses:
Based on the above data, it can be assumed that an average household in Poland consumes annually 117.9 m2 × 25.5 kWh/m2/year = 3006.45 kWh of electricity, if no electricity is used for heating purposes. If a heat pump is used for heating, the estimated electricity demand of the heat pump must be added to the above value. The method of estimating electricity consumption by a heat pump for a building with the assumed parameters is as follows:
The annual average SCOP efficiency of the heat pump was determined.
The heat demand of the building has been determined QHPT (kWh/year) as the sum of the heat demand for domestic hot water preparation QW,nd and heat for heating purposes QHPH.
The electricity demand (EEL) was determined based on the formula:
The SCOP was set at 3.3 for air-to-water heat pumps and 3.8 for air-to-air heat pumps. This value is a limit value that qualifies a given heat pump for support under the Polish subsidy system [
19]. The unit heat demand for heating purposes was assumed at the level of 64.1 kWh/m
2 on the basis of [
17] (p. 88). On this basis, it was calculated that the annual heat demand for heating purposes QHPH is 7557.39 kWh.
The energy demand for hot water preparation was determined using the methodology contained in the regulation of the Ministry of Infrastructure and Development of 27 February 2015, Journal of Laws 2015.376, according to the formula:
The parameters used for the calculations are presented in
Table 1.
Heat demand for domestic hot water preparation QW,nd is 2839.89 kWh/year. The theoretical total heat demand of a building QHPT equals to 10397.28 kWh/year.
On this basis, the demand for electricity by the heat pump was determined, which is 3150.69 kWh/year with the use of an air/water heat pump. For variant I, it was assumed that the efficiency of the domestic hot water system utilising a condensing boiler is 50%, and the efficiency of the utility heat preparation system is 80%. On this basis, it was calculated that the demand for natural gas amounts to 15126.52 kWh/year.
The total electricity demand for the installation in installation option 1, with a heating system containing pv panels and a gas furnace, and in installation option 2, with a heating system containing pv panels and a heat pump are presented in
Table 2 (kWh/year).
The above values have become the basis for determining the size of the photovoltaic installation, which will make it possible to cover the calculated electricity demand in four theoretical systems (1A, 1B, 2A, 2B). The calculations were performed for three versions of the RES Act (three scenarios: Current scheme; Transitional scheme; Planned scheme). The Current scheme means that the billing is made on a net-metering basis. The Transitional scheme means that 100% of the energy fed into the grid will be taken free of charge, but with the need to cover 85% of the distribution fee. The Planned scheme means that 100% of the energy fed into the grid will be the volume of energy sold at market prices and 100% of the energy received from the grid will be the volume of energy purchased at market prices. The adoption of such assumptions means that for scenario 1 (the current system) the installation must be oversized, i.e., the amount of energy produced is greater than the demand for energy, which results from the fact that only 80% of the energy fed into the grid can be collected from the distribution grid operator free of charge. For the other two scenarios (Transitional scheme and Planned scheme), the energy production of the installation will match the demand, and the difference in the coverage moment will only be due to degradation of the panels.
With the above assumptions, based on Equations (4) and (5) as well as the methodology detailed in [
18], the power of the installation was determined for both installation variants.
As a result of these calculations, 12 possible combinations of pv investments for the different installations options and the analysed financing schemes were obtained. They are presented in
Table 3. These investment options will be subject to profitability analysis in this paper.
The investments presented in
Table 3 are compared to installation based on natural gas (heating devise) and electric energy from the grid.
For heating systems in a theoretical single-family building, the following assumptions were made for each of the above solutions.
1. The investment costs of the heat source enabling the provision of computational heat and domestic hot water were assumed at the level of:
The above costs include the gas boiler or heat pump, equipment for the preparation of domestic hot water and the cost of commissioning the installation.
2. The gas cost was calculated on the basis of the calculated energy consumption and financial parameters related to the gas price with the following assumptions:
price of natural gas EUR 0.024/kWh (tariff W-2.1 of PGNiG-the largest Polish supplier of natural gas);
fixed costs related to the purchase of gas (subscription and transmission fee)-EUR 93/year (based on the price list of PGNiG);
the average annual increase in gas prices in Poland by 1.8% (based on EUROSTAT 2007–2020 data).
3. The purchase price of electricity from the owner of the pv installation is EUR 55.90/MWh (
www.ure.gov.pl-the average annual price of energy on the competitive market in 2020, accessed on 5 August 2021), and the average annual increase in the price of electricity purchase from the owner of the pv installation is 4.1%, based on average electricity prices on the competitive market in 2008–2020 [
21].
4. The average annual cost of servicing the heat pump and gas boiler was assumed at the level of 1% and 2% of their original value, respectively (based on [
20]).
5. A 25-year calculation period has been assumed as this is the period taken as the lifetime of the pv panels.
6. The service life of the heat pump is 20 years, the life of the gas boiler is 13 years, and the cost of replacement is 80% of the purchase cost of a given heat source, due to the lack of costs related to the installation of the device connection.
The above assumptions, combined with the methodology adopted by [
18], enable the use of the parameters presented in
Table 4 in the profitability analysis.
The profitability of the investment was measured by the NPV value according to the Equation (6).
where:
The calculations were carried out with the use of the above assumptions and their results are subsequently presented.
3. Results
In this section, first the results of the profitability analysis of the defined investments’ options are shown, and then the outcomes of their sensitivity analysis are outlined.
3.1. Results of the Profitability Analysis
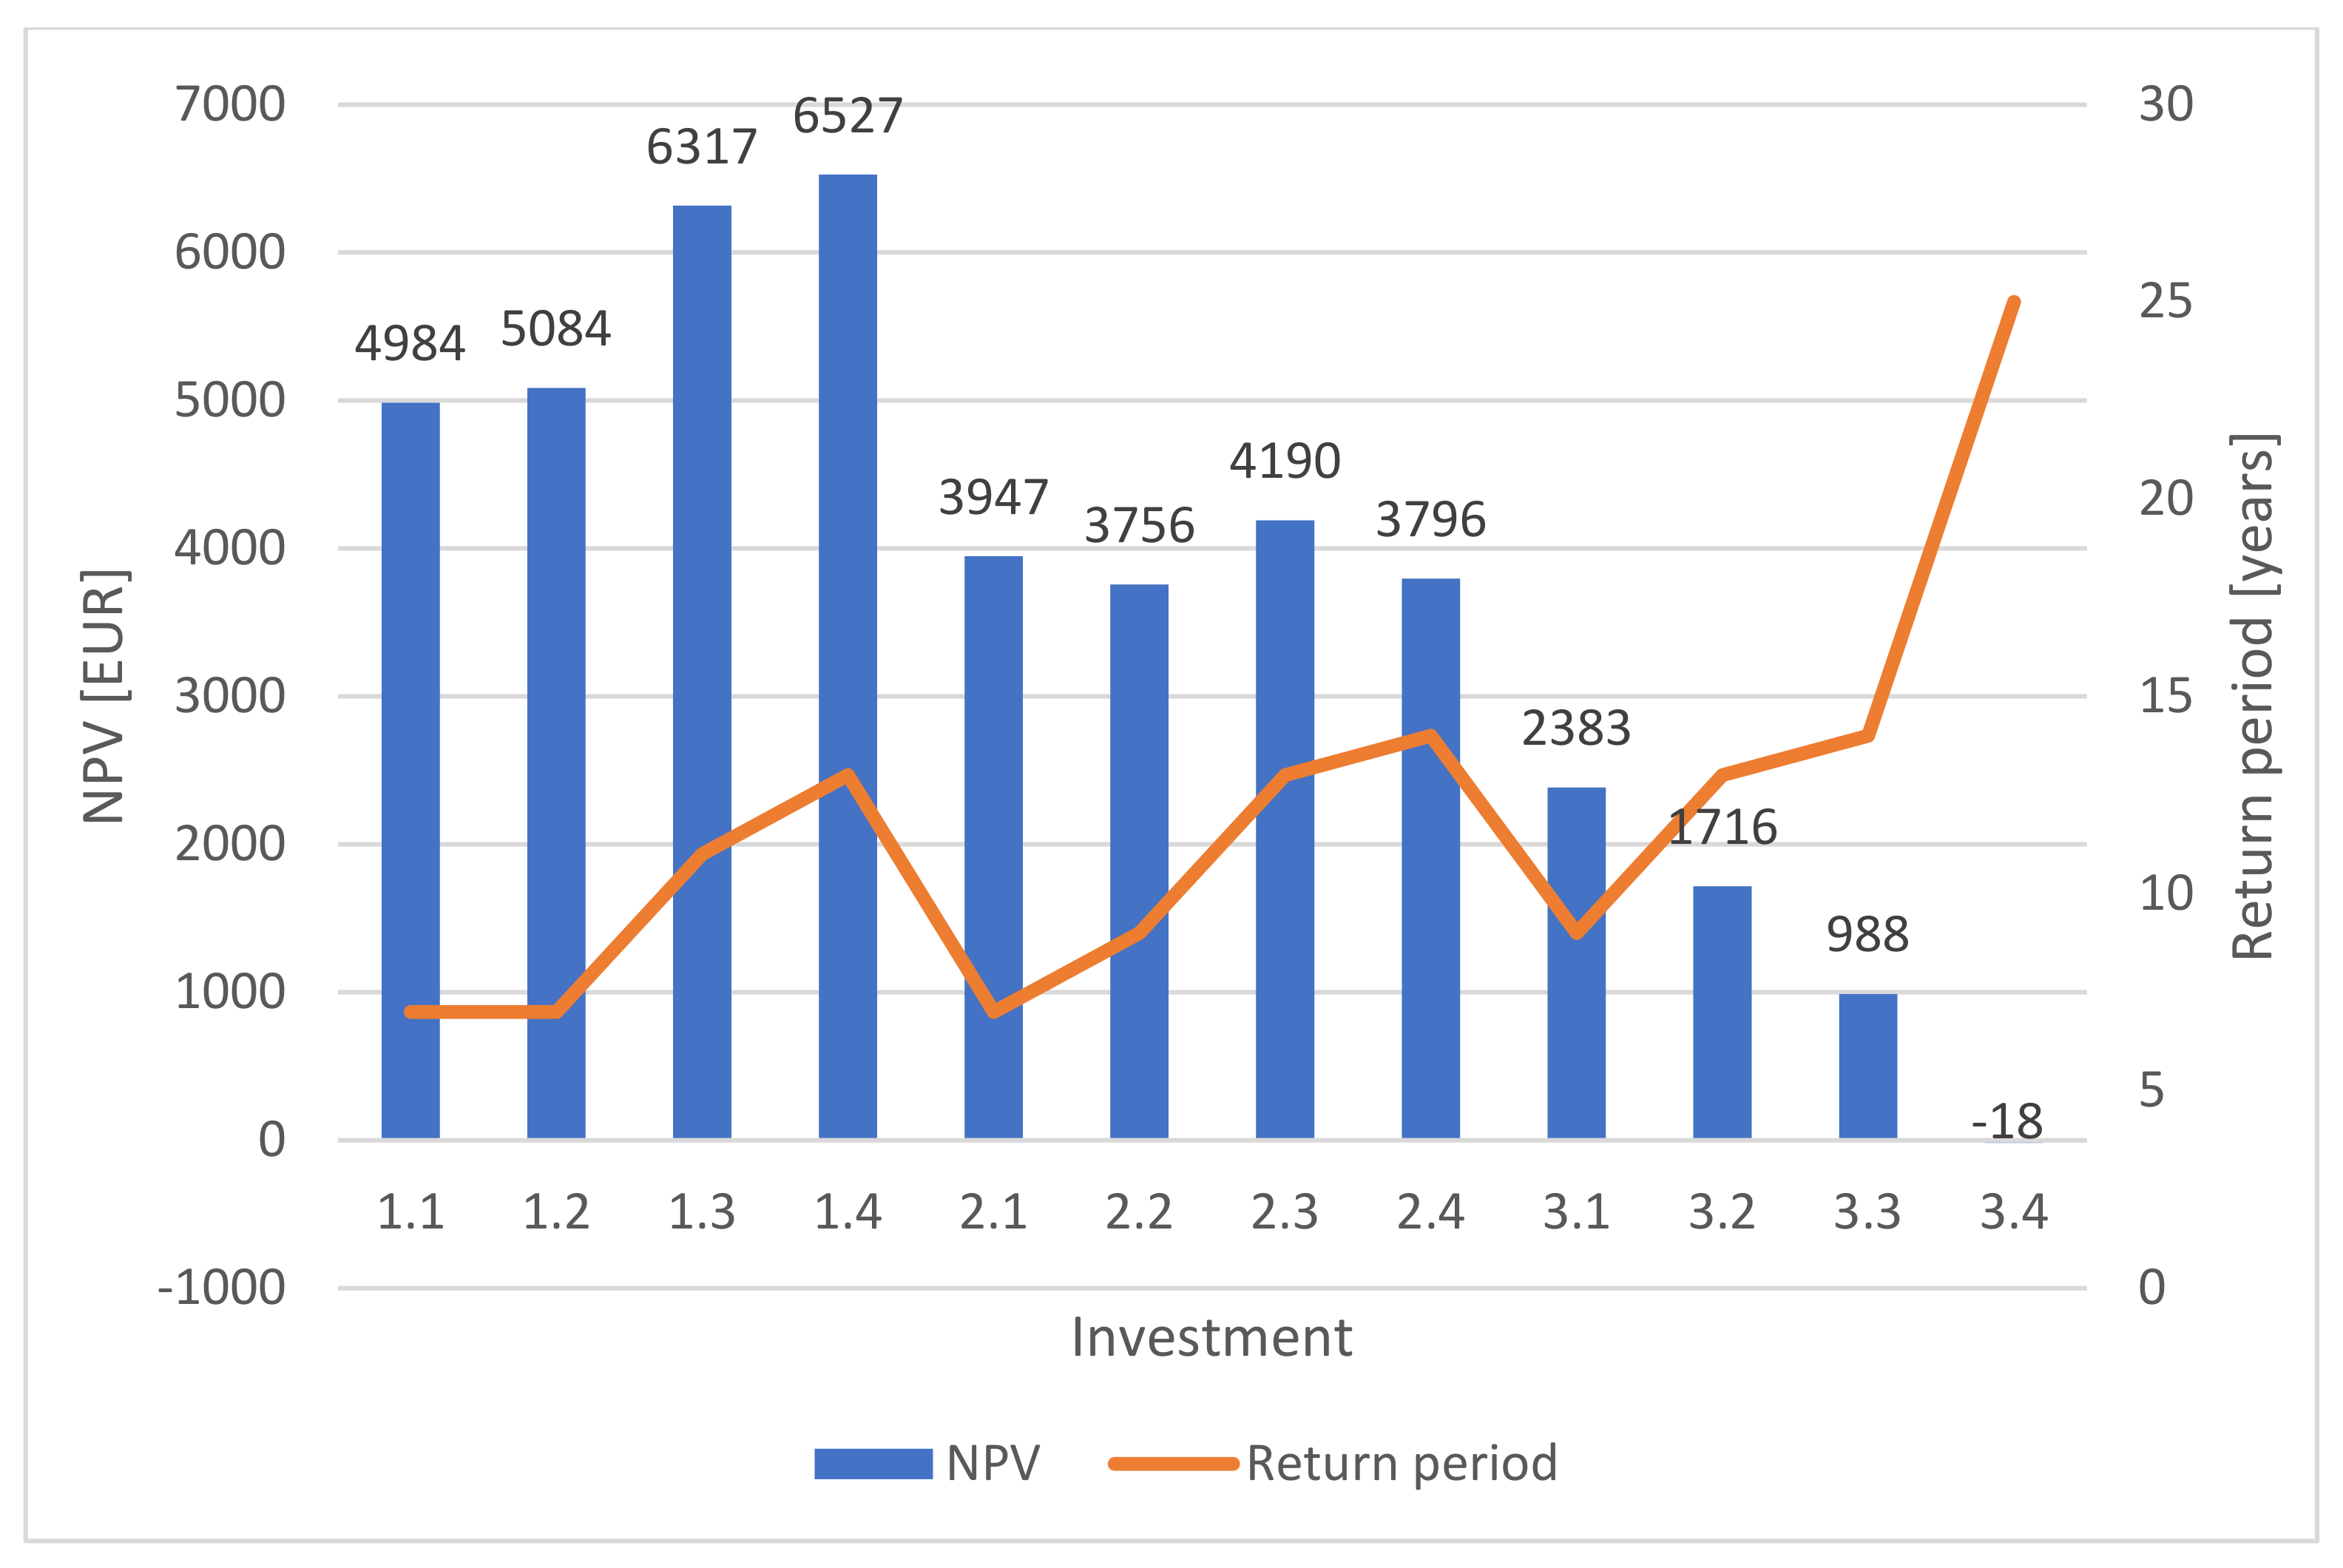
The values obtained for the profitability indicators: NPV and period of return on investment are depicted in
Figure 1.
For the current scheme, it is more cost-effective to design an installation that covers the demand even in the last year of its operation, whereas, for a transitional and planned schemes, it is more cost-effective to design an installation that only covers the demand in the first year.
For the current scheme, the profitability of all analysed options is the highest. At the same time the smallest is for the planned scheme.
The introduction of any of these analysed proposed schemes of RES financing in Poland will result in a decrease in profitability, which carries the risk of a decline in the pv growth dynamics in Poland.
In all cases, except for solution 3.4, the NPV is positive, which means that, in these situations, the investment in RES is profitable in relation to the baseline scenario.
In the case of the current and transitional scenarios (scheme), the most profitable is the investment, which consists of the installation of a heat pump and pv panels, while for the planned scheme, the most profitable is a system based on a gas boiler and pv panels.
The highest profitability of all considered investments can be obtained within the current scheme for heat pump and pv installation with the capacity to meet the demand in the last year of operation and that is the installation with the highest capacity under consideration (option 1.4).
Return on investment for heat pump installations is between 11–14 years. For solution 3.4, the return on investment is over 25 years. The return on investment for investments in pv panels cooperating with a gas boiler are in the range of 7–13 years.
3.2. Sensitivity Analysis of the Results
In the conducted analysis, the values of the parameters describing the increase in electricity prices (purchase and sale price by a prosumer), the increase in natural gas prices and the value of inflation are extrapolated on the basis of historical data, but there is no certainty as to their future values. In order to eliminate the resulting uncertainty, an analysis was carried out to determine the boundary values of these parameters, which would ensure obtaining the highest NPV value among all the options.
Table 5 shows the boundary values with the assumption that only one parameter is changed, and the other parameters’ values remain unchanged.
Based on the sensitivity analysis performed, it can be concluded that, theoretically, each of the options, except options 2.3 and 2.4, under certain conditions, may turn out to be the most advantageous.
Moreover, if the average annual increase in electricity purchase prices was not greater than 1.8%, the most profitable option would be option 1.3 based on a heat pump and pv panels, but assuming that the size of the installation is calculated to ensure 100% coverage of electricity demand only in the first year of its operation.
In addition, if the average annual increase in selling prices of the electricity produced in the pv installation to the grid was at the level of not less than 9.9%, the investment in photovoltaic would be profitable within the new net-billing financing scheme. However, taking into account that the above sensitivity analysis assumes a change in one parameter, while others remain unchanged, it would mean that not later than in 15 years, the price of selling energy to the grid would exceed the price of purchasing energy from the grid, which is against the logic and against the laws of the market. Thus, it can be concluded that, under market conditions, the average annual increase in the selling price of electricity is not able to cause a change in the most profitable option.
If the average annual increase in the price of natural gas was negative (a decrease in prices not lower than 0.4%), there is a possibility that one of the options providing for the supply with natural gas instead of a heat pump would be more profitable in the analysed period.
The change in the average annual inflation rate in the free market reality will not change the indication of the most profitable option, because all alternatives to option 1.4 are obtained with NPV < 0. In such a situation, the investment project should not be implemented.
4. Discussion
The self-consumption coefficient was set at the same level for both installation variants, based on: [
25], p. 14. The reality of the energy market in Poland shows that the self-consumption in variant: pv panels + heat pump may be several percentage points higher than in installation variant: pv panels + gas furnace. However, insufficiently detailed data in this regard make it impossible to indicate specific values for photovoltaic installations operating without a heat pump and with a heat pump. Therefore, in the paper a value that is the median of the self-consumption coefficients for photovoltaic installations in Poland, for both installations cooperating and not cooperating with the heat pump, was adopted.
The calculations regarding the profitability of individual investments were carried out for the installations’ capacities indicated in
Table 3. These are theoretical values and may not be achieved in reality, due to the power of individual pv panels available in the market offer. However, it was decided to use such an approach, because the main goal of this paper is to determine how a possible change in the support system will affect the profitability of a theoretical investment in Poland, and not to analyse the profitability of an investment for a specific case study.
Depending on the percentage of self-consumption, the profitability will change, it is particularly visible in scenarios 2 and 3 where a transmission fee (loss per kWh) or a sell/buy difference (loss per kWh) is introduced.
The assumption regarding the service life of heat sources (the article assumes 13 years for a coal-fired boiler and 20 years for a heat pump) will alter the outcomes. If we assume that both heat sources will be operational for no less than 25 years, the results would be more profitable than currently in the case of a heat pump. Moreover, the results are estimates due to the need to round the installation power values up or down in order to obtain a configurable power based on the available pv panels.
The currently functioning net-metering system based on the possibility of free-of-charge consumption of no more than 80% of the energy supplied to the grid favours the oversizing of the installation. This means that installations are designed to produce more energy than the building needs. This is perceived negatively due to the features of variable renewable energy sources, such as the potential need for increased operating reserves, the potential need for increased backup capacity, the potential negative impact on grid stability and reliability [
27,
28]. Although these threats are claimed to be not supported by sufficient evidence [
27], their realisation may depend on the national or local conditions of the grid. At the same time, it is in the interest of consumers to achieve RES deployment in the most cost-effective manner [
29].
Joint pv and heat pump installations have been gaining popularity in Poland in recent years. This combined solution has been competing with less climate friendly alternative of air-conditioning + pv installation. How the introduced legal changes will shape the future market penetration of these two alternatives is an interesting research question.
5. Conclusions
The results of this analysis showed that in this system it is more cost-effective to design an installation that covers the demand in the last year of operation, which creates an additional incentive to oversize the installation.
The highest profitability of all considered investments can be obtained within the current scheme for heat pump and pv installation with the capacity to meet the demand in the last year of operation and that is the installation with the highest capacity under consideration. Return on investment period for heat pump installations are between 11–14 years, whereas the return on investment for investments in pv panels cooperating with a gas boiler are in the range of 7–13 years.
A sensitivity analysis has proven that none of the factors in the free market reality, such as average annual increase in the purchasing or selling prices of electricity, purchasing prices of natural gas and inflation rate, will change the indication of the most profitable option of this study.
The introduction of changes in the new RES law (2021) will reduce the profitability of investments in pv panels, which will lead to a slowdown in the investments in the pv installations in Poland.
The development of photovoltaics in Poland at the household level in the coming years depends on the profitability of pv installations without energy storage, due to the low availability of such solutions. Nevertheless, an implementation of energy storage in a home pv system, similar to those already operating abroad, is the solution worth pursuing, especially if the policy is shaped in the direction of the net-billing scheme.


