Article

Study of the Critical Pore Radius That Results in Critical Gas Saturation during Methane Hydrate Dissociation at the Single-Pore Scale: Analytical Solutions for Small Pores and Potential Implications to Methane Production from Geological Media

by
Ioannis Nikolaos Tsimpanogiannis
1,*,
Emmanuel Stamatakis
2 and
Athanasios Konstantinos Stubos
3
1
Chemical Process & Energy Resources Institute (CPERI), Centre for Research & Technology Hellas (CERTH), Thermi, 57001 Thessaloniki, Greece
2
Institute of Geoenergy/Foundation for Research and Technology—Hellas (IG/FORTH), University Campus, Akrotiri, 73100 Chania, Greece
3
Environmental Research Laboratory, National Center for Scientific Research “Demokritos”, 15310 Aghia Paraskevi Attikis, Greece
*
Author to whom correspondence should be addressed.
Energies 2022, 15(1), 210; https://doi.org/10.3390/en15010210
Submission received: 13 October 2021 / Revised: 12 November 2021 / Accepted: 22 November 2021 / Published: 29 December 2021

Abstract

:
We examine the critical pore radius that results in critical gas saturation during pure methane hydrate dissociation within geologic porous media. Critical gas saturation is defined as the fraction of gas volume inside a pore system when the methane gas phase spans the system. Analytical solutions for the critical pore radii are obtained for two, simple pore systems consisting of either a single pore-body or a single pore-body connected with a number of pore-throats. Further, we obtain critical values for pore sizes above which the production of methane gas is possible. Results shown in the current study correspond to the case when the depression of the dissociation temperature (due to the presence of small-sized pores; namely, with a pore radius of less than 100 nm) is considered. The temperature shift due to confinement in porous media is estimated through the well-known Gibbs-Thompson equation. The particular results are of interest to geological media and particularly in the methane production from the dissociation of natural hydrate deposits within off-shore oceanic or on-shore permafrost locations. It is found that the contribution of the depression of the dissociation temperature on the calculated values of the critical pore sizes for gas production is limited to less than 10% when compared to our earlier study where the porous media effects have been ignored.

Graphical Abstract

1. Introduction

Under appropriate conditions of pressure and temperature, water molecules can self-assemble into forming cavities/cages that can be stabilized by the enclathration of guest molecules with size, such that can fit within the cavities (e.g., methane, ethane, propane, hydrogen sulfide, carbon dioxide, nitrogen, hydrogen, tetrahydrofurane, etc.). Depending on the size of the enclathrated guest molecule different type of cavities can form (e.g., 512, 435663, 51262, 51264, and 51268, which are formed primarily by pentagonal or hexagonal rings). By combining different number/type of cavities the formation of different hydrate structures is possible, with structures sI, sII, and sH being the more common encountered in nature (Sloan and Koh [1]). The natural hydrate deposits that are found within off-shore oceanic sediments or on-shore permafrost environments can contain significant amounts of methane gas, stored in pure or mixed methane hydrates, are the main focus of the current study. The properties of such systems have been discussed in a number of recent reviews [2,3,4].
Increasing industrial interest in hydrates arises, primarily, from flow-assurance related problems during oil/gas production and transportation (Kelland [5,6]), where hydrates are considered a nuisance. Furthermore, hydrates are encountered in worldwide accumulations (Collet et al. [7]; Chong et al. [8]), containing predominantly methane, both on-shore (under the permafrost), and off-shore (deposited within marine sediments). Hydrate accumulations amount to a significant reservoir of carbon. Note, however, that the size of the carbon reservoir is still under debate among the scientific community (Kvenvolden [9]; Buffet and Archer [10]; Milkov [11]; Klauda and Sandler [12]; Boswell and Collett [13]; Wallman et al. [14]; Pinero et al. [15]; You et al. [16]).
A significant effort has been undertaken during the recent years by the scientific community in order to delineate, with better accuracy, the amount of methane that is stored in hydrate deposits. This effort is important, since hydrates could represent in the future an important potential source of clean gas fuel (Buffet [17]). For the economically viable and environmentally friendly methane production from hydrate deposits, a number of issues need to be resolved adequately (Boswell and Collett [13]). Such issues include among others, the type of hydrate deposit, the amount of hydrate present in the deposit, and the total amount of hydrate that is accessible with the production approach (Boswell and Collett [13]; Walsh et al. [18]). Furthermore, the hydrate dissociation scheme should result in a process where hydrate dissociates under strict control, otherwise the uncontrolled dissociation can be the source of sever accidents and the possible complete destruction of the off-shore facilities. The economics of methane production through hydrate dissociation can be further improved by the simultaneous carbon dioxide sequestration within the hydrate deposits. In that case we can achieve the simultaneous energy production with environmental benefits.
On the other hand, the uncontrolled dissociation of oceanic or permafrost hydrates is also associated with the release of significant amount of methane to the atmosphere (Ruppel and Kessler [19]). Methane is a gas with a stronger green-house gas potential than carbon dioxide (Nisbet et al. [20]). According to Environmental Protection Agency (EPA) [21], methane is estimated to have a Global Warming Potential (GWP) equal to 28–36 over a period of 100 years, while the GWP becomes equal to 84–87 over a period of 20 years. Note that the particular values are according to the Intergovernmental Panel on Climate Change (IPCC) Fifth Assessment Report (IPCC [22]). In addition, the collapse of oceanic floor, due to uncontrolled dissociation of methane hydrate deposits, can create tsunamis that can be disastrous for coastal communities (Vanneste et al. [23]), while drilling through hydrate deposits can pose a serious hazard to offshore oil/gas platforms (McConnell et al. [24]).
The hydrate equilibrium primarily depends on the pressure and temperature conditions and the composition of the system under consideration. The presence of certain components in a hydrate-forming mixture can act as hydrate inhibitors or promoters, which can shift the equilibrium curve. Furthermore, the presence of electrolytes or confinement (i.e., as a result of hydrate formation within porous sediments) can also result in a shift in the equilibrium curve. The effect of confinement on the thermodynamic behavior of dissociation/formation of clathrate hydrates was addressed in a number of studies. Handa and Stupin [25] were the first to report experimental measurements of hydrate inhibition inside mesoporous silica. Handa and Stupin showed that for a constant temperature, the dissociation pressures of methane and propane hydrates in 70- A ο -radius pores are higher than the dissociation pressures in the bulk phase. Additional experiments resulting in similar observations were reported among others by Uchida et al. [26,27], Wilder et al. [28], Sheshardi et al. [29], Smith et al. [30], and Anderson et al. [31]. Additionally, by Kang et al. [32,33], Aladko et al. [34], Seo et al. [35], Lee et al. [36], Zarifi et al. [37], Zhang et al. [38], and Liu et al. [39]. Additional experimental references and a detailed discussion on the quality of the available methane hydrate, three-phase equilibrium (i.e., Hydrate–Liquid water–Vapor; H–Lw–V), experimental data under confinement have been discussed in further detail in Tsimpanogiannis [40]. It should be noted, however, that for the case of mixed gas hydrates the inhibition behavior can become more complex, as has been discussed in more detail in the recent experimental study of Gambelli [41].
Theoretical studies by Clennell et al. [42,43], Henry et al. [44], and Anderson et al. [45] were introduced to explain the inhibition effect occurring within the small pores of the porous sediments (i.e., the lowering of the hydrate equilibrium temperature for a constant pressure, or the increasing of the hydrate equilibrium pressure for a constant temperature). The inhibition effect of a porous medium on the hydrate equilibrium curve was modeled by using a modified version of the van der Waals–Platteeuw-based thermodynamic models (van der Waals and Platteeuw [46]; Parrish and Prausnitz [47]; Holder et al. [48,49], where an extra term was added to account for the lowering of the water activity as a result of the presence of the porous medium. Such works were reported, among others by Clarke et al. [50], Klauda and Sandler [12,51], Peddireddy et al. [52], Sun and Duan [53], Song et al. [54], and Duan et al. [55], Li et al. [56], Zarifi et al. [37], Zhou et al. [57], and Azimi et al. [58]. An additional discussion and related references on the effect of the capillarity in narrow pores on the hydrate equilibrium conditions can be found in the recent study by De La Fuente et al. [59].
Tsimpanogiannis [60] examined, in an earlier study (denoted herein as part I), the dissociation of methane hydrate occurring inside a single pore, as well as the effect of pore size on the ability to produce the gas phase that results from methane hydrate dissociation. The particular study focused on obtaining critical pore sizes for which the production of methane gas was possible. Essentially, an effort was undertaken to identify when the resulting gas phase can arrive at the edge of the system (i.e., indicating arrival at the gas production end). In part I, the hydrate inhibition, which results from the presence of small pore-sizes, was ignored. The objective of the current study is to relax that particular assumption and expand the previous work with the incorporation of hydrate inhibition phenomena on the calculation of the critical pore sizes for which methane gas production is possible from geological media. The main purpose is to quantify the effect of hydrate inhibition, occurring due to confinement, on the calculation of the critical pore radius.
The paper is organized as follows: First, we present a brief description of the problem in the framework of simple geological settings, associated with hydrate deposits. Methane gas is the product of hydrate dissociation. Then, the mathematical analysis is introduced and, in a subsequent step, we present the corresponding results for the critical pore-body sizes that are essential to successfully produce methane gas from the porous systems considered. Finally, the conclusions are presented. The conclusions from the current study can provide tentative insights on potential methane production scenarios during hydrate dissociation from geological media.

2. Background

Consider a geological porous medium (i.e., deposited sediment) saturated with water that also contains a distributed solid methane hydrate phase. The geological medium can be located either beneath the ocean floor (off-shore) or under the permafrost (on-shore). Based on earlier studies, Davie and Buffet [61] reported that the hydrate saturation, SH (defined as: S H = V H / V P , where VP is the total volume of the initial pore space, while VH is the total volume that is occupied by the hydrate solid; essentially, SH indicates the percentage of pore space that is occupied by hydrate), in oceanic porous deposits varies between values as low as 4–8% and as high as 20–35% of the available pore space. The particular values have been estimated based on seismic observations, resistivity measurements, and chlorinity profiles [61]. According to Davie and Buffet [61], the lower limit for hydrate saturation has been reported from studies at the Blake Ridge (Ocean Drilling Program (ODP); ODP Leg 164), while the higher limit for saturation has been reported from studies at the Cascadia Margin (ODP Leg 146). The lower hydrate saturations are often associated with hydrate conversion of biogenic methane that is produced locally (at temperatures lower than 50 °C). On the other hand, the higher hydrate saturations are associated with hydrate conversion of thermogenic methane that has migrated from deeper sediments where it has been produced at temperatures in the range 50–150 °C, which can also be combined with locally produced biogenic methane. Xie et al. [62] in a recent study presented a detailed report on hydrate saturation, obtained from natural gas hydrate deposits around the world, that have been studied during the recent years (e.g., Nankai Trough, Japan; Mallik Site Canada; Krishna-Godavari Basin, India; Bay of Bengal, India; Gulf of Mexico, USA; Ulleung Basin, South Korea; Shenhu Area, China; etc.). An extensive list of references regarding these sites can be found in Xie et al. [62]. Additionally, a detailed overview of hydrate occurrences in Europe has been reported by Minshul et al. [63]. Finally, You et al. [16] presented a comprehensive review of the different mechanisms that are associated with methane hydrate formation in geological porous media.
Depending on the fluid saturation in the geological sediments, different hydrate habits can develop (i.e., cementing at grain contact, grain coating, supporting matrix/grain, and pore filling). A detailed discussion has been presented by Waite et al. [64] and You et al. [16].
It is widely accepted that during hydrate formation in porous media with high initial water saturation, all the water inside a pore can solidify into hydrate with the exception of a thin (e.g., 5–50 nm for the case of mineral grains) adsorbed film that remains liquid (Clennell et al. [42]). Ice is strongly nonwetting and forms convex shapes within the pores that minimize the surface area (Clennell et al. [42]). This hypothesis was also confirmed by the two-dimensional visualization experiments of Tohidi et al. [65]. Thus, during the dissociation of hydrate, the liquid phase is the wetting phase while the produced gas is the non-wetting phase that occupies the center of the pore.
Hydrate dissociation occurs at appropriate equilibrium temperature, Teq, and pressure, Peq, conditions. For prevailing pressures in the porous medium that are above the dissociation pressure Peq, the hydrate remains stable within the porous medium. However, when the pressure drops below Peq, the hydrate dissociates into gas and either water (for temperatures that are above the freezing temperature of water) or ice (for temperatures that are below the freezing temperature of water).
After hydrate dissociation has occurred, we can identify two distinct steps in the process, with respect to the behavior of the produced gas phase. The gas phase partially occupies a given pore volume during the first stage, essentially staying far from the pore walls. For cases where the gas pressure, Pg, becomes higher than the sum of pressures in the surrounding liquid phase, Pl, plus the capillary pressure of the gas bubble, Pc ( P c = P g P l ), the growth of the gas bubble is possible. Such bubble growth can continue up to the point that the gas phase reaches the pore walls. Upon the arrival of the gas cluster at the pore walls, any further bubble growth is opposed by the capillary forces at the neighboring pore throats. This is considered the end of the first step. A significant consequence results from the first step. In case that within a particular pore the pressure is such that P g < P c + P l , then the gas phase cannot grow any further. This implies that the gas phase is not capable of connecting with other neighboring gas clusters that are located in the proximity; therefore, remaining completely isolated in the particular pore. In such a case, the gas phase connectivity, as well as the gas phase production capability, are negatively affected. This particular problem can be remediated through gas mobilization. The gas phase can be mobilized in the presence of strong viscous/buoyancy forces (i.e., encountered close to a production well).
During the second step, if the pressure in the gas phase, Pg, is high enough to overcome the capillary threshold, Pc, of at least one of the neighboring pore throats (i.e., the largest pore throat), the gas phase can expand to occupy additional pores, until capillary pressure equilibrium is achieved within the system.
Hydrates are non-stoichiometric compounds. Namely, the hydrate crystal structure can retain stability, while at the same time certain cavities of the structure can be empty; therefore, the cavity occupancies are variable and depend on the prevailing pressures and temperatures. Figure S1a of the Supplementary Data shows the large and small cavity occupancies of sI methane hydrate along the hydrate equilibrium curve. Shown also (Figure S1b) is the three-phase (H–Lw–V) equilibrium pressure of the system methane + water system. Both the hydrate equilibrium pressure and the cavity occupancy values were calculated using the CSMGem simulator (Sloan and Koh [1]).
Natural hydrate deposits in sediments are often over-pressured. Namely, the prevailing pressure is higher than the three-phase (H–Lw–V) equilibrium pressure required for the hydrate to be stable. This is clearly shown in Figure S2a of the Supplementary Data, where the pressure conditions of several, known oceanic sites, with confirmed hydrate occurrence, are plotted along with the three-phase (H–Lw–V) equilibrium curve (based on data reported by Makogan et al. [66]). Shown also (Figure S2b) are the corresponding overpressures (Tsimpanogiannis and Lichtner [67]). There are cases where the pressure in the hydrate deposit is 450 bars above the hydrate equilibrium pressure. Earlier Monte Carlo (MC) simulations of sI methane hydrates (Papadimitriou et al. [68,69,70]; Lasich et al. [71]; Brumby et al. [72]) or other gas hydrate ([73,74]), have shown that for a given temperature, if the pressure is higher than the hydrate equilibrium pressure, an increase in the cavity occupancies, θ i , C H 4 (with i = S, L, indicating the small (512) and large (51262) cavities, respectively, of the sI methane hydrate), can occur. Namely, it was concluded that θ i , C H 4 1 , as the pressure increases. In addition, the calculations for methane that were reported in part I (Tsimpanogiannis [60]), indicate that the results when partial cavity occupancy is considered are very close to the results when 100% occupancy is considered. This is true at higher pressures/lower temperatures, where cavities are close to being fully occupied. Minor differences occur at lower pressures/higher temperatures where cavity occupancies deviate from 100%. Therefore, for the remainder of the paper we report results only for the case of 100% cavity occupancy. A detailed discussion of hydrate-related MC simulations has been presented in a recent review by Tsimpanogiannis and Economou [75].

3. Mathematical Modeling

As discussed in part I (Tsimpanogiannis [60]), the following condition needed to be satisfied for a gas bubble that results from the dissociation of hydrate under confinement, in order for the gas phase to grow:
P g P c + P l
where the pressure is denoted by P and the subscripts g and l denote the gas and liquid phases, respectively. The capillary pressure is denoted by P c and results from the presence of curvature in the gas–liquid interface. The capillary pressure can be, (i) either that of the gas bubble, for the case of a bubble located inside the pore-body, or (ii) that of the largest pore-throat, for the case of a gas bubble that has occupied most of the pore-body and resides inside a number of neighboring pore-throats.
In order to calculate the gas-phase pressure, P g , we used the ideal gas law corrected with the compressibility factor, z, in order to account for the high pressures that the gas phase can reach for the problems under consideration. In the current study, the compressibility factor was calculated using the component-specific Equation of State (EoS) for methane introduced by Duan et al. [76].
Regarding the liquid pressure, P l , which also corresponds to the pore pressure (used interchangeably in the current study) it was essential to obtain the pressure field in the domain of interest. Consider the schematic depicted in Figure 1, where a two-dimensional (2D) domain with a randomly distributed hydrate phase is shown. The entire domain is depicted as an effective porous medium, while the geometrical details of the pore network are not shown. Two characteristic zones can be identified; one zone where the pore pressure is P l > P e q , and, thus, no hydrate dissociation is possible, and a second zone where the pore pressure is P l P e q , which corresponded to the area where hydrate dissociation is possible. The hydrate-dissociation front is part of the second zone and the following equality applies at the front: P l = P e q . It should be noted that the depiction of the “dissociation front” as a simple straight line in Figure 1 is a simplistic approach (needed for obtaining analytical solutions to the problem), indicating the presence of a zone where the hydrate had dissociated completely and a zone where dissociation had not occurred. However, in a realistic geological system, a “dissociation front zone” exists instead. The width of the particular zone can depend on the width of the pore size distribution that is present in the system. Furthermore, it should be pointed out that, in a real porous medium with pores that follow a pore size distribution, the dissociation front is expected to be a fractal object, rather than a straight line (note that it can reduce to a straight line if all pores are of the same size or, alternatively, in the absence of the porous domain). The particular problem bears similarities with the “liquid-to-gas” phase change problem that is encountered in the drying/evaporation of porous media, which has been discussed in detailed in [77,78,79]. Additionally, it should be noted that P–T diagrams of real geological media, which also indicate the shift of the hydrate equilibrium curves, can be found in the studies of Liu and Flemings [80] and De La Fuente et al. [59].
Condition for Gas Bubble Growth and Production.

3.1. Case A: Ignoring the Effect of Small Pores on the Hydrate Equilibrium Conditions

In the current study, we followed the same notation as the one used in the case of part I (Tsimpanogiannis [60]). In a similar manner, we examined a methane hydrate-saturated system consisting of a single pore-body connected with a number of pore-throats (the coordination number, ζ , indicates the number of pore-throats connected to the single pore-body), where the solid hydrate dissociated into liquid water and methane gas. We were interested in identifying a critical value (denoted with subscript c) for the pore-body radius, r p c , S i , such that the gas saturation after dissociation in the porous medium under examination reached a critical gas saturation ( S g , S i S g c , S i ). Essentially, the amount of hydrate that was present within the pore-body was adequate to release enough methane gas (upon hydrate dissociation), such that the gas phase could reach the outside boundaries of the porous medium. Therefore, the production of the gas, resulting from hydrate dissociation, could be practically realized. Alternatively, for the case where r p r p c , S i , the production of gas was possible. However, in the case of r p < r p c , S i , not enough gas arrived at the outer boundaries of the porous system and, consequently, an inhibition of gas production was observed. Gas bubble mobilization due to buoyancy or viscous gradients was ignored in the current study. Note that the viscous gradients close to the production well could be important and result in the mobilization of gas bubbles.
In part I, the following general solution was obtained for the critical pore-body radius, r p c , S i . The particular solution could be applied to two different porous media systems denoted with Si (with I = 1 or 2). The systems that were examined consisted of a single pore-body and a number of pore-throats. In particular, S1 corresponds to a system consisting of only a single pore-body, while S2 corresponds to a system consisting of a single pore-body connected with a number, ζ (i.e., coordination number), of pore throats.
r p c , S i = 2 γ g l z λ R T e q b u l k S g c , S i ( 1 b S g c , S i ) F S i ( S g c , S i )
where γ g l is the gas (methane)/liquid (water) interfacial tension, z is the gas compressibility factor, R is the universal gas constant, λ is a parameter that is proportional to the amount of gas that is present in the hydrate cages, b = P l z λ R T , and F S i ( S g c , S i ) is a function that depends on the geometric characteristics of the porous system and discussed in detail in part I. Figure 2 shows the effect of temperature (and pressure) on the gas–liquid interfacial tension, γ g l (Figure 2a), and the compressibility factor, z (Figure 2b). The calculations shown in Figure 2 correspond to the bulk phase and are essential for Equation (2). The calculations shown in Figure 2 are performed at P, T conditions that correspond to the three-phase (H–Lw–V) equilibrium conditions for the binary system: methane + water.
The hydrate dissociation temperature in the bulk is a function of pressure, T e q b u l k = f ( P e q b u l k ) . For the case of methane hydrate it can be calculated from a simple expression, P e q b u l k = exp ( m + n T e q b u l k ) (where m, n are component-specific constants), as the one discussed by Holder et al. [49], or a more refined correlation, such as the one proposed by Moridis [81]. Alternatively, a method that couples the van der Waals–Platteeuw method (van der Waals and Platteeuw [46]) with a cubic equation of state (e.g., the CSMGem simulator discussed by Sloan and Koh [1]) or a Statistical Associating Fluid Theory (SAFT) type equation of state (e.g., see the discussion by Dufal et al. [82]; El Meragawi et al. [83]), can be utilized.
It was shown in part I that meaningful solutions (i.e., r p c , S i > 0 ) are obtained as long as:
1 b S g c , S i > 0 S g c , S i < z λ R T P l
A detailed discussion regarding the behavior of r p c , S i , in the absence of any confinement effects, has been presented in part I, and therefore, it is not discussed further in the current study. The growth behavior of the gas bubbles, resulting from hydrate dissociation, has been explored in detail using the hydrate pore-network simulator that has been developed by Tsimpanogiannis and Lichtner [84,85]. The particular problem has also similarities with the earlier pore-network studies on the critical gas saturation during primary oil production, discussed by Du and Yortsos [86], and Tsimpanogiannis and Yortsos [87].

3.2. Case B: Incorporating the Effect of Small Pores on the Hydrate Equilibrium Conditions

When hydrates are located inside small pores (e.g., confined within a porous sediment with a pore radius smaller than 100 nm) a depression of the hydrate dissociation temperature occurs as a result of the confinement (Clennell et al. [42]; Henry et al. [44]). This shift (inhibition) of the equilibrium conditions becomes stronger as the pore size decreases. The temperature depression of the hydrate equilibrium value ( Δ T e q = T e q p o r e T e q b u l k ), when compared to the bulk conditions ( T e q b u l k ), that results from the presence of a porous medium can be described by the Gibbs-Thompson equation [40]:
T e q p o r e T e q b u l k T e q b u l k = κ ( γ s l cos ϑ s l ρ s Δ H s )
where γ s l is the solid (hydrate)/liquid (water) interfacial tension, ϑ s l is the contact angle between the solid hydrate–liquid water interface and the pore wall ( ϑ s l is equal to 180° when measured through the solid hydrate and further assuming that the pores are “water-wet”, while the solid hydrate is nonwetting, thus cos ϑ s l = 1 ). The effect of having solid pore walls with different chemistry can be reflected through the change in wettability and in particular through a different contact angle, ϑ s l . An extensive discussion and experimental, as well as molecular, simulation data, on the effect of surface chemistry on contact angles, can be found in the recent review by Liang et al. [88]. ρ s is the solid (i.e., hydrate) density, κ is the solid–liquid interface curvature, and Δ H s is the latent heat of dissociation/melting. Tsimpanogiannis et al. [89] reported a detailed review on experimental and computational methods for the Δ H s of sI methane hydrate. The interface curvature between the solid and liquid can be defined as follows:
κ = ( 1 r 1 + 1 r 2 )
where r1 and r2 are the two principle radii of curvature with directions that intersect orthogonally at that point.
For the particular case of a cylindrical pore, Anderson et al. [45] argued that one of the principle radii (i.e., the one along the length of the cylindrical pore) is infinite, when dissociation occurs. In that case, hydrate dissociation throughout the entire pore-length can occur instantly. Therefore, for the case of cylindrical pores, the solid–liquid interface curvature is equal to:
κ = 1 / r
while for the case of (i) hydrate formation in cylindrical pores and (ii) hydrate dissociation/formation in spherical/cubic pores, it is equal to:
κ = 2 / r
It has been shown by Tsimpanogiannis [40] that the hydrate dissociation temperature inside the porous medium is related to the dissociation temperature in the bulk through the following equation:
T e q p o r e = T e q b u l k ( 1 κ α )
where we have defined the parameter α , as:
α γ s l cos ϑ s l ρ s Δ H s
As it has been discussed in detail in Tsimpanogiannis [40] the temperature depression, Δ T e q , has also been associated with experimental measurements of three-phase equilibrium conditions under confinement in porous media with pore diameter, d, through the following expression:
Δ T e q T e q b u l k = β * 1 d
β * the slope of the line that goes through the origin of the axes in the plot Δ T e q / T e q b u l k vs. 1 / d , for the available experimental data of hydrate equilibrium. A value of 0.1695 ± 0.0006 (nm) has been reported for β * (Tsimpanogiannis [40]). By combining Equations (4), (8) and (9), we observe that α = β * κ d , which finally reduces to α = β * 4 for hydrate dissociation in spherical or cubic pores or α = β * 2 for hydrate dissociation in cylindrical pores (see also the detailed discussion in Tsimpanogiannis [40]).
Tsimpanogiannis [40] has examined the case when the three parameters γ s l , Δ H s and ρ s are functions of temperature and their dependence is such that the parameter α is constant (i.e., α c o n s t ) and independent of temperature. The temperature-dependence of ρ s has been obtained from extensive Monte Carlo simulations (Papadimitriou et al. [68,69,70,90]), The temperature-dependence of Δ H s has been obtained from molecular dynamics (MD) simulations (Tsimpanogiannis et al. [89]), while the temperature-dependence of γ s l has been obtained by a hybrid method that combined the aforementioned calculated parameters with experimental measurements of three-phase equilibrium conditions under confinement (Tsimpanogiannis [40]). Figure S3 of the Supplementary Data shows the temperature dependence of the three parameters, ρ s , Δ H s and γ s l , for the case of sI methane hydrate.
On the other hand, a number of studies have determined the engineering assumption that the values for the particular three parameters ( ρ s , Δ H s and γ s l ) are independent of temperature in the short range of interest (275–300 K) to gas hydrate equilibria. Table 1 shows the range of values that have been used in various studies for the case of methane hydrate. Based on the values that are reported in Table 1 we observe that α can range between 6.7699 × 10 11 and 1.1489 × 10 10 , if we select the min/max values for ρ s , Δ H s and γ s l appropriately. The two aforementioned distinct scenarios with respect to the parameters ρ s , Δ H s and γ s l (i.e., temperature -dependent or -independent), both result to having a constant value for the parameter α .
Figure 3 shows the effect of pore radius on the temperature depression (absolute values) during methane hydrate dissociation in porous media. Results are shown for the temperature of 275 K and the two aforementioned scenarios regarding the parameters ρ s , Δ H s , and γ s l (i.e., constant and variable). The corresponding case for the temperature of 310 K is shown in Figure S4 of the Supplementary Data. The curves that are shown in Figure S4 of the Supplementary Data shifted by approx. 3K to higher values than those shown in Figure 3. The limited shift observed between 275 K and 310 K is a result of the small variability for the parameters of Equation (4) that are shown in Figure S3 of the Supplementary Data, in the same temperature range. From the particular figure we can observe that for T e q b u l k = 275   K there is a shift to lower values by, Δ T e q = 1   K , for the case of hydrate dissociation in a pore with an approximate radius of 2.5 × 10 8   m , while higher Δ T e q s result for smaller pore-body sizes. The corresponding pore-body radius for T e q b u l k = 310   K is approximately 2.8 × 10 8   m . It is evident; therefore, that for small pore sizes the depression in temperature needs to be taken into account in the calculations. Sahou et al. [91] estimated that the temperature shift (towards lower values) for the case of bulk methane hydrate equilibrium conditions at 8.8 MPa and 9.8 °C, is equal to 4.8 °C. For the particular calculation, Sahou et al. used the constant values for ρ s , Δ H s and γ s l , reported by Clennell et al. [42] for the case of ice. For the same bulk equilibrium P, T conditions, we calculated in the current study (using variable parameters for ρ s , Δ H s and γ s l ) a temperature shift to lower values that is equal to 2.52 K.
In part I, we reported results obtained from an analytical solution for the case that the depression of the dissociation temperature was ignored and thus Peq was independent of the pore size. In this paper the aforementioned assumption is relaxed and the depression of the dissociation temperature is taken into account and therefore Peq depends on the pore size.
By introducing Equation (4) into (2), we can obtain an expression for the critical pore-body radius which consists of two terms:
r p c , S i t o t a l = r p c , S i + r p c , S i s h i f t
The first term at the right-hand side (RHS) of Equation (11) is the solution that corresponds to the problem in the bulk (discussed extensively in part I), while the second term at the RHS is the correction that corresponds to the effect of the porous medium. The correction term, r p c , S i s h i f t , is given as:
r p c , S i s h i f t = z λ R T e q b u l k z λ R T e q b u l k P l S g c , S i ( f α ) Ω c , S i ( f α )
where f is a constant that has a value equal to 1 for the case of hydrate dissociation in cylindrical pores, while a value equal to 2 for the case of hydrate dissociation in spherical or cubic pores. In Equation (12) we have also defined the function Ω c , S i as follows:
Ω c , S i z λ R T e q b u l k z λ R T e q b u l k P l S g c , S i

4. Results and Discussion

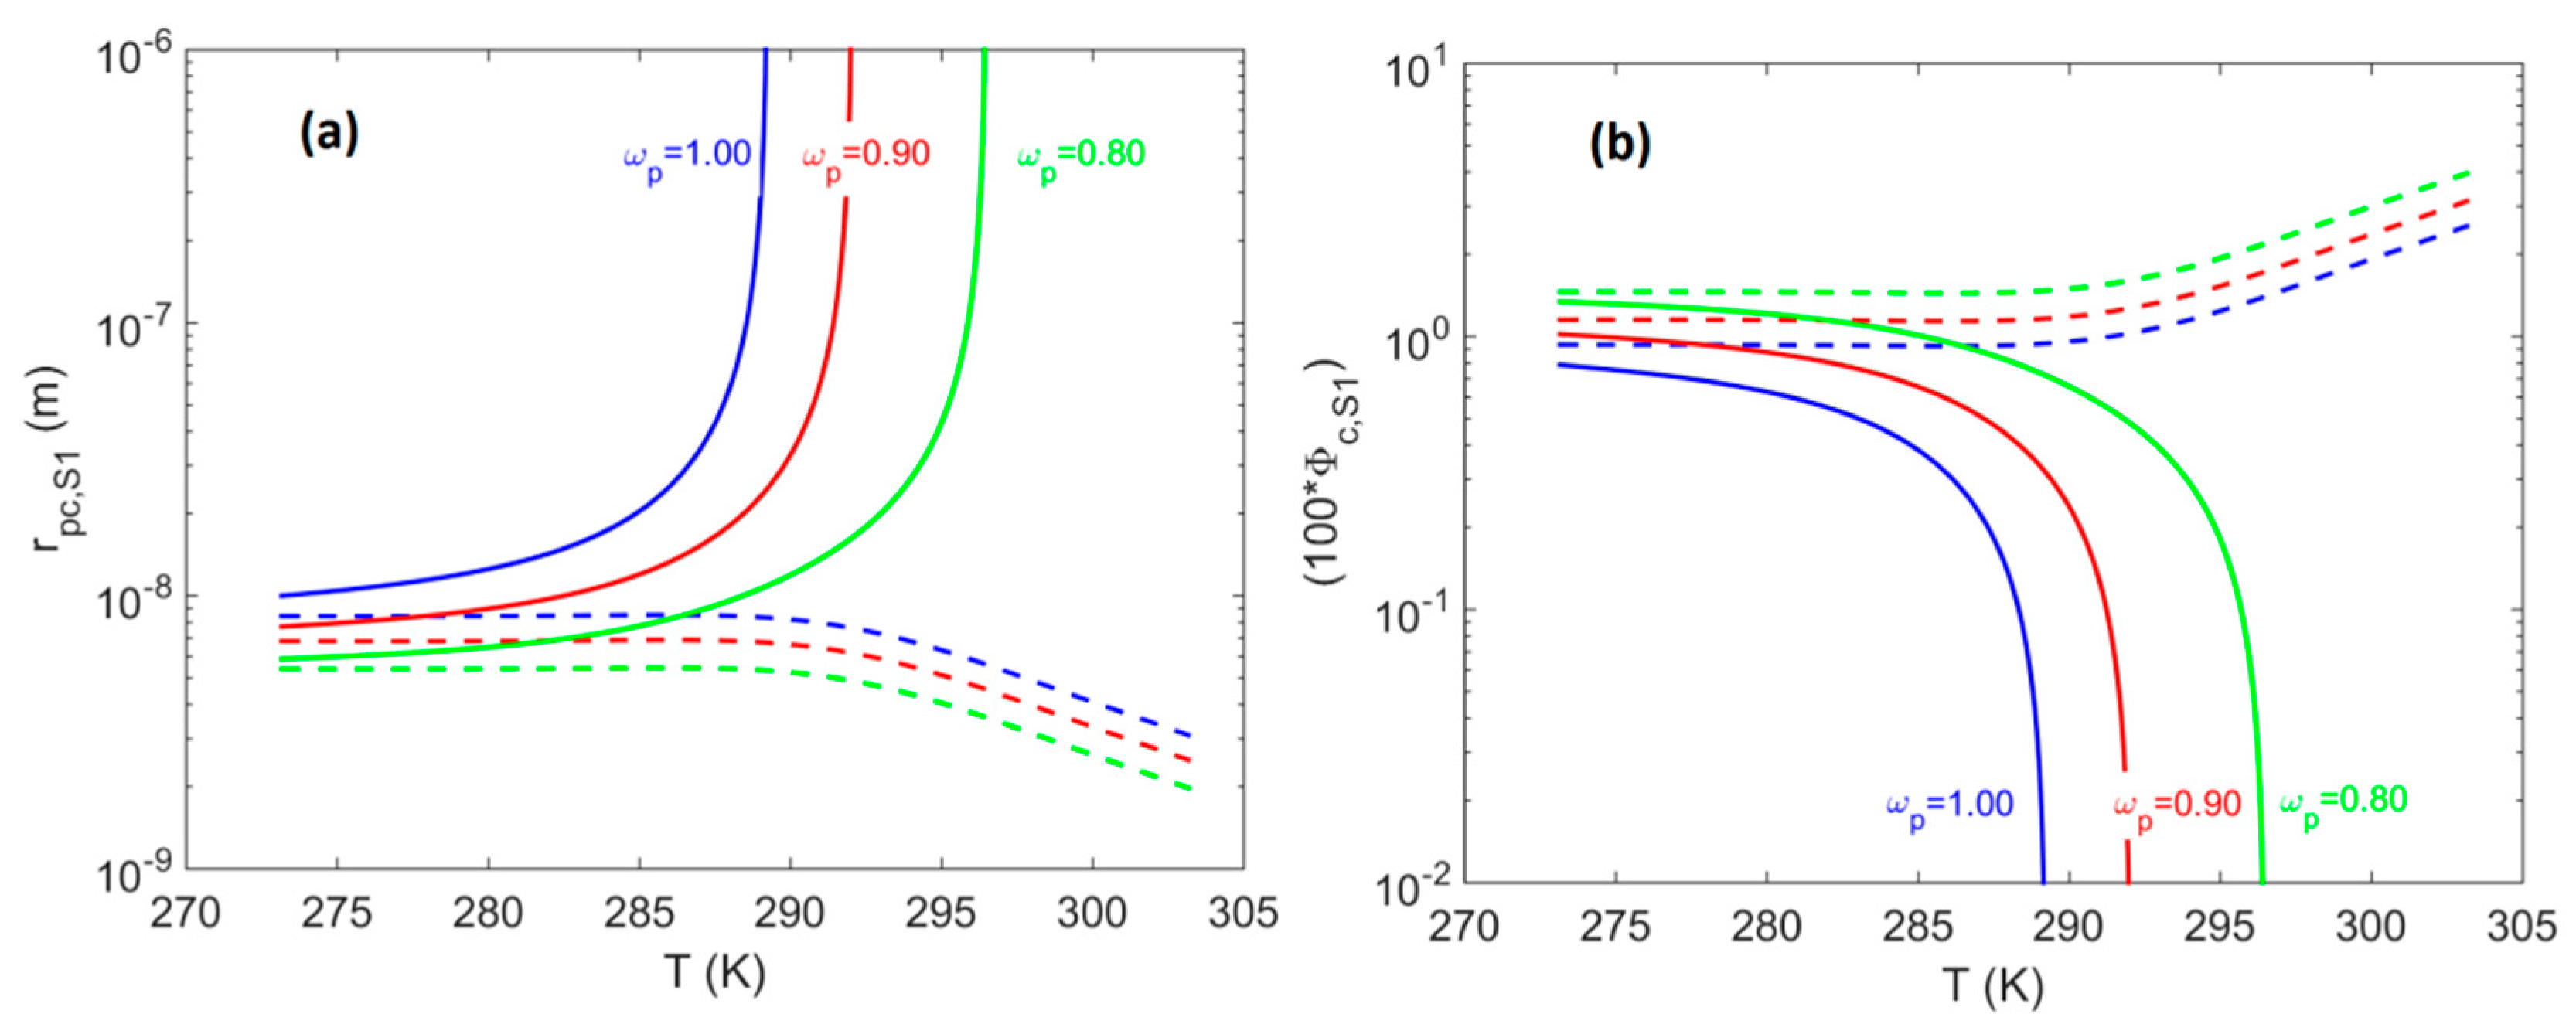
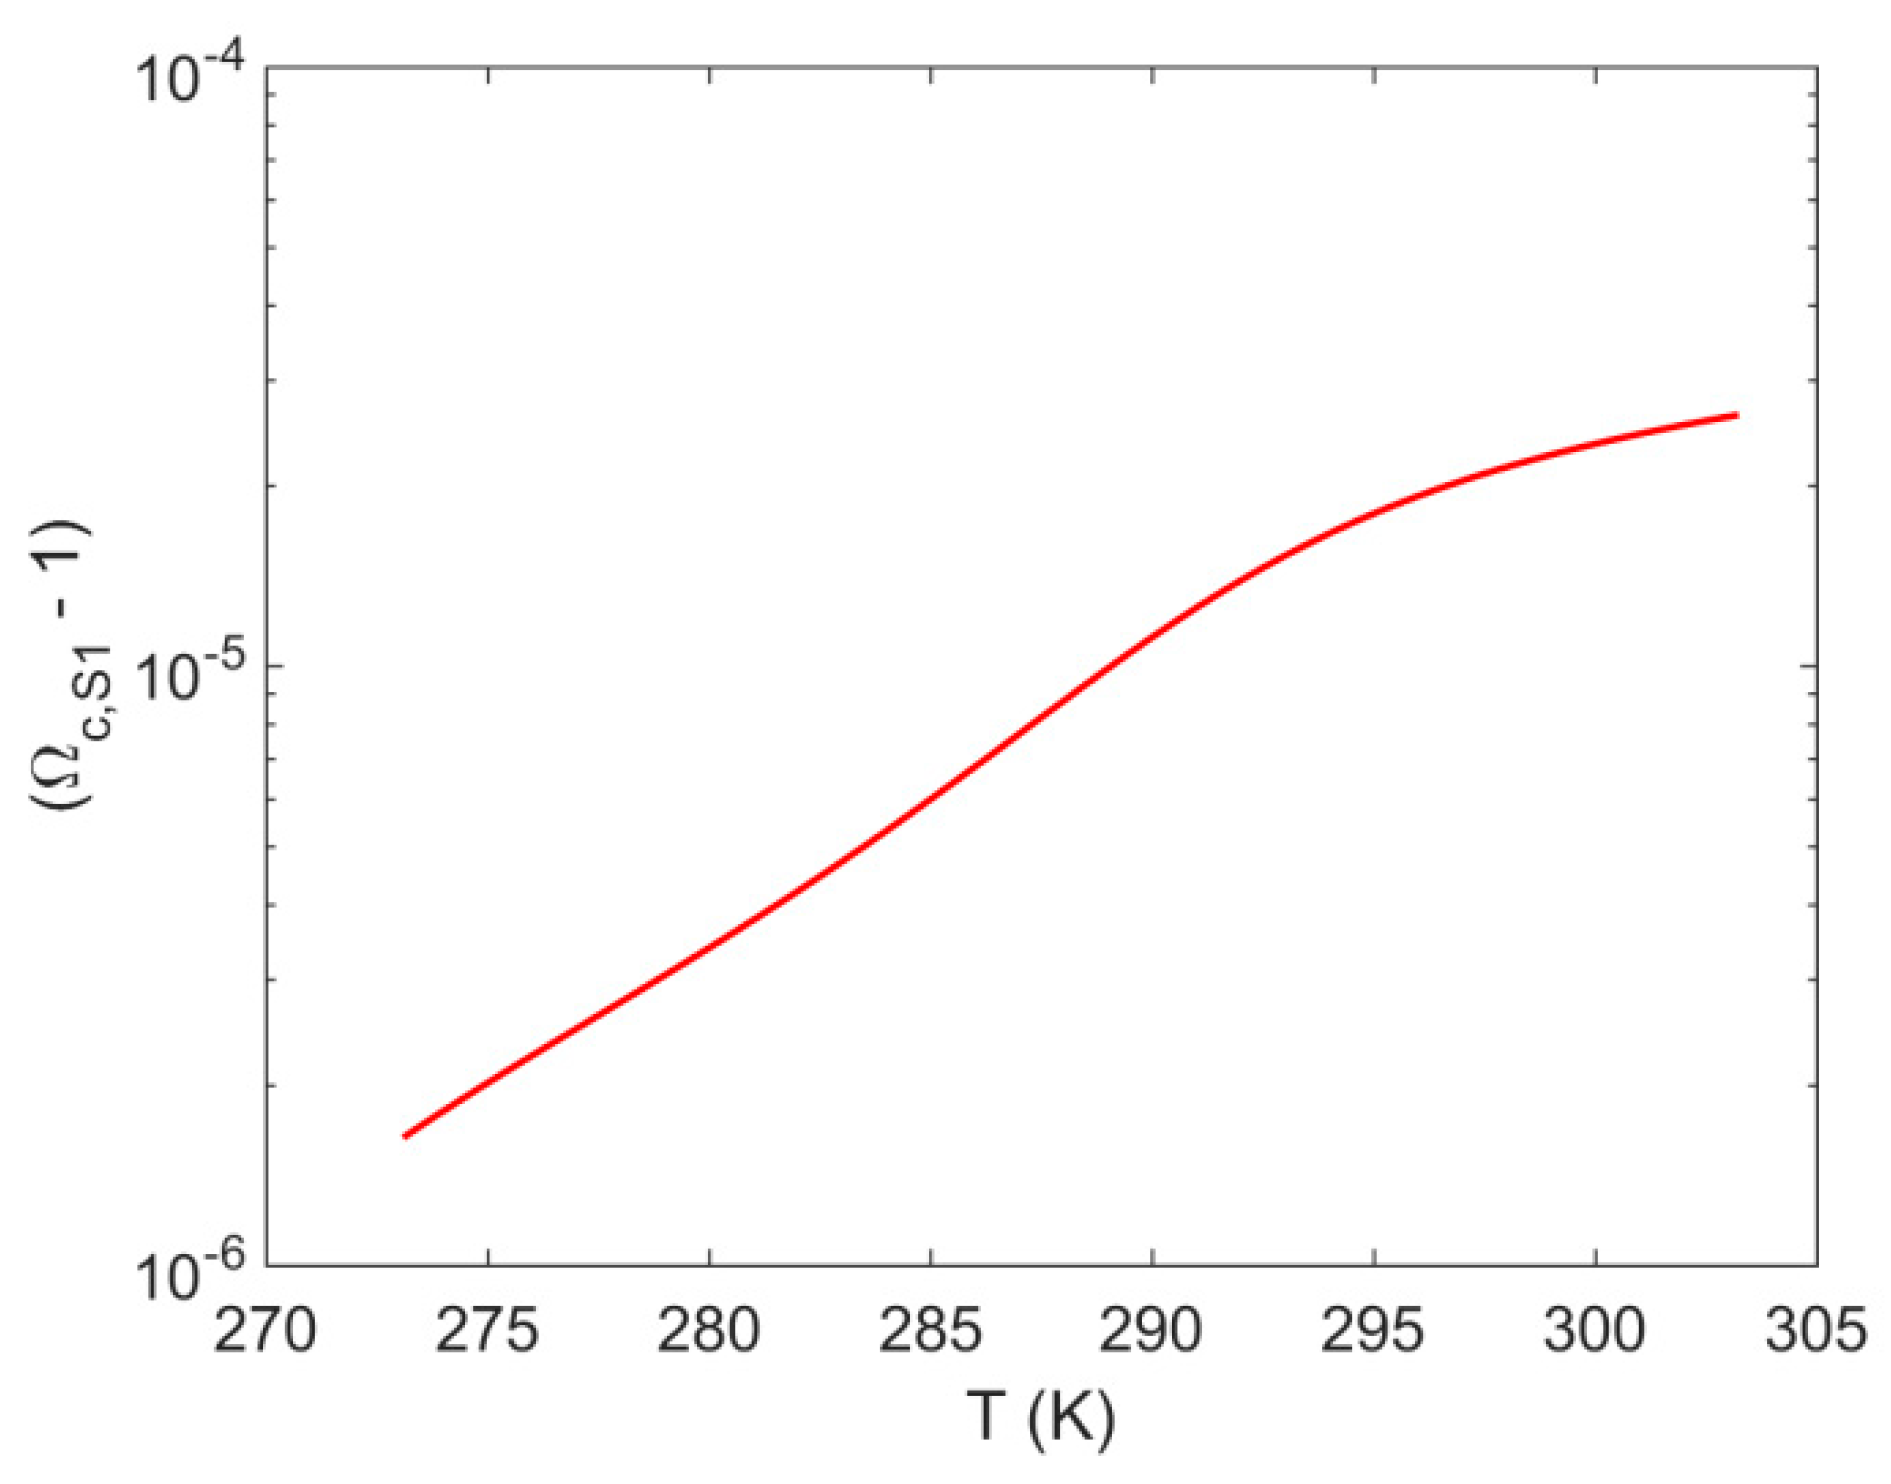
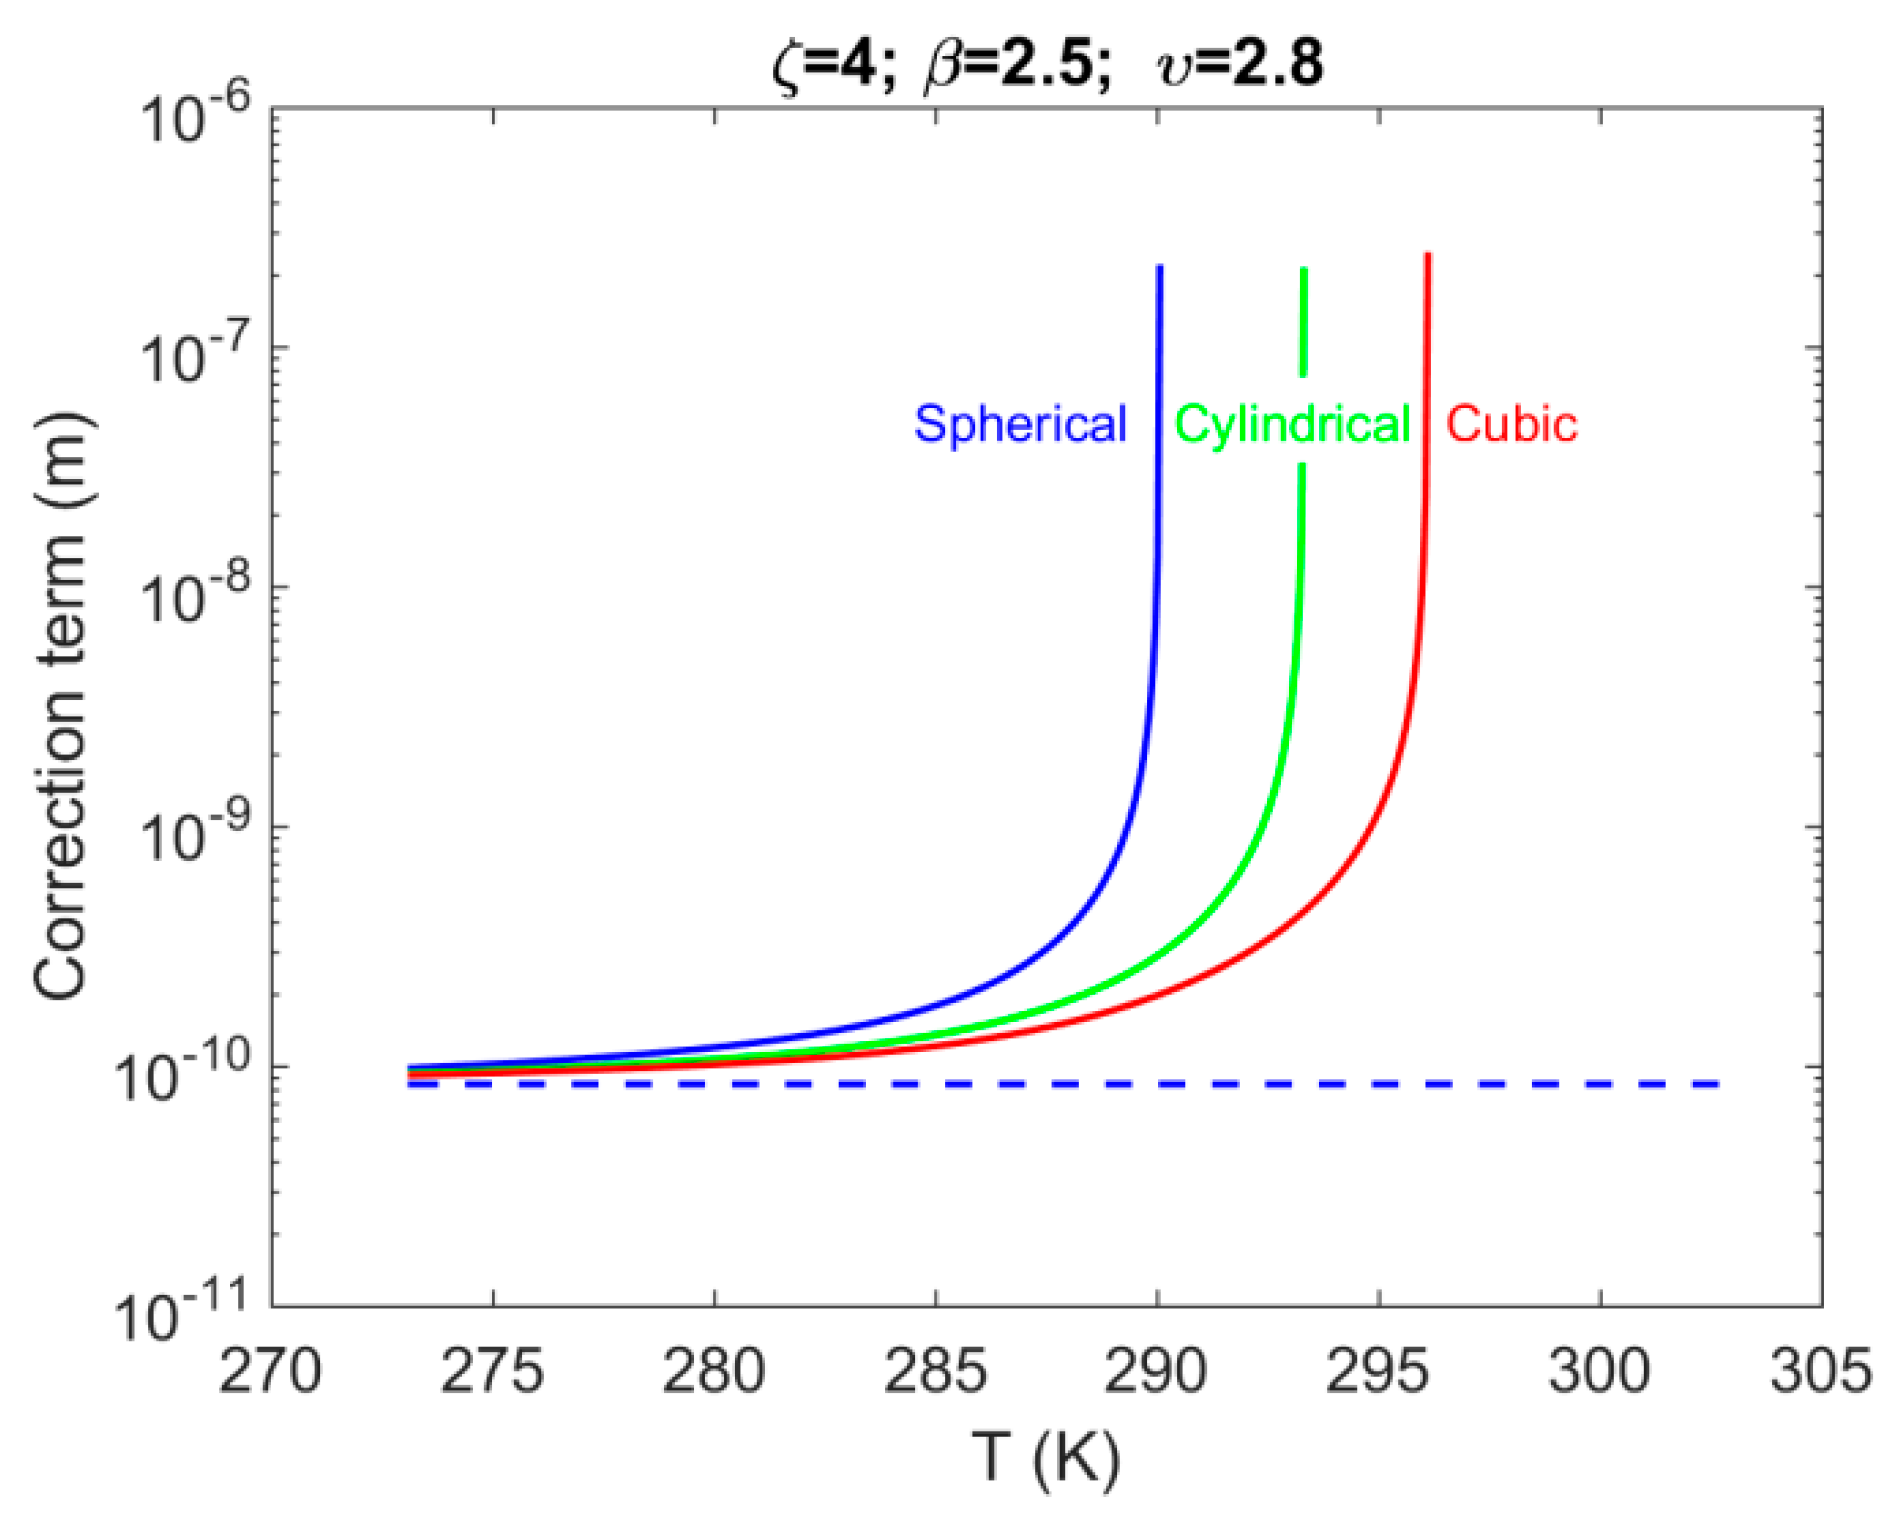
4.1. System S1: Single Pore-Body

Figure 4 shows the correction term, r p c , S 1 s h i f t , as a function of temperature, calculated along the three-phase (H–Lw–V) equilibria line for the methane + water binary system. We observe that the correction term has a very week dependence on temperature. Essentially, there is a change of only 0.002% between the minimum (at 275 K) and maximum (at 305 K) values of r p c , S 1 s h i f t . Furthermore, for the case of S1 we observe that the term Ω c , S 1 is approximately equal to one (i.e., for all engineering purposes), as is shown in Figure 5, where we plot ( Ω c , S 1 1 ) as a function of temperature. We can observe that ( Ω c , S 1 1 ) is in the range 1 × 10 6 3 × 10 5 , for the temperature range 275 K–305 K. Therefore, the following approximation can provide accurate results for engineering-type calculations:
r p c , S 1 s h i f t f α
Figure 6a shows for comparison purposes the calculated r p c , S 1 as a function of temperature (along the three-phase, H–Lw–V, equilibrium line) without accounting the confinement effect (discussed in part I). Figure 6b shows the contribution of the correction term (i.e., r p c , S 1 s h i f t ) that is calculated from Equation (12), that originates from confinement. The figure shows the ratio,
Φ c , S 1 ( r p c , S 1 s h i f t / r p c , S 1 t o t a l )
plotted as a function of temperature (and the corresponding hydrate equilibrium pressure), for the case of a spherical, cylindrical or cubic pore-body, without any liquid film remaining at the pore-body walls (i.e., ω p = 1 ). Essentially, it shows the value of ( 100 * Φ c , S 1 ) , namely, the per cent (%) contribution of confinement on the total value of r p c , S 1 .
The Figure 6a,b show two distinct families of curves. In particular, pore-bodies that were located exactly on the hydrate-dissociation front ( P l = P e q b u l k ) belong to the first family of curves and correspond to the upper limit (denoted as solid lines). On the other hand, pore-bodies that were located at points where the pressure was observed to be at a minimum ( P l = 0 ) belong to the second family of curves and correspond to the lower limit (denoted as dashed lines). In addition, for pressures such that P e q b u l k > P l > 0 , an infinite number of curves could be identified between the aforementioned upper and lower limits. Essentially, such pressures can be encountered within the porous domain between the location of the hydrate dissociation front and the location of the initial lowering of the pressure (e.g., at the production well for the case, a pressure depletion scheme was followed).
We observed the following regarding the shift in the hydrate equilibrium temperature that resulted from the confinement:
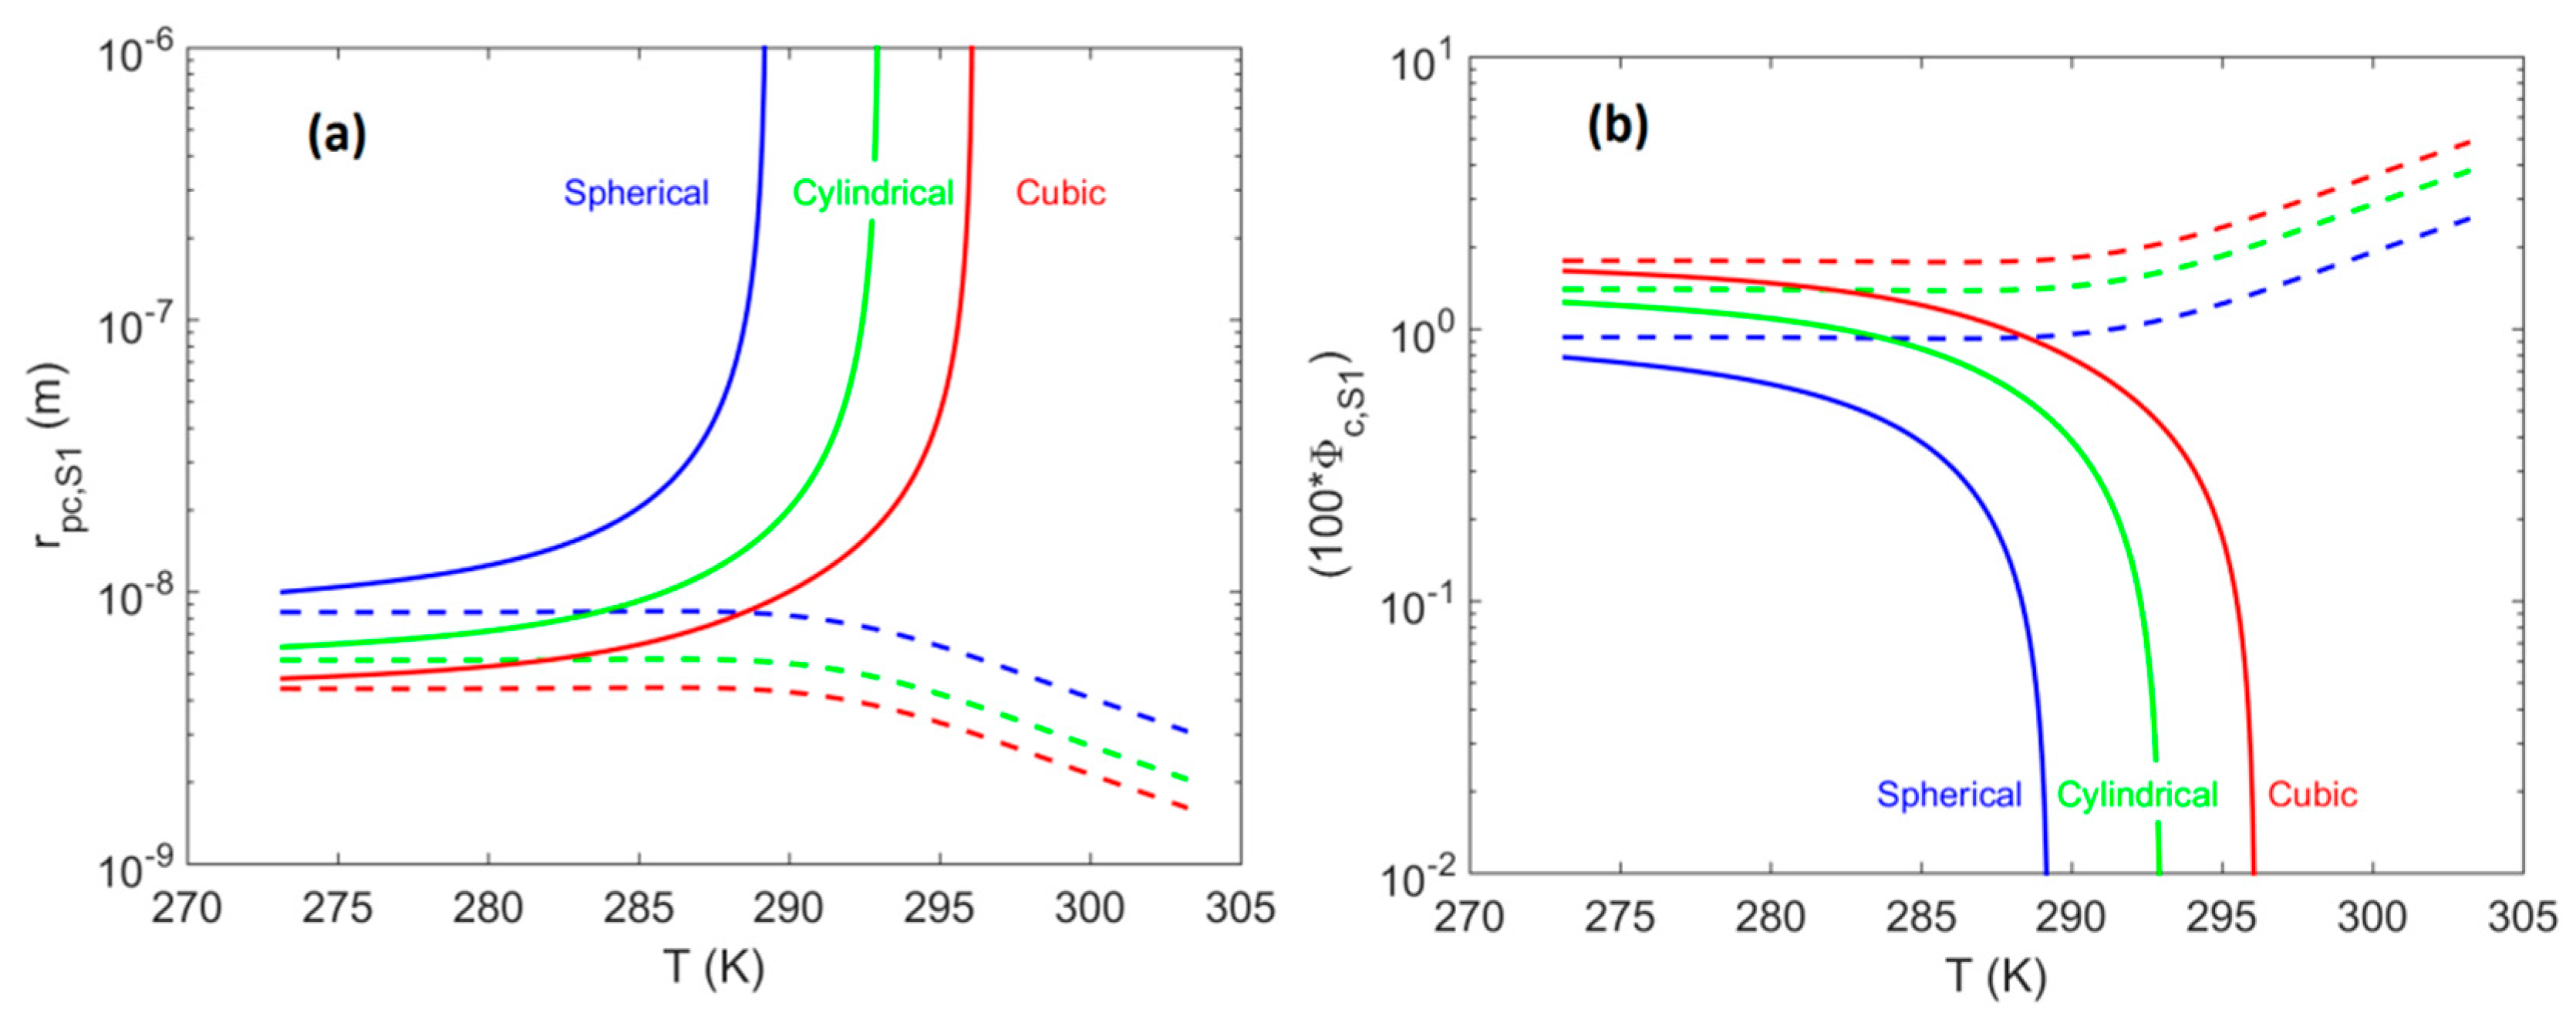
  • At pores located on the hydrate-dissociation front (i.e., where P l = P e q b u l k ), a shift of less than 2% is observed, with the shift magnitude having values in the following order: cubic > cylindrical > spherical.
  • At pores located at points with the minimum pore pressure (i.e., where P l = 0 ) for well production via a pressure depletion scheme, a shift of less than 5% was observed, with the shift magnitude having values in the following order: cubic > cylindrical > spherical.
Figure 7b shows the effect of a thin liquid film that remains on the pore-body walls on the value of ( 100 * Φ c , S 1 ) , as a function of temperature (and the corresponding hydrate equilibrium pressure) for the case of a spherical pore-body. The existence of thin liquid films remaining on the pore-body walls (i.e., ω p < 1 ), results in shifting the correction term to higher values. In particular, for the case of a spherical pore-body located on the hydrate-dissociation front, to less than 0.8% (for ω p = 1.00 ), 1.0% (for ω p = 0.90 ), and 1.4% (for ω p = 0.80 ). The corresponding values for the case of a spherical pore-body, located far from the hydrate-dissociation front (i.e., P l = 0 ), are less than 2.5% (for ω p = 1.00 ), 3.5% (for ω p = 0.90 ), and 4.0% (for ω p = 0.80 ). Similarly, the top panel of Figure 7 shows for comparison purposes the calculated r p c , S 1 , plotted as a function of temperature (along the three-phase, H–Lw–V, equilibrium line), without accounting the confinement effect (discussed in part I).

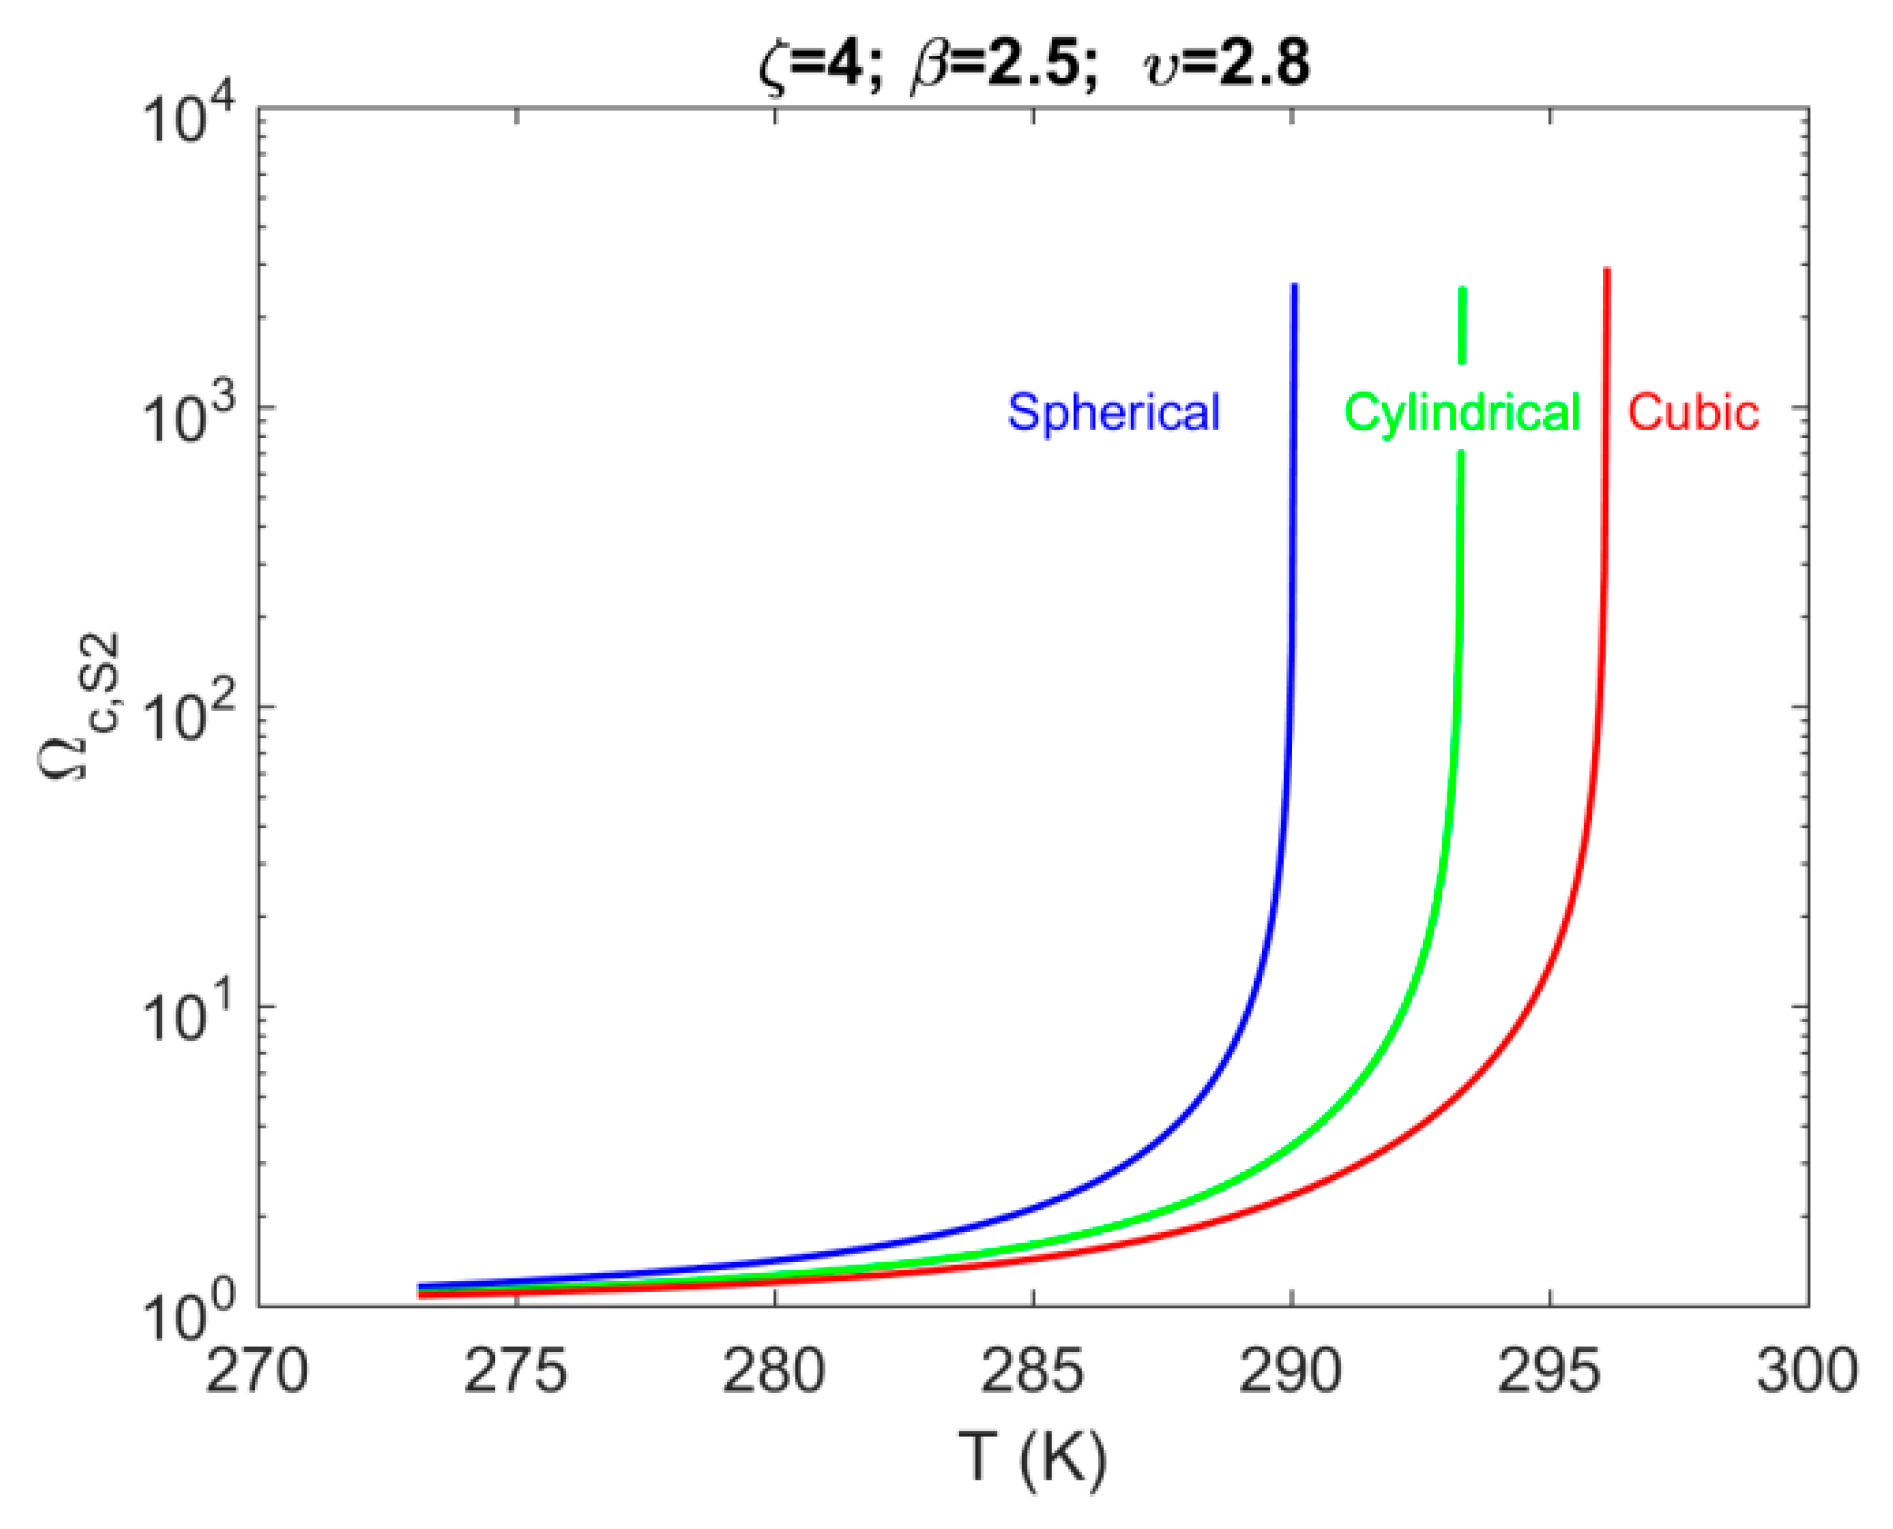
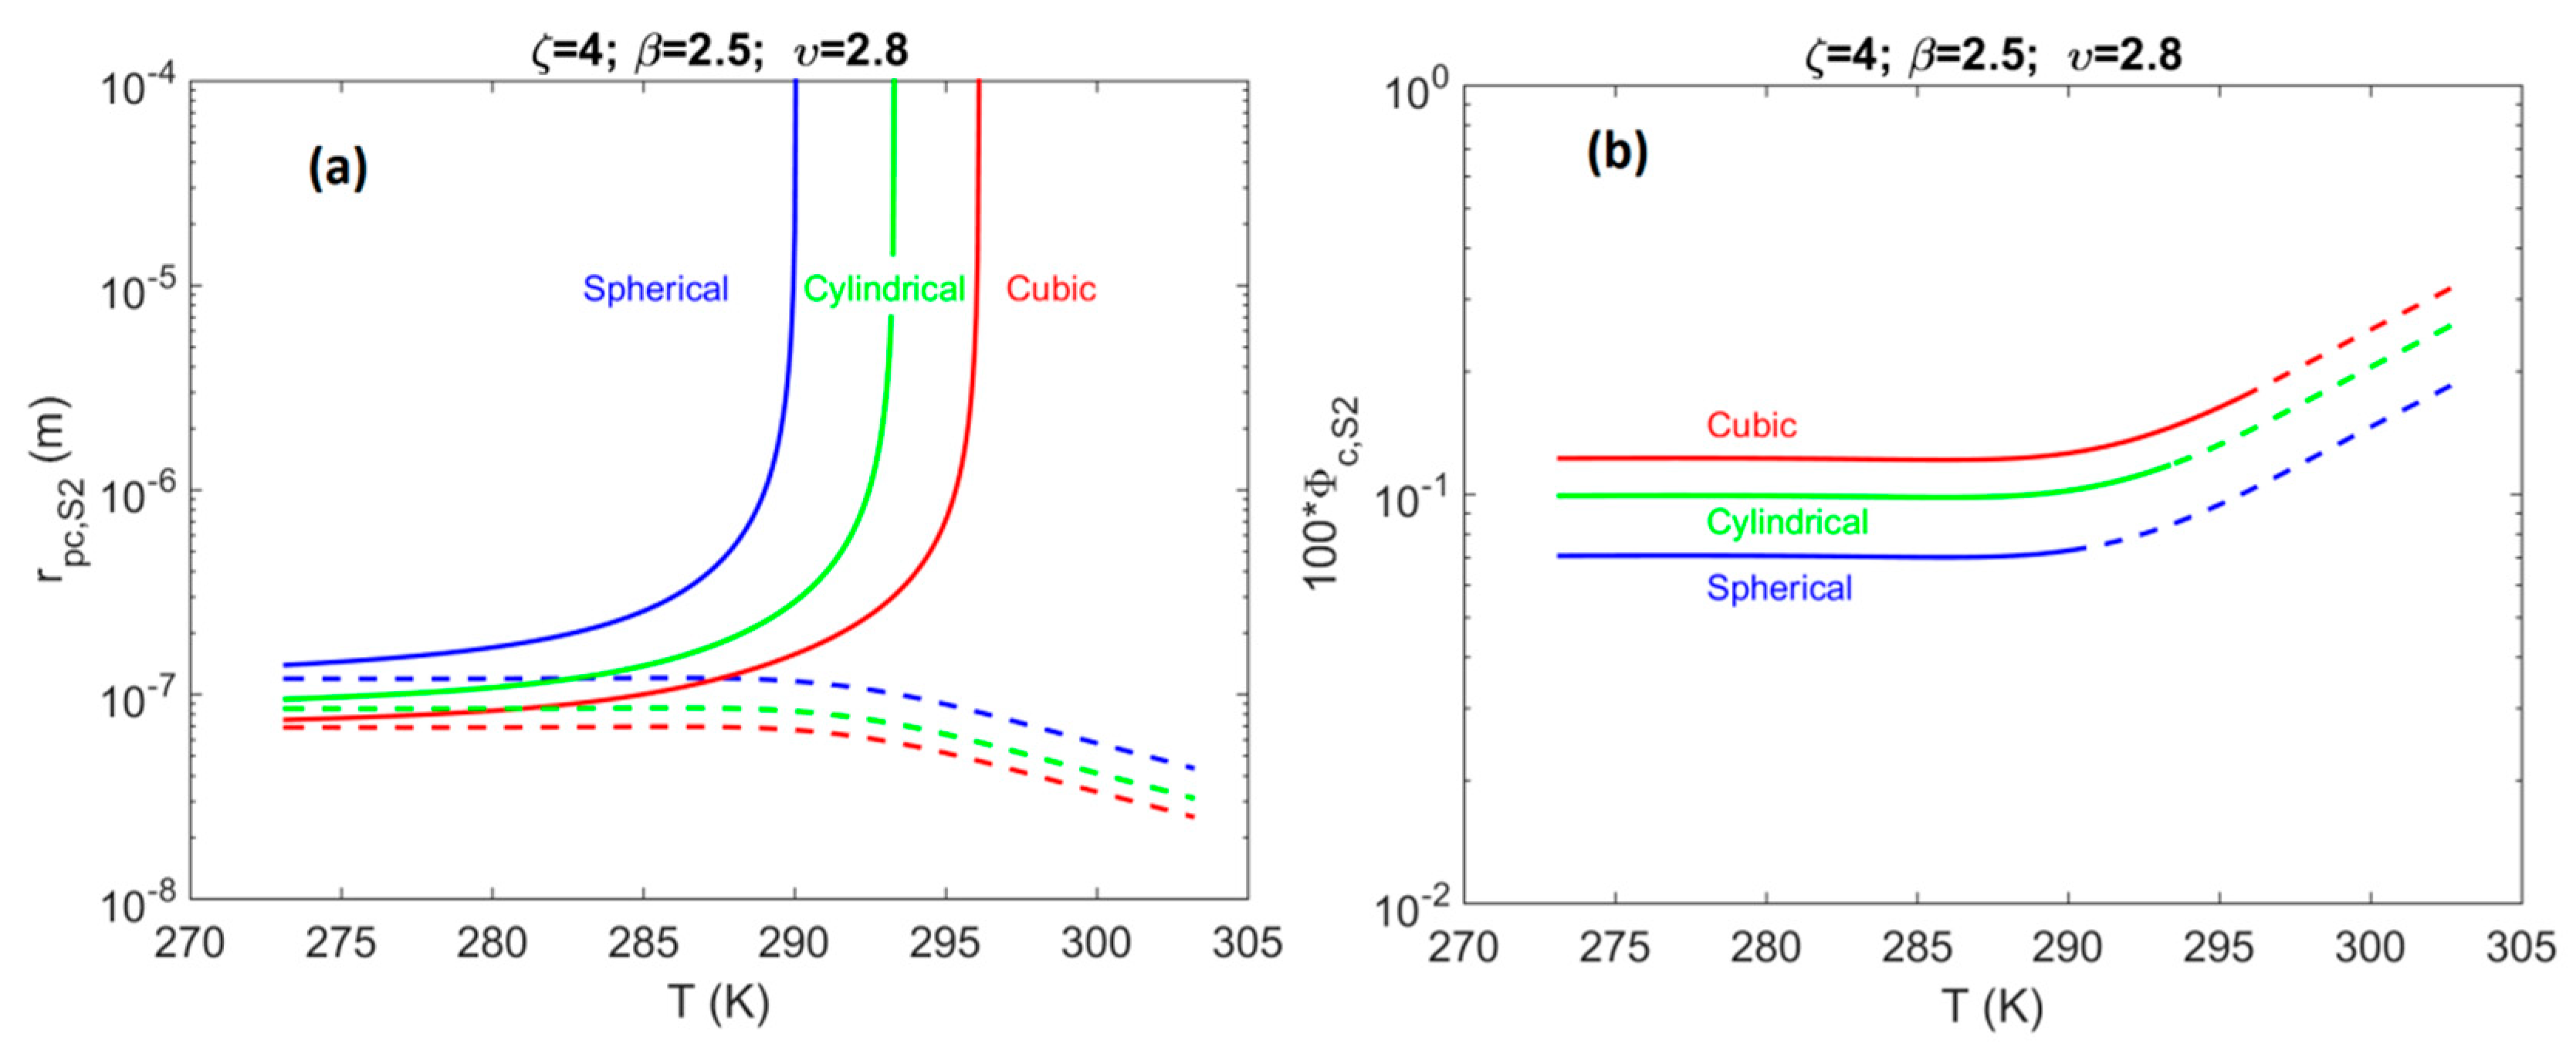
4.2. System S2: Single Pore-Body Connected with a Number of Pore-Throats

In the current Section, we consider a porous system consisting of a single pore-body (spherical, cylindrical, or cubic) that is connected with four (i.e., ζ = 4 ) cubic pore-throats (i.e., system S2). The remaining geometrical parameters are defined and have values that are similar to cases considered in our previous study (part I). In particular, the parameter, is defined as the ratio of the radius of the pore-body ( r p ) over the radius of the pore-throat ( r t ): β = r p / r t   with   β > 1 . Additionally, the parameter υ is defined as the ratio of the length of the Unit Porous Block (UPB), L U P B (defined in part I), over the radius of the pore-body as follows: υ = L U P B / r p .
Figure 8 shows the correction term, r p c , S 2 s h i f t , as a function of temperature, calculated along the three-phase (H–Lw–V) equilibria line for the methane + water binary system. We observe that the correction term for pores located far from the hydrate-dissociation front (i.e., where the pore pressure is a minimum; namely, where P l = 0 ) is essentially constant and independent of temperature. On the other hand, for pores located on the hydrate-dissociation front the correction term has strong temperature dependence. In particular, the correction term changes almost four orders of magnitude between 273 K and 295 K. Such behavior is a direct result of the term Ω c , S 2 , which is shown in Figure 9, plotted as a function of temperature. Therefore, a similar approximation to Equation (14) cannot be used for the case of system S2 and the complete Equation (12) needs to be used for the correction term, r p c , S 2 s h i f t .
Figure 10a shows for comparison purposes the calculated r p c , S 2 as a function of temperature (along the three-phase, H–Lw–V, equilibrium line) without accounting the confinement effect (part I). On the other hand, Figure 10b shows the contribution of the correction term (i.e., r p c , S 2 s h i f t ) that is calculated from Equation (12), that originates from confinement. The figure shows the ratio, [ Φ c , S 2 ( r p c , S 2 s h i f t / r p c , S 2 t o t a l ) ] as a function of temperature (and the corresponding hydrate equilibrium pressure), for the case of a spherical, cylindrical or cubic pore-body, without any liquid film remaining at the pore-body walls (i.e., ω p = 1 ).
We observe that, even though the correction term, r p c , S 2 s h i f t , increases by more than three orders of magnitude between 273 K and 305 K, the term r p c , S 2 , increases also by approximately the same orders of magnitude. Therefore, the ratio Φ c , S 2 , remains essentially constant in the temperature ranges 273 K–293 K, while increases slightly for temperatures higher than 293 K. Notice, however, that in all cases the correction term, r p c , S 2 s h i f t , is less than 0.5% of the total value of r p c , S 2 t o t a l . It is also observed that pores that are located at the hydrate dissociation front exhibit the same shift with those pores that are located at points of minimum pressure. Furthermore, it should be pointed out that there is an asymptotic behavior for the case of pores located at the front (see Figure 10a), and it’s effect is clearly shown in Figure 10b, where we observe that the resulting curves are plotted only up to 291 K (spherical pore-body), 293 K (cylindrical pore-body), and 295 K (cubic pore-body), respectively, for the three pore-body geometries that are considered in the current study. For the three particular cases the magnitudes of the shift are having values in the following order: cubic > cylindrical > spherical.

5. Conclusions

In this study we examined the dissociation of sI methane hydrate, occurring inside simple model porous media with small pore sizes. We performed analytical calculations for the critical pore sizes that are required in order for the gas phase to reach the critical gas saturation, and therefore that can be produced. The current study is an extension of our previous work (Tsimpanogiannis [60]), where hydrate dissociation in larger pores was considered. Namely, in our previous work we have ignored the depression of the temperature of methane hydrate dissociation, which is a result of confinement within the porous medium. Note that the particular effect becomes stronger as the pore size decreases. In the current calculations, on the other hand, we considered the effect of the depression of the temperature of hydrate dissociation, and moved forward to quantify its effect on the calculated critical pore sizes.
Two different types of fundamental porous media have been considered. The first porous system (S1), consisted only of a single pore-body, while the second porous system (S2), consisted of a single pore-body connected with a number of pore-throats. Different geometries have been considered for pore-bodies (spherical, cylindrical, and cubic), while only cubic pore-throats have been considered. It is expected, however, that the use of other pore-throat geometries will not alter significantly the main conclusions.
The following observations can be summarized:
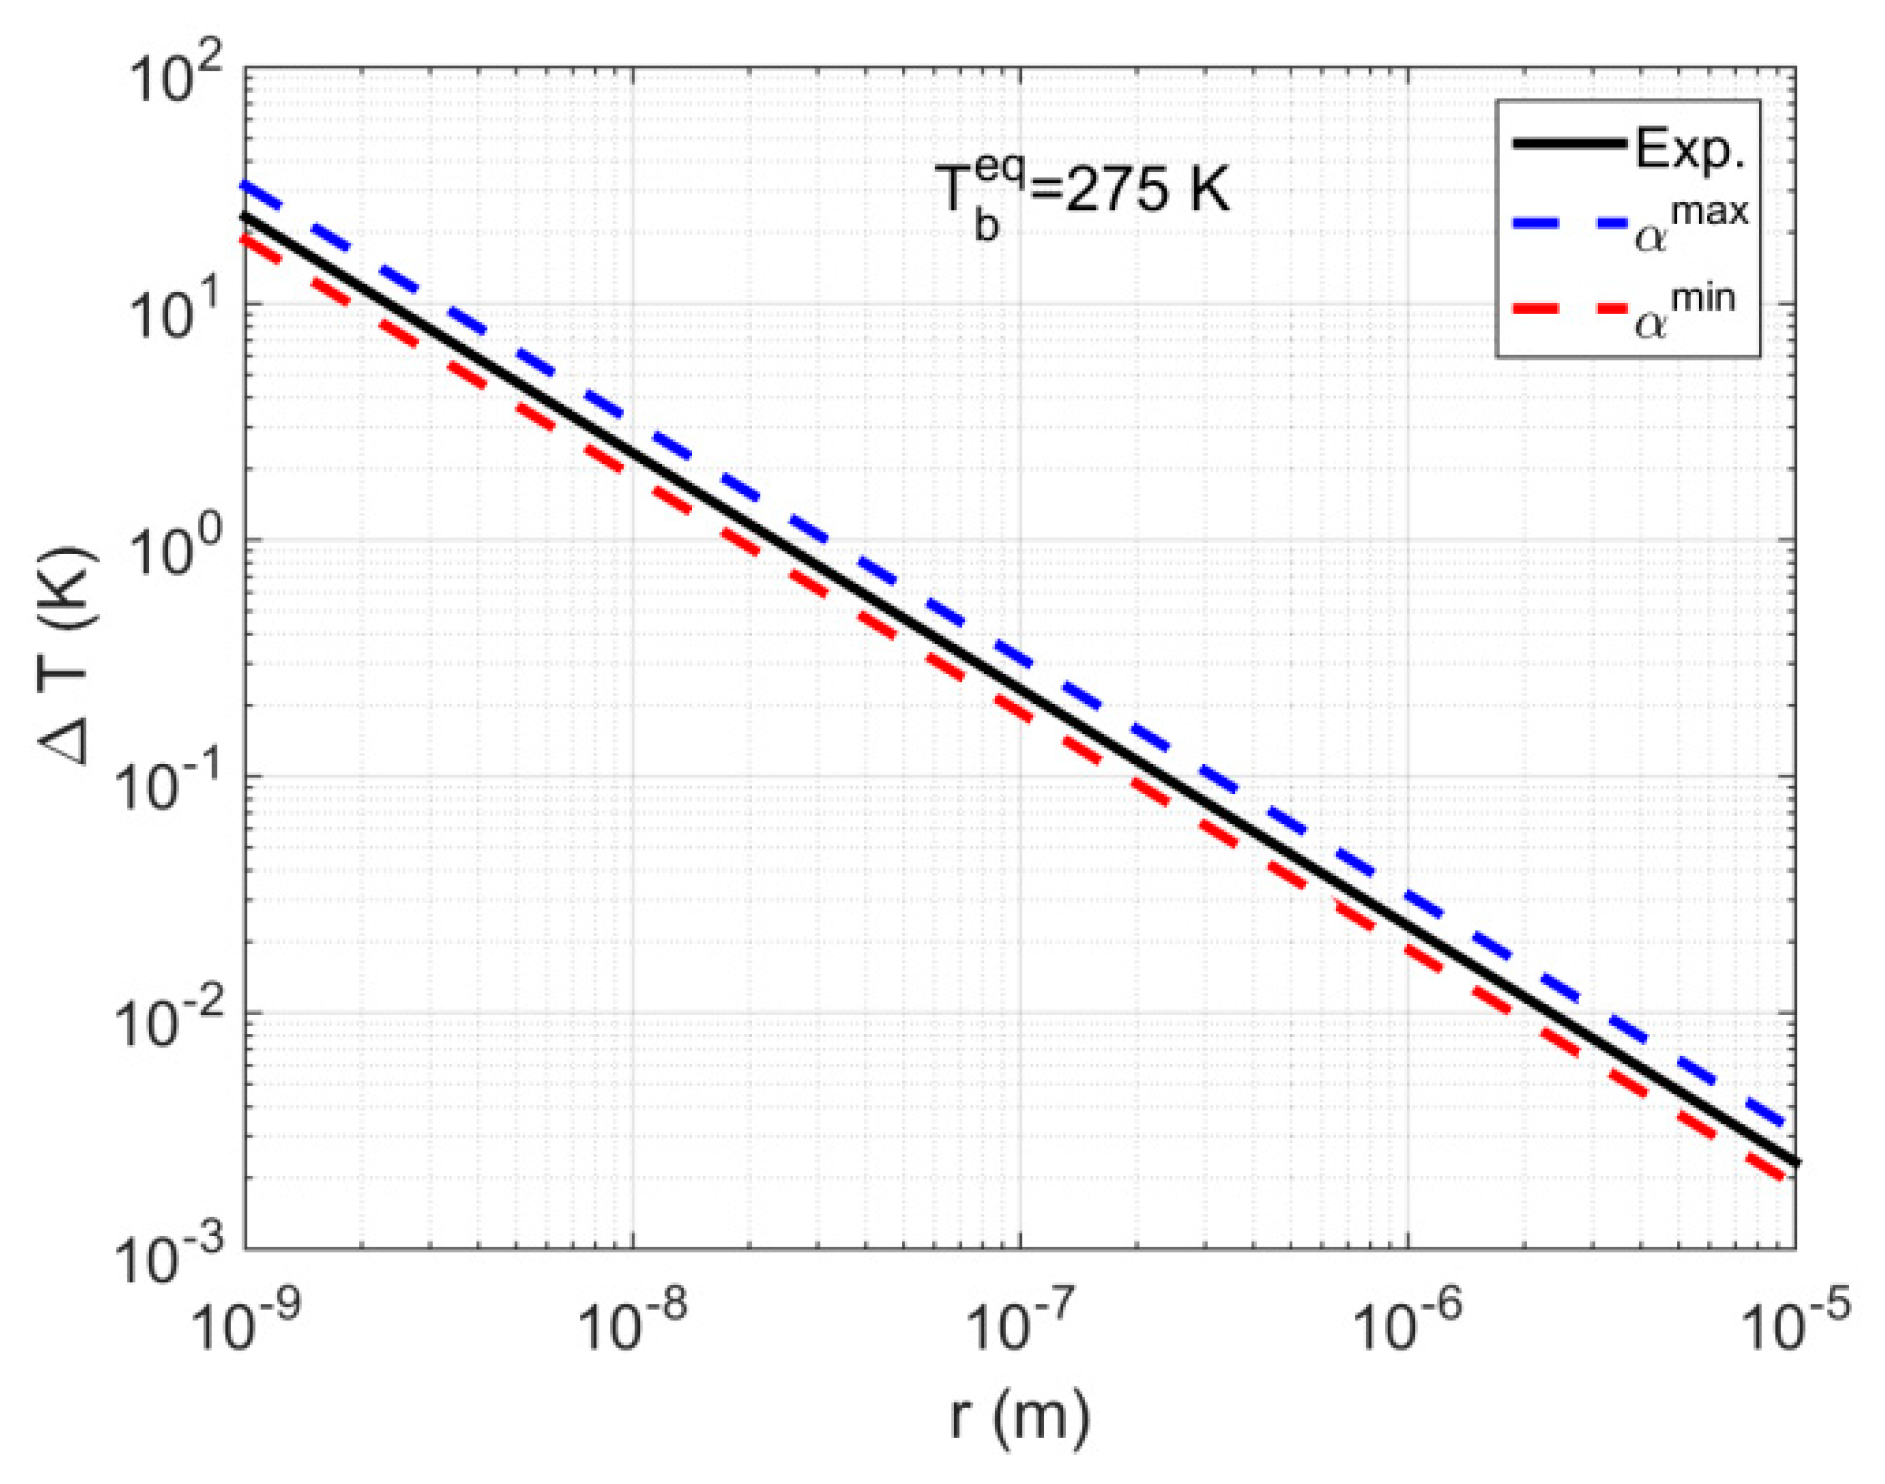
  • As pore sizes decrease, the shift in the three-phase (H–Lw–V) equilibrium temperature becomes more important.
  • In the current study the parameters γ s l , Δ H s and ρ s are considered to be functions of temperature and their dependence is such that the parameter, α γ s l cos ϑ s l ρ s Δ H s , is constant (i.e., α c o n s t ) and thus, independent of temperature. The temperature dependence has been obtained from Monte Carlo simulations ( ρ s ), molecular dynamics simulations ( Δ H s ), and hybrid methods that combine MD/MC simulations with experimental measurements ( γ s l ).
  • For system S1, when accounting for the effect of confinement on the H–Lw–V equilibrium T e q shift, results in a contribution up to 8% of the total value of r p c , S 1 t o t a l . The shift magnitude was found to have values in the following order: cubic > cylindrical > spherical.
  • For system S2, when accounting for the effect of confinement on the H–Lw–V equilibrium T e q shift, results in a contribution up to 1% of the total value of r p c , S 2 t o t a l . The shift magnitude was found to have values in the following order: cubic > cylindrical > spherical.
  • The current analysis indicated that the contribution of the effect of the hydrate equilibrium T e q shift (due to confinement in small pores) on the critical value of the pores, r p c , S i t o t a l , in order to be able to produce the gas phase was less than 10%. The contribution to overcome the capillary thresholds of neighboring pore-throats accounted for the remaining 90%.
  • Based on the previous observations we can conclude that for hydrate deposits within coarse-grained sediments or fractured systems, there is not going to be a significant negative effect, resulting from accounting for the confinement in small pores.
  • Due to the lack of any experimental measurements (to the best of our knowledge) the provided discussion is limited only to the analytical solutions.
  • The current analysis does not take into consideration the possible mobilization of the gas phase due to buoyancy or viscous gradients. While the contribution of buoyancy gradients is expected to be insignificant for such small gas clusters, the contribution of viscous gradients can be important, particularly in the vicinity of production wells. When accounting for such gradients, the gas production from hydrate deposits within formations with smaller pore sizes can become possible, due to gas mobilization.

Supplementary Materials

The following are available online at https://www.mdpi.com/article/10.3390/en15010210/s1, Figure S1: Properties as a function of temperature along the three-phase (H–Lw–V) equilibrium line of sI methane hydrate, Figure S2: Hydrate equilibrium properties at know oceanic deposits. Figure S3: Properties as a function of temperature for sI methane hydrate. Figure S4: The effect of pore radius on the temperature depression during methane hydrate dissociation in porous media at 310 K.

Author Contributions

Conceptualization, I.N.T.; methodology, I.N.T.; software, I.N.T.; validation, I.N.T., E.S. and A.K.S.; formal analysis, I.N.T., E.S. and A.K.S.; writing—original draft preparation, I.N.T.; writing—review and editing, I.N.T., E.S. and A.K.S.; supervision, I.N.T. and A.K.S.; project administration, I.N.T.; funding acquisition, A.K.S. All authors have read and agreed to the published version of the manuscript.

Funding

AS and ES acknowledge partial support by the project “NCSRD—INRASTES research activities in the framework of the national RIS3” (MIS 5002559) which is implemented under the “Action for the Strategic Development on the Research and Technological Sector”, funded by the Operational Programme “Competitiveness, Entrepreneurship and Innovation” (NSRF 2014-2020) and co-financed by Greece and the European Union (European Regional Development Fund).

Conflicts of Interest

The authors declare no conflict of interest.

Nomenclature

b Parameter defined through: b = P l z λ R T (–)
d Pore-body diameter (m)
f Constant with values: 1 (cylindrical pore-body) or 2 (spherical or cubic pore body)
F S 1 ( S g , S 1 ) Geometric function defined through Equation (30) of Tsimpanogiannis [60] (–)
F S 2 ( S g , S 2 ) Geometric function defined through Equation (32) of Tsimpanogiannis [60] (–)
L U P B Length of unit porous block (UPB) (m)
m , n Component-specific constants for hydrate equilibrium: P e q b u l k = exp ( m + n T e q b u l k )
P c Capillary pressure (Pa)
P g Pressure in the gas (g) phase (Pa)
P l Pressure in the liquid (l) phase (Pa)
P e q Hydrate equilibrium pressure (Pa)
R Universal gas constant (J/mol K)
r 1 ,   r 2 Principle radii of curvature (m)
r p Radius of pore-body (m)
r t Radius of pore-throat (m)
r p c , S 1 Critical pore-body radius of pore system S1 (m)
r p c , S 2 Critical pore-body radius of pore system S2 (m)
r p c , S 1 s h i f t Correction term defined through Equation (12) for pore system S1 (m)
r p c , S 2 s h i f t Correction term defined through Equation (12) for pore system S2 (m)
S g , S 1 Gas saturation of pore system S1 (–)
S g , S 2 Gas saturation of pore system S2 (–)
S g c , S 1 Critical gas saturation of pore system S1 (–)
S g c , S 2 Critical gas saturation of pore system S2 (–)
S H Hydrate saturation (–)
T Temperature (K)
T e q Hydrate equilibrium temperature (K)
V H Volume of pore space that is occupied by hydrate (m3)
V P Total volume of pore space (m3)
z Compressibility factor of methane gas (–)
α Parameter defined as: α γ s l cos ϑ s l ρ s Δ H s
β   Constant defined through: β = r p / r t (–)
β   * Constant defined through Equation (10) (–)
γ g l Gas (Methane)/Liquid (Water) interfacial tension (N/m)
γ s l Solid (Hydrate)/Liquid (Water) interfacial tension (N/m)
Δ H s Latent heat of hydrate dissociation/melting (kJ/mol methane)
ζ Coordination number of pore network (–)
ϑ s l Contact angle (o)
θ S , C H 4 Cavity fractional occupancy of the small (S) cavities (–)
θ L , C H 4 Cavity fractional occupancy of the large (L) cavities (–)
κ solid–liquid interface curvature defined through Equation (5)
λ Constant defined through Equation (28) of Tsimpanogiannis [60] (mol/m3)
ρ s Density of hydrate (kg/m3)
υ   Constant defined through: υ = L U P B / r p (–)
Φ c , S i Function defined through Equation (15) (–)
Ω c , S i Function defined through Equation (13) (–)
ω p Constant indicating amount of wetting liquid attached to pore-body wall (–)

References

  1. Sloan, E.D.; Koh, C.A. Clathrate Hydrates of Natural Gases, 3rd ed.; CRC Press: Boca Raton, FL, USA, 2008. [Google Scholar]
  2. Li, X.-S.; Xu, C.-G.; Zhang, Y.; Ruan, X.-K.; Li, G.; Wang, Y. Investigation into gas production from natural gas hydrate: A review. Appl. Energy 2016, 172, 286–322. [Google Scholar] [CrossRef] [Green Version]
  3. Rossi, F.; Gambelli, A.M. Thermodynamic phase equilibrium of single-guest hydrate and formation data of hydrate in presence of chemical additives: A review. Fluid Phase Equilib. 2021, 536, 112958. [Google Scholar] [CrossRef]
  4. Tsimpanogiannis, I.N.; Costandy, J.; Kastanidis, P.; El Meragawi, S.; Michalis, V.K.; Papadimitriou, N.I.; Karozis, S.N.; Diamantonis, N.I.; Moultos, O.A.; Romanos, G.E.; et al. Using clathrate hydrates for gas storage and gas-mixture separations: Experimental and computational studies at multiple length scales. Mol. Phys. 2018, 116, 2041–2060. [Google Scholar] [CrossRef]
  5. Kelland, M.A. History of the Development of Low Dosage Hydrate Inhibitors. Energy Fuels 2006, 20, 825–847. [Google Scholar] [CrossRef]
  6. Kelland, M.A. A review of kinetic hydrate inhibitors from an environmental perspective. Energy Fuels 2019, 32, 12001–12012. [Google Scholar] [CrossRef]
  7. Collett, T.; Bahk, J.J.; Baker, R.; Boswell, R.; Divins, D.; Frye, M.; Goldberg, D.; Husebø, J.; Koh, C.; Malone, M.; et al. Methane Hydrates in Nature-Current Knowledge and Challenges. J. Chem. Eng. Data 2015, 60, 319–329. [Google Scholar] [CrossRef]
  8. Chong, Z.R.; Yang, S.H.B.; Babu, P.; Linga, P.; Li, X.-S. Review of Natural Gas Hydrates as an Energy Resource: Prospects and Challenges. Appl. Energy 2016, 162, 1633–1652. [Google Scholar] [CrossRef]
  9. Kvenvolden, K.A. A Review of the Geochemistry of Methane in Natural Gas Hydrate. Org. Geochem. 1995, 23, 997–1008. [Google Scholar] [CrossRef]
  10. Buffett, B.A.; Archer, D. Global inventory of methane clathrate: Sensitivity to changes in the deep ocean. Earth Planet. Sci. Lett. 2004, 227, 185–199. [Google Scholar] [CrossRef]
  11. Milkov, A.V. Global Estimates of Hydrate-Bound Gas in Marine Sediments: How Much is Really out There? Earth Sci. Rev. 2004, 66, 183–197. [Google Scholar] [CrossRef]
  12. Klauda, J.B.; Sandler, S.I. Predictions of gas hydrate phase equilibria and amounts in natural sediment porous media. Mar. Petrol. Geol. 2003, 20, 459–470. [Google Scholar] [CrossRef]
  13. Boswell, R.; Collett, T.S. Current perspectives on gas hydrate resources. Energy Environ. Sci. 2011, 4, 1206–1215. [Google Scholar]
  14. Wallmann, K.; Pinero, E.; Burwicz, E.; Haeckel, M.; Hensen, C.; Dale, A.; Ruepke, L. The global inventory of methane hydrate in marine sediments: A theoretical approach. Energies 2012, 5, 2449. [Google Scholar] [CrossRef]
  15. Pinero, E.; Marquardt, M.; Hensen, C.; Haeckel, M.; Wallmann, K. Estimation of the global inventory of methane hydrates in marine sediments using transfer functions. Biogeosciences 2013, 10, 959–975. [Google Scholar] [CrossRef] [Green Version]
  16. You, K.; Flemings, P.B.; Malinverno, A.; Collett, T.S.; Darnell, K. Mechanisms of methane hydrate formation in geological systems. Rev. Geophys. 2019, 57, 1146–1196. [Google Scholar] [CrossRef]
  17. Buffett, B.A. Clathrate hydrates. Annu. Rev. Earth Planet. Sci. 2000, 28, 477–507. [Google Scholar] [CrossRef]
  18. Walsh, M.R.; Hancock, S.H.; Wilson, S.; Patil, S.L.; Moridis, G.J.; Boswell, R.; Collett, T.S.; Koh, C.A.; Sloan, E.D. Preliminary report on the commercial viability of gas production from natural gas hydrates. Energy Econ. 2009, 31, 815–823. [Google Scholar] [CrossRef]
  19. Ruppel, C.D.; Kessler, J.D. The interaction of climate change and methane hydrates. Rev. Geophys. 2017, 55, 126–168. [Google Scholar] [CrossRef]
  20. Nisbet, E.G.; Fisher, R.E.; Lowry, D.; France, J.L.; Allen, G.; Bakkaloglu, S.; Broderick, T.J.; Cain, M.; Coleman, M.; Fernandez, J.; et al. Methane mitigation: Methods to reduce emissions, on the path to the Paris agreement. Rev. Geophys. 2020, 58, e2019RG000675. [Google Scholar] [CrossRef]
  21. EPA (USA). Available online: https://www.epa.gov/ghgemissions/understanding-global-warming-potentials (accessed on 8 September 2021).
  22. IPCC. Climate Change 2014: Synthesis Report. Contribution of Working Groups I, II and III to the Fifth Assessment Report of the Intergovernmental Panel on Climate Change (IPCC); IPCC: Geneva, Switzerland, 2014; Available online: https://www.ipcc.ch/assessment-report/ar5/ (accessed on 5 August 2021).
  23. Vanneste, M.; Sultan, N.; Garziglia, S.; Forsberg, C.F.; L’Heureux, J.-S. Seafloor instabilities and sediment deformation processes: The need for integrated multidisciplinary investigations. Mar. Geol. 2014, 352, 183–214. [Google Scholar] [CrossRef] [Green Version]
  24. McConnell, D.R.; Zhang, Z.; Boswell, R. Review of progress in evaluating gas hydrate drilling hazards. Mar. Petrol. Geol. 2012, 34, 209–223. [Google Scholar] [CrossRef]
  25. Handa, Y.P.; Stupin, D. Thermodynamic Properties and Dissociation Characteristics of Methane and Propane Hydrates in 70- A ο -Radius Silica Gel Pores. J. Phys. Chem. 1992, 96, 8599–8603. [Google Scholar] [CrossRef]
  26. Uchida, T.; Ebinuma, T.; Ishizaki, T. Dissociation condition measurements of methane hydrate in confined small pores of porous glass. J. Phys. Chem. B 1999, 103, 3659–3662. [Google Scholar] [CrossRef]
  27. Uchida, T.; Ebinuma, T.; Takeya, S.; Nagao, J.; Narita, H. Effects of pore sizes on dissociation temperatures and pressures of methane, carbon dioxide, and propane hydrates in porous media. J. Phys. Chem. B 2002, 106, 820–826. [Google Scholar] [CrossRef]
  28. Wilder, J.W.; Sheshardi, K.; Smith, D.H. Resolving apparent contradictions in equilibrium measurements for clathrate hydrates in porous media. J. Phys. Chem. B 2001, 105, 9970–9972. [Google Scholar] [CrossRef]
  29. Sheshardi, K.; Wilder, J.W.; Smith, D.H. Measurements of Equilibrium Pressures and Temperatures for Propane Hydrate in Silica Gels with Different Pore-Size Distributions. J. Phys. Chem. B 2001, 105, 2627–2631. [Google Scholar]
  30. Smith, D.H.; Wilder, J.W.; Sheshardi, K. Methane hydrate equilibria in silica gels with broad pore-size distribution. AICHE J. 2002, 48, 393–400. [Google Scholar] [CrossRef]
  31. Anderson, R.; Llamendo, M.; Tohidi, B.; Burgass, R.W. Experimental measurement of methane and carbon dioxide clathrate hydrate equilibria in mesoporous silica. J. Phys. Chem. B 2003, 107, 3507–3514. [Google Scholar] [CrossRef]
  32. Kang, S.-P.; Lee, J.-W.; Ryu, H.-J. Phase behavior of methane and carbon dioxide hydrates in meso- and macro-sized porous media. Fluid Phase Equilib. 2008, 274, 68–72. [Google Scholar] [CrossRef]
  33. Kang, S.-P.; Lee, J.-W. Formation characteristics of synthesized natural gas hydrates in meso- and macroporous silica gels. J. Phys. Chem. B 2010, 114, 6973–6978. [Google Scholar] [CrossRef] [PubMed]
  34. Aladko, E.Y.; Dyadin, Y.A.; Fenelonov, V.B.; Larionov, E.G.; Manakov, A.Y.; Mel’gunov, M.S.; Zhurko, F.V. Formation and decomposition of ethane, propane, and carbon dioxide hydrates in silica gel mesopores under high pressure. J. Phys. Chem. B 2006, 110, 19717–19725. [Google Scholar] [CrossRef]
  35. Seo, Y.; Lee, S.; Cha, I.; Lee, J.D.; Lee, H. Phase equilibria and thermodynamic modeling of ethane and propane hydrates in porous silica gels. J. Phys. Chem. B 2009, 113, 5487–5492. [Google Scholar] [CrossRef]
  36. Lee, S.; Seo, Y. Experimental measurement and thermodynamic modeling of the mixed CH4 + C3H8 clathrate hydrate equilibria in silica gel pores: Effects of pore size and salinity. Langmuir 2010, 26, 9742–9748. [Google Scholar] [CrossRef] [PubMed]
  37. Zarifi, M.; Javanmardi, J.; Hashemi, H.; Eslamimanesh, A.; Mohammadi, A.H. Experimental study and thermodynamic modelling of methane and mixed C1 + C2 + C3 clathrate hydrates in the presence of mesoporous silica gel. Fluid Phase Equilib. 2016, 423, 17–24. [Google Scholar] [CrossRef]
  38. Zhang, Y.; Li, X.-S.; Wang, Y.; Chen, Z.-Y.; Yan, K.-F. Decomposition conditions of methane hydrate in marine sediments from South China Sea. Fluid Phase Equilib. 2016, 413, 110–115. [Google Scholar] [CrossRef]
  39. Liu, H.; Zhan, S.; Guo, P.; Fan, S.; Zhang, S. Understanding the characteristic of methane hydrate equilibrium in materials and its potential application. Chem. Eng. J. 2018, 349, 775–781. [Google Scholar] [CrossRef]
  40. Tsimpanogiannis, I.N. A novel hybrid method for the calculation of methane hydrate—Water interfacial tension along the three-phase (hydrate–liquid water–vapor) equilibrium line. J. Chem. Phys. 2021, 155, 024702. [Google Scholar] [CrossRef] [PubMed]
  41. Gambelli, A.M. Analyses of CH4 and CO2 hydrate formation to define the optimal pressure for CO2 injection to maximize the replacement efficiency into natural gas hydrate in presence of a silica-based natural porous medium, via depressurization techniques. Chem. Eng. Process—Process Intens. 2021, 167, 108512. [Google Scholar] [CrossRef]
  42. Clennell, M.B.; Hovland, M.; Booth, J.S.; Henry, P.; Winters, W.J. Formation of natural gas hydrates in marine sediments: 1. Conceptual model of gas hydrate growth conditioned by host sediments. J. Geophys. Res. B 1999, 104, 22985–23003. [Google Scholar] [CrossRef]
  43. Clennell, M.B.; Henry, P.; Hovland, M.; Booth, J.S.; Winters, W.J.; Thomas, M. Formation of natural gas hydrates in marine sediments. Ann. N. Y. Acad. Sci. 2000, 912, 887–896. [Google Scholar] [CrossRef]
  44. Henry, P.; Thomas, M.; Clennell, M.B. Formation of natural gas hydrates in marine sediments 2. Thermodynamic calculations of stability conditions in porous sediments. J. Geophys. Res. B 1999, 104, 23005–23022. [Google Scholar] [CrossRef] [Green Version]
  45. Anderson, R.; Llamendo, M.; Tohidi, B.; Burgass, R.W. Characteristics of clathrate hydrate equilibria in mesopores and interpretation of experimental data. J. Phys. Chem. B 2003, 107, 3500–3506. [Google Scholar] [CrossRef]
  46. van der Waals, J.H.; Platteeuw, J.C. Clathrate Solutions. Adv. Chem. Phys. 1959, 2, 1–57. [Google Scholar]
  47. Parrish, W.R.; Prausnitz, J.M. Dissociation pressures of gas hydrates formed by gas mixtures. Ind. Eng. Chem. Proc. Des. Dev. 1972, 11, 26–35. [Google Scholar] [CrossRef]
  48. Holder, G.D.; Corbin, G.; Papadopoulos, K.D. Thermodynamic and molecular properties of gas hydrates from mixtures containing methane, argon, and krypton. Ind. Eng. Chem. Fund. 1980, 19, 282–286. [Google Scholar] [CrossRef]
  49. Holder, G.D.; Zetts, S.P.; Pradhan, N. Phase behavior in systems containing clathrate hydrates. Rev. Chem. Eng. 1988, 5, 1–70. [Google Scholar] [CrossRef]
  50. Clarke, M.A.; Pooladi-Darvish, M.; Bishnoi, P.R. A method to predict equilibrium conditions of gas formation in porous media. Ind. Eng. Chem. Res. 1999, 38, 2485–2490. [Google Scholar] [CrossRef]
  51. Klauda, J.B.; Sandler, S.I. Modeling gas hydrate equilibria in laboratory and natural porous media. Ind. Eng. Chem. Res. 2001, 40, 4197–4208. [Google Scholar] [CrossRef]
  52. Peddireddy, S.; Lee, S.-Y.; Lee, J.W. Variable contact angle model for gas hydrate equilibrium in porous media. AIChE J. 2006, 52, 1228–1234. [Google Scholar] [CrossRef]
  53. Sun, R.; Duan, Z. An accurate model to predict the thermodynamic stability of methane hydrate and methane solubility in marine environments. Chem. Geol. 2007, 244, 248–262. [Google Scholar] [CrossRef]
  54. Song, Y.; Yang, M.; Chen, Y.; Li, Q. An improved model for predicting hydrate phase equilibrium in marine sediment environment. J. Natural Gas Chem. 2010, 19, 241–245. [Google Scholar] [CrossRef]
  55. Duan, Z.; Li, D.; Chen, Y.; Sun, R. The influence of temperature, pressure, salinity and capillary force on the formation of methane hydrate. Geosci. Front. 2011, 2, 125–135. [Google Scholar] [CrossRef] [Green Version]
  56. Li, S.-L.; Ma, Q.-L.; Sun, C.-Y.; Chen, L.-T.; Liu, B.; Feng, X.-J.; Wang, X.-Q.; Chen, G.-J. A fractal approach on modeling gas hydrate phase equilibria in porous media. Fluid Phase Equilib. 2013, 356, 277–283. [Google Scholar] [CrossRef]
  57. Zhou, J.; Liang, W.; Wei, C. Phase Equilibrium Condition for Pore Hydrate: Theoretical Formulation and Experimental Validation. J. Geophys. Res. Solid Earth 2019, 124, 12703–12721. [Google Scholar] [CrossRef]
  58. Azimi, A.; Javanmardi, J.; Mohammadi, A.H. Development of thermodynamic frameworks for modeling of clathrate hydrates stability conditions in porous media. J. Mol. Liquids 2021, 329, 115463. [Google Scholar] [CrossRef]
  59. De La Fuente, M.; Vaunat, J.; Marin-Moreno, H. Modelling Methane Hydrate Saturation in Pores: Capillary Inhibition Effects. Energies 2021, 14, 5627. [Google Scholar] [CrossRef]
  60. Tsimpanogiannis, I.N. Study of the critical gas saturation during methane hydrate dissociation at the single-pore scale: Analytical solutions for large pores. J. Natural Gas Sci. Eng. 2020, 83, 103577. [Google Scholar] [CrossRef]
  61. Davie, M.K.; Buffett, B.A. Sources of methane for marine gas hydrate: Inferences from a comparison of observations and numerical models. Earth Planet. Sci. Lett. 2003, 206, 51–63. [Google Scholar] [CrossRef]
  62. Xie, Y.; Li, R.; Wang, X.-H.; Zheng, T.; Cui, J.-L.; Yuan, Q.; Qin, H.-B.; Sun, C.-Y.; Chen, G.-J. Review on the accumulation behavior of natural gas hydrates in porous sediments. J. Natural Gas Sci. Eng. 2020, 83, 103520. [Google Scholar] [CrossRef]
  63. Minshull, T.A.; Marin-Moreno, H.; Betlem, P.; Bialas, J.; Bunz, S.; Burwitz, E.; Cameselle, A.L.; Çifçi, G.; Giustiniani, M.; Hillman, J.; et al. Hydrate occurrence in Europe: A review of available evidence. Mar. Petrol. Geol. 2020, 111, 735–764. [Google Scholar] [CrossRef]
  64. Waite, W.F.; Santamarina, J.C.; Cortes, D.D.; Dugan, B.; Espinoza, D.N.; Germaine, J.; Jang, J.; Jung, J.W.; Kneafsey, T.J.; Shin, H.; et al. Physical properties of hydrate-bearing sediments. Rev. Geophys. 2009, 47, RG4003. [Google Scholar] [CrossRef]
  65. Tohidi, B.; Anderson, R.; Clennell, M.B.; Burgass, R.W.; Biderkab, A.B. Visual Observation of Gas-Hydrate Formation and Dissociation in Synthetic Porous Media by Means of Glass Micromodels. Geology 2001, 29, 867–870. [Google Scholar] [CrossRef]
  66. Makogan, Y.F.; Holditch, S.A.; Makogan, T.Y. Russian field illustrates gas–hydrate production. Oil Gas J. 2005, 103, 43–47. [Google Scholar]
  67. Tsimpanogiannis, I.N.; Lichtner, P.C. Parametric study of methane hydrate dissociation in oceanic sediments driven by thermal stimulation. J. Petr. Sci. Eng. 2007, 56, 165–175. [Google Scholar] [CrossRef]
  68. Papadimitriou, N.I.; Tsimpanogiannis, I.N.; Stubos, A.K. Monte Carlo simulations of methane hydrate. In Proceedings of the 7th International Conference on Gas Hydrates, Edinburgh, UK, 17–21 July 2011. [Google Scholar]
  69. Papadimitriou, N.I.; Tsimpanogiannis, I.N.; Economou, I.G.; Stubos, A.K. Storage of Methane in Clathrate Hydrates: Monte Carlo Simulations of sI Hydrates and Comparison with Experimental Measurements. J. Chem. Eng. Data 2016, 61, 2886–2896. [Google Scholar] [CrossRef]
  70. Papadimitriou, N.I.; Tsimpanogiannis, I.N.; Economou, I.G.; Stubos, A.K. Identifications of conditions for increase methane storage capacity in sII and sH clathrate hydrates from Monte Carlo simulations. J. Chem. Thermodyn. 2018, 117, 128–137. [Google Scholar] [CrossRef]
  71. Lasich, M.; Mohammadi, A.H.; Bolton, K.; Vrabec, J.; Ramjugernath, D. Phase equilibria of methane clathrate hydrates from Grand Canonical Monte Carlo simulations. Fluid Phase Equilib. 2014, 369, 47–54. [Google Scholar] [CrossRef]
  72. Brumby, P.E.; Yuhara, D.; Wu, D.T.; Sum, A.K.; Yasuoka, K. Cage occupancy of methane hydrates from Gibbs ensemble Monte Carlo simulations. Fluid Phase Equilib. 2016, 413, 242–248. [Google Scholar] [CrossRef]
  73. Papadimitriou, N.I.; Tsimpanogiannis, I.N.; Economou, I.G.; Stubos, A.K. Influence of combining rules on the cavity occupancy of clathrate hydrates by Monte Carlo simulations. Mol. Phys. 2014, 112, 2258–2274. [Google Scholar] [CrossRef]
  74. Papadimitriou, N.I.; Tsimpanogiannis, I.N.; Stubos, A.K.; Martin, A.; Rovetto, L.J.; Florusse, L.J.; Peters, C.J. experimental and computational investigation of the sII binary He-THF hydrate. J. Phys. Chem. B 2011, 115, 1411–1415. [Google Scholar] [CrossRef]
  75. Tsimpanogiannis, I.N.; Economou, I.G. Monte Carlo simulation studies of clathrate hydrates: A review. J. Supercrit. Fluids 2018, 134, 51–61. [Google Scholar] [CrossRef]
  76. Duan, Z.; Moller, N.; Weare, J.H. An equation of state for the CH4-CO2-H2O system: I. Pure systems from 0 to 1000 °C and 0 to 8000 bar. Geochim. Cosm. Acta 1992, 56, 2605–2617. [Google Scholar] [CrossRef]
  77. Tsimpanogiannis, I.N.; Yortsos, Y.C.; Poulou, S.; Kanellopoulos, N.; Stubos, A.K. Scaling Theory of Drying in Porous Media. Phys. Rev. E. 1999, 59, 4353–4365. [Google Scholar] [CrossRef]
  78. Yiotis, A.G.; Boudouvis, A.G.; Stubos, A.K.; Tsimpanogiannis, I.N.; Yortsos, Y.C. Effect of Liquid Films on the Isothermal Drying of Porous Media. Phys. Rev. E. 2003, 68, 037303. [Google Scholar] [CrossRef] [PubMed] [Green Version]
  79. Yiotis, A.G.; Tsimpanogiannis, I.N.; Stubos, A.K. Fractal Characteristics and Scaling of the Drying Front in Porous Media: A Pore Network Study. Dry. Technol. 2010, 28, 981–990. [Google Scholar] [CrossRef]
  80. Liu, X.; Flemings, P.B. Capillary effects on hydrate stability in marine sediments. J. Geophys. Res. 2011, 116, B07102. [Google Scholar] [CrossRef]
  81. Moridis, G.M. Numerical Studies of Gas Production from Methane Hydrates. SPE J. 2003, 8, 359–370. [Google Scholar] [CrossRef]
  82. Dufal, S.; Galindo, A.; Jackson, G.; Haslam, A.J. Modelling the effect of methanol, glycol inhibitors and electrolytes on the equilibrium stability of hydrates with the SAFT-VR approach. Mol. Phys. 2012, 110, 1223–1240. [Google Scholar] [CrossRef]
  83. El Meragawi, S.; Diamantonis, N.I.; Tsimpanogiannis, I.N.; Economou, I.G. Hydrate – Fluid Phase Equilibria Modeling using PC-SAFT and Peng-Robinson Equations of State. Fluid Phase Equilib. 2016, 413, 209–219. [Google Scholar] [CrossRef]
  84. Tsimpanogiannis, I.N.; Lichtner, P.C. Pore-Network Study of Methane Hydrate Dissociation. Phys. Rev. E 2006, 74, 056303. [Google Scholar] [CrossRef] [Green Version]
  85. Tsimpanogiannis, I.N.; Lichtner, P.C. Gas Saturation Resulting from Methane Hydrate Dissociation in a Porous Medium: Comparison between Analytical and Pore-Network Results. J. Phys. Chem. C 2013, 113, 11104–11116. [Google Scholar] [CrossRef]
  86. Du, C.; Yortsos, Y.C. A numerical study of the critical gas saturation in a porous medium. Transp. Porous Media 1999, 35, 205–225. [Google Scholar] [CrossRef]
  87. Tsimpanogiannis, I.N.; Yortsos, Y.C. The Critical Gas Saturation in a Porous Medium in the Presence of Gravity. J. Colloid Interface Sci. 2004, 270, 388–395. [Google Scholar] [CrossRef] [PubMed]
  88. Liang, Y.; Tsuji, S.; Jia, J.; Tsuji, T.; Matsuoka, T. Modeling CO2–Water–Mineral Wettability and Mineralization for Carbon Geosequestration. Acc. Chem. Res. 2017, 50, 1530–1540. [Google Scholar] [CrossRef]
  89. Tsimpanogiannis, I.N.; Michalis, V.K.; Economou, I.G. Enthalpy of dissociation of methane hydrates at a wide pressure and temperature range. Fluid Phase Equilib. 2019, 489, 30–40. [Google Scholar] [CrossRef]
  90. Papadimitriou, N.I.; Tsimpanogiannis, I.N.; Economou, I.G.; Stubos, A.K. Monte Carlo simulations of the separation of the binary gas mixture (CH4 + CO2) using hydrates. Phys. Chem. Chem. Phys. 2018, 20, 28026–28038. [Google Scholar] [CrossRef] [PubMed]
  91. Sahoo, S.K.; Marín-Moreno, H.; North, L.J.; Falcon-Suarez, I.; Madhusudhan, B.N.; Best, A.I.; Minshull, T.A. Presence and consequences of coexisting methane gas with hydrate under two phase water-hydrate stability conditions. J. Geophys. Res. Solid Earth 2018, 123, 3377–3390. [Google Scholar] [CrossRef]
Figure 1. Schematic of a 2D porous medium domain that is shown as an effective porous medium. The turquoise color depicts the combination of the solid matrix and the liquid-occupied pore space. Gas-occupied and hydrate-occupied pore spaces are denoted with blue and red colors, respectively. The characteristic pressure zones are also indicated. The magenta line indicates pressure conditions, where P l = P e q .
Energies 15 00210 g001
Figure 2. Effect of temperature on: (a) the gas/methane–liquid/water interfacial tension, γ g l ; (b) the methane compressibility factor, z. The corresponding pressures are those along the three-phase (H–Lw–V) equilibria for the methane + water binary system.
Energies 15 00210 g002
Figure 3. The effect of pore radius on the temperature depression (absolute) during methane hydrate dissociation in porous media. Results are shown for a temperature equal to 275 K. The solid line corresponds to the case of using variable parameters ρ s , Δ H s , and γ s l , while the dashed lines correspond to the estimated minimum and maximum values for α , based on the fixed values for the parameters in Table 1.
Energies 15 00210 g003
Figure 4. The correction term, r p c , S 1 s h i f t , as a function of temperature for a porous system S1. The corresponding pressures are those along the three-phase (H–Lw–V) equilibria line for the methane + water binary system.
Energies 15 00210 g004
Figure 5. Plotting the term ( Ω c , S 1 1 ) as a function of temperature along the three-phase (H–Lw–V) equilibrium line of sI methane hydrate for a porous system S1.
Energies 15 00210 g005
Figure 6. System of a single pore-body (i.e., system S1). (a) Effect of pore-body geometry (spherical—blue; cylindrical—green; cubic—red) on the critical pore-body radius, r p c , S 1 , plotted as a function of temperature along the three-phase (H–Lw–V) equilibrium line for the methane + water system (modified from Tsimpanogiannis [60]). (b) Effect of pore-body geometry for system S1 on the value of ( 100 * Φ c , S 1 ) , plotted as a function of temperature along the same three-phase equilibrium line. Solid lines correspond to pores located at the hydrate-dissociation front ( P l = P e q b u l k ) , while the dashed lines correspond to pores at minimum pore pressure ( P l = 0 ) for well production via a pressure depletion scheme.
Energies 15 00210 g006
Figure 7. System of a single spherical pore-body (i.e., system S1). (a) Effect of the remaining liquid film thickness inside a spherical pore on the critical pore-body radius, r p c , S 1 , plotted as a function of temperature along the three-phase (H–Lw–V) equilibrium line for the methane + water system (modified from Tsimpanogiannis [60]). (b) Effect of the remaining liquid film thickness inside a spherical pore on the value of ( 100 * Φ c , S 1 ) , plotted as a function of temperature along the same three-phase equilibrium line. When ω p = 1 , there was no liquid film on the pore-body wall. Solid lines correspond to pores located at the hydrate-dissociation front ( P l = P e q b u l k ) , while the dashed lines correspond to pores at minimum pore pressure ( P l = 0 ) for well production via a pressure depletion scheme.
Energies 15 00210 g007
Figure 8. The correction term, r p c , S 1 s h i f t , as a function of temperature for porous system S1. The corresponding pressures are those along the three-phase (H–Lw–V) equilibria line for the methane + water binary system.
Energies 15 00210 g008
Figure 9. Plotting the term ( Ω c , S 1 1 ) as a function of temperature along the three-phase (H–Lw–V) equilibrium line of sI methane hydrate for porous system S1.
Energies 15 00210 g009
Figure 10. System of a single pore-body connected with 4 cubic pore-throats (i.e., system S2); (a) effect of pore-body geometry (spherical—blue; cylindrical—green; cubic—red) on the critical pore-body radius, r p c , S 2 , plotted as a function of temperature along the three-phase (H–Lw–V) equilibrium line for the methane + water system (modified from Tsimpanogiannis [60]). (b) Effect of different pore-body geometries for system S2 on the value of ( 100 * Φ c , S 2 ) , plotted as a function of temperature along the same three-phase equilibrium line. Solid lines correspond to pores located at the hydrate-dissociation front ( P l = P e q b u l k ) , while the dashed lines correspond to pores at minimum pore pressure ( P l = 0 ) for well production via a pressure depletion scheme.
Energies 15 00210 g010
Table 1. Comparison of calculated values for γ s l (methane hydrate–liquid water), using experimental measurements reported by different studies (adopted from Tsimpanogiannis [40]).
Study γ s l   ( mN / m ) ρ s   ( kg / m 3 ) Δ H s   ( kJ / ( mol   CH 4 ) )
Uchida et al. [27]17 ± 391454.2
Uchida et al. [27] (a)34 ± 691454.2
Uchida et al. [26]3991445.92
Uchida et al. [26] (b)7891445.92
Uchida et al. [26] (c)32.7291445.92
Anderson et al. [45]32 ± 1 to 35 ± 1907–91453.2–57.7
Anderson et al. [45] (d)32 ± 3
Zarifi et al. [37]31 ± 391457.8
Liu et al. [39]32 ± 291454.2
(a) Corrected by Anderson et al. [45], accounting for the curvature of dissociation. (b) Corrected by Tsimpanogiannis [40], accounting for the curvature of dissociation. (c) Corrected by Tsimpanogiannis [40], accounting for (i) the curvature of dissociation and (ii) using a refitted value of the slope β * ( β * = 0.1948   ( nm ) ) of the line that goes through the origin of the axes. (d) Average value.
Publisher’s Note: MDPI stays neutral with regard to jurisdictional claims in published maps and institutional affiliations.

