Article

Capture of Pollutants from Exhaust Gases by Low-Temperature Heating Surfaces †

1
School of Energy and Power, Jiangsu University of Science and Technology, No.2 Mengxi Road, Zhenjiang 212000, China
2
Machinebuilding Institute, Admiral Makarov National University of Shipbuilding, Heroes of Ukraine Avenue 9, 54025 Mykolayiv, Ukraine
3
Department of Building Physics and Renewable Energy, Kielce University of Technology, Aleja Tysiąclecia Państwa Polskiego, 7, 25-314 Kielce, Poland
*
Authors to whom correspondence should be addressed.
This paper is an extended version of our paper published in 2021 MPSU-2021, E3S Web of Conferences 323, 00018, Cracow, Poland, 19–21 May 2021.
Energies 2022, 15(1), 120; https://doi.org/10.3390/en15010120
Submission received: 6 December 2021 / Revised: 17 December 2021 / Accepted: 20 December 2021 / Published: 24 December 2021
(This article belongs to the Special Issue Computational Thermal, Energy, and Environmental Engineering)

Abstract

:
One of the most effective methods towards improving the environmental safety of combustion engines is the application of specially prepared water-fuel emulsions (WFE). The application of WFE makes it possible to reduce primary sulfur fuel consumption and reveals the possibility of capturing the pollutants from exhaust gases by applying condensing low-temperature heating surfaces (LTHS). In order to realize such a double effect, it is necessary to investigate the pollution processes on condensing LTHS of exhaust gas boilers (EGB), especially the process of low-temperature condensing a sulfuric acid vapor from exhaust gases to investigate the influence of condensing LTHS on the intensity of pollutants captured from the exhaust gases. The aim of this research is to assess the influence of the intensity of pollutants captured from exhaust gases by condensing LTHS in dependence of water content in WFE combustion. Investigations were carried out at a special experimental setup. The processing of the results of the experimental studies was carried out using the computer universal statistical graphic system Statgraphics. Results have shown that in the presence of a condensing heating surface, the degree of capture (purification) of pollutants from the exhaust gas flow is up to 0.5–0.6.

1. Introduction

The general trend in combustion engines is the reduction of harmful emissions into the atmosphere. This can be achieved by enhancing the fuel efficiency of combustion engines, i.e., decreasing fuel consumption and harmful emissions accordingly, and by the capture of pollutants from exhaust gases. The application of specially prepared water-fuel emulsions (WFE) makes it possible to reduce primary sulfur fuel consumption and reveals the possibility of capturing the pollutants from exhaust gases by applying condensing low-temperature heating surfaces (LTHS). In order to realize such a double effect, it is necessary to investigate the pollution processes on condensing LTHS of exhaust gas boilers (EGB), especially the processes of low-temperature condensing a sulfuric acid vapor from exhaust gases in an aspect of the influence of the intensity of pollutants captured from exhaust gases by condensing LTHS. Furthermore, the pollutants captured from exhaust gases enable deeper exhaust gas heat utilization that results in enhancing the heat capacity of EGB and economic efficiency of whole marine power plants based on internal combustion engines (ICE).
Such deep waste heat recovery techniques are quite appropriate for combined cooling (air conditioning as a widespread version [1,2]), trigeneration or integrated energy systems [3,4], as well as for transport applications [5,6]: railway [7,8] and marine [9,10]. They are promising to be implemented into other technologies to decrease harmful particles in exhaust gases from marine ICE to compensate for a reduction in efficiency of engines [11] when applying refrigeration and jet technologies [12]. This, accordingly, leads to a decrease in emissions of harmful particles into the atmosphere.
Physicomechanical and physicochemical methods and equipment are widely used for cleaning pollutants and harmful impurities contained in exhaust gases [13,14,15].
The most well-known and widely used technologies for reducing the concentration of pollutants in the exhaust gases of power plants include technologies from Alfa Laval (Aalborg Industries, Aalborg, Denmark) [16], technologies offered by Wärtsilä, and CSNOx technology from Ecospec [17].
The hybrid exhaust system was created as a result of the joint development of Alfa Laval and Aalborg Industries [16] with the participation of the MAN diesel engines manufacturer. The exhaust system was based on Alfa Laval separators and existing Aalborg gas cleaning systems which were used in inert tanker systems and was adapted for the cleaning of diesel exhaust gases. This installation is hybrid because it uses both sea and freshwater mixed with caustic soda. When the installation was operated in seawater, it was possible to remove 98% of sulfur substances. When the installation was operated in freshwater, more than 99% of these substances were removed. In addition, up to 80% of solid particles—particulate matter (PM) were captured.
In the hybrid Alfa Laval and Aalborg Industries cleaning system, the first cleaning stage is considered an exhaust gas boiler (EGB) in which exhaust gases are cooled from 350 °C to 160–180 °C. There is a pollution of EGB surfaces that can be considered a cleaning stage from the PM. At the second cleaning stage, through the use of a Venturi scrubber, water injection continues to reduce the exhaust gas temperature and remove PM due to added moisture.
In [17], the CSNOx exhaust gas cleaning system developed by Ecospec Global Technology is considered. This system, unlike the previously considered technologies, allows more intensive and simultaneous reduction of three toxic substances—SOx, CO2, and NOx. The use of the CSNOx scheme for exhaust gas cleaning after 6S50MC showed that the toxic substance contents at the outlet of the internal combustion engine (ICE) of 846.05 ppm of SO2, 709.26 ppm of NOx, and 3.99% of CO2, were at scrubber exit, 10.75 ppm of SO2, 243.11 ppm of NOx and 0.93% of CO2. The emission of the main harmful substances decreased in the following ratios: SO2—98.7%, NOx—65.7%, and CO2—76.7% [17].
In CSNOx technology, only the possibility of increasing water absorption capacity as an absorbent is considered. The possibility of increasing exhaust gases’ absorption capacity as an absorbent is not considered at all. The question of the gas path reliability of the ship’s power plant elements and the possibility of deepening the exhaust gases heat utilization of ICE by reducing their temperature below the dew point temperature sulfuric acid (130 °C) and water vapor (below 48 °C), as well as the capture of PM, are not considered at all.
According to MAN experts [15], the requirements of IMO (the third level of PM, SOx, and NOx emissions) can be fulfilled by the following technologies: water-fuel emulsion (WFE) [18], scavenge air moistening, exhaust gas recirculation [19], and selective catalytic reduction (SCR) [20].
According to the data in [21,22], with an increase in the water content in the WFE, a decrease in the PM concentration in the exhaust gas flow is observed. A particularly sharp decrease of PM is observed with an increase of the water content in WFE when the Wr is increased 10%. According to [23,24], an increase of water content in WFE leads to a decrease in opacity, as an indicator of the PM content in the exhaust gas flow. Practically the same dependencies are presented in [25,26], where the data of the PM concentration obtained from the combustion of WFE are presented. According to [27,28], the PM concentration value also depends on the dispersion of the emulsion. The curve of changes of the PM concentration has a pronounced minimum in the range of sizes of the dispersed phase of emulsion at 35–45 µm [27,28], which is explained by the higher quality of combustion due to the microexplosions of WFE droplets. The NOx concentration also has a maximum in the dispersed phase size range of 35–45 µm, which is associated with a slight increase in the flame temperature due to the intensification of the combustion process with the greatest number of microexplosions of emulsion droplets. At larger sizes of the dispersed phase, the flame temperature decreases due to the ballasting of the active combustion zone by water vapor. At the same time, the concentration of NOx decreases. In [29,30] the influence of the parameters of the combustion process in existing low-capacity boiler plants on the level of formation of NOx, CO, and soot were studied.
It was established that during the WFE combustion with a water content of about 30%, at wall temperatures below the dew point of sulfuric acid vapors, the corrosion rate was at the level of 0.25 mm/year [31,32]. This allows for the installation of a condensing low-temperature heating surface (LTHS) in the EGB and thereby increases the EGB efficiency and thermal power plant [33,34,35].
The processes in the LTHS of the ship’s EGB have a significant impact on the reliability of operation and the economic performance of the boiler as a whole. Depending on the composition of the fuel and the conditions of its combustion, LTHS is susceptible to pollution with PM and soot deposits, and when the wall temperature reaches below the dew point, sulfuric acid vapors condense on them [36].
The intensity of the pollution of LTHS during the combustion of sulfurous fuels determines the level of many thermomechanical parameters of the boiler operation: the values of the exhaust gas temperature; heat loss with exhaust gases and efficiency; and the value of the pollution coefficient [37], which significantly affects the heat transfer coefficient, and therefore the boiler dimensions, cost, and service. The thickness of the pollution layer determines the value of the aerodynamic resistance and the frequency of surface cleaning. Additionally, the combustion of fuels is accompanied by emissions of harmful toxic ingredients and unburned particles of PM and soot.
The data on the pollution of LTHS during WFE combustion are scarce and qualitative, while quantitative data [38,39] on the intensity of pollution of such heating surfaces are completely absent.
There is practically no data on the effect of pollutants on the composition of deposits [40], the efficiency and reliability of the boiler operation, and the environmental indicators. The thermophysical characteristics of deposits at exhaust gas temperatures below the dew point of sulfuric acid vapors have been little studied when the structure and conditions of deposit formation change, even though their effect on the heat transfer processes is quite large.
Modern methods can be used for simulating [41] and optimizing [42] the processes and regimes of operation as well as the statistical treatment of experimental data [43]. To estimate the efficiency of such greening and fuel-saving technologies during operation in actual climatic conditions, various methods of modeling are applied.
The aim of this study is to assess the influence of the intensity of pollutants captured from exhaust gases by condensing LTHS in dependence of water content during WFE combustion. The following tasks are to be solved:
-
Carrying out the experimental research of pollution processes on condensing LTHS of EGB when fuel oil and WFE combustion;
-
Obtaining a dependence of pollution rate on the wall temperature, which influences on the number of PM deposited on condensing LTHS;
-
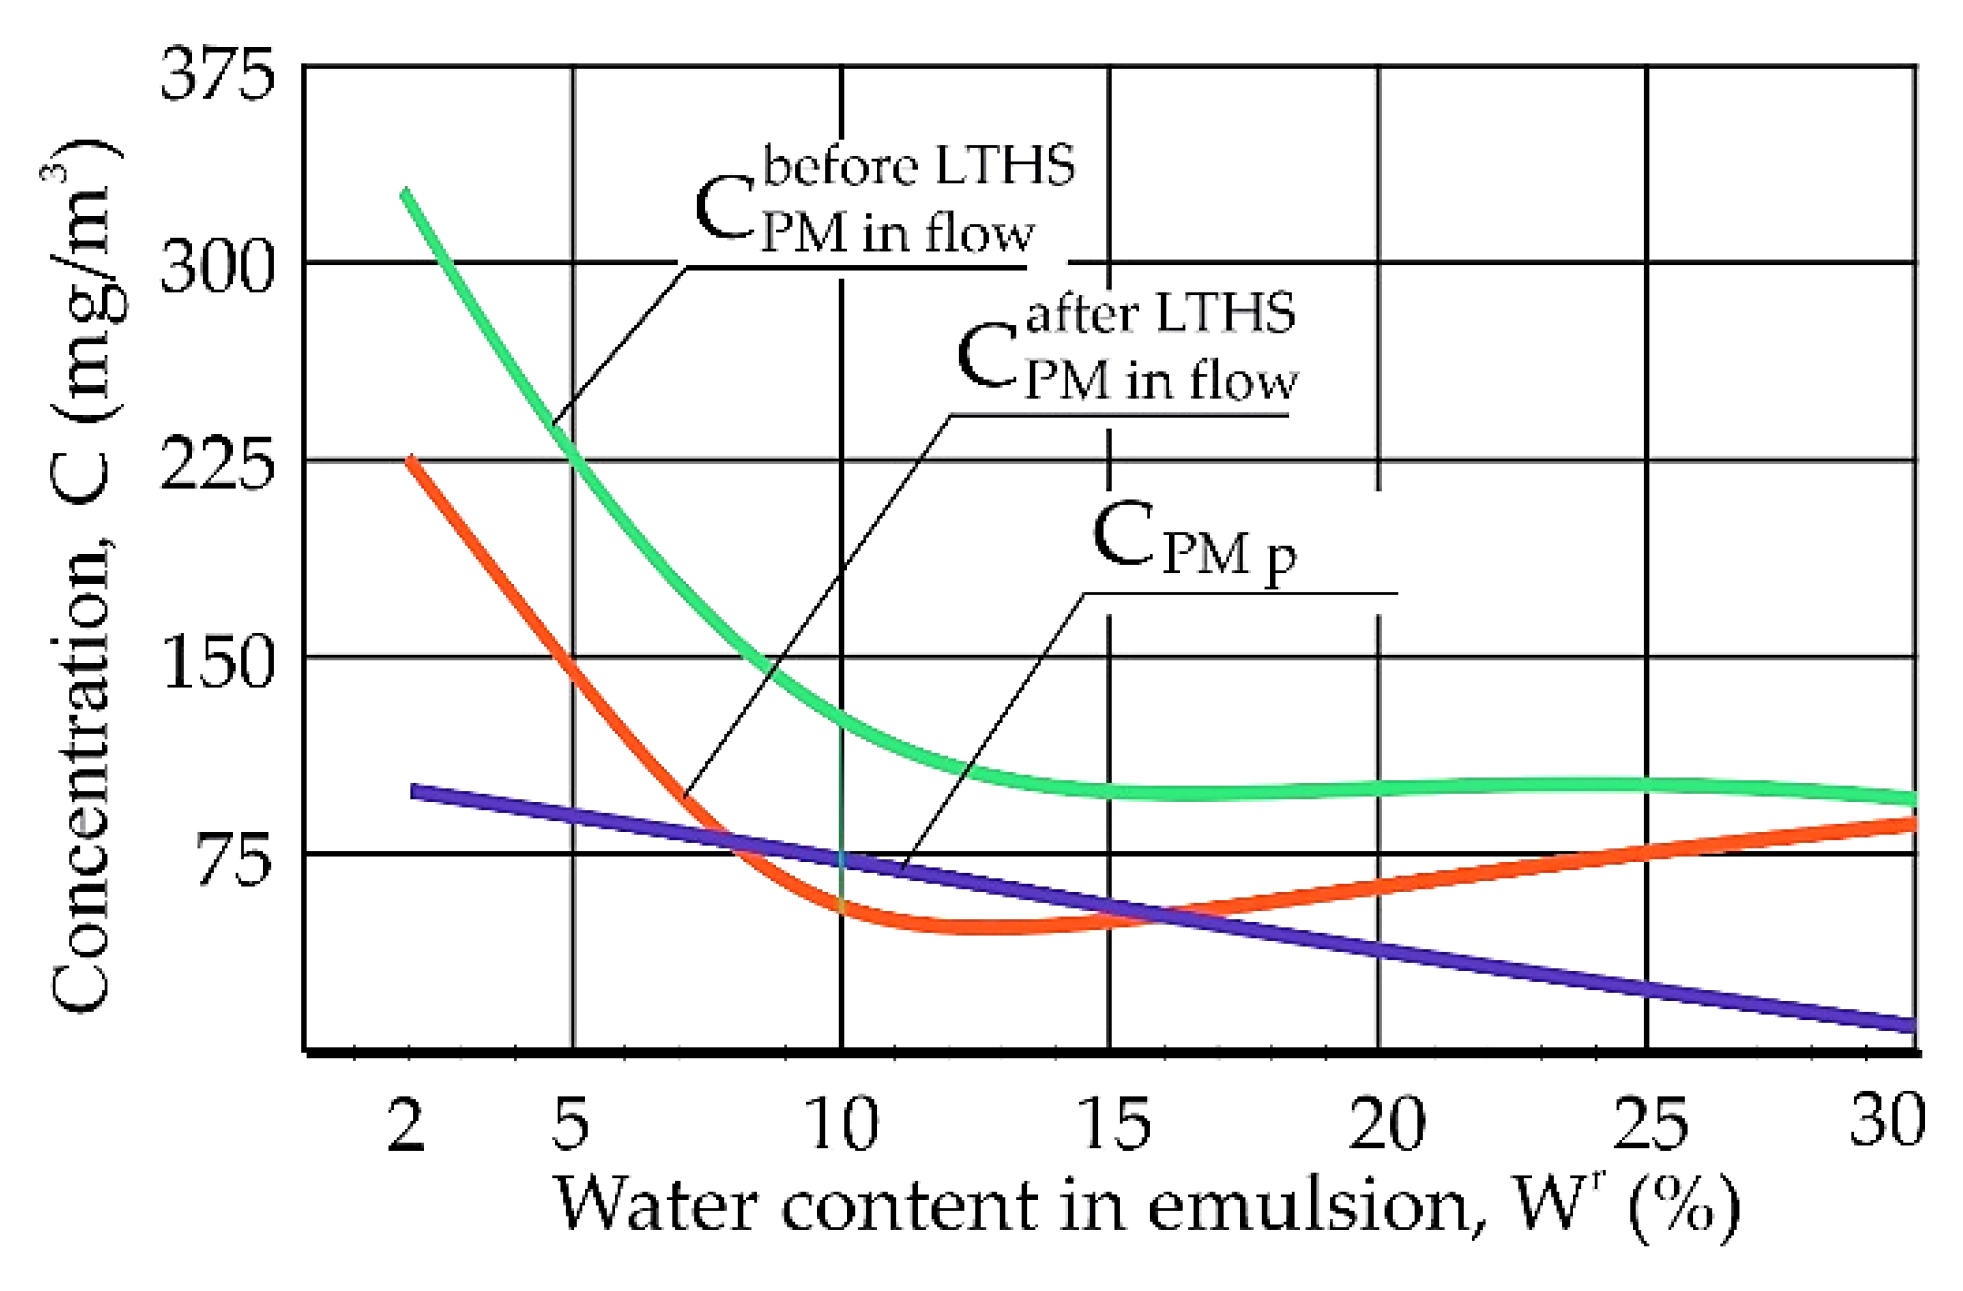
Determining the concentration of PM before and after the LTHS during WFE combustion; and
-
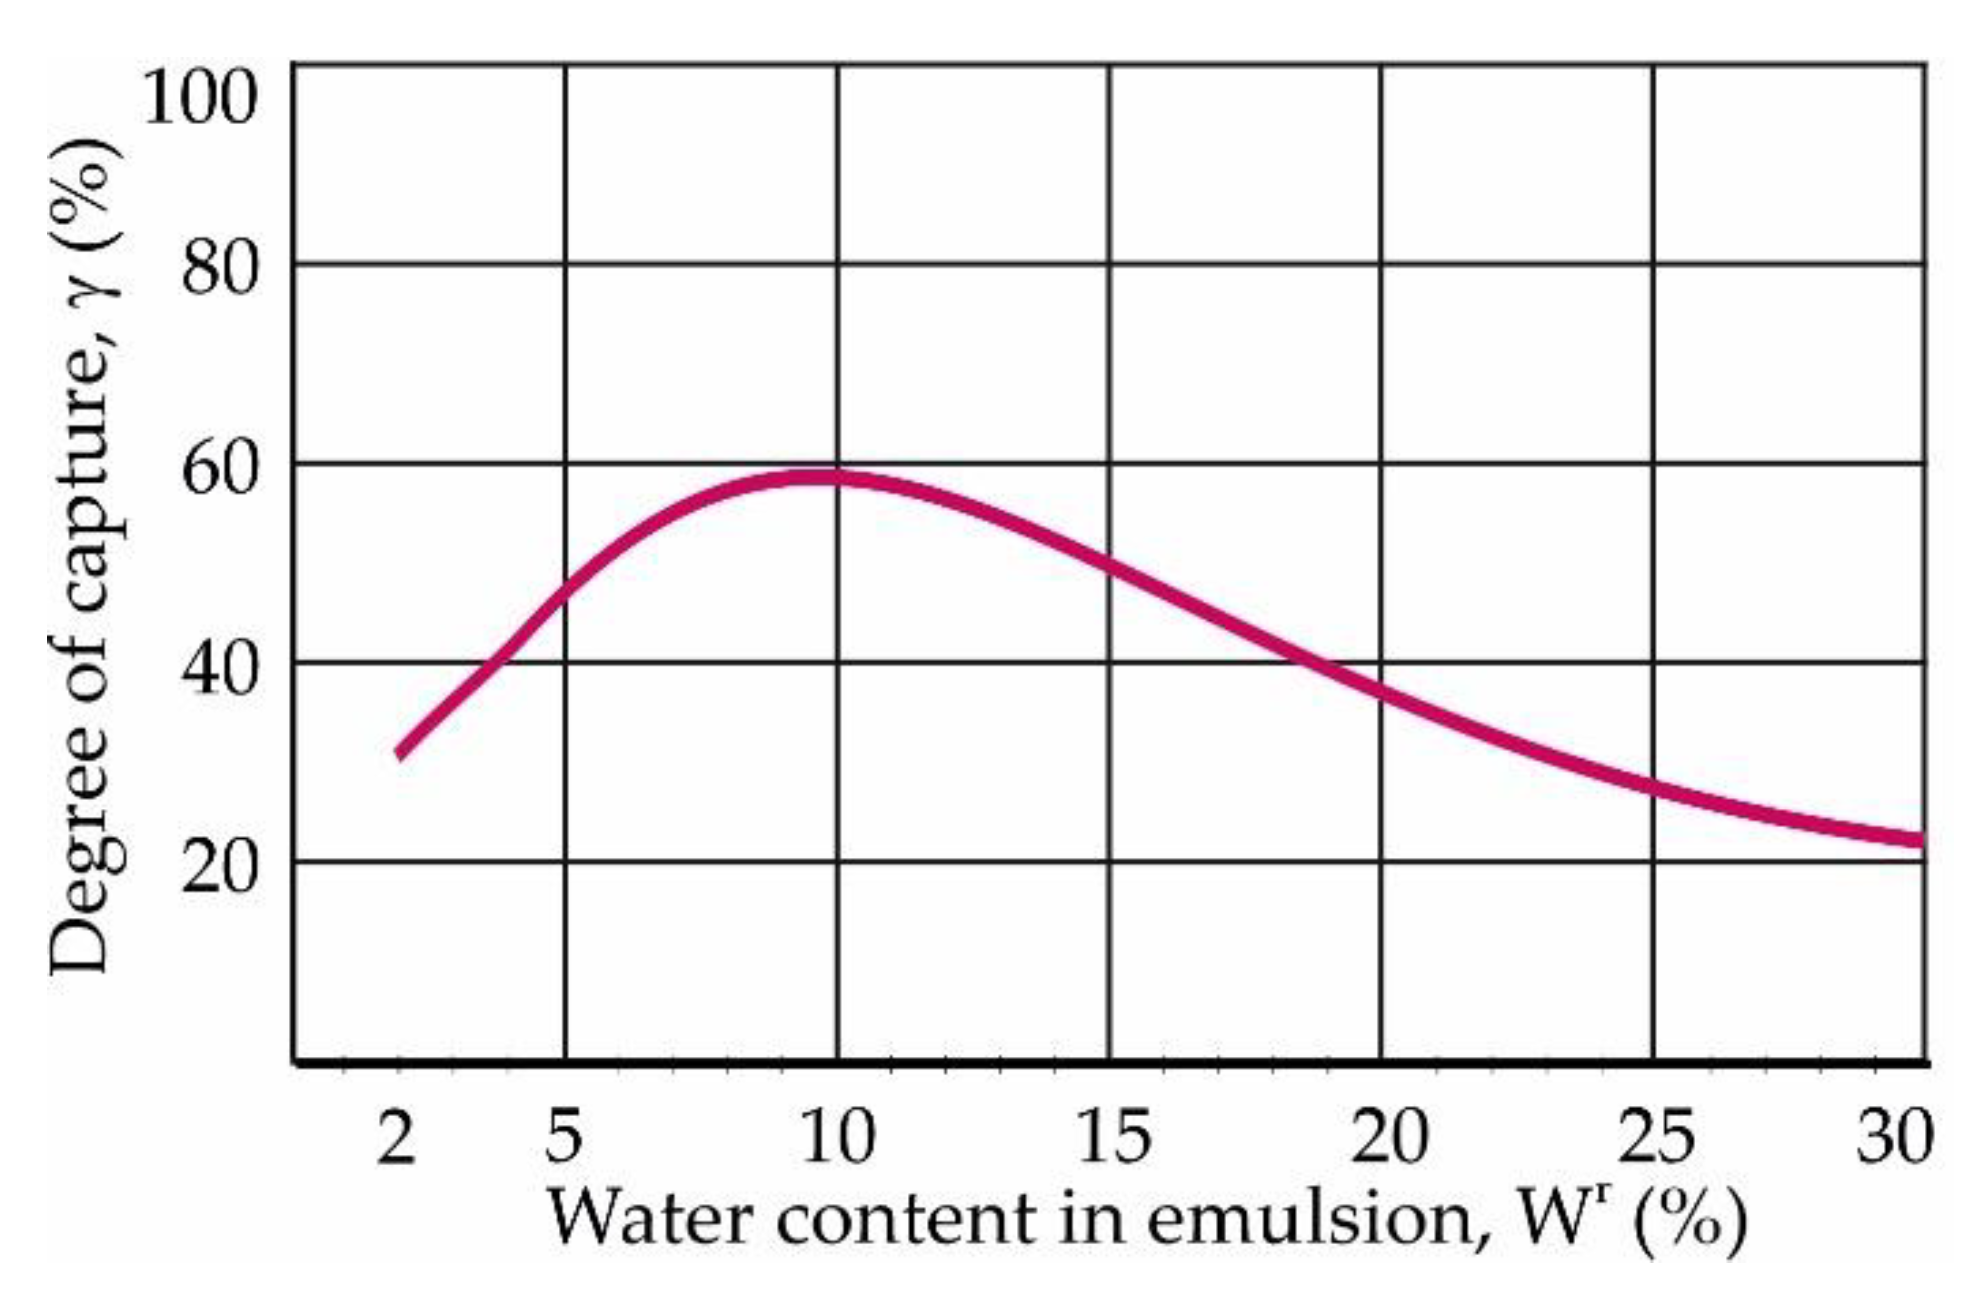
Obtaining a dependence of “degree of capture” of pollutants by condensing LTHS and the reduction of their amount in gases after LTHS.

2. Materials and Methods

2.1. Experimental Research

The variety and complexity of the processes occurring above and in the layer of pollution (chemical reactions in the flow of gases and condensate, adsorption and diffusion processes, and heat transfer) and the lack of experimental data on the effect of combustion of WFE on the processes under consideration, do not allow us to represent their processes of development in the form of mathematical models on the level of solving differential equations. Therefore, it is necessary to carry out appropriate experimental studies with the involvement of calculation methods of research for the subsequent analysis of their results.
For determining the number of PM captured (deposited) on the condensing LTHS moistened with condensate from the gas flow, it is necessary to obtain the results of studies of the pollution intensity of heating surfaces with a wall temperature below the dew point temperature of sulfuric acid vapor.
Most authors call pollution on boiler heating surfaces deposits, although they consist of corrosion products, residual acid, and deposits of PM (ash and soot). Deposits of PM with adsorbed gases, vapors of water, and acid increase the amount of condensate on the surface, which intensifies the pollution of LTHS.
It is necessary to conduct a series of experimental studies during the combustion of emulsified fuel at close values of sulfur content (Sr) and excess air ratio (α) in the entire investigated range of wall temperatures (tw), to assess the effect of the increase in the water content (Wr) of the combusted WFE on the pollution processes at the LTHS.
The studies were carried out at a special experimental setup. Research on such an installation, unlike research on an industrial unit, makes it possible to ensure the constancy of parameters (temperature, composition of exhaust gases, and metal temperature). This will make it possible, with minimal error, to establish the influence of individual operating and design factors on the ongoing pollution processes during the combustion of both standard fuel and WFE based on it alone. The studies were carried out for 2–12 h, and within 100 h for the main modes to check the reliability of the regression equations obtained in the 2–12 h of experiments. The general views of the experimental setup are shown in Figure 1a.
The experimental setup consisted of the following elements: a fuel preparation system, furnace, burner, and gas duct. The shape of the furnace ensured good filling with a torch. Furnace dimensions were length—0.8 m and diameter—0.3 m. The furnace was lined inside with refractory bricks. Exhaust gases from the furnace entered a metal gas duct with a free cross-sectional area of 0.08 m × 0.103 m. The gas duct was lined with refractory bricks. The furnace was cooled by heat transfer to the environment through the uncooled walls of the furnace.
Preparation of a WFE for combustion in the furnace of the experimental setup was carried out using a disperser according to a circulation scheme to obtain an emulsion with a water droplet diameter of 15–30 μm. The fuel system was used to supply 1–3 kg/h of fuel oil to the burner. A rotary nozzle was used as a burner in the unit. As shown by preliminary commissioning tests of the experimental setup, such diameters of water droplets achieve the best quality of combustion of WFE with the turbulence of the flame due to microexplosions of emulsion droplets. In addition, the number of PMs depends on the diameter of the droplets, depending on the water content in WFE.
The analysis of the composition of the exhaust gases for the content of O2 and RO2 was carried out using a gas analyzer, and the content of incomplete combustion products was carried out using a chromatograph. The content of the emission of harmful substances NO, NOx, and SO2 was carried out by the colorimetric method using a gas analyzer.
The working section of pipe samples with an outer diameter of 0.025 m was installed in the flue gas temperature range of about 350 °C. The speed of exhaust gases in the area of installation of pipe samples was 8 m/s. Thermocouples were used to measure the temperature of the metal of the pipe samples. Thermocouples were stamped into washers that were installed between the sample tubes. The washers were made from the same metal as the sample pipes. Temperature values during the experiment were recorded with automatic potentiometers. Water was used to cool the pipe samples.
Investigations of pollution processes were carried out in the wall temperature tw range of 60–180 °C. To obtain the main dependences of the dynamic process development, the data obtained at wall temperatures in the region of the “acid peak” (tw = 105–110 °C), at which the highest corrosion and pollution intensity are observed, were used. The required surface temperature of the sample pipes was set by adjusting the flow rate of the cooling medium. The initial temperature of the cooling medium was set in four thermostats (temperatures of 40, 70, 100, and 120 °C). Determination of the specific mass of pollution ΔGp of pipe samples (Figure 1b,c) was carried out by the gravitation method.
The sample for the study of the pollution rate was a tube with an outer diameter of 0.025 m and a wall thickness of 0.002–0.0025 m, the length of the sample was 0.08 m. Pipe samples of 20 steel were selected for pollution studies. The length of each sample was measured with a caliper with graduation of 0.00005 m. The sample diameter was measured with a micrometer with a scale division of 0.00001 m at a distance of 0.01 m from each end of the tube in two mutually perpendicular directions. The arithmetic mean of four measurements was taken as the calculated diameter. The obtained values were used to calculate the size of the outer surface of the sample (F). The samples were then weighed and labeled. The weighing was carried out on an analytical balance with an optical scale division of 0.1 mg with a variation of the readings of 0.2 mg. The sample mass is designated as m1.
The preparation of samples for testing was completed by assembling a package of pipe samples, installing thermocouples, and then connecting them to a switch and secondary devices. The external view of the sample assembly cassette before installation in the gas duct is shown in Figure 1d.
At the end of the experiment, the working sections with the packages of sample pipes were removed from the gas ducts. The external views of the samples extracted from the gas duct under different modes are shown in Figure 1e. Samples with corrosion products, acid, and deposits were carefully removed from the working areas and weighed on an analytical balance (mass m2). Removal of deposits and corrosion products from the metal surface was carried out by processing the samples in a 5% solution of hydrochloric acid, inhibited by urotropine (1 g per 1 L of solution). Then the samples were then washed in water and B-70 gasoline, dried, and weighed again (mass m3).

2.2. Processing of Experiment Results

The specific mass of pollution on the condensing heating surface ΔGp was determined by the equation
Δ G p = m 2 m 3 F ,
where: ΔGp—the specific mass of pollution on the surface (g/m2), m2—the mass of the sample after experiment (g), F—the average area of the outer surface of the sample to the experiment (m3), m3—the mass of the sample after the cleaning of soot deposits and corrosion products (g).
The pollution rate of the metal surface Kp was determined by the equation
  K p = Δ G p τ ,
where: Kp—the pollution rate on the surface (g/(m2·h)), τ—the duration of experiment (h).
The relative error in obtaining the pollution rate was:
Δ K p K p = ± ( Δ ( Δ m ) Δ m + Δ F F )
The relative error in measuring the area of the pipe sample was:
Δ F F = Δ d d + Δ L L
The relative error in obtaining Δm was ∆(∆m)/∆m = 0.5%. The relative error in obtaining the area of the pollution surface of the pipe sample was ∆F/F = 1.18%. The total relative error in determining the pollution rate is ∆Kp/Kp = 1.68%.
The systematic error in determining the pollution rate was:
Δ K p = ( Δ m τ × F ) 2 + ( Δ m τ 2 × F × Δ τ ) 2 + ( Δ m τ × F 2 × Δ F ) 2
When pollution tests are conducted, the limiting relative systematic error in determining the pollution rate is assumed to be ∆Kp = 10%.
The systematic error in obtaining the area of the pipe sample was:
Δ F = ( F d ex × Δ d ) 2 + ( F F av × Δ d ) 2 + ( F l × Δ L ) 2
With the accepted geometric dimensions of the sample, the value of systematic error was ΔF = 1.84 × 10⁻⁴ m2. The surface of the tube sample was F = 0.082 m2.
The experimental data were processed on a PC using the specialized statistical package Statgraphics Centurion XV in the Regression Model Selection module to find the most optimal regression equation using various functions: linear, exponential, logarithmic, polynomial, etc. The processing results showed that, with the smallest deviation, the dynamic of pollution processes, considering all data, is described by a power function of the form ΔGp = c·τn. In all the options considered, the coefficient of determination was higher than 0.8 (R2 = 0.91–0.99), which, from the viewpoint of the theory of statistics, indicates a low dispersion of the obtained data and fairly high reliability of the obtained regression equations. When processing the research results, it was assumed that the process obeys the obtained regression equations from the very beginning of the impact of the exhaust gas flow.
The processing of the results of experimental studies was carried out using the universal statistical graphic computer system Statgraphics, which contains a fairly complete set of the most common types of statistical data analyses. The system offers additional modules to expand its capabilities. The Design of Experiments module helps to form a criterion for the optimality of an experiment plan, choose the best plan, organize the collection and processing of the required information (determining factors, choosing a plan, generating a worksheet for collecting and recording data, selecting a model, and interpreting the results). The advanced regression analysis module contains procedures: comparing regression lines, selecting the best regression models, and creating a complex multiple regression model. The method of constructing the response surface for three influencing factors was chosen for the analysis. Since the full factorial rotatable design was chosen and all 16 observations are available for it, then all main effects and two-factor interactions are available for calculation.
The mass flow consumption of PM in the exhaust gas flow before LTHS has been determined [44,45], g/h:
G PM   in   flow after   LTHS = f ( C PM   in   flow before   LTHS ) = C PM   in   flow before   LTHS × V gas   flow × 10 3
where Vgas flow = 15 m3/kg—the volume flow rate of exhaust gases through the gas duct of the experimental setup.
The volume concentration of PM in exhaust gas flow before LTHS   C PM   in   flow before   LTHS is an experimental value.
The mass flow consumption of PM deposited on the LTHS G PM   d has been determined, g/h:
G PM   d = K p × F
where Kp—the estimated number of deposits on LTHS of the experimental setup, g/(m2·h).
The total area of the outer surface of the experimental samples installed in the gas duct of the experimental setup:
F = π dln
The diameter of the experimental pipe sample was d = 0.025 m, its length was 1 = 0.08 m, the number of installed samples was n = 13. Thus, F = 0.082 m2.
The volume concentration of PM deposited on LTHS has been determined, mg/m3:
C PM   d = G PM   d × 10 3 V gas   flow
The volume concentration of PM after LTHS was determined, mg/m3:
C PM   in   flow after   LTHS = C PM   in   flow before   LYHS C PM   d
The “degree of capture” LTHS has been determined, %:
γ = 100 × ( C PM   in   flow before   LTHS C PM   in   flow after   LTHS ) C PM   in   flow before   LTHS = 100 × C PM   d C PM   in   flow before   LTHS

3. Results and Discussion

The analysis of the experimental data showed that the content of toxic substances in exhaust gases at the outlet of experimental setup with fuel oil combustion was 860 ppm of NOx, 449 ppm of SO2, and 5.4% of CO and the content toxic ingredients with WFE combustion was 269 ppm of NOx, 183 ppm of SO2, and 3.4% of CO.
The dependences obtained under the most characteristic modes are shown in Figure 2 and show that with an increase in the water content of WFE, the values of the specific mass of pollution ΔGp on the LTHS at a wall temperature tw = 105–110 °C decrease.
The dependences of the specific mass of pollution ΔGp = f(τ) (Figure 3a,b) were obtained as a result of processing the series of experiments. Dependences have shown that for WFE with a water content of 30%, the pollution rate is about 60% lower than during combustion fuel oil with a water content of about 2%.
The increased efficiency of the WFE combustion process is due to the microexplosions of its droplets, which improve the process of mixing the fuel with air and intensifies the process of fuel oil combustion. In this case, the increased fragmentation of the WFE droplets leads to a decrease in the emission of particles.
Figure 4a,b shows the dependences of the change of pollution rate for two modes of combustion of fuels with Wr = 2% and Wr = 30% indicating the magnitude of the deviation between the predicted and control experimental values Kp = f(τ). The deviations between the experimental data of authors [38] and the predicted values do not exceed 15% (Figure 4) which is considered acceptable in the study of the processes and confirms the reliability of research results and approximation equations of pollution processes under different modes obtained during 2–12 h.
Based on the results of investigations of the dependencies ΔGp = f(τ) obtained by various fuels combustion with different excess air ratios α, it was decided to determine the dependence of the specific mass of pollution ΔGp on the sulfur content Sr in the fuel oil, excess air ratio α, and water content in the emulsion Wr based on the data of 8 h experiments (Figure 5a–c).
The dependencies shown in Figure 5a, show that an increase in the excess air ratio α during combustion of fuel oil leads to an increase in the intensity of pollution of the heating surface (the sum of deposits and the amount of acid) due to an increase in the corrosion rate and an increase in the number of PMs. The increase in pollution is less intense at Wr = 30%. Comparison of the curves in Figure 5a with experimental data [38] in the section of the excess air ratio α = 1–1.35, showed an increase in the intensity of pollution with an increase in α.
An increase in Sr in the initial fuel (Wr = 2%) increases the specific mass of pollution ΔGp, most likely due to an increase in the mass of PM and sulfates due to an increase in the corrosion rate of LTHS.
When the water content in WFE is about 30%, the least intensive growth of the pollution process is observed, the corrosion rate is minimal, and, consequently, the number of sulfates is less. At the same time, the number of PM is also reduced. Consequently, a decrease in the excess air ratio α and sulfur content in the initial fuel Sr, as well as an increase in the water content in the WFE, lead to a decrease in the rate of corrosion and pollution of the LTHS and, accordingly, to a decrease in the specific mass of pollution (Figure 5b).
With an increase in the water content Wr in the WFE, a constant decrease in the specific mass of pollution ΔGp is observed (Figure 5c) due to a decrease in PM concentration, the corrosion rate, and in the content of sulfates, despite an increase in the amount of free sulfuric acid.
As result of multivariate regression analysis, the equation for value of ΔGp was obtained as function of other parameters:
ΔGp = −106.882 + 82.887 × α + 78.2079 × Sr + 2.178 × Wr + 10.3394 × (Sr)2 − 1.8425 × WrSr − 0.055 × (Wr)2
The equation gives acceptable values of ΔGp in the range of values α = 1.5–2.9, Sr = 0.98–2%, and Wr = 2–30%.
The analysis of the significance of the factors α, Wr, and Sr influencing the specific mass of pollution ΔGp was carried out. According to the Pareto chart, the sulfur content Sr (factor C), the water content in the emulsion Wr (factor A), α (factor B), and combinations AC, AA, and CC have statistically significant effects (Figure 6). The corresponding columns intersect the vertical line, which represents 95% of the confidence probability.
A series of experiments were carried out under the main two modes to assess the effect of the increase in the water content Wr of the combusted WFE on the pollution processes at the LTHS at tw below the dew point of H2SO4 vapors, the results of which are shown in Figure 7, Figure 8 and Figure 9.
The equation of the pollution rate Kp, depending on the wall temperature tw during fuel oils (Wr = 2%) combustion (mode 1), was obtained by the approximation method based on the experimental data. In this case, the polynomial equation was selected:
Kp = 3082.92 − 117.228 tw + 1.6613 tw2 − 1.0344 ×10⁻² tw3 + 2.3881 ×10⁻⁵ tw4,
This equation (regression coefficient R = 0.9839; R2 = 0.9677 is obtained for the following characteristics of the pollution intensity: tw = 85–130 °C and Wr = 2%. Figure 7 shows the calculated (predicted) values for Kp using the fitted model.
In addition to the best predictions, the figure shows 95% prediction intervals (purple line) for new observations and 95% confidence intervals (red line) for the mean of many observations.
Comparison of the calculated values of the pollution rate KpC (Equation (14)) from those obtained during the experimental study KpE is δΚ = ±5% (Figure 8).
The polynomial equation of the pollution rate KpE depending on the wall temperature tw during the WFE (Wr = 30%) combustion (mode 2) based on the experimental data, was selected:
Kp = 624.931 − 23.3676 tw + 0.3306 tw2 − 2.0583 ×10⁻² tw3 + 4.7526 ×10⁻⁶ tw4,
This equation (regression coefficient R = 0.9969; R2 = 0.9937) is obtained for the following characteristics of the pollution intensity: tw = 80–130 °C, Wr = 30%. Figure 9 shows the calculated (predicted) values for Kp with prediction (purple line) and confidence intervals (red line).
Comparison of the calculated values of the pollution rate KpC (Equation (15)) from those obtained during the experimental study KpE is δΚ = ±2% (Figure 10).
To assess the reliability of the research results obtained in 2–12 h and the approximating dependencies for predicting the pollution intensity, control (main) studies (2 modes) were carried out with a long duration: with WFE combustion (Wr = 30%) based on M40 (Sr = 1.5%) and α = 2.9 at τ = 100 h and with fuel oil M40 combustion (Wr = 2%, Sr = 1.5%) with α = 2.9 at τ = 100 h (Figure 11).
The obtained dependences for the most characteristic modes (Figure 11) show the decreasing values of Kp (the pollution rate on the condensing at the wall temperature tw = 105–110 °C) with an increase of the water content of WFE. Comparison of the predicted values obtained for 8 and 100 h of exposure to the exhaust gas flow using these regression equations (Figure 4a,b) with experimental data (Figure 7 and Figure 9) showed that the discrepancy is within 1–5%.
The results of studies of PM concentration in the exhaust gas flow before and after the heating surfaces is shown in Figure 12.
With an increase in the water content of WFE, the PM content decreases due to their better burn-up in the furnace because of the growth of the turbulence of the flame and finer crushing of the WFE droplets during the “microexplosions” of the emulsion droplets.
When the water content in the emulsion is increased to 10%, the content of PM deposits in the pollutants decreases. This is due to the reduction in particle size in the exhaust gas flow.
A further increase in the water content in the WFE from 17 to 30% leads to a decrease in the PM size. However, an increase in surface moisture increases the adhesive effect of these particles. Therefore, the deposition rate of the particles remains at the same level.
Measurements of the PM concentration before and after the LTHS installed in the exhaust gas duct of the experimental setup had shown that this heating surface ensures the capture of up to 60% of PM from the exhaust gas flow (Figure 13).
It is possible to capture up to 50% of particles from the flow by increasing the surface size with a wall temperature below 120 °C. This is also confirmed by the decreasing values of the PM concentration, due to their deposition on the surface.

4. Conclusions

Combustion of sulfur fuels in ICE is accompanied by the emission of toxic ingredients. Therefore, there is an acute problem of reducing emissions of harmful substances into the atmosphere. The combustion of WFE with a water content of up to 30% enables the use of a condensing LTHS in EGB as a method for the reduction of the PM concentration in the exhaust gases of EGB. This is due to a decrease in the intensity of the LTC on condensing heating surfaces.
Analysis of literary sources showed that there were no quantitative data of the low-temperature pollution intensity of EGB condensing LTHS during WFE combustion.
Experimental research of pollution intensity at wall temperature values below the dew point temperature of sulfuric acid vapors were carried out in an experimental setup with the combustion of fuel oils and WFE based on them.
The research revealed that the stabilization of the pollution process occurs within 5–10 h. Regression equations were obtained that reliably estimate the development of the pollution processes. The study of the kinetics of pollution processes is reliably approximated by power functions with an error of 5–15%.
Analysis of the obtained dependencies of the specific mass of pollution ΔGp on the sulfur content Sr in the fuel oil, excess air ratio α, and water content in the emulsion Wr showed that with a water content of WTE of about 30%, the intensity of pollution processes is significantly reduced.
The obtained experimental dependence of the PM concentration in the exhaust gas flow during the combustion of WFE with different water content shows that with an increase in the water content from 2 to 15%, there is a sharp decrease in the concentration of solid particles in the exhaust gases from 325 mg/m3 to 90 mg/m3, i.e., almost 3.5 times.
When using the condensing LTHS (condensation water economizer) in EGB, the degree of capture (purification) is up to 0.5–0.6.
The method proposed in this paper for determining the PM capture degree by a condensing heating surface can be successfully used to calculate the PM concentration after LTHS condensation, depending on the heating surface area.

Author Contributions

Conceptualization, V.K. and M.R.; methodology, V.K. and M.R.; software, V.K.; validation, Z.Y., V.K., M.R., A.R. and R.R.; formal analysis, Z.Y., V.K., M.R., A.R., R.R. and A.P.; investigation, Z.Y., V.K., M.R., A.R., R.R. and A.P.; resources, V.K.; data curation, V.K., M.R. and A.R.; writing—original draft preparation, V.K.; writing—review and editing, V.K. and M.R.; visualization, V.K. and A.R.; supervision, M.R.; project administration, M.R.; funding acquisition, Z.Y. and A.P. All authors have read and agreed to the published version of the manuscript.

Funding

This research received no external funding.

Institutional Review Board Statement

Not applicable.

Informed Consent Statement

Not applicable.

Data Availability Statement

Not applicable.

Conflicts of Interest

The authors declare no conflict of interest.

Nomenclature

DFstandard diesel fuel
EGBexhaust gas boiler
EGRexhaust gas recirculation technology
ICEinternal combustion engine
LTClow-temperature corrosion
LTHSlow-temperature heating surface
PMparticulate matter
WFEwater-fuel emulsion
Symbols and units
C PM   in   flow after   LTHS volume concentration of PM in exhaust gas flow after LTHSm3/kg
C PM   in   flow before   LTHS volume concentration of PM in exhaust gas flow before LTHSm3/kg
CPM dvolume concentration of PM deposited on the LTHSm3/kg
Faverage area of the outer surface of the sample to the experimentm2
G PM   in   flow after   LTHS mass flow rate of PM in exhaust gas flow after LTHSg/h
G PM   in   flow before   LTHS mass flow rate of PM in exhaust gas flow before LTHSg/h
ΔGpspecific mass of pollutiong/m2
m1mass of sample before experimentg
m2mass of sample after experimentg
m3mass of sample after cleaning of soot deposits and corrosion productsg
Kppollution rate of metal surfaceg/(m2·h)
twwall temperature of heating surface°C
Vgas flowvolume flow rate of exhaust gases through the gasm3/kg
γdegree of capture%
Subscripts
ppollution
PMambient

References

  1. Eidan, A.A.; Alwan, K.J. Enhancement of the performance characteristics for air-conditioning system by using direct evaporative cooling in hot climates. Energy Procedia 2017, 142, 3998–4003. [Google Scholar] [CrossRef]
  2. Radchenko, M.; Radchenko, R.; Tkachenko, V.; Kantor, S.; Smolyanoy, E. Increasing the operation efficiency of railway air conditioning system on the base of its simulation along the route line. In Advances in Intelligent Systems and Computing, International Scientific and Technical Conference on Integrated Computer Technologies in Mechanical Engineering—Synergetic Engineering, ICTM 2019, Kharkiv, 28–30 November 2019; Nechyporuk, M., Pavlikov, V., Kritskiy, D., Eds.; Springer: Cham, Switzerland, 2020; Volume 1113, pp. 461–467. [Google Scholar] [CrossRef]
  3. Marques, R.P.; Hacon, D.; Tessarollo, A.; Parise, J.A.R. Thermodynamic analysis of trigeneration systems taking into account refrigeration, heating and electricity load demands. Energy Build. 2010, 42, 2323–2330. [Google Scholar] [CrossRef]
  4. Trushliakov, E.; Radchenko, A.; Radchenko, M.; Kantor, S.; Zielikov, O. The efficiency of refrigeration capacity regulation in the ambient air conditioning systems. In Lecture Notes in Mechanical Engineering, Advances in Design, Simulation and Manufacturing III, Proceedings of the 3rd International Conference on Design, Simulation, Manufacturing: The Innovation Exchange, DSMIE-2020, Kharkiv, Ukraine 9–12 June 2020; Ivanov, V., Pavlenko, I., Liaposhchenko, O., Machado, J., Edl, M., Eds.; Springer: Cham, Switzerland, 2020; pp. 343–353. [Google Scholar] [CrossRef]
  5. Alahmer, A.; Alsaqoor, S. Simulation and optimization of multi-split variable refrigerant flow systems. Ain. Shams Eng. J. 2017, 9, 1705–1715. [Google Scholar] [CrossRef]
  6. Radchenko, A.; Stachel, A.; Forduy, S.; Portnoi, B.; Rizun, O. Analysis of the efficiency of engine inlet air chilling unit with cooling towers. In Lecture Notes in Mechanical Engineering, Advances in Design, Simulation and Manufacturing III, Proceedings of the 3rd International Conference on Design, Simulation, Manufacturing: The Innovation Exchange, DSMIE-2020, Kharkiv, Ukraine, 9–12 June 2020; Ivanov, V., Pavlenko, I., Liaposhchenko, O., Machado, J., Edl, M., Eds.; Springer: Cham, Switzerland, 2020; pp. 322–331. [Google Scholar] [CrossRef]
  7. Butrymowicz, D.; Gagan, J.; Śmierciew, K.; Łukaszuk, M.; Dudar, A.; Pawluczuk, A.; Łapiński, A.; Kuryłowicz, A. Investigations of Prototype Ejection Refrigeration System Driven by Low Grade Heat. In Proceedings of the HTRSE-2018, E3S Web of Conferences, Międzyzdroje, Poland, 2–5 September 2018; Volume 70. [Google Scholar] [CrossRef]
  8. Radchenko, A.; Trushliakov, E.; Tkachenko, V.; Portnoi, B.; Prjadko, O. Improvement of the refrigeration capacity utilizing for the ambient air conditioning system. In Lecture Notes in Mechanical Engineering, Advanced Manufacturing Processes II, Selected Papers from the 2nd Grabchenko’s International Conference on Advanced Manufacturing Processes (InterPartner-2020), Odessa, Ukraine, 8–11 September 2020; Tonkonogyi, V., Ivanov, V., Trojanowska, J., Oborskyi, G., Grabchenko, A., Pavlenko, I., Edl, M., Kuric, I., Dasic, P., Eds.; Springer: Cham, Switzerland, 2021; pp. 714–723. [Google Scholar]
  9. Shukla, A.K.; Singh, O. Thermodynamic investigation of parameters affecting the execution of steam injected cooled gas turbine based combined cycle power plant with vapor absorption inlet air cooling. Appl. Therm. Eng. 2017, 122, 380–388. [Google Scholar] [CrossRef]
  10. Radchenko, M.; Mikielewicz, D.; Tkachenko, V.; Klugmann, M.; Andreev, A. Enhancement of the operation efficiency of the transport air conditioning system. In Lecture Notes in Mechanical Engineering, Advances in Design, Simulation and Manufacturing III, Proceedings of the 3rd International Conference on Design, Simulation, Manufacturing: The Innovation Exchange, DSMIE-2020, Kharkiv, Ukraine, 9–12 June 2020; Ivanov, V., Pavlenko, I., Liaposhchenko, O., Machado, J., Edl, M., Eds.; Springer: Cham, Switzerland, 2020; pp. 332–342. [Google Scholar] [CrossRef]
  11. Sur, A.; Das, R.K.; Sah, R.P. Influence of initial bed temperature on bed performance of an adsorption refrigeration system. Therm. Sci. 2018, 22, 2583–2595. [Google Scholar] [CrossRef]
  12. Konovalov, D.; Kobalava, H.; Radchenko, M.; Scurtu, I.C.; Radchenko, R. Determination of Hydraulic Resistance of the Aerothermopressor for Gas Turbine Cyclic Air Cooling. In Proceedings of the TE-RE-RD 2020, E3S Web of Conferences, Constanta, Romania, 26–27 June 2020; Volume 180, p. 01012. [Google Scholar]
  13. Kjolholt, J. Assessment of Possible Impacts of Scrubber Water Discharges on the Marine Environment. The Danish Environmental Protection Agency (Environmental Project No. 1431. 2012, 93p). Available online: https://www2.mst.dk/Udgiv/publications/2012/06/978-87-92903-30-3.pdf (accessed on 22 June 2021).
  14. Landet, R.D. PM Emissions and NOx—Reduction Due to Water in Fuel Emulsions in Marine Diesel Engines. Master’s Thesis, Norwegian University of Scienceand Technology, Department of Marine Technology, Trondheim, Norway, 2010; 73p. Available online: https://ntnuopen.ntnu.no/ntnu-xmlui/bitstream/handle/11250/237793/375078_FULLTEXT01.pdf?sequence=1&isAllowed=yhttp://hdl.handle.net/11250/237793 (accessed on 22 June 2021).
  15. MAN Diesel Turbo. Available online: https://marine.man-es.com/two-stroke/ceas (accessed on 22 June 2021).
  16. PureSOx Exhaust Gas Cleaning. Available online: https://www.alfalaval.com/globalassets/documents/microsites/puresox/puresox-brochure-2018.pdf (accessed on 23 March 2021).
  17. Ecospec CSNOxTM Broshure. Available online: https://www.environmental-expert.com/downloads/ecospec-csnox-3-in-1-emission-abatement-system-brochure-785875 (accessed on 22 June 2021).
  18. Miao, Y.C.; Yu, C.L.; Wang, B.H.; Chen, K. The applied research of emulsified heavy fuel oil used for the marine diesel engine. Adv. Mater. Res. 2013, 779, 469–476. [Google Scholar] [CrossRef]
  19. Radchenko, R.; Pyrysunko, M.; Radchenko, A.; Andreev, A.; Kornienko, V. Ship engine intake air cooling by ejector chiller using recirculation gas. In Lecture Notes in Mechanical Engineering, Advanced Manufacturing Processes II, Selected Papers from the 2nd Grabchenko’s International Conference on Advanced Manufacturing Processes (InterPartner-2020), Odessa, Ukraine, 8–11 September 2020; Tonkonogyi, V., Ivanov, V., Trojanowska, J., Oborskyi, G., Grabchenko, A., Pavlenko, I., Edl, M., Kuric, I., Dasic, P., Eds.; Springer: Cham, Switzerland, 2021; pp. 734–743. [Google Scholar]
  20. Hansen, J.P. Exhaust Gas Scrubber Installed Onboard MV Ficaria Seaways. Public Test Report the Danish Environmental Protection Agency. 2012. 30p. Available online: https://www2.mst.dk/Udgiv/publications/2012/06/978-87-92903-28-0.pdf (accessed on 22 June 2021).
  21. Baskar, P.; Senthil Kumar, A. Experimental investigation on performance characteristics of a diesel engine using diesel-water emulsion with oxygen enriched air. Alex. Eng. J. 2017, 56, 137–146. [Google Scholar] [CrossRef] [Green Version]
  22. Wojs, M.K.; Orliński, P.; Kamela, W.; Kruczyński, P. Research on the influence of ozone dissolved in the fuel-water emulsion on the parameters of the CI engine. IOP Conf. Ser. Mater. Sci. Eng. 2016, 148, 1–8. [Google Scholar] [CrossRef]
  23. Zang, T.; Okada, H.; Tsukamoto, T.; Ohe, K. Experimental Study on Water Particles in the Combustion of Marine Four-Stoke Diesel Engine Operated with Emulsified Fuels; Paper 193; CIMAK: Vienna, Austria, 2007. [Google Scholar]
  24. Vellaiyan, S.; Amirthagadeswaran, K.S. The role of water-in-diesel emulsion and its additives on diesel engine performance and emission levels: A retrospective review. Alex. Eng. J. 2016, 55, 2463–2472. [Google Scholar] [CrossRef] [Green Version]
  25. Gupta, R.K.; Sankeerth, K.A.; Sharma, T.K.; Rao, G.; Murthy, K.M. Effects of water-diesel emulsion on the emission characteristics of single cylinder direct injection diesel engine—A review. Appl. Mech. Mater. 2014, 592, 1526–1533. [Google Scholar] [CrossRef]
  26. Patel, K.R.; Dhiman, V. Research study of water- diesel emulsion as alternative fuel in diesel engine—An overview. Int. J. Latest Eng. Res. Appl. 2017, 2, 37–41. [Google Scholar]
  27. Patel, N.; Modi, M.; Patel, T. Investigation of diesel engine with water emulsifier—A review. Int. Res. J. Eng. Technol. 2017, 4, 879–883. [Google Scholar]
  28. Sugeng, D.A.; Ithnin, A.M.; Amri, N.S.M.S.; Ahmad, M.A.; Yahya, W.J. Water content determination of steam generated water-in-diesel emulsion. J. Adv. Res. Fluid Mech. Therm. Sci. 2018, 49, 62–68. [Google Scholar]
  29. Kruczyński, P.; Orliński, P.; Kamela, W.; Ślęzak, M. Analysis of selected toxic components in the exhaust gases of a CI engine supplied with water-fuel emulsion. Pol. J. Environ. Stud. 2018, 27, 129–136. [Google Scholar] [CrossRef]
  30. Katin, V.; Kosygin, V.; Akhtiamov, M.; Vol’khin, I. Mathematical models of the output of major pollutants in the process of burning water fuel oil emulsions in boiler plants. In Proceedings of the 19th International Scientific Conference Energy Management of Municipal Transportation Facilities and Transport, EMMFT, Khabarovsk, Russia, 10–13 April 2017; Springer: Amsterdam, The Netherlands, 2018; Volume 692, pp. 987–997. [Google Scholar]
  31. Kornienko, V.; Radchenko, R.; Bohdal, Ł.; Kukiełka, L.; Legutko, S. Investigation of condensing heating surfaces with reduced corrosion of boilers with water-fuel emulsion combustion. In Lecture Notes in Networks and Systems: In Advances in Intelligent Systems and Computing, International Scientific and Technical Conference on Integrated Computer Technologies in Mechanical Engineering—Synergetic Engineering, ICTM 2020, Kharkiv, 29–30 October 2020; Nechyporuk, M., Pavlikov, V., Kritskiy, D., Eds.; Springer: Cham, Switzerland, 2021; Volume 188, pp. 300–309. [Google Scholar] [CrossRef]
  32. Chen, H.; Pan, P.; Wang, Y.; Zhao, Q. Field study on the corrosion and ash deposition of low–temperature heating surface in a large–scale coal–fired power plant. Fuel 2017, 208, 149–159. [Google Scholar] [CrossRef]
  33. Radchenko, R.; Pyrysunko, M.; Kornienko, V.; Scurtu, I.-C.; Patyk, R. Improving the ecological and energy efficiency of internal combustion engines by ejector chiller using recirculation gas heat. In Lecture Notes in Networks and Systems: In Advances in Intelligent Systems and Computing, International Scientific and Technical Conference on Integrated Computer Technologies in Mechanical Engineering—Synergetic Engineering, ICTM 2020, Kharkiv, 29–30 October 2020; Nechyporuk, M., Pavlikov, V., Kritskiy, D., Eds.; Springer: Cham, Switzerland, 2021; Volume 188, pp. 531–541. [Google Scholar] [CrossRef]
  34. Kornienko, V.; Radchenko, M.; Radchenko, R.; Konovalov, D.; Andreev, A.; Pyrysunko, M. Improving the efficiency of heat recovery circuits of cogeneration plants with combustion of water-fuel emulsions. Therm. Sci. 2021, 25, 791–800. [Google Scholar] [CrossRef] [Green Version]
  35. Konur, O.; Saatcioglu, O.Y.; Korkmaz, S.A.; Erdogan, A.; Colpan, C.O. Anil Erdogan. Heat exchanger network design of an organic Rankine cycle integrated waste heat recovery system of a marine vessel using pinch point analysis. Int. J. Energy Res. 2020, 44, 12312–12328. [Google Scholar] [CrossRef]
  36. Vainio, E.; Kinnunen, H.; Laurén, T.; Brink, A.; Yrjas, P.; DeMartini, N.; Hupa, M. Low-temperature corrosion in co-combustion of biomass and solid recovered fuels. Fuel 2016, 184, 957–965. [Google Scholar] [CrossRef]
  37. Bohdal, L.; Kukiełka, L.; Legutko, S.; Patyk, R.; Radchenko, A.M. Modeling and experimental analysis of shear-slitting of AA6111-T4 aluminum alloy sheet. Materials 2020, 13, 3175. [Google Scholar] [CrossRef]
  38. Akimov, O.V. Dynamics of reduction of ash and soot emissions during combustion of water-oil emulsions in boilers. Scientific works: Scientific and methodical journal. Technog. Saf. 2008, 95, 39–46. [Google Scholar]
  39. Shia, Y.-T.; Gao, M.; Tang, G.-H.; Sun, F.-Z.; Tao, W.-Q. Experimental research of CFB ash deposition on helical finned tubes. Appl. Therm. Eng. 2012, 37, 420–429. [Google Scholar] [CrossRef]
  40. Han, H.; He, Y.L.; Tao, W.Q. A numerical study of the deposition characteristics of sulfuric acid vapor on heat exchanger surfaces. Chem. Eng. Sci. 2013, 101, 620–630. [Google Scholar] [CrossRef]
  41. Trushliakov, E.; Radchenko, A.; Forduy, S.; Zubarev, A.; Hrych, A. Increasing the operation efficiency of air conditioning system for integrated power plant on the base of its monitoring. In Advances in Intelligent Systems and Computing, International Scientific and Technical Conference on Integrated Computer Technologies in Mechanical Engineering—Synergetic Engineering, ICTM 2019, Kharkiv, 28–30 November 2019; Nechyporuk, M., Pavlikov, V., Kritskiy, D., Eds.; Springer: Cham, Switzerland, 2020; Volume 1113, pp. 351–360. [Google Scholar] [CrossRef]
  42. Radchenko, M.; Radchenko, A.; Radchenko, R.; Kantor, S.; Konovalov, D.; Kornienko, V. Rational loads of turbine inlet air absorption-ejector cooling systems. Proc. Inst. Mech. Eng. Part A J. Power Energy 2021. [Google Scholar] [CrossRef]
  43. Radchenko, A.; Trushliakov, E.; Kosowski, K.; Mikielewicz, D.; Radchenko, M. Innovative turbine intake air cooling systems and their rational designing. Energies 2020, 13, 6201. [Google Scholar] [CrossRef]
  44. Kumar, P. Thermal Calculation of Boiler Units (Normative Method), 3rd ed.; NGO CKTI: St. Petersburg, Russia, 1998. [Google Scholar]
  45. Kornienko, V.; Radchenko, M.; Radchenko, R.; Kruzel, M.; Konovalov, D.; Andreev, A. Absorption of Pollutants from Exhaust Gases by Low-Temperature Heating Surfaces. In Proceedings of the V International Scientific and Technical Conference Modern Power Systems and Units (MPSU 2021), E3S Web of Conferences, Cracow, Poland, 19–21 May 2021; Volume 323, p. 00018. [Google Scholar]
Figure 1. Pictures of the experimental setup (a), view of pollutions during WFE (b), and fuel oil (c) combustion, samples for research of LTC before tests (d), and after the tests (e).
Energies 15 00120 g001aEnergies 15 00120 g001b
Figure 2. Dependences of pollution processes for the most characteristic modes: 1—Sr = 1.5%, α = 2.9, and Wr = 2%; 2—Sr = 1.5%, α = 2.9, and Wr = 17%; 3—Sr = 1.5%, α = 2.9, and Wr = 30%; and 4—Sr = 1.5%, α = 2.9, and Wr = 2% (DF).
Energies 15 00120 g002
Figure 3. Dependences of the specific mass of pollution ΔGp from time of experiments τ during fuel oil (Sr = 1.5%, α = 2.9, and Wr = 2%) (a) and WFE (Sr = 1.5%, α = 2.9, and Wr =30%) (b) combustion.
Energies 15 00120 g003
Figure 4. Dependences of the pollution rate Kp from time of experiments τ during fuel oil (Sr = 1.5%, α = 2.9, and Wr = 2%) (a) and WFE (Sr = 1.5%, α = 2.9, and Wr = 30%) (b) combustion.
Energies 15 00120 g004
Figure 5. Dependences of the specific mass of pollution ΔGp at: ΔGp = f(α) while Sr = 1.5% and Wr = 2, 30% (a); ΔGp = f(Sr) while α = 2.9 and Wr = 2, 30% (b); and ΔGp = f(Wr) while α = 2.9 and Sr = 0.98, 1.5, and 1.8% (c).
Energies 15 00120 g005
Figure 6. Pareto chart for the specific mass of pollution ΔGp.
Energies 15 00120 g006
Figure 7. Experimental dependences of pollution rate KpE on wall temperature tw with confidence and prediction curves during the fuel oils combustion.
Energies 15 00120 g007
Figure 8. Comparison of calculated pollution rate KpC values with experimental KpE during the fuel oils combustion.
Energies 15 00120 g008
Figure 9. Experimental dependences of pollution rate KpE from wall temperature tw with confidence and prediction curves during the WFE combustion.
Energies 15 00120 g009
Figure 10. Comparison of calculated pollution rate KpC values with experimental KpE during the WFE combustion.
Energies 15 00120 g010
Figure 11. Dependences of pollution rate Kp on wall temperature tw during the fuel oils and WFE combustion.
Energies 15 00120 g011
Figure 12. Dependences of the PM concentration in the exhaust gases before and after LTHS.
Energies 15 00120 g012
Figure 13. Dependence of the “degree of capture” of PM by condensing LTHS.
Energies 15 00120 g013
Publisher’s Note: MDPI stays neutral with regard to jurisdictional claims in published maps and institutional affiliations.

