Article

Factors Influencing the Renewable Energy Consumption in Selected European Countries

1
Department of Economics, Stanisław Staszic University of Applied Sciences in Pila, 64-920 Pila, Poland
2
Department of Finance and Entrepreneurship, Sumy State University, 40007 Sumy, Ukraine
3
The London Academy of Science and Business, London W1U 6TU, UK
*
Author to whom correspondence should be addressed.
Energies 2022, 15(1), 108; https://doi.org/10.3390/en15010108
Submission received: 19 November 2021 / Revised: 14 December 2021 / Accepted: 16 December 2021 / Published: 23 December 2021
(This article belongs to the Special Issue Green Economics and Sustainable Management of Energy Sources)

Abstract

:
The overcoming of the issues on energy crisis and inequality have become the priorities as far developing as developed countries are concerned. Moreover, energy inequality has increased due to the shortage of natural gas and rising energy prices in retaliation to the economic recovery affected by the COVID-19 pandemic. This study aims to verify the linkage between the growth of renewable energy consumption and the country’s economic advancement. In this context, this paper determines the main driving forces of renewable energy consumption in European countries during 2000–2018. The annual data for panel regression analysis are retrieved from the OECD. Stat and World Bank Open Data. This empirical analysis employed a set of estimation procedures such as the panel unit root test (Levin, Lin & Chu; Im, Pesaran, Shin W-Stat; ADF-Fisher Chi-square; and PP-Fisher Chi-square methods), the Pearson correlation, fixed- and random-effects models, generalized method of moments (GMM), Hausman and the robustness tests. The results from the Hausman test ratified that the fixed-effects regression model is more suitable for involved panel balanced data. The results of fixed-effects regression and GMM identified the statistically significant and positive relationship between the share of renewable energy consumption of total final energy consumption, GDP per capita, and CO2 emissions per capita for the overall sample. In turn, the total labor force, the gross capital formation, and production-based CO2 intensity are inversely related to renewable energy consumption. The identified effects could provide some insights for policymakers to improve the renewable energy sector towards gaining sustainable economic development.

1. Introduction

The world public has become highly exercised over the energy crisis caused by the shortage of natural gas and rising energy prices in retaliation against the economic recovery affected by the COVID-19 pandemic. The papers [1,2,3,4,5,6,7,8,9,10,11,12,13,14,15,16,17,18,19,20,21,22,23,24,25,26,27,28,29,30,31,32,33,34,35,36,37,38,39,40,41,42,43,44] confirmed that economic development increases energy consumption. Moreover, the analysis of statistical data [5] allowed stating that final electric energy consumption at the global level has been growing since 2000. It is noteworthy here that constantly the biggest electric energy consumer was the industrial sector. Thus, in 2019 it consumed 9566.38 TWh of final electric energy, followed by the residential sector—6071 TWh, the commercial sector—4849.42 TWh, and transport—419.54 TWh. On the other hand, in the case of the EU final energy consumption structure for 2019 [6], the transport sector occupies the most significant share (31%), followed by households and industry (26 and 25%, respectively), services (14%), agriculture and forestry (3%) (Figure 1).
At the same time, energy consumption growth provokes adverse climate change, raises environmental pollution, and endangers national energy independence. Noteworthy here, the risk of depletion of non-renewable energy resources gives the world community another cause for concern.
Given the above, renewable energy is considered to be an effective measure for overcoming the energy crisis and mitigating climate change. Despite the global economic crisis, renewable energy has stable growth, although with better degrees of success in developed countries. Indeed, economic development boosts the penetration of green innovation technologies (renewable energies, smart greed, etc.) that allows solving the energy crisis issues.
The green transition is a long-term process that provokes socio-economic and ecological transformations and requires international treaties and conventions. Moreover, there is a risk of emerging economic inequality, marginalization, social tension, and international conflicts since the developed countries have more advantages in the green transition. Therefore, the International financial institutions, the United Nations, and governments of developed countries have to support and invest in low-income countries to accelerate the non-conflict green transition. In turn, the governments should implement a commitment under the sustainable development goals.
The governments of less developed countries should consider the experience of high-income countries to elaborate on the comprehensive set of measures to regulate, stimulate and attract investments into the development of renewable sources and energy-efficient technologies and ensure carbon-free economic development. Determining the main driving forces provides the right framework for increasing the demand for renewable energy among the private and public demand for renewable energy and accelerating the green transformation.
Therefore, the green economic transition under renewable energy fostering is at the top of the agenda of geopolitical discussion. It is worth noting that renewable energy is generated from natural renewable sources, which are constantly replenished but flow-limited. Thus, renewable sources provide energy from natural phenomena such as geothermal, wind, solar radiation, liquid biomass, tidal and ocean currents, etc. Renewable energy offers the possibility to substitute traditional fossil fuels, reduce reliance on carbon, break new ground for industrial development [5,6,7], drastically reduce CO2 emissions [8], etc. It stands to note that solutions to environmental problems and sustainable development take on a dimension to the sixth technology revolution transition [9]. From the social and economic point of view, the green transformation requires improvement and updating the existent technological expertise in the energy sector that contributes to raising living standards and reducing the environmental pressure [10,11].
The Paris Climate Agreement set the primary vision for accelerating the transition to climate neutrality, clean energy, and a green economy. Energy decarbonization and sustainable industry are considered to be one of the main directions under the sustainable development goals (SDGs) framework [12,13,14]. Thus, many countries raise the issue of development and search for new renewable energy sources. Renewable energy consumption (REC) ensures sustainable economic development by vastly improving the environmental situation. It is appropriate to clarify that the European Environmental Agency [15] defines REC as the ratio between the gross energy generated from renewable sources and total energy consumption in the particular country.
It stands to mention that renewable energy development firstly elicits a response from the economically developed countries. To measure the success in gaining SDGs, the experts at the Bertelsmann Stiftung and Sustainable Development Solutions Network by United Nations have elaborated on the Sustainable Development Goal Index (SDG Index). Thus, according to the official report on the 2021 SDG Index scores [16], the European countries such as Finland (85.9), Sweden (85.6), Denmark (84.9), Germany (82.50), Belgium (82.2), Austria (82.1), Norway (82.0), France (81.7), Slovenia (81.6) showed the best performance across 17 SDGs.
In the context of the Directive 2009/28/EC on the promotion of the use of energy from renewable sources [17], in 2009, the EU set the target to raise the share for renewable energies by 20% until 2020. In line with the above, each EU member transposes this target into the domestic legal system and sets the national targeted indicator for the share of renewable energy in gross final energy consumption. Figure 2 shows that most EU countries would reach the national target for renewable energies by 2020.
Further, in 2018, the EU leaders agreed to increase the share of energy consumption from renewable sources by 32% until 2030 [18,19]. Figure 3 shows that the average growth rate of the REC in the EU for 2015–2019 is 101.72 (p = 27.59%). Therefore, it allows stating that the EU wouldn’t reach the common target of 32% of renewable energy consumption until 2030 since there is a significant gap among the EU member states. On the other hand, the growth rates of the REC of 108.41 and 110.64 (p = 6.9 and 3.45%, respectively) indicate the existence of influential driving forces in increasing the share of energy consumption from renewable sources.
The above demonstrates that the progressive experience of economically developed countries in renewable energy could be the core for accelerating green transformation worldwide for green development. It stands to define that green development is a development model that rests on sustainable development principles to ensure the symbiosis among economic growth, social prosperity, and environmental safety.
In turn, green development at the national levels could be enhanced with the overall vision of green transformations rested on the principles of sustainable development, increasing energy security, defending the environment against the adverse effect of fossil fuels, and overcoming climate change. Therefore, the determination of the main factors influencing REC is relevant to research. In turn, this study is beneficial for governments in most developing countries. The obtained results could be used for developing the road maps to solve the energy problems and expand renewable energy sources at the national levels.
The structure of the remainder of this paper is as follows: Section 2 provides the results of systematizing the main literature devoted to determinants of REC; Section 3 is about the data and methods used in this study; Section 4 presents the regression results; Section 5 discusses the influence of investigated variables on the REC. Section 6 demonstrates the related conclusions and gives some suggestions for further research

2. Literature Review

2.1. Theoretical Framework

Determination of the renewable energy drivers and assessing their influence allows accelerating the green transformation process towards overcoming and mitigating the adverse climate change worldwide. However, the systematization of scientific background showed no consensus on the determinants influencing renewable energy advancement despite the relevance of promoting renewable energy. Remarkably, the scientific literature mostly addresses the relationship between energy consumption and economic progress [20,21,22] while focusing on driving forces [23] for their development. In this context, there are many empirical studies on macroeconomic determinants of REC [24,25,26]. The findings of the variance decomposition analysis [27] showed economic advancement is the main driving force for REC in Pakistan over 1975–2012.
With reference to the literature on the types of energy, Ponce et al. [28] analyzed the influence of human capital and non-renewable energy prices on renewable and non-renewable energy consumption based on the data for 53 countries’ biggest consumers of renewable energy during 1990–2017. The findings of generalized least squares (GLS) models confirmed that human capital has a statistically significant and positive influence on REC. At the same time, and non-renewable energy prices provoke the growth of both types of energy. On the other hand, Zhao et al. [29] employed the fully modified ordinary least squares (FMOLS) technique found that financial development and per capita income have a more substantial impact on REC growth in China. Moreover, the obtained results showed that trade openness and internationalization provoke the growth of the non-renewable energy consumption while decreasing the volume of REC. On the contrary, based on the panel regression analysis results for panel data of 102 countries, Jinkai et al. [30] highlighted the necessity to strengthen international trade openness to boost renewable energy development. In addition, the authors concluded that the protection of intellectual property rights is the negative factor of renewable energy adoption in the low R&D countries.
Furthermore, Salim and Shafiei [31] applied the Stochastic Impacts by Regression on Population, Affluence, and Technology (STIRPAT) model for understanding the relationship between urbanization and consumption of renewable and non-renewable energy in OECD countries during 1980–2011. The findings indicated that industrial development results in the growth of both renewable and non-renewable energy consumption. However, the growth of non-renewable energy consumption is higher by 0.114% than REC. Moreover, Granger causality showed no casual linkage between REC and demographic factors such as urbanization, total population, and population density. On the contrary, Nyiwul [32] stated that population growth increases the REC in Sub-Saharan African countries.
Recently, more scholars have paid attention to CO2 emission reduction while developing the renewable energy sector without decreasing economic growth [33,34,35]. Having applied a multivariate vector error-correction model, Ang J. [36] found a significant long-term relationship between the economic output, CO2 emissions, and energy consumption. The researcher proved that production growth increases CO2 emissions and energy consumption.
Remarkably, CO2 emissions could negatively impact human health [37] and decrease labor productivity. Therefore, there is a focus on intensifying environmental protection measures to protect human health and ensure economic performance.
Nejat et al. [38] noted that urbanization progress and human development require more energy. On the other hand, it increases greenhouse gas emissions, one of the root causes of global warming and climate change. In the study [39], the researchers checked how the renewable energy sector and CO2 emissions influence the economic performance (i.e., gross domestic product). The findings showed that due to different political and macroeconomic stability levels, the effect of renewable energy varies between the EU counties and countries that are potential candidates for EU membership. In the EU countries, the growth of REC (REC) led to economic development. At the same time, the EU potential candidates have faced limited financial recourses to support the renewable energy sector and R&D activity in this sphere. These countries require the elaboration on the effective fiscal incentives, regulatory and financial instruments to boost renewable energy.
The scientific literature covers a number of studies devoted to the effect of financial development on REC [39,40,41,42,43]. Erne et al. [44] proved the positive impact of financial development on REC in India based on the findings of the dynamic ordinary least square method. Anton and Afloarei [45] used the panel fixed effects model to analyze 28 EU countries from 1990 to 2015. Their findings have evidenced the impact of financial development on REC. The findings confirmed that energy prices, banking sector, bond, and capital markets increase the share of REC, while the influence of foreign direct investment is statistically insignificant. On the other hand, the analyzed literature provides evidence [46] on no significant causality between financial globalization and REC in the EU countries for 1995–2015.
Wang and Zhang [47] applied the Fully Modified Ordinary Least Squares approach to prove that R&D investments addressed CO2 emissions contribute to economic growth through decreasing the environmental burden and increasing the REC. Therefore, the carbon-free or low-carbon economic development requires intensification of R&D, employment of new innovative approaches, involving environmentally friendly technologies and processes, etc. [48]. Furthermore, Schall [49] noted that green investors are more eager to invest in renewable energy projects if they expect both financial and “psychic return”. Moreover, Marinescu and Fucec [50] applied an econometric approach to model two linear regression models based on panel data of five European countries for 1995–2011. The findings confirmed that economic freedom is directly proportional to investments in the renewable energy sector. In the study [51], the findings of the expanded Kaya equation for Logarithmic Mean Divisia Index of Belt and Road Initiative countries showed that energy structure positively influences REC. In contrast, the effect of energy intensity is negative.
Appiah-Otoo et al. [52] employed the instrumental variable generalized method of the moment to check the influence of crowdfunding on renewable energy generation. Based on the data of 32 countries for 2013–2018, the authors found that 1% growth of crowdfunding increases the renewable energy generation by 0.35%. Moreover, the authors stated that China demonstrates the highest effect of crowdfunding, while the United Arab Emirates is the lowest.
Several previous research studies have addressed new tendencies in the tourism [53,54] and agriculture sectors [55,56,57] emphasized the necessity to investigate new green technologies. In the case study for touristy Mediterranean countries over 1995–2014, Granger-causality’s findings [53] evidenced that tourism’s CO2 and GDP growth negatively impact the share of REC in total energy consumption. In the literature exploring the boosting drivers of renewable energy adoption in the agriculture sector, Ge et al. [58] highlighted the necessity to integrate the renewable energy policy with farms’ support schemes and diversification policies in Scotland.
At present, the intentions to increase environmental quality while overcoming income inequality are on the world agenda enhanced by the Sustainable Development Goals (SDGs) [59,60,61]. Improving ecological situations involves intensifying renewable energy such as solar, wind, biomass, and geothermal renewables [62]. Furthermore, income inequality causes different results in gaining the SDGs among the countries. Based on the estimation of CO2 emissions, GDP per capita, corruption, and trade openness of 43 developing and developed countries over 2000–2015, Uzar [63] proved that reducing income inequality and improving institutional quality positively impacts REC growth.
For a panel of twelve EU countries which are net energy importers, Marra and Colantonio [64] applied panel vector autoregressive model to estimate the relationship among REC, education, income per capita, public awareness, policy stringency, import levels, and lobbying. Their results showed that income growth positively influences CO2 emissions while negatively influencing REC. In turn, the growing energy needs require countries to lobby for energy efficiency initiatives in the industry sector [65,66,67,68]. In turn, the shares of REC are higher in the countries with higher education levels. Therefore, the authors [64] confirmed the necessity for decisive political measures to increase the REC since the public awareness of environmental issues has a slight effect without political regulations [69,70]. Moreover, Biresselioglu and Karaibrahimoglu [71] confirmed the positive influence of the pro-environmental orientation of European governments on REC growth in these countries.
Another strand of the literature revealed the linkage between political and institutional quality and REC [72,73,74]. In another study [75], the authors built the panel threshold model to determine the impact of democratic institutions’ quality on REC based on data of 97 countries with different levels of democracy. The findings showed that economic growth leads to greater REC in more democratic countries. On the contrary, the less democratic countries ensure economic development due to consuming more non-renewable energy. Moreover, the REC depends less on the growth of oil prices in more democratic countries. For the case of three Latin American, five European, and eight Asian countries, Apergis and Eleftheriou [76] employed the cutting-edge panel econometrics to check the linkages between REC, political and institutional determinants over 1995–2011. Considering their findings, all investigated variables positively influence REC in the short- and long-term in the analyzed regions.
On the other side, Uzar [77] applied the ARDL-PMG method to examine how institutional and political quality (including law and order, democratic accountability, bureaucratic quality, corruption, and government stability) in 38 developed and developing countries influence REC. In turn, the findings showed the positive influence of political quality on REC, while economic growth leads to the growth of fossil energy consumption.
The econometric analysis [78] of the 1990–2008 panel dataset of US states and EU countries stated that not all renewable energy policy instruments contribute to renewable energy development. The obtained results showed that the significant factors for renewable energy development were tender, tax, and feed-in tariffs, while the quota had no significant effect. The same findings are supported in the studies [79,80] on the role of the tax system in gaining energy and economic independence.
Some previous studies analyzed how democracy regime types (hybrid and authoritarian regimes, full democracy, and flawed democracy) influence the REC. Applied Fully modified ordinary least squares (FMOLS) and Dynamic ordinary least squares (DOLS) panel cointegration techniques, Lyulyov et al. [81] found that growth of REC is higher in the countries with the hybrid regime. At the same time, Yahya and Rafiq [82] noted that economies with full and flawed democracies have better public, industrial, trade, and tax policies that contribute to REC growth.
Several existing studies on factors of REC considered green social awareness [83]. For the case of Thailand, Wall et al. [84] proved that green awareness, environmental concern, and beliefs about renewable energy benefits are the triggers for intensifying REC among society. In the study [85], the findings of the partial least square (PLS) method showed that green beliefs and knowledge of consumers have an insignificant impact on REC among generation Y. At the same time, the growing environmental concern and green benefits increase their interest in renewable energy. Ulkhaq [86] stated that promoting renewable energy would be successful if society was aware of its benefits. This study involved the logistic regression approach to determine the drivers of the Indonesian consumers’ willingness to install renewable energy sources. The findings showed that income per month, education, awareness of renewable energy benefits, employment status, the average electricity price, the concern of energy tax deduction, and the cost of non-renewable energy have a positive impact on the growth of REC.
Based on Group 20’s renewable energy industry analysis, Fang et al. [87] developed the revised Diamond Model under Porter’s theory to estimate the main driving forces and industry competitive advantages for developing renewable energy worldwide. Remarkably, Lee [88] concluded that public and private investments are crucial in developing the renewable energy sector in countries with leading economies.
To identify the factors most influencing REC and determine the most usable approaches in assessing their influence, a bibliometric analysis was conducted. A total of 470 most relevant publications presented in the Scopus database were reviewed. The date range is from January 2000 to October 2021. To generate the sample, the combinations of keywords “renewable energy consumption”, “factors”, “determinants”, and “influence” were used with boolean operators “OR” and “AND”. The search was conducted in “Article title, Abstract, Keywords”.

2.2. Study Area Selection

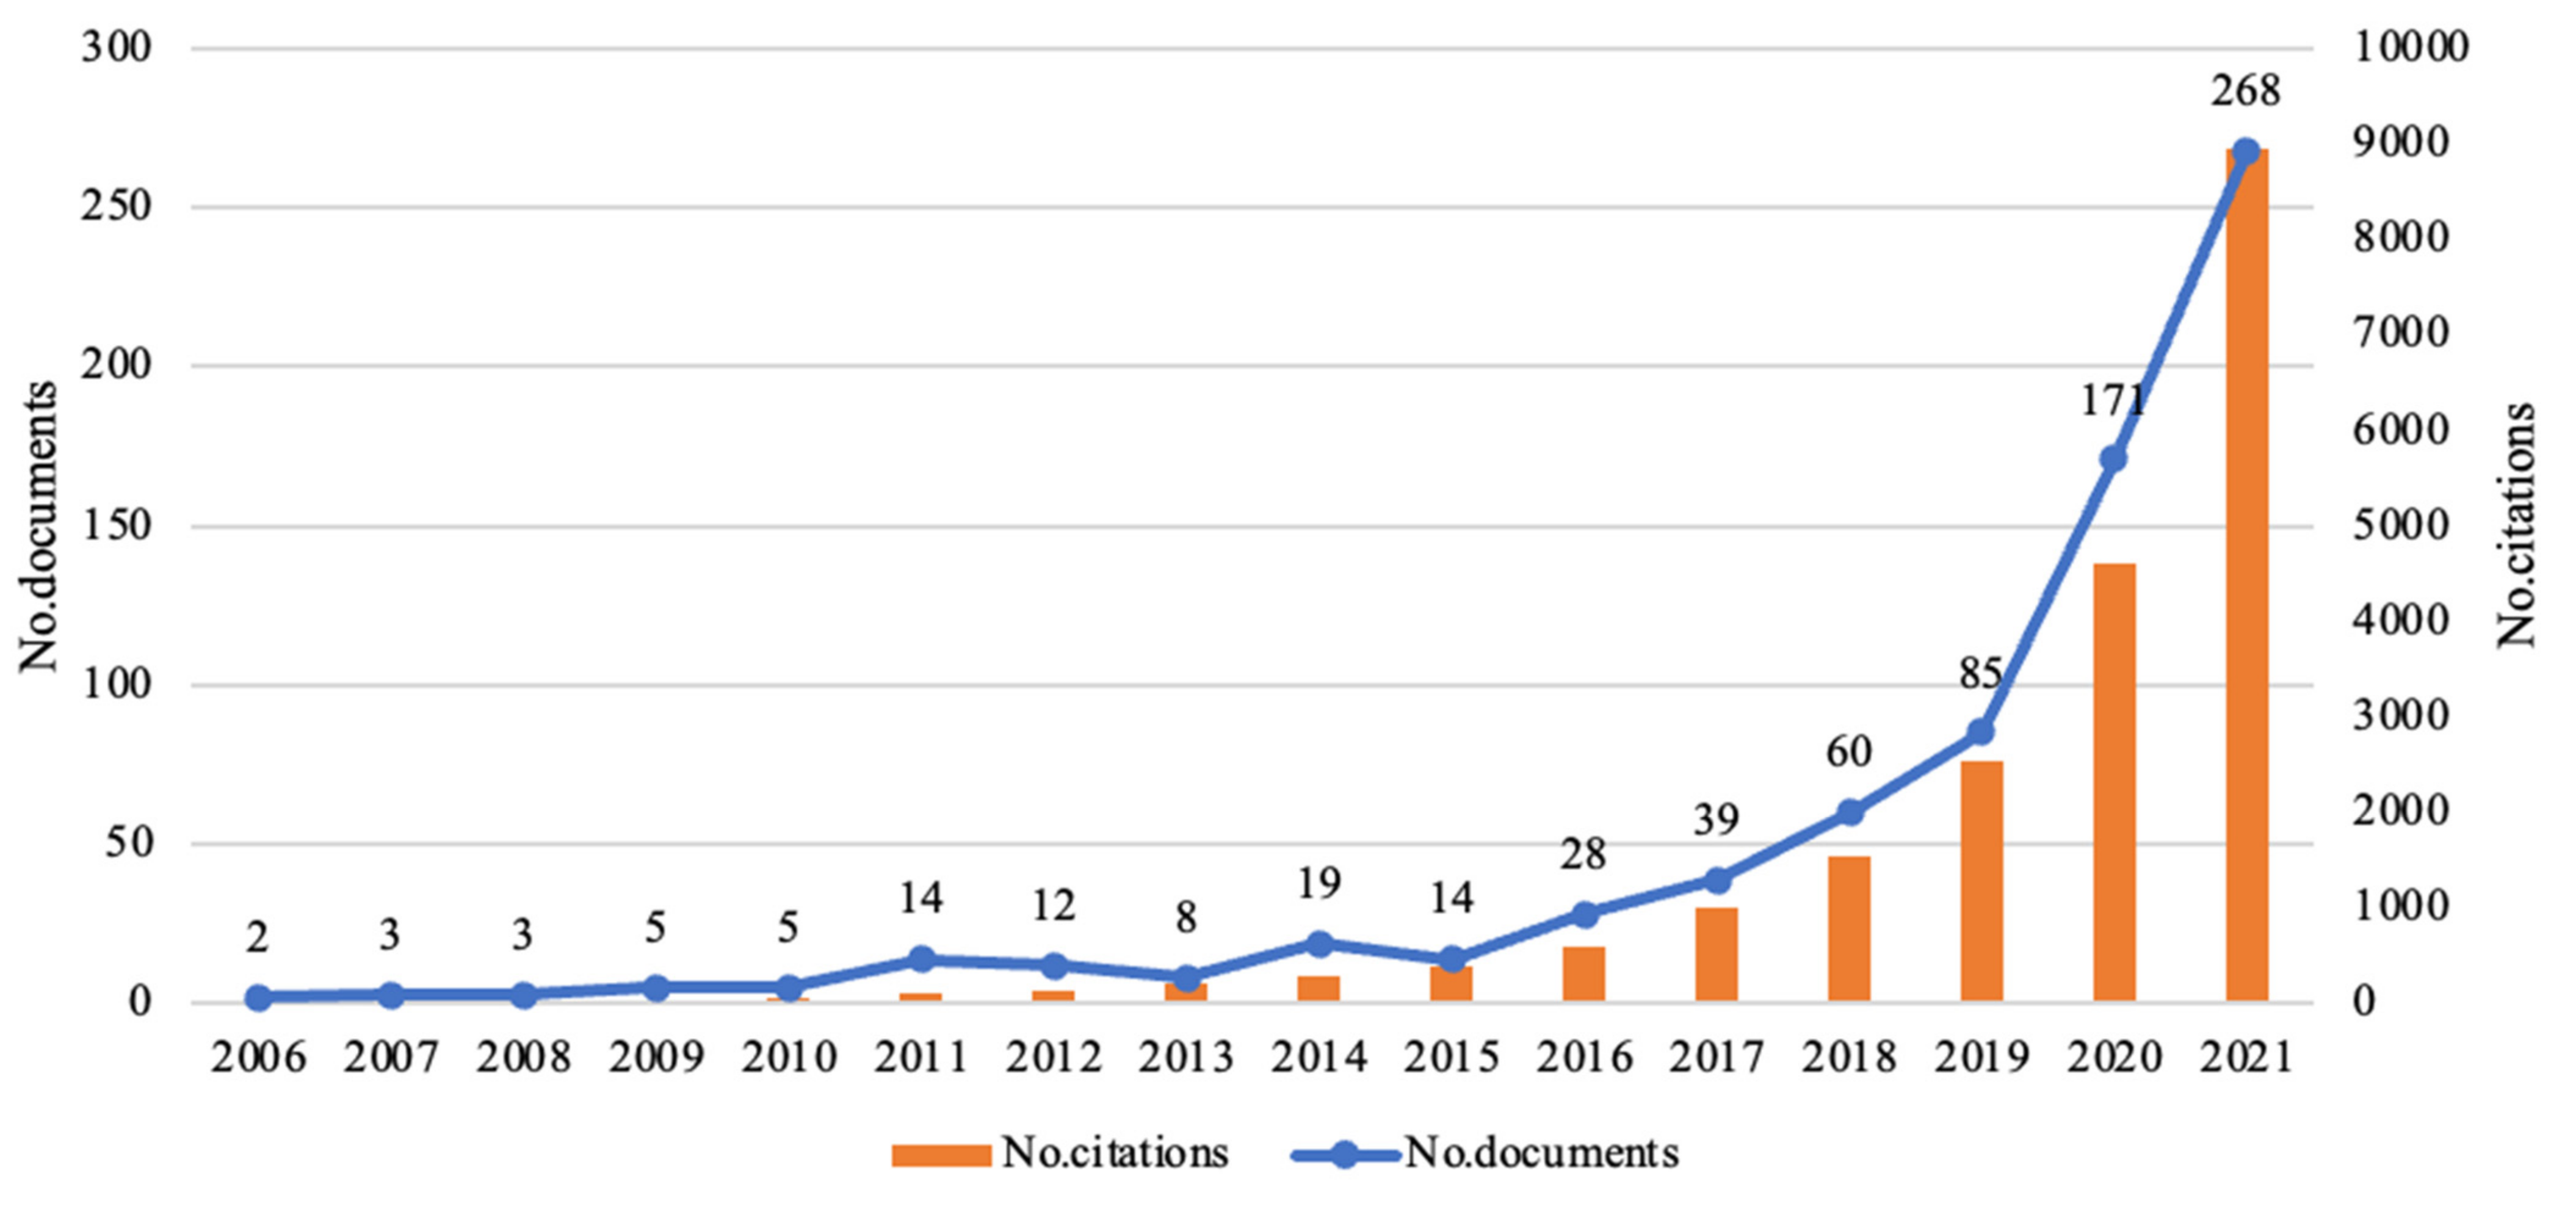
Analysis of the searched results using the Scopus Toolkit showed that REC concerns received two main stimuli to boost in 2016 (after the Paris climate agreement execution in 2015) and 2020 (after the European Green Deal declaration in 2019). The number of analyzed publications increased by more than 19 times. The findings of citation analysis showed the number of cited documents concerning REC impact constantly grows. As of October 2021, the presented publications were cited 8949 times. It is 12 times more than the number of publications. Figure 4 shows that the European Green Deal declaration in 2019 was a powerful kick in activating the research interest in this direction.
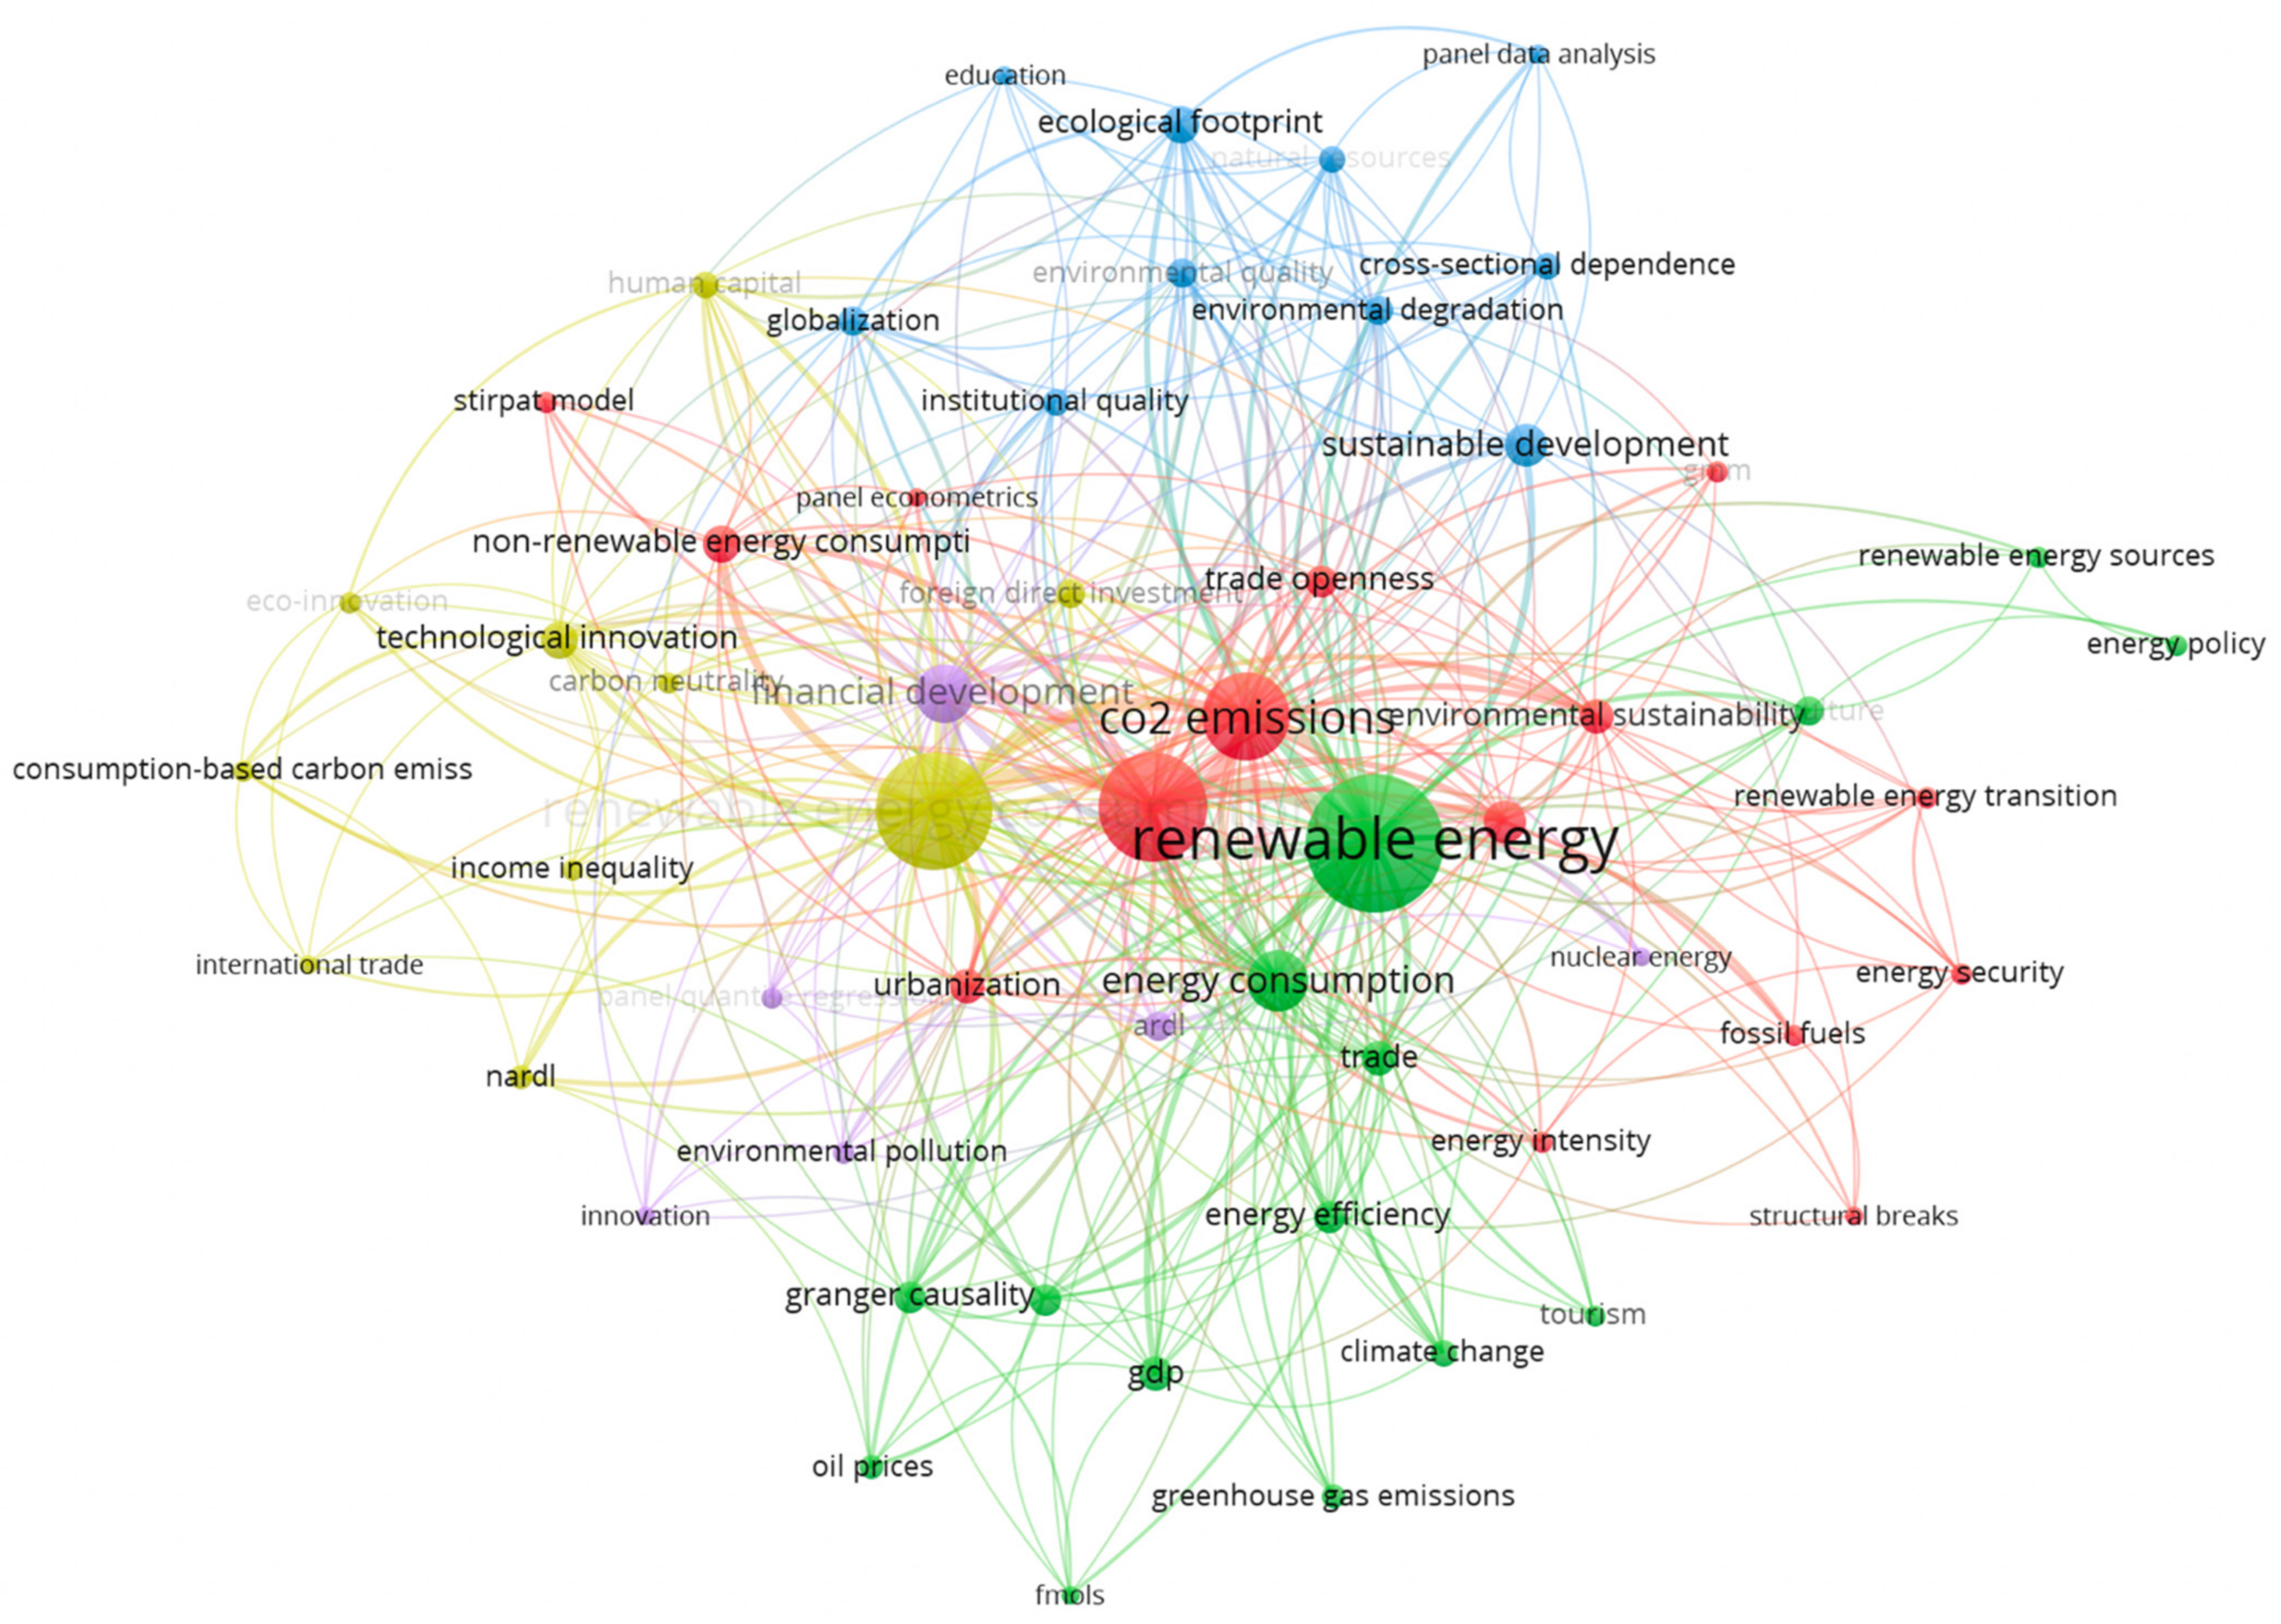
Then, the VOSviewer text mining functionality was applied to visualize the main determinants of REC in the studies gained from a body of analyzed Scopus literature for 2000–2021 (October). Figure 5 visualizes four clusters with a total link of 224 and total link strength of 608. The in-depth analyses of link strengths allow determining the factors influencing the REC and analytical procedures used to its estimation.
The first biggest (red) cluster primarily addresses the concept of renewable energy consumption (occurrences—172, links—47, total link strength—258) under environmental degradation, foreign direct investments, globalization, institutional quality, international trade, carbon neutrality, human capital, etc. The methodology is presented with approaches of NARLD (Nonlinear Autoregressive Distributed Lag) and the Generalized Method of Moments (GMM).
The second cluster (green) focused on the environmental pressure from economic activity visualized with items of CO2 emissions (occurrences—97, links—42, total link strength—153), financial development, non-renewable energy consumption, urbanization, energy policy, nuclear energy, agriculture, etc. The applied methodological approaches were the Autoregressive Distributed Lag Model (ARDL), the panel quantile regression, and the STIRPAT model.
The third cluster (blue) focused on energy consumption (occurrences—50, links—29, total link strength—67) in the view of energy efficiency, GDP, climate change, greenhouse gas emissions, oil prices, tourism, trade, etc. The methodology presented with the Fully Modified Least Square (FMOLS), Granger causality, panel cointegration, etc.
The fourth cluster (yellow) is formed around the concept of economic growth (occurrences—154, links—45, total link strength—227) in the view of energy intensity, energy security, environmental quality, environmental sustainability, fossil fuels, renewable energy transition, trade openness, education, etc. The most usable methodological approaches were structural breaks.
Table 1 demonstrates the most significant co-occurrence keywords in the general scope of literature concerning the determinants of REC. Therefore, it could be assumed that the main drivers of REC were considered to be “economic growth”, “CO2 emissions”, “financial development”, “energy consumption”, “trade”, “urbanization”, “GDP”, “human capital”, ”energy intensity”, and “foreign direct investments”.
Therefore, following the studies [89,90], the main drivers of REC are GDP and CO2 emissions. Applied the panel cointegration techniques [89], the authors stated that the growth of GDP and CO2 per capita increases renewable energy consumption. However, the Chinese researchers proved that CO2 emission impact on REC differs among the regions [91]. Besides, this study involved the indicators of imports and exports of goods and services. The findings showed the weak impact of imports and the significant influence of export on REC. The same consumption is presented in [92,93]. Therefore, imports and exports of goods and services are other bound determinants of REC.
The findings of the study [94] indicated the impact of the gross capital formation, CO2 emissions, total labor force on renewable energy. The authors noted that the negative influence of CO2 emissions was mostly coming from industry. Apergis and Payne [95], employing panel error correction model, found the bidirectional causality between REC, gross fixed capital formation, GDP, and the labor force in 80 countries during 1990–2007. Therefore, gross capital formation and labor force are also decisive factors for REC.
Furthermore, several studies indicated the role of industrialization [96,97] in enhancing renewable energy. Thus, it is appropriate to apply the variables of energy consumption in industry, industry, and manufacturing to check their influence on REC. The findings [92,98] showed the innovation and R&D positively affect REC. However, in the study [99], the obtained results of the random effect model showed no statistically significant relationship between foreign direct investment and REC in the Eastern European and Central Asian countries during 1996–2018. Moreover, the regression analysis results of the panel data from the Baltic-Black Sea region countries during 1999–2018 [100] showed that the foreign direct investment inflow positively affects the ecological situation. At the same time, the strict standard environmental legislation and growth of greenhouse gas emissions in the analyzed countries are the main barriers in attracting foreign direct investments. Thus, it drives us to consider the impact of foreign direct investment in ensuring REC.
Applied the dynamic panel estimation approach for panel data from sub-Saharan African countries, Kalu et al. [101] confirmed the strong relationships among value added in industry, energy consumption, and economic advancement. Moreover, Sineviciene et al. [102] determined that the variables such as share of industry, CO2 emission per capita, and fixed capital are the main drivers of energy-efficient development in the Eastern European countries from 1996 to 2013. Kirikkaleli and Adebayo [103] found that REC contributed to decreasing the consumption-based carbon dioxide emissions in India. In addition, Samusevych et al. [104,105] confirmed that gross fixed capital formation, industry value-added, CO2 intensity, GDP per capita, and CO2 emissions are the leading energy and economic security triggers in the six Eastern European countries.
Therefore, the vast range of factors (depending on the country) that influence renewable energy consumption actualizes the identification of the most significant factors considering the homogeneity of EU countries.

3. Materials and Methods

3.1. Sample Selection and Variable Description

This study involved the annual data acquired from OECD.Stat (Organisation for Economic Cooperation and Development) and World Bank Open Data (World Bank) for 2000–2018 accessed on 20 September 2021. The analysis of all European countries and Ukraine was initially assumed. Still, after the initial analysis, it was decided to select the following countries: Denmark, Norway, Finland, France, and Sweden (as the countries with the highest performance across the SDGs [106]); Poland, Czech Republic, Hungary, and Slovak Republic (the Visegrad countries with similar economic and institutional background following the comprehensive approach in gaining the SDGs); Ukraine (as a potential candidate to EU signed the EU-Ukraine Association Agreement in 2014). The data collection and pre-processing were conducted using the Microsoft Office Excel toolkit, while further econometric analysis used the EViews 12 SV and Gretl 2021c software packages.
This study considers renewable energy consumption (% of total final energy consumption) as a dependent variable. Based on the in-depth bibliometric analysis, the explanatory variables were chosen as follows: CO2 emissions (metric tons per capita); GDP per capita (current US $); imports and exports of goods and services (% of GDP); foreign direct investment, net inflows (BoP, current US $); energy consumption in industry (% total energy consumption); labor force (total); industry (including construction), value added (% of GDP); manufacturing, value added (% of GDP); gross capital formation (% of GDP); value-added in industry, % of total value-added; production-based CO2 intensity, energy-related CO2 per capita; production-based CO2 productivity, GDP per unit of energy-related CO2 emissions.
Table 2 demonstrates the summary of the descriptive statistics for all variables employed within this empirical study. It stands to note that each variable has the same number of observations (n = 190). Thus, the panel data set is balanced. For the share of REC, it ranges from 0.991 to 61.111 % of total final energy consumption. At the same time, it has a mean of 21.38% with a standard deviation of 18.09%, indicating the REC data is widely spread among the observations.

3.2. Model

The primary purpose of this investigation is to detect the main determinants of REC that vary over time utilizing the panel data regression models. The choice of panel data technique is motivated by its superiority over the cross-section and time-series data in applying all obtainable observations for successive periods of time [107].
Following the most relevant papers on drivers of renewable energy development [45,108], the REC model pointing out the evolution of the dependent variable with respect to all independent variables are specified as follows:
R E C = f CO 2 ,   G D P ,   I G S ,   E G S ,   I N D ,   M A N ,   F D I ,   T L F ,   G C F ,   V A I ,   E C I ,   P C I ,   P C P
Following the paper [107], the essential panel data advantage is minimizing bias in results. Thus, to provide reliable and competent estimates of α 0 (an unknown intercept) and β 1 n (the coefficients of explanatory variables), this study involved the panel data analysis through the fixed effects (or least squares dummy variable), random effect (or error components model) techniques [107,108]. To ensure more robustness and validity of results, the techniques of the generalized method of movement (GMM) were applied [105]. Remarkably, GMM is good to apply to deal with endogeneity.
For determining the most suitable model (fixed or random effects), the statistical relevance among random intercepts and the explanatory variables were checked using the Hausman test. Thus, following [108,109], the fixed-effects model should be chosen if the random intercepts and explanatory variables are statistically relevant. In the opposite case, the random effect model is preferable.
As the study [110] states, the fixed-effects method allows overcoming the omitted variable bias. This method was applied to estimate the net effect of employed variables on the REC, avoiding the time-invariant characteristics and correlation between outcome variable and entity’s error term.
Primarily, the panel data fixed-effects regression equation of the REC model (1) could be expressed as follows (2):
Y i t = α 0 + β 1 X i t + + β i X i t + ε i t
where Y i t denotes the REC (outcome variable); X i t —the independent variables (CO2, GDP, IGS, EGS, IND, MAN, FDI, TLF, GCF, VAI, ECI, PCI, PCP); i—the subscript of entity (i = 1,…,10); t—time (t = 2000,…,2018); α 0 —an unknown intercept for each entity; β 1 n —the coefficient of explanatory variables; ε i t —the error terms.
Due to the nature of the employed variables, they were transformed into a natural logarithmic form to avoid the difficulties associated with the dynamic properties of the data series [111]. Thus, the regression Equation (2) after the conversion of all variables into logarithmic form is specified as follows (3):
R E C i t = α 0 + β 1 I n X i t + + β i I n X i t + ε i t
Onward, to check whether some differences across entities impact the REC, the relationships among REC and explanatory variables were tested using the random effect technique specified by Equation (4) (in logarithmic form). Remarkably, the main advantage of this method is including the time-invariant variables [108].
R E C i t = α + β I n X i t + μ i t + ε i t
where Y i t denotes the REC (outcome variable); X i t —the independent variables (CO2, GDP, IGS, EGS, IND, MAN, FDI, TLF, GCF, VAI, ECI, PCI, PCP); i—the subscript of entity (i = 1,…,10); t—time (t = 2000,…,2018); α —an unknown intercept; β —the coefficient of explanatory variables; ε i t —the error terms; μ i t —the random heterogeneity specific to the i-observation (constant through time).
Finally, the Hausman test (5) was employed to test if the unique errors are correlated with regressors. The decision on which model is more appropriate was made based on the findings [108]:
p = ( β R E β F E ) × ( F E R E ) 1 × ( β R E β F E )
where β R E —the coefficient estimates from random effects; β F E —the coefficient estimates from the fixed effects; F E —covariance matrix of the coefficients estimated from fixed effects estimator; R E —covariance matrix of the coefficients estimated from random effects estimator.
Therefore, the null hypothesis could be confirmed if the Hausman test result is significant (p > 0.05). In turn, the random model is preferred. On the contrary, the insignificant value of the Hausman test (p < 0.05) proves the alternative hypothesis which indicates that the fixed model is appropriate.
Further, following the methodology proposed by Javeed S.A. et al. [112,113,114], it was decided to employ the weighted least square (WLS) statistical method to obtain more robust results. The WLS method was used to overcome the problems of autocorrelation and heteroskedasticity from the panel data. The hypothesis is valid, while WLS estimators are unbiased, efficient, and consistent [115] in the case of present heteroskedasticity and known variances. Thus, the robustness test by the WLS method could be expressed as follows (6).
β ^ W L S = arg m i n i = 1 n i * 2
where β ^ W L S —the weighted least squares estimate, ϵ —residuals.

3.3. Estimation Technique

In order to ensure the reliability of the findings, this study confines the rigorous process of panel data analysis, which is divided into several main stages as follows.
Following the procedure described in the study [112], at the first stage of panel regression analysis, all variables (1) were estimated on the mean-reversion (or stationarity) using the instrumentality of panel unit root tests. Thus, the Levin, Lin, and Chu method was applied to assume the common unit root process. Im, Pesaran, Shin W-Stat, ADF-Fisher Chi-square, and PP-Fisher Chi-square methods estimated individual unit root processes. With reference to the study [110], the general equation of panel unit tests is specified as follows (7):
y i t = ρ i y i t 1 + j = 1 p i φ i j ε i t j + δ i X i t + u i t
where ρ i —the number of lags in ADF regression; X i t —the independent variables of Equation (3); ε i t —the stationary error terms; i—the subscript of entity (i = 1,…, 10); u i t —stationary process.
The null hypothesis for testing nonstationarity [113] means:
H o :   ρ i = O   for each i in the panel is stationary around a deterministic level; against the alternative hypothesis (some, but not all, i have unit roots):
H 1 :   p i < 0   for   i = 1 , , N 1   p i = 0   for   i = N 1 + 1 , , N     with   0   <   N 1     N
Further, this study checked the presence of serial correlation. At this stage, the correlation analysis by Pearson’s coefficient (R) [116] was applied to determine the highly correlated variables. Based on the calculated coefficients of correlation (R), the decision on the suitability of variables was made. Thus, the correlation among the variables by Pearson’s coefficient was calculated under Equation (9) as specified below:
R = E X E X Y E Y v a r X v a r Y  
where E(X) and E(Y)—the means of dependent and independent variables, respectively; var(X) and var(Y)—the variance of X and Y, respectively.
Noteworthy here to mention that if:
0 < R < 0.2→the correlation between variables is weak or they are not correlated;
0.2 < R < 0.5→the correlation between variables is low;
0.5 < R < 0.7→the correlation between variables is average;
0.7 < R < 0.9→the correlation between variables is strong;
0.7 < R < 0.9→the correlation between variables is highly strong;
R < 0→the correlation between variables is negative;
R ~ (−1)→the correlation between variables is highly negative.

4. Results

4.1. Stationary Test

Before modeling, all variables were tested on stationarity by means of the unit root test by the methods of Levin, Lin and Chu (LLC), Im, Pesaran, Shin W-Stat (IPS), ADF-Fisher Chi-square (ADF), and PP-Fisher Chi-square (PP). Table 3 specifies that all variables have unit roots in level. Therefore, the test for unit roots in the first difference was applied to avoid spurious regression. Thus, all exogenous variables for the analyzed countries became stationary.

4.2. Correlation

In the next step, the correlation between the variables was checked. The main driver behind the correlation analysis is to estimate the hypothetical direction of causality between employed variables. Table 4 shows the findings from correlation analysis among the variables that allow determining the dependency (degree and direction of association) among them. Thus, REC shows a negative correlation with IMP (average), IND (low), MNF (low), FDI (low), LFT (average), GCF (low), and VAI (low). On the other hand, the results show that EXP is highly correlated with IMP (0.93), PCP with GDP (0.84) and REC (0.80), VAI with IND (0.99). Therefore, these variables were excluded to avoid multicollinearity.
A high positive level of correlation is observed between REC and GDP (0.89). However, the study [110] suggests that economic growth plays an essential role in REC. Thus, the GDP variable was applied within the panel data regression models.
Thus, for the econometric model estimation, REC (renewable energy consumption, % of total final energy consumption) was applied as the endogenous variable, influenced by the following exogenous variables (regressors):
  • CO2→CO2 emissions (metric tons per capita);
  • GDP→GDP per capita (current US $);
  • MNF→Manufacturing, value added (% of GDP);
  • FDI→Foreign direct investment, net inflows (BoP, current US $);
  • LFT→Labor force, total;
  • GCF→Gross capital formation (% of GDP);
  • ECI→Energy consumption in industry, % total energy consumption;
  • PCI→Production-based CO2 intensity, energy-related CO2 per capita.
Further, the analytical procedures led to the use of the Hausman test to the panel data from all selected countries in the years 2000–2018.

4.3. Results of the Fixed-Effects Model

Since the findings from the stationarity test showed that all variables are stationary at the first difference (Table 3), it is possible to conduct the regression analysis. According to the panel regression results for the fixed effects model, the R-squared value of 0.941 reflects a good fitness of the fixed-effects model. Thus, all exogenous variables could explain about 94.1% variation in REC. In turn, Prob (F-statistic) of 0.000 depicts that overall panel regressions are meaningful (F < 0.05), while all the coefficients are different than zero.
The output of panel data fixed-effects regression (Table 5) demonstrates the positive relationship among the shares of renewable energy consumption (REC) and energy consumption in the industry (ECI), CO2 emissions (CO2), and GDP per capita (GDP). That means a 1% rise in CO2 emissions per capita results in the 0.16% growth of REC. In turn, the 1% rise in GDP per capita leads to the growth of REC by 0.69%. When the industry’s energy consumption share (ECI) increases by 1%, REC rises by 0.66%.
From the panel regression results, the total labor force (LFT) is inversely related to REC. Thus, a 1% increase in the total labor force (LFT) leads to a 0.4% decrease in REC. Besides, the same goes for gross capital formation (GCF) and production-based CO2 intensity (PCI). If the share of gross capital formation in GDP (GCF) increases by 1%, REC decreases by 1.19%. At the same time, the 1% rise of production-based CO2 intensity (PCI) causes the 0.49% decrease in REC.

4.4. Results of the Random-Effects Model

Further, this study presents the regression results from the random-effects model. The results (Table 6) indicate the good fitness of the random-effects model since the R-squared value is 0.845. In turn, Prob (F-statistic) of 0.000 states the collective significance (F < 0.05) among all employed variables.
From the regression results of the random-effects model, Table 6 demonstrates the positive relationship among renewable energy consumption (REC), energy consumption in the industry (ECI), value-added from manufacturing (MNF), CO2 emissions (CO2), and GDP per capita (GDP). Thus, the 1% rise in CO2 emissions per capita (CO2) results in the 0.19% growth of REC. In turn, the 1% increase in GDP per capita (GDP) and value-added from manufacturing (MNF) leads to the growth of REC by 0.51 and 0.58%, respectively.
In a similar vein to the results of fixed-effects regression (Figure 6), the total labor force (LFT), the gross capital formation (GCF), and production-based CO2 intensity (PCI) are inversely related to REC. However, the 1% increase in the total labor force (LFT), gross capital formation in GDP (GCF), and production-based CO2 intensity (PCI) result in decreasing REC by 0.59, 0.67 and 1.47%, respectively. Figure 6 presents the comparison of findings by both methods.

4.5. Hausman Test

The Hausman test was employed in the regression model investigating REC in the selected European countries for 2000–2018 concerning the exogenous variables. Table 7 presents the obtained results.
The null hypothesis could be rejected (p > 0.05) since the obtained result of the correlated random effects-Hausman test is insignificant (p = 0.0029). Therefore, the findings proved the alternative hypothesis which gives strong evidence that the fixed model is appropriate for estimation the net effect of exogenous variables on the REC.

4.6. Results of the Generalized Method of Moments Model

According to the panel regression results for the GMM model, the R-squared value of 0.902 means the good fitness of the GMM model. Therefore, the exogenous variables could explain about 90.2% variation in REC. Also, Prob (F-statistic) of 0.000 indicates that overall panel regressions are meaningful (F < 0.05). Therefore, all coefficients are different from zero.
Table 8 demonstrates the results of the GMM test. Thus, similarly to the findings by the fixed- and random-effects models, the GMM regression results showed the positive relationships among renewable energy consumption (REC), CO2 emissions (CO2), and GDP per capita (GDP). Thus, a 1% rise in CO2 emissions per capita (CO2) results in the 1.73% growth of REC. In turn, if GDP per capita (GDP) increases by 1%, REC could increase by 0.63%. On the other hand, there are negative relationships among REC, the total labor force (LFT), the gross capital formation (GCF), and energy consumption in the industry (ECI). Thus, the 1% growth of LFT, GCF, and ECI reduces REC by 0.47, 1.01 and 0.39%, respectively.

4.7. Results of the Robustness Test

This study applied the weighted least square (WLS) statistical method to obtain more robust results. In line with [114], the WLS method allows overcoming the problems of autocorrelation and heteroskedasticity from the panel data. Table 9 demonstrates the coefficients estimated by the WLS techniques. The results of the robustness test confirmed the previous panel regression results.
Thus, the coefficient value of renewable energy consumption (REC) and CO2 emission (CO2) per capita is 0.164 significant at 1% level, renewable energy consumption (REC) and GDP per capita—0.691, renewable energy consumption (REC) and energy consumption in the industry (ECI)—0.656. Therefore, the findings of the robustness test with the WLS method confirmed the positive statistically significant relationship between renewable energy consumption and the above-noted variables.
On the other hand, the coefficient value of renewable energy consumption (REC) and the total labor force (LFT), the gross capital formation (GCF), production-based CO2 intensity (PCI) is −0.398, −1.187, −0.492 with 1% significant level. Thus, these results of the robustness test confirmed the negative statistically significant association between renewable energy consumption and the variable of the total labor force (TLF), the gross capital formation (GCF), and production-based CO2 intensity (PCI).

5. Discussion

The current energy crisis, uneven economic development, depletion of fossil fuels, and climate change provoke the world’s public interest in developing renewable energy capacity. Moreover, the findings showed that the developed countries are the main initiators of renewable energy development [117,118,119,120]. In turn, the systematization of scientific sources indicated that progress in renewable energy development depends on many factors such as economic development [13,38,93], institutional quality [76,77], political stability [121], culture [122], etc. Therefore, this study addressed the determination of the factors driving REC in European countries.
In line with the research goal, the results showed that sustainable economic development positively affects REC in the selected European countries. Furthermore, the findings are confirmed by both fixed- and random-effects methods. However, the findings from the correlated random effects-Hausman test indicated that the fixed-effects model is appropriate for assessing the net effect of exogenous variables on REC under this study’s limitations.
Therefore, the results of panel data fixed-effects regression revealed that real GDP per capita and CO2 emissions per capita are the main driving forces for the growth of REC. Thus, REC increases by 0.69% if real GDP per capita increases by 1% in the analyzed European countries. At the same time, the growth of CO2 emissions per capita results in 0.16% of REC.
It stands to note that a similar effect was mentioned in the previous studies [123,124,125]. Herewith, Sadorsky [89] found that the 1% growth of real GDP per person results in the 8.44% increase in REC in the G7 countries (Canada, France, Germany, Italy, Japan, the United Kingdom, and the United States). Remarkably, these countries are the most economically developed. The 1% rise in CO2 emissions per capita in these countries increases REC by 5.23%. On the other hand, Baye et al. [97] stated that 1% real GDP per capita growth leads to the 0.32% rise in REC in African countries. Moutinho et al. [126] stated that countries could economically thrive without adverse environmental change due to developing renewable energy capacity and reducing the use of fossil fuels or switching to less polluting ones.
Although the findings of our study showed that the impact of foreign direct investments on REC is insignificant for the European countries, the findings of several studies [127,128] argue out of it. Having compared the renewable energy development in the countries before and after entering the EU, the results of additive decomposition for the EU members [127] showed that the renewable energy progression rate after accession to the EU is higher because of the growth of the foreign direct investments, attracting lower-cost labor, etc. Therefore, it allows arguing that the progress in renewable energy depends on national economic advancement.
These assumptions are in line with many papers [65,93,129]. Omri and Nguyen [93] stated that economic development is the critical driving force for REC growth. The findings of two-step sys-GMM panel estimation regression for 64 countries classified into three groups by income showed that 1% growth of GDP per capita results in the higher rise of REC (0.199%) in the high-income countries (mostly the European countries), while in the middle-income countries—by 0.169%, and in the low-income (mostly African countries) countries—by 0.149%. However, the findings [93] showed that the impact of 1% growth of CO2 emissions per capita results in the higher rise of REC in the low-income countries than the middle-income. On the contrary, Baye et al. [130] demonstrated that CO2 emissions impact REC per capita in the Sub-Saharan African countries is negative and insignificant. Given the findings from the influence of other variables (such as trade openness, oil prices, income per capita, climatic stress, and the others), the authors concluded that the growth of CO2 emission by one unit reduces the energy generated from renewable sources by 0.4% primarily because of energy inefficiency and low concern about the environment.
Based on the above mentioned, it stands to emphasize that since the REC promotion is on the agenda of the European countries [131,132,133], these countries contribute more to developing renewable energy sources, promoting new renewable technologies in the industry, increasing public green awareness, etc. In turn, the lack of stimulation measures and funding in the renewable energy sector are the main barriers to renewable energy development in emerging countries [134].
From the panel fixed-effects regression results, the industry’s 1% energy consumption growth increases renewable energy by 0.66%. This output is consistent with the studies [27,96]. However, Shahzad et al. specified that industrialization positively impacts REC in economically developed countries. On the contrary, this effect is opposite for the emerging countries (Brazil, China, India, Indonesia, Mexico, Russia, and Turkey). Remarkably, the Chinese industrial sector is the biggest CO2 polluter [135] that provokes environmental degradation at the global level. Given this, many scientists [136,137] emphasized that further industrial development requires decreasing its carbon intensity due to exploring more sustainable energy sources and energy-efficient technologies while increasing investments in renewable energy development.
Therefore, it could be concluded that the policymakers should elaborate on the appropriate policies and regulations to motivate the industrial sector to implement green technologies to reduce non-renewable energy consumption and decrease the environmental burden.
Turning to the fixed-effects regression results, inverse relationships were found among the REC, the total labor force, gross capital formation, and production-based CO2 intensity. The coefficients for these variables are negative but statistically significant at the 1% level for the dependent variable. Thus, the findings of our study indicated that the total labor force decreases the REC by 0.04%, the share of gross capital formation in GDP—by 1.19%, and production-based CO2 intensity—by 0.49%. Similar conclusions were summed up in the studies [94,95]. However, these results contrast with the findings of [138]. Having applied the Granger causality analysis, Solaymani [138] decided that labor force and gross fixed capital formation affect REC in Iran. Likewise, Apergis and Payne [139] confirmed the positive statically significant relationship between REC and gross capital formation in the short run. However, the researchers demonstrated the statistically insignificant influence of the labor force on REC for 25 developed and 55 developing countries. In line with the paper [140,141], the effect of the labor force and gross fixed capital formation on REC was found to be positive and statistically significant at the 1% level of significance in the Oil Exporting Countries of the Middle East and North Africa region from 1980 to 2012.
It is noteworthy here that the literature shows the labor force effect on REC could depend on the country’s democratic regime. Thus, the findings of the previous study [81] showed the impact of the total labor force growth on the REC is higher in the countries with hybrid regimes that are characterized by the government impact on the political opposition, corruption, some electoral frauds, corruption (Ukraine, Montenegro, and Turkey). In turn, this impact is insignificant in the countries with full democracy (Spain, Finland, and Denmark).

6. Conclusions and Policy Implications

6.1. Conclusions

The present investigation contributes to the existing literature by providing new empirical evidence on the determinants influencing renewable energy consumption in the European countries during 2000–2018. To empirically identify the main driving forces of renewable energy consumption, this study applied the fixed- and random-effect regressions, and GMM test.
The Hausman test was used in order to detect the most suitable model (between the fixed- and random-effects models) and to test if the unique errors are correlated with regressors. In line with the above, the insignificant value of the Hausman test (p < 0.05) proved the alternative hypothesis. Thus, the fixed model was found to be appropriate.
Further, the findings from fixed-effects regression indicated that GDP per capita and CO2 emissions per capita have a positive and statistically significant influence on the growth of renewable energy consumption (p-value = 0.01). Thus, the 1% growth of CO2 emissions per capita results in the 0.16% growth of renewable energy consumption. In comparison, the 1% rise in GDP per capita leads to the growth of renewable energy consumption by 0.69%. Besides this, if the industry’s energy consumption share increases by 1%, renewable energy consumption rises by 0.66%. On the other hand, a 1% increase in the total labor force leads to a 0.4% decrease in renewable energy consumption. If the share of gross capital formation in GDP increases by 1%, renewable energy consumption decreases by 1.19%. At the same time, the 1% rise in production-based CO2 intensity causes the 0.49% decrease in renewable energy consumption.
Further, this study used more rigorous estimation by the GMM technique. The GMM regression results showed the positive statistically significant influence (p-value = 0.01) of GDP per capita and CO2 emissions per capita on renewable energy consumption in the European countries. Thus, if CO2 emissions increase by 1%, renewable energy consumption rises by 1.73%, while GDP per capita growth by 1% results in the 0.63% rise in renewable energy consumption. The impact of the total labor force, gross capital formation, and energy consumption in the industry are statistically significant while negative. Thus, the 1% growth of total labor force, gross capital formation, and energy consumption in the industry in the European countries lead to a reduction of renewable energy consumption by 0.47, 1.01 and 0.39%, respectively.
The robustness test by the WLS method was used to overcome the problems of autocorrelation and heteroskedasticity from the panel data. The findings of the robustness test confirmed the previous panel regression results.

6.2. Policy Implications

Given the above, the obtained empirical results could give some insights for developing the economically justified and environmentally friendly national policy that is crucial for ensuring energy security under sustainable development principles.
According to the findings, GDP per capita is the primary driver of renewable energy consumption in European countries. Thus, the above indicates that the governments should focus more on their policies to increase economic development. Given the statistical data [17] show that transport, industry, and household sectors consume the biggest share of energy, it is essential to implement measures to reduce CO2 emissions in these sectors and promote modern technologies for renewable energy production.
In line with certain findings [139], sustainable economic development requires attracting public and private green investments to develop energy-saving and efficient projects, support environmental and sustainable initiatives, etc. In this case, the governments should share and adopt the best practices in developing the system of green financial instruments such as green bonds, green derivatives, carbon market instruments, etc.
Furthermore, governments should pay more attention to increasing green awareness among society. Thus, it is recommended to encourage green initiatives to decline dependence on traditional energy in the residential sector and develop eco-responsible behavior.
Since the results showed the gap between EU countries in gaining the Europe 2020 target in share for renewable energies, it is recommended to increase the cohesion between countries. It would allow ensuring the green development at the national levels under the overall vision of green transformations rested on the principles of sustainable development, increasing energy security, defending the environment against the adverse effect of fossil fuels, and overcoming climate change. Moreover, there is a need to harmonize national and international energy standards.

6.3. Future Research Insights

The main limitation of this study is the small sample of investigated countries. Thus, the conclusions might not be generalized for all countries. Therefore, the future investigation on driving forces of renewable energy consumption should be conducted for a broader sample of countries that includes more than only the European countries. Besides this, a retrospective analysis of renewable energy development in these countries concerning income groups’ assignment is appropriate for future investigations.
Furthermore, this study could be extended by considering the cause-effect relationships among determinants of renewable energy consumption and building the forecast scenarios of renewable energy development. The obtained results would be a base for developing the national road maps to solve the energy problems and expand renewable energy sources in each country.

Author Contributions

Conceptualization, J.P. and T.P.; methodology, J.P., O.L. and Y.U.; software, Y.U.; validation, J.P., A.K. and T.P.; formal analysis, J.P. and A.K.; investigation, Y.U.; resources, O.L.; data curation, J.P.; writing—original draft preparation, A.K. and Y.U.; writing—review and editing, J.P. and T.P.; visualization, Y.U.; supervision, J.P.; project administration, J.P.; funding acquisition, J.P. All authors have read and agreed to the published version of the manuscript.

Funding

This research was funded by projects “Green investing: cointegration model of transmission ESG effects in the chain “green brand of Ukraine—social responsibility of business” (0121U100468, Ministry of Education and Science of Ukraine), “Simulation modeling of influence’s trajectory of behavioral attractors on macroeconomic stability: the role of transparency and public trust” (No 0121U100469, Ministry of Education and Science of Ukraine), the International Visegrad Fund.

Institutional Review Board Statement

Not applicable.

Informed Consent Statement

Not applicable.

Data Availability Statement

Not applicable.

Conflicts of Interest

The authors declare no conflict of interest.

References

  1. Shahbaz, M.; Topcu, B.A.; Sarıgül, S.S.; Vo, X.V. The effect of financial development on renewable energy demand: The case of developing countries. Renew. Energy 2021, 178, 1370–1380. [Google Scholar] [CrossRef]
  2. Ullah, A.; Ahmed, M.; Raza, S.A.; Ali, S. A threshold approach to sustainable development: Nonlinear relationship between renewable energy consumption, natural resource rent, and ecological footprint. J. Environ. Manag. 2021, 295, 113073. [Google Scholar] [CrossRef] [PubMed]
  3. Fatima, N.; Li, Y.; Ahmad, M.; Jabeen, G.; Li, X. Factors influencing renewable energy generation development: A way to environmental sustainability. Environ. Sci. Pollut. Res. 2021, 28, 51714–51732. [Google Scholar] [CrossRef]
  4. Fang, J.; Gozgor, G.; Mahalik, M.K.; Padhan, H.; Xu, R. The impact of economic complexity on energy demand in OECD countries. Environ. Sci. Pollut. Res. 2021, 28, 33771–33780. [Google Scholar] [CrossRef]
  5. Kwilinski, A. Mechanism of Formation of Industrial Enterprise Development Strategy in the Information Economy. Virtual Econ. 2018, 1, 7–25. [Google Scholar] [CrossRef]
  6. Kwilinski, A. Mechanism of Modernization of Industrial Sphere of Industrial Enterprise in Accordance with Requirements of the Information Economy. Mark. Manag. Innov. 2018, 4, 116–128. [Google Scholar] [CrossRef]
  7. Kwilinski, A.; Zaloznova, Y.; Trushkina, N.; Rynkevych, N. Organizational and Methodological Support for Ukrainian Coal Enterprises Marketing Activity Improvement. E3S Web Conf. 2020, 168, 00031. [Google Scholar] [CrossRef]
  8. Miśkiewicz, R. The Impact of Innovation and Information Technology on Greenhouse Gas Emissions: A Case of the Visegrád Countries. J. Risk Financ. Manag. 2021, 14, 59. [Google Scholar] [CrossRef]
  9. Miskiewicz, R. The Importance of Knowledge Transfer on the Energy Market. Polityka Energetyczna 2018, 21, 49–62. [Google Scholar] [CrossRef]
  10. Miskiewicz, R. Efficiency of Electricity Production Technology from Post-Process Gas Heat: Ecological, Economic and Social Benefits. Energies 2020, 13, 6106. [Google Scholar] [CrossRef]
  11. United Nations Framework Convention on Climate Change. 2021. Available online: https://unfccc.int/process-and-meetings/the-paris-agreement/the-paris-agreement (accessed on 20 September 2021).
  12. Dzwigol, H. The Concept of the System Approach of the Enterprise Restructuring Process. Virtual Econ. 2019, 2, 46–70. [Google Scholar] [CrossRef]
  13. Kharazishvili, Y.; Kwilinski, A.; Sukhodolia, O.; Dzwigol, H.; Bobro, D.; Kotowicz, J. The Systemic Approach for Estimating and Strategizing Energy Security: The Case of Ukraine. Energies 2021, 14, 2126. [Google Scholar] [CrossRef]
  14. Kuzior, A.; Kwilinski, A.; Hroznyi, I. The Factorial-Reflexive Approach to Diagnosing the Executors’ and Contractors’ Attitude to Achieving the Objectives by Energy Supplying Companies. Energies 2021, 14, 2572. [Google Scholar] [CrossRef]
  15. European Environmental Agency. Renewable Energy Consumption—Outlook from IEA. Available online: https://www.eea.europa.eu/data-and-maps/indicators/renewable-energy-consumption-outlook-from-iea (accessed on 8 December 2021).
  16. Sachs, J.; Kroll, C.; Lafortune, G.; Fuller, G.; Woelm, F. Sustainable Development Report 2021; Bertelsmann Stiftung and Sustainable Development Solutions Network (SDSN): New York, NY, USA, 2021. [Google Scholar] [CrossRef]
  17. Eurostat. Share of Renewable Energy in Gross Final Energy Consumption. 2021. Available online: https://ec.europa.eu/eurostat/databrowser/view/T2020_31/default/table?lang=en (accessed on 20 September 2021).
  18. Official Journal of the European Union. Directive 2009/28/EC of the European Parliament and of the Council of 23 April 2009 on the Promotion of the Use of Energy from Renewable Sources and Amending and Subsequently Repealing Directives 2001/77/EC and 2003/30/EC; Official Journal of the European Union: Luxembourg. 2009. Available online: https://eur-lex.europa.eu/legal-content/EN/TXT/PDF/?uri=CELEX:32009L0028&from=EN (accessed on 20 September 2021).
  19. European Parliament. Renewable energy. Fact Sheets on the European Union. 2021. Available online: https://www.europarl.europa.eu/factsheets/en/sheet/70/renewable-energy (accessed on 20 September 2021).
  20. Alper, A.; Oguz, O. The role of renewable energy consumption in economic growth: Evidence from asymmetric causality. Renew. Sustain. Energy Rev. 2016, 60, 953–959. [Google Scholar] [CrossRef]
  21. To, W.-M.; Lee, P.K.C. Energy Consumption and Economic Development in Hong Kong, China. Energies 2017, 10, 1883. [Google Scholar] [CrossRef] [Green Version]
  22. Kolosok, S.; Bilan, Y.; Vasylieva, T.; Wojciechowski, A.; Morawski, M. A Scoping Review of Renewable Energy, Sustainability and the Environment. Energies 2021, 14, 4490. [Google Scholar] [CrossRef]
  23. Fan, W.; Meng, M.; Lu, J.; Dong, X.; Wei, H.; Wang, X.; Zhang, Q. Decoupling Elasticity and Driving Factors of Energy Consumption and Economic Development in the Qinghai-Tibet Plateau. Sustainability 2020, 12, 1326. [Google Scholar] [CrossRef] [Green Version]
  24. Hajdukovic, I. Interactions among macroeconomic policies, the energy market and environmental quality. Environ. Econ. Policy Stud. 2021, 23, 861–913. [Google Scholar] [CrossRef]
  25. Rzayev, A.; Samoilikova, A. Innovation Financing Structure as a Factor of Economic Growth: Cross Country Analysis. Mark. Manag. Innov. 2020, 3, 133–156. [Google Scholar] [CrossRef]
  26. Didenko, I.; Volik, K.; Vasylieva, T.; Lyeonov, S.; Antoniuk, N. Environmental migration and country security: Theoretical analysis and empirical research. E3S Web Conf. 2021, 234, 00010. [Google Scholar] [CrossRef]
  27. Malik, I.A.; Siyal, G.-A.; Bin Abdullah, A.; Alam, A.; Zaman, K.; Kyophilavong, P.; Shahbaz, M.; Baloch, S.U.; Shams, T. Turn on the lights: Macroeconomic factors affecting renewable energy in Pakistan. Renew. Sustain. Energy Rev. 2014, 38, 277–284. [Google Scholar] [CrossRef]
  28. Ponce, P.; López-Sánchez, M.; Guerrero-Riofrío, P.; Flores-Chamba, J. Determinants of renewable and non-renewable energy consumption in hydroelectric countries. Environ. Sci. Pollut. Res. 2020, 27, 29554–29566. [Google Scholar] [CrossRef]
  29. Zhao, P.; Lu, Z.; Fang, J.; Paramati, S.R.; Jiang, K. Determinants of renewable and non-renewable energy demand in China. Struct. Chang. Econ. Dyn. 2020, 54, 202–209. [Google Scholar] [CrossRef]
  30. Li, J.; Omoju, O.E.; Zhang, J.; Ikhide, E.E.; Lu, G.; Lawal, A.I.; Ozue, V.A. Does Intellectual Property Rights Protection Constitute a Barrier to Renewable Energy? An Econometric Analysis. Natl. Inst. Econ. Rev. 2020, 251, R37–R46. [Google Scholar] [CrossRef] [Green Version]
  31. Salim, R.A.; Shafiei, S. Urbanization and renewable and non-renewable energy consumption in OECD countries: An empirical analysis. Econ. Model. 2014, 38, 581–591. [Google Scholar] [CrossRef] [Green Version]
  32. Nyiwul, L. Economic performance, environmental concerns, and renewable energy consumption: Drivers of renewable energy development in Sub-Sahara Africa. Clean Technol. Environ. Policy 2016, 19, 437–450. [Google Scholar] [CrossRef]
  33. Raychev, S.; Dimitrova, G.; Madzhurova, B.; Stoyanova, D. Innovations as a Factor for Economic Growth and Labor Market Development. Mark. Manag. Innov. 2020, 3, 22–31. [Google Scholar] [CrossRef]
  34. Ziabina, Y.; Pimonenko, T.; Lyulyov, O.; Us, Y.; Proshkin, D. Evolutionary development of energy efficiency in the context of the national carbon-free economic development. E3S Web Conf. 2021, 307, 09002. [Google Scholar] [CrossRef]
  35. Ziabina, Y.; Pimonenko, T.; Starchenko, L. Energy Efficiency of National Economy: Social, Economic and Ecological Indicators. SocioEcon. Chall. 2020, 4, 160–174. [Google Scholar] [CrossRef]
  36. Ang, J.B. CO2 emissions, energy consumption, and output in France. Energy Policy 2007, 35, 4772–4778. [Google Scholar] [CrossRef]
  37. Caruso, G.; Colantonio, E.; Gattone, S.A. Relationships between Renewable Energy Consumption, Social Factors, and Health: A Panel Vector Auto Regression Analysis of a Cluster of 12 EU Countries. Sustainability 2020, 12, 2915. [Google Scholar] [CrossRef] [Green Version]
  38. Nejat, P.; Jomehzadeh, F.; Taheri, M.M.; Gohari, M.; Abd Majid, M.Z. A global review of energy consumption, CO2 emissions and policy in the residential sector (with an overview of the top ten CO2 emitting countries). Renew. Sustain. Energy Rev. 2015, 43, 843–862. [Google Scholar] [CrossRef]
  39. Panchenko, V.; Harust, Y.; Us, Y.; Korobets, O.; Pavlyk, V. Energy-Efficient Innovations: Marketing, Management and Law Supporting. Mark. Manag. Innov. 2020, 1, 256–264. [Google Scholar] [CrossRef] [Green Version]
  40. El Amri, A.; Oulfarsi, S.; Boutti, R.; Sahib Eddine, A.; Hmioui, A. Carbon Financial Markets Underlying Climate Change Mitigation, Pricing and Challenges: Technical Analysis. Financ. Mark. Inst. Risks 2021, 5, 5–17. [Google Scholar] [CrossRef]
  41. Pavlyk, V. Assessment of green investment impact on the energy efficiency gap of the national economy. Financ. Mark. Inst. Risks 2020, 4, 117–123. [Google Scholar] [CrossRef]
  42. Kwilinski, A. Implementation of Blockchain Technology in Accounting Sphere. Acad. Account. Financ. Stud. J. 2019, 23, 1–6. [Google Scholar]
  43. Saługa, P.W.; Szczepańska-Woszczyna, K.; Miśkiewicz, R.; Chłąd, M. Cost of Equity of Coal-Fired Power Generation Projects in Poland: Its Importance for the Management of Decision-Making Process. Energies 2020, 13, 4833. [Google Scholar] [CrossRef]
  44. Eren, B.M.; Taspinar, N.; Gokmenoglu, K.K. The impact of financial development and economic growth on renewable energy consumption: Empirical analysis of India. Sci. Total Environ. 2019, 663, 189–197. [Google Scholar] [CrossRef]
  45. Anton, S.G.; Afloarei Nucu, A.E. The effect of financial development on renewable energy consumption. A panel data approach. Renew. Energy 2019, 147, 330–338. [Google Scholar] [CrossRef]
  46. Bayar, Y.; Sasmaz, M.U.; Ozkaya, M.H. Impact of Trade and Financial Globalization on Renewable Energy in EU Transition Economies: A Bootstrap Panel Granger Causality Test. Energies 2020, 14, 19. [Google Scholar] [CrossRef]
  47. Wang, Q.; Zhang, F. Does increasing investment in research and development promote economic growth decoupling from carbon emission growth? An empirical analysis of BRICS countries. J. Clean. Prod. 2019, 252, 119853. [Google Scholar] [CrossRef]
  48. Vanickova, R. Innovation Corporate Energy Management: Efficiency of Green Investment. Mark. Manag. Innov. 2020, 2, 56–67. [Google Scholar] [CrossRef]
  49. Schall, D.L. More than money? An empirical investigation of socio-psychological drivers of financial citizen participation in the German energy transition. Cogent Econ. Financ. 2020, 8, 1777813. [Google Scholar] [CrossRef]
  50. Marinescu, C.; Fucec, A.A. The Impact of Economic Freedom on Renewable Energy Investments’ efficiency. In Proceedings of the 14th International Multidisciplinary Scientific GeoConference SGEM 2014, Sofia, Bulgaria, 19–25 June 2014; pp. 447–454. [Google Scholar]
  51. Dong, F.; Pan, Y. Evolution of Renewable Energy in BRI Countries: A Combined Econometric and Decomposition Approach. Int. J. Environ. Res. Public Health 2020, 17, 8668. [Google Scholar] [CrossRef] [PubMed]
  52. Appiah-Otoo, I.; Song, N.; Acheampong, A.O.; Yao, X. Crowdfunding and renewable energy development: What does the data say? Int. J. Energy Res. 2021, 1–16. [Google Scholar] [CrossRef]
  53. Alola, A.A.; Alola, U.V. Agricultural land usage and tourism impact on renewable energy consumption among Coastline Mediterranean Countries. Energy Environ. 2018, 29, 1438–1454. [Google Scholar] [CrossRef]
  54. Tovmasyan, G. Raising the Effectiveness of Tourism Marketing and Branding: Evidence from Armenia. Mark. Manag. Innov. 2020, 1, 167–181. [Google Scholar] [CrossRef]
  55. Polcyn, J. Eco-Efficiency and Human Capital Efficiency: Example of Small- and Medium-Sized Family Farms in Selected European Countries. Sustainability 2021, 13, 6846. [Google Scholar] [CrossRef]
  56. Kolosok, S.; Pimonenko, T.; Yevdokymova, A.; Nazim, O.H.; Palienko, M.; Prasol, L. Energy efficiency policy: Impact of green innovations. Mark. Manag. Innov. 2020, 4, 50–60. [Google Scholar] [CrossRef]
  57. Bhandari, M.P. Climate Change Impacts on Agriculture, a Case Study of Bangladesh, India, Nepal, and Pakistan. SocioEcon. Chall. 2021, 5, 35–48. [Google Scholar] [CrossRef]
  58. Ge, J.; Sutherland, L.-A.; Polhill, J.G.; Matthews, K.; Miller, D.; Wardell-Johnson, D. Exploring factors affecting on-farm renewable energy adoption in Scotland using large-scale microdata. Energy Policy 2017, 107, 548–560. [Google Scholar] [CrossRef] [Green Version]
  59. Dzwigoł, H.; Dzwigoł–Barosz, M.; Zhyvko, Z.; Miskiewicz, R.; Pushak, H. Evaluation of the Energy Security as a Component of National Security of the Country. J. Secur. Sustain. Issues 2019, 8, 307–317. [Google Scholar] [CrossRef]
  60. Kharazishvili, Y.; Kwilinski, A.; Grishnova, O.; Dzwigol, H. Social Safety of Society for Developing Countries to Meet Sustainable Development Standards: Indicators, Level, Strategic Benchmarks (with Calculations Based on the Case Study of Ukraine). Sustainability 2020, 12, 8953. [Google Scholar] [CrossRef]
  61. Kuzior, A.; Kwilinski, A.; Tkachenko, V. Sustainable Development of Organizations Based on the Combinatorial Model of Artificial Intelligence. Entrep. Sustain. Issues 2019, 7, 1353–1376. [Google Scholar] [CrossRef]
  62. Rosokhata, A.; Minchenko, M.; Khomenko, L.; Chygryn, O. Renewable energy: A bibliometric analysis. E3S Web Conf. 2021, 250, 03002. [Google Scholar] [CrossRef]
  63. Uzar, U. Is Income Inequality a Driver for Renewable Energy Consumption? J. Clean. Prod. 2020, 255, 120287. [Google Scholar] [CrossRef]
  64. Marra, A.; Colantonio, E. The path to renewable energy consumption in the European Union through drivers and barriers: A panel vector autoregressive approach. Socio-Econ. Plan. Sci. 2020, 76, 100958. [Google Scholar] [CrossRef]
  65. Marques, A.C.; Fuinhas, J.A.; Pires Manso, J.R. Motivations driving renewable energy in European countries: A panel data approach. Energy Policy 2010, 38, 6877–6885. [Google Scholar] [CrossRef]
  66. Dzwigol, H. Methodological and Empirical Platform of Triangulation in Strategic Management. Acad. Strateg. Manag. J. 2020, 19, 1–8. [Google Scholar]
  67. Dzwigol, H.; Dzwigol-Barosz, M.; Miskiewicz, R.; Kwilinski, A. Manager Competency Assessment Model in the Conditions of Industry 4.0. Entrep. Sustain. Issues 2020, 7, 2630–2644. [Google Scholar] [CrossRef]
  68. Kwilinski, A.; Kuzior, A. Cognitive Technologies in the Management and Formation of Directions of the Priority Development of Industrial Enterprises. Manag. Syst. Prod. Eng. 2020, 28, 119–123. [Google Scholar] [CrossRef]
  69. Miskiewicz, R. Challenges Facing Management Practice in the Light of Industry 4.0: The Example of Poland. Virtual Econ. 2019, 2, 37–47. [Google Scholar] [CrossRef] [Green Version]
  70. Dzwigol, H. Meta-Analysis in Management and Quality Sciences. Mark. Manag. Innov. 2021, 1, 324–335. [Google Scholar] [CrossRef]
  71. Biresselioglu, M.E.; Zengin Karaibrahimoglu, Y. The government orientation and use of renewable energy: Case of Europe. Renew. Energy 2012, 47, 29–37. [Google Scholar] [CrossRef]
  72. Pająk, K.; Kvilinskyi, O.; Fasiecka, O.; Miskiewicz, R. Energy security in regional policy in Wielkopolska region of Poland. Econ. Environ. 2017, 2, 122–138. [Google Scholar]
  73. Vorontsova, A.; Vasylieva, T.; Bilan, Y.; Ostasz, G.; Mayboroda, T. The influence of state regulation of education for achieving the sustainable development goals: Case study of central and eastern European countries. Adm. Manag. Public 2020, 34, 6–26. [Google Scholar] [CrossRef]
  74. Letunovska, N.; Saher, L.; Vasylieva, T.; Lieonov, S. Dependence of public health on energy consumption: A cross-regional analysis. E3S Web Conf. 2021, 250, 04014. [Google Scholar] [CrossRef]
  75. Chen, C.; Pinar, M.; Stengos, T. Determinants of renewable energy consumption: Importance of democratic institutions. Renew. Energy 2021, 179, 75–83. [Google Scholar] [CrossRef]
  76. Apergis, N.; Eleftheriou, S. Renewable Energy Consumption, Political and Institutional Factors: Evidence From A Group Of European, Asian And Latin American Countries. Singap. Econ. Rev. 2015, 60, 1550008. [Google Scholar] [CrossRef]
  77. Uzar, U. Political economy of renewable energy: Does institutional quality make a difference in renewable energy consumption? Renew. Energy 2020, 155, 591–603. [Google Scholar] [CrossRef]
  78. Kilinc-Ata, N. The evaluation of renewable energy policies across EU countries and US states: An econometric approach. Energy Sustain. Dev. 2016, 31, 83–90. [Google Scholar] [CrossRef]
  79. Boiko, A.; Samusevych, I. The role of tax competition between the countries of the world and the features of determining the main tax competitors of Ukraine among the European countries. Financ. Mark. Inst. Risks 2017, 1, 72–79. [Google Scholar] [CrossRef] [Green Version]
  80. Samusevych, Y.; Maroušek, J.; Kuzmenko, O.; Streimikis, J.; Vysochyna, A. Environmental taxes in ensuring national security: A structural optimization model. J. Int. Stud. 2021, 14, 292–312. [Google Scholar] [CrossRef]
  81. Lyulyov, O.; Pimonenko, T.; Kwilinski, A.; Us, Y. The heterogeneous effect of democracy, economic and political globalisation on renewable energy. E3S Web Conf. 2021, 250, 03006. [Google Scholar] [CrossRef]
  82. Yahya, F.; Rafiq, M. Unraveling the contemporary drivers of renewable energy consumption: Evidence from regime types. Environ. Prog. Sustain. Energy 2019, 38, 13178. [Google Scholar] [CrossRef]
  83. Prokopenko, O.; Miskiewicz, R. Perception of “Green Shipping” in the Contemporary Conditions. Entrep. Sustain. Issues 2020, 8, 269–284. [Google Scholar] [CrossRef]
  84. Wall, W.P.; Khalid, B.; Urbański, M.; Kot, M. Factors Influencing Consumer’s Adoption of Renewable Energy. Energies 2021, 14, 5420. [Google Scholar] [CrossRef]
  85. Zahari, A.R.; Esa, E. Motivation to Adopt Renewable Energy among Generation Y. Procedia Econ. Financ. 2016, 35, 444–453. [Google Scholar] [CrossRef] [Green Version]
  86. Ulkhaq, M.M.; Widodo, A.K.; Yulianto, M.F.A.; Widhiyaningrum; Mustikasari, A.; Akshinta, P.Y. A logistic regression approach to model the willingness of consumers to adopt renewable energy sources. IOP Conf. Ser. Earth Environ. Sci. 2018, 127, 012007. [Google Scholar] [CrossRef]
  87. Fang, K.; Zhou, Y.; Wang, S.; Ye, R.; Guo, S. Assessing national renewable energy competitiveness of the G20: A revised Porter’s Diamond Model. Renew. Sustain. Energy Rev. 2018, 93, 719–731. [Google Scholar] [CrossRef]
  88. Lee, T. Financial investment for the development of renewable energy capacity. Energy Environ. 2019, 32, 1103–1116. [Google Scholar] [CrossRef]
  89. Sadorsky, P. Renewable energy consumption, CO2 emissions and oil prices in the G7 countries. Energy Econ. 2009, 31, 456–462. [Google Scholar] [CrossRef]
  90. Payne, J.E. The Causal Dynamics between US Renewable Energy Consumption, Output, Emissions, and Oil Prices. Energy Sources B Econ. Plan. Policy 2012, 7, 323–330. [Google Scholar] [CrossRef]
  91. Chen, Y. Factors influencing renewable energy consumption in China: An empirical analysis based on provincial panel data. J. Clean. Prod. 2018, 174, 605–615. [Google Scholar] [CrossRef]
  92. Purwanto, S.K.; Sinaga, O.; Sidik, M.H.J. Ensuring renewable energy consumption through innovation, R&D and energy import in indonesia: A time series analysis. Int. J. Energy Econ. Policy 2021, 11, 577–583. [Google Scholar] [CrossRef]
  93. Omri, A.; Nguyen, D.K. On the determinants of renewable energy consumption: International evidence. Energy 2014, 72, 554–560. [Google Scholar] [CrossRef]
  94. Luqman, M.; Ahmad, N.; Bakhsh, K. Nuclear energy, renewable energy and economic growth in Pakistan: Evidence from non-linear autoregressive distributed lag model. Renew. Energy 2019, 139, 1299–1309. [Google Scholar] [CrossRef]
  95. Apergis, N.; Payne, J.E. Renewable and non-renewable energy consumption-growth nexus: Evidence from a panel error correction model. Energy Econ. 2012, 34, 733–738. [Google Scholar] [CrossRef]
  96. Shahzad, U.; Lv, Y.; Doğan, B.; Xia, W. Unveiling the heterogeneous impacts of export product diversification on renewable energy consumption: New evidence from G-7 and E-7 countries. Renew. Energy 2021, 164, 1457–1470. [Google Scholar] [CrossRef]
  97. Baye, R.S.; Olper, A.; Ahenkan, A.; Surugu, J.M.; Anuga, S.W.; Darkwah, S. Renewable Energy Consumption in Africa: Evidence from a Bias Corrected Dynamic Panel. Sci. Total Environ. 2020, 766, 142583. [Google Scholar] [CrossRef] [PubMed]
  98. Miskiewicz, R. Internet of Things in Marketing: Bibliometric Analysis. Mark. Manag. Innov. 2020, 3, 371–381. [Google Scholar] [CrossRef]
  99. Li, R.; Jiang, H.; Sotnyk, I.; Kubatko, O.; Almashaqbeh, I.Y.A. The CO2 Emissions Drivers of Post-Communist Economies in Eastern Europe and Central Asia. Atmosphere 2020, 11, 1019. [Google Scholar] [CrossRef]
  100. Đonlagić, A.; Moskalenko, B.A. The Impact of FDI Inflow on the Environment: A Case of the Baltic-Black Sea Region Countries. SocioEcon. Chall. 2020, 4, 151–159. [Google Scholar] [CrossRef]
  101. Kalu, E.U.; Nwafor, U.F.; Okoyeuzu, C.R.; Onodugo, V.A. Dynamics of energy consumption, real sector value added and growth in energy deficient economies. Int. J. Energy Sect. Manag. 2020, 14, 1001–1022. [Google Scholar] [CrossRef]
  102. Sineviciene, L.; Sotnyk, I.; Kubatko, O. Determinants of energy efficiency and energy consumption of Eastern Europe post-communist economies. Energy Environ. 2017, 28, 870–884. [Google Scholar] [CrossRef]
  103. Kirikkaleli, D.; Adebayo, T.S. Do public-private partnerships in energy and renewable energy consumption matter for consumption-based carbon dioxide emissions in India? Environ. Sci. Pollut. Res. 2021, 28, 30139–30152. [Google Scholar] [CrossRef] [PubMed]
  104. Samusevych, Y.; Vysochyna, A.; Vasylieva, T.; Lyeonov, S.; Pokhylko, S. Environmental, energy and economic security: Assessment and interaction. E3S Web Conf. 2021, 234, 00012. [Google Scholar] [CrossRef]
  105. Zeeshan, M.; Han, J.; Rehman, A.; Ullah, I.; Alam Afridi, F.E. Exploring determinants of financial system and environmental quality in high-income developed countries of the world: The demonstration of robust penal data estimation techniques. Environ. Sci. Pollut. Res. 2021, 28, 61665–61680. [Google Scholar] [CrossRef] [PubMed]
  106. Sachs, J.; Schmidt-Traub, G.; Kroll, C.; Lafortune, G.; Fuller, G.; Woelm, F. The Sustainable Development Goals and COVID-19. Sustainable Development. Report 2020; Cambridge University Press: Cambridge, UK, 2020. [Google Scholar]
  107. Kumari, R.; Sharma, A.K. Determinants of foreign direct investment in developing countries: A panel data study. Int. J. Emerg. Mark. 2017, 12, 658–682. [Google Scholar] [CrossRef]
  108. Olanrewaju, B.T.; Olubusoye, O.E.; Adenikinju, A.; Akintande, O.J. A panel data analysis of renewable energy consumption in Africa. Renew. Energy 2019, 140, 668–679. [Google Scholar] [CrossRef]
  109. Shin-Ping, L.; Tsung-Hsien, C. The determinants of corporate performance. Manag. Audit. J. 2009, 24, 233–247. [Google Scholar] [CrossRef]
  110. Armeanu, D.; Vintilă, G.; Gherghina, Ş. Does Renewable Energy Drive Sustainable Economic Growth? Multivariate Panel Data Evidence for EU-28 Countries. Energies 2017, 10, 381. [Google Scholar] [CrossRef]
  111. Bhattacharya, M.; Paramati, S.R.; Ozturk, I.; Bhattacharya, S. The effect of renewable energy consumption on economic growth: Evidence from top 38 countries. Appl. Energy 2016, 162, 733–741. [Google Scholar] [CrossRef]
  112. Menegaki, A.N. Growth and renewable energy in Europe: A random effect model with evidence for neutrality hypothesis. Energy Econ. 2011, 33, 257–263. [Google Scholar] [CrossRef]
  113. Barbieri, L. Panel Unit Root Tests under Cross-sectional Dependence: An Overview. J. Stat. Adv. Theory Appl. 2009, 1, 117–158. [Google Scholar]
  114. Javeed, S.A.; Latief, R.; Jiang, T.; San Ong, T.; Tang, Y. How environmental regulations and corporate social responsibility affect the firm innovation with the moderating role of Chief executive officer (CEO) power and ownership concentration? J. Clean. Prod. 2021, 308, 127212. [Google Scholar] [CrossRef]
  115. The Pennsylvania State University. STAT 501. Regression Methods. Available online: https://online.stat.psu.edu/stat501/lesson/13/13.1 (accessed on 14 December 2021).
  116. Busu, M. Measuring the Renewable Energy Efficiency at the European Union Level and Its Impact on CO2 Emissions. Processes 2019, 7, 923. [Google Scholar] [CrossRef] [Green Version]
  117. Kharazishvili, Y.; Kwilinski, A.; Dzwigol, H.; Liashenko, V. Strategic European Integration Scenarios of Ukrainian and Polish Research, Education and Innovation Spaces. Virtual Econ. 2021, 4, 7–40. [Google Scholar] [CrossRef]
  118. Kwilinski, A.; Tkachenko, V.; Kuzior, A. Transparent Cognitive Technologies to Ensure Sustainable Society Development. J. Secur. Sustain. Issues 2019, 9, 561–570. [Google Scholar] [CrossRef]
  119. Lakhno, V.; Malyukov, V.; Bochulia, T.; Hipters, Z.; Kwilinski, A.; Tomashevska, O. Model of Managing of the Procedure of Mutual Financial Investing in Information Technologies and Smart City Systems. Int. J. Civ. Eng. Technol. 2018, 9, 1802–1812. [Google Scholar]
  120. Miskiewicz, R. Knowledge and Innovation 4.0 Today’s Electromobility. In Sustainability, Technology and Innovation 4.0; Makieła, Z., Stuss, M.M., Borowiecki, R., Eds.; Routledge: New York, NY, USA, 2021; pp. 256–275. [Google Scholar]
  121. Mahdavi, P.; Uddin, N. Governance amid the transition to renewable energy in the middle east and north Africa. In Low Carbon Energy in the Middle East and North Africa; Palgrave Macmillan: Cham, Switzerland, 2019. [Google Scholar] [CrossRef]
  122. Head, L.; Adams, M.; McGregor, H.V.; Toole, S. Climate change and Australia. Wiley Interdiscip. Rev. Clim. Chang. 2013, 5, 175–197. [Google Scholar] [CrossRef] [Green Version]
  123. Gershon, O.; Emekalam, P. Determinants of renewable energy consumption in nigeria: A toda yamamoto approach. IOP Conf. Ser. Earth Environ. Sci. 2021, 665, 012005. [Google Scholar] [CrossRef]
  124. Mukhtarov, S.; Humbatova, S.; Hajiyev, N.G.-O.; Aliyev, S. The Financial Development-Renewable Energy Consumption Nexus in the Case of Azerbaijan. Energies 2020, 13, 6265. [Google Scholar] [CrossRef]
  125. Tudor, C.; Sova, R. On the impact of gdp per capita, carbon intensity and innovation for renewable energy consumption: Worldwide evidence. Energies 2021, 14, 6254. [Google Scholar] [CrossRef]
  126. Moutinho, V.; Moreira, A.C.; Silva, P.M. The driving forces of change in energy-related CO2 emissions in Eastern, Western, Northern and Southern Europe: The LMDI approach to decomposition analysis. Renew. Sustain. Energy Rev. 2015, 50, 1485–1499. [Google Scholar] [CrossRef]
  127. Ben Jabeur, S. The Relationship between Renewable Energy Consumption and Economic Growth in France: A Necessary Condition Analysis. Environ. Model. Assess. 2019, 25, 397–409. [Google Scholar] [CrossRef]
  128. Nawaz, M.A.; Hussain, M.S.; Kamran, H.W.; Ehsanullah, S.; Maheen, R.; Shair, F. Trilemma association of energy consumption, carbon emission, and economic growth of BRICS and OECD regions: Quantile regression estimation. Environ. Sci. Pollut. Res. 2020, 28, 16014–16028. [Google Scholar] [CrossRef]
  129. Salim, R.A.; Rafiq, S. Why do some emerging economies proactively accelerate the adoption of renewable energy? Energy Econ. 2012, 34, 1051–1057. [Google Scholar] [CrossRef]
  130. Baye, R.S.; Ahenkan, A.; Darkwah, S. Renewable energy output in sub Saharan Africa. Renew. Energy 2021, 174, 705–714. [Google Scholar] [CrossRef]
  131. Brodny, J.; Tutak, M.; Bindzár, P. Assessing the Level of Renewable Energy Development in the European Union Member States. A 10-Year Perspective. Energies 2021, 14, 3765. [Google Scholar] [CrossRef]
  132. Simionescu, M.; Păuna, C.B.; Diaconescu, T. Renewable Energy and Economic Performance in the Context of the European Green Deal. Energies 2020, 13, 6440. [Google Scholar] [CrossRef]
  133. Simionescu, M.; Strielkowski, W.; Tvaronavičienė, M. Renewable Energy in Final Energy Consumption and Income in the EU-28 Countries. Energies 2020, 13, 2280. [Google Scholar] [CrossRef]
  134. Wang, Q.; Liu, Y. India’s renewable energy: New insights from multi-regional input output and structural decomposition analysis. J. Clean. Prod. 2020, 283, 124230. [Google Scholar] [CrossRef]
  135. Guo, J.; Zhou, Y.; Ali, S.; Shahzad, U.; Cui, L. Exploring the role of green innovation and investment in energy for environmental quality: An empirical appraisal from provincial data of China. J. Environ. Manag. 2021, 292, 112779. [Google Scholar] [CrossRef]
  136. Wang, C.; Miao, Z.; Chen, X.; Cheng, Y. Factors affecting changes of greenhouse gas emissions in Belt and Road countries. Renew. Sustain. Energy Rev. 2021, 147, 111220. [Google Scholar] [CrossRef]
  137. Lin, X.; Pan, H.; Qi, L.; Ren, Y.-S.; Sharp, B.; Ma, C. An input–output structural decomposition analysis of changes in China’s renewable energy consumption. Environ. Sci. Pollut. Res. 2021, 1–14. [Google Scholar] [CrossRef]
  138. Solaymani, S.A. Review on Energy and Renewable Energy Policies in Iran. Sustainability 2021, 13, 7328. [Google Scholar] [CrossRef]
  139. Apergis, N.; Payne, J.E. On the causal dynamics between renewable and non-renewable energy consumption and economic growth in developed and developing countries. Energy Syst. 2011, 2, 299–312. [Google Scholar] [CrossRef]
  140. Kahia, M.; Ben Aïssa, M.S.; Charfeddine, L. Impact of renewable and non-renewable energy consumption on economic growth: New evidence from the MENA Net Oil Exporting Countries (NOECs). Energy 2016, 116, 102–115. [Google Scholar] [CrossRef]
  141. Lyeonov, S.; Pimonenko, T.; Bilan, Y.; Štreimikienė, D.; Mentel, G. Assessment of Green Investments’ Impact on Sustainable Development: Linking Gross Domestic Product Per Capita, Greenhouse Gas Emissions and Renewable Energy. Energies 2019, 12, 3891. [Google Scholar] [CrossRef] [Green Version]
Figure 1. EU final energy consumption by sector in 2019 (developed by the authors based on [7]).
Energies 15 00108 g001
Figure 2. The progress towards Europe 2020 target in share for renewable energies (on the EU level) (developed by the authors based on [17]).
Energies 15 00108 g002
Figure 3. Relative frequency of average growth rate of the REC in the EU, 2015–2019 (developed by the authors based on [17]).
Energies 15 00108 g003
Figure 4. The dynamics of publication activity and citations for the analyzed publications (based on the Scopus data, October 2021).
Energies 15 00108 g004
Figure 5. The network map of bibliometric analysis concerning renewable energy consumption (based on the Scopus data, October 2021).
Energies 15 00108 g005
Figure 6. Results for (a) fixed- and (b) random-effects models.
Energies 15 00108 g006
Table 1. The TOP-10 most significant co-occurrence keywords in the general scope of literature concerning the determinants of renewable energy consumption.
No.ItemTotal Link Strength
1Economic growth397
2CO2 emissions153
3Financial development120
4Energy consumption108
5Trade56
6Urbanization42
7GDP39
8Human capital35
9Energy intensity32
10Foreign direct investments29
Table 2. Definitions of variables and descriptive statistics for all countries.
VariableDescriptionMeanMin→MaxSt. Dev.
RECRenewable energy consumption (% of total final energy consumption)21.3750.991→61.11118.089
CO2CO2 emissions (metric tons per capita)4.6530.045→10.7283.423
GDPGDP per capita (current US $)31033.27635.704→102,913.524,098.61
IMPImports of goods and services (% of GDP);48.70824.686→94.48417.861
EXPExports of goods and services (% of GDP)51.33324.836→96.37617.747
INDIndustry (incl. construction), value added (% of GDP)27.17117.045→40.2955.212
MNFManufacturing, value added (% of GDP)15.6595.996→24.1504.562
FDIForeign direct investment, net inflows (BoP, cur. US$)1.21 × 10¹⁰−6.47 × 10¹⁰→8.51 × 10101.88 × 1010
LFTLabor force, total942,1662,405,139→30,438,6919,308,153
GCFGross capital formation (% of GDP)23.71613.397→32.8263.315
VAIValue added in industry, % of total value-added30.75419.201→44.7675.646
ECIEnergy consumption in industry, % total energy consumption28.33613.232→47.5228.772
PCIProduction-based CO2 intensity, energy-related CO2 per capita7.1323.460→13.6302.240
PCPProduction-based CO2 productivity, GDP per unit of energy-related CO2 emissions5.2821.088→14.8842.767
Notes: Min—Minimum. Max—Maximum. St. Dev.—Standard deviation.
Table 3. Panel unit root results for the employed variables.
TestsStat. Par.Variables
Unit Root in Level
RECCO2GDPIMPEXPINDMNFFDILFTGCFVAIECIPCIPCP
LLCStat.−0.88−2.92−7.17−1.58−1.99−2.08−2.37−2.01−0.35−3.16−2.15−2.610.98−1.08
Prob.0.190.00 *0.00 *0.06 ***0.02 **0.02 **0.01 **0.02 **0.360.00 *0.02 **0.00 *0.82−0.14
IPSStat.2.241.42−4.140.03−0.21−0.45−0.88−2.833.15−2.11−0.75−0.572.743.04
Prob.0.990.920.00 *0.510.420.330.190.00 *0.990.02 **0.230.280.990.99
ADFStat.6.7119.1851.6615.2816.5719.2726.1338.1514.0932.2021.6517.997.014.89
Prob.0.990.510.00 *0.760.680.50.160.01 **0.830.04 **0.360.590.990.99
PPStat.9.8223.3377.7514.6319.6317.1223.8696.8535.3123.9619.5438.106.133.76
Prob.0.970.270.00 *0.800.480.650.250.00 *0.02 **0.240.490.01 **0.991.00
TestsStat. Par.Unit Root in 1st Difference
RECCO2GDPIMPEXPINDMNFFDILFTGCFVAIECIPCIPCP
LLCStat.−4.53−2.07−5.02−9.17−7.55−7.17−5.20−6.62−3.10−9.64−7.07−7.57−6.99−6.81
Prob.0.00 *0.02 **0.00 *0.00 *0.00 *0.00 *0.00 *0.00 *0.00 *0.00 *0.00 *0.00 *0.00 *0.00 *
IPSStat.−4.97−4.82−3.48−7.21−5.79−5.69−4.79−8–89−3.88−8.04−5.58−6.76−5.87−6.44
Prob.0.00 *0.00 *0.00 *0.00 *0.00 *0.00 *0.00 *0.00 *0.00 *0.00 *0.00 *0.00 *0.00 *0.00 *
ADFStat.62.2061.4744.1886.6869.9669.4560.95106.6150.1296.8368.1081.7371.4978.18
Prob.0.00 *0.00 *0.00 *0.00 *0.00 *0.00 *0.00 *0.00 *0.00 *0.00 *0.00 *0.00 *0.00 *0.00 *
PPStat.123.72134.1656.91135.65103.98117.9792.531282.8106.50161.26109.70232.18130.24177.07
Prob.0.00 *0.00 *0.00 *0.00 *0.00 *0.00 *0.00 *0.00 *0.00 *0.00 *0.00 *0.00 *0.00 *0.00 *
Notes: * p < 0.01, ** p < 0.05, *** p < 0.1. LLC Levin, Lin and Chu t* stat. IPS Im, Pesaran and Shin W-stat. ADF Augmented Dickey-Fuller Fisher Chi-square. PP Phillips–Perron Fisher Chi-square.
Table 4. Correlation matrix.
RECCO2GDPIMPEXPINDMNFFDILFTGCFVAIECIPCIPCP
REC1.0000.060.89−0.42−0.19−0.04−0.39−0.15−0.58−0.06−0.020.080.040.80
CO2 1.00−0.01−0.46−0.440.02−0.270.080.480.010.01−0.080.000.02
GDP 1.00−0.46−0.26−0.20−0.43−0.08−0.480.02−0.21−0.150.110.84
IMP 1.000.930.250.62−0.14−0.210.170.27−0.09−0.14−0.35
EXP 1.000.400.51−0.16−0.430.170.42−0.06−0.08−0.18
IND 1.000.240.07−0.370.460.990.450.47−0.40
MNF 1.000.09−0.070.230.240.170.25−0.49
FDI 1.000.220.090.030.010.12−0.12
LFT 1.00−0.24−0.40−0.20−0.29−0.30
GCF 1.000.420.230.28−0.10
VAI 1.000.440.47−0.40
ECI 1.000.24−0.27
PCI 1.00−0.41
PCP 1.00
Table 5. Panel regression results for the fixed-effects model.
Dependent VariableRenewable Energy Consumption
VariablesCoefficientStd. Errort-StatisticProb.
CO20.164 *0.01412.0480.000
GDP0.691 *0.02034.1040.000
LFT−0.398 *0.029−13.6190.000
GCF−1.187 *0.135−8.8210.000
ECI0.656 *0.05911.0600.000
PCI−0.492 *0.062−7.9280.000
R-Squared0.941
Prob (F-statistic)0.000
Note: * p < 0.01.
Table 6. Panel regression results for random-effects model.
Dependent VariableRenewable Energy Consumption
VariablesCoefficientStd. Errort-StatisticProb.
CO20.187 *0.0593.1520.001
GDP0.511 *0.03116.6360.000
MNF0.580 *0.1085.3650.000
LFT−0.589 *0.143−4.1300.000
GCF−0.666 *0.095−7.0000.000
PCI−1.471 *0.092−15.9560.000
R-squared0.845
Prob (F-Statistic)0.000
Note: * p < 0.01.
Table 7. Correlated random effects-Hausman test.
Test SummaryChi-Square StatisticChi-Square d.f.Probability
Cross-section random22.34880.0029
Note: Chi-Square d.f. The chi-squared distribution with k degrees of freedom.
Table 8. Panel Generalized Method of Moments model.
Dependent VariableRenewable Energy Consumption
VariablesCoefficientStd. Errort-StatisticProb.
CO20.173 *0.0189.8840.000
GDP0.629 *0.02525.0820.000
LFT−0.470 *0.037−12.8280.000
GCF−1.006 *0.172−5.8480.000
ECI−0.3870.079−4.9070.000
R-squared0.902
Prob (F-statistic)0.000
Note: * p < 0.01.
Table 9. Results of robustness test.
Dependent VariableRenewable Energy Consumption
VariablesCoefficientStd. Errort-StatisticProb.
CO20.164 *0.01412.0480.000
GDP0.691 *0.02034.1040.000
LFT−0.398 *0.029−13.6190.000
GCF−1.187 *0.135−8.8210.000
ECI0.656 *0.05911.0600.000
PCI−0.492 *0.062−7.9280.000
Statistics Based on the Weighted Data
R-squared0.941
Adjusted R-squared0.939
Prob (F-statistic)0.000
Durbin-Watson stat.0.372
Schwarz criterion0.117
Hannan-Quinn criter.0.046
Akaike info criterion−0.003
Note: * p < 0.01.
Publisher’s Note: MDPI stays neutral with regard to jurisdictional claims in published maps and institutional affiliations.

