1. Introduction
The evolution of advanced Information and Communication Technology (ICT) has been a great motivation behind the improvement of operational infrastructure in a wide variety of business domains. These include education, healthcare, transportation, and energy domains. As a result, the concept of “smart cities” has gained significant attention as an interesting field of study in academia and research industry [
1]. Generally, the concept of smart cities has been used extensively as an umbrella term for the incorporation of advanced ICT in these business domains with the aim of enhancing economy and Quality of Experience (QoE) for all the involved stakeholders (e.g., utility providers and end-users). The main objective of this paper is particularly on the changes that ICT has brought into the energy sector, especially the electricity grid, in terms of reliability and efficiency from a communication perspective. With the integration of ICT into power grid, the traditional power grid that has revolutionized daily lives of consumers since its inception has been transitioned into a “Smart Grid (SG)” paradigm. This paradigm entails the integration of advanced ICT, computer intelligence, and control optimization methods throughout the network domains from power generation to transportation up to end-users [
2]. Compared to the traditional power grid, the SG paradigm will have intelligent and improved communication networks. For instance, SG promises to provide frequent and timely two-way interaction between the end-users and Utility Control Center (UCC), as well as remote monitoring to a vast majority of power grid [
3,
4]. The terms end-users and consumers will be used interchangeably in this paper.
As ICT gains momentum in the area of power grids, the existing obsolete communication infrastructure is prone to major challenges such as efficiency and security, among others [
5]. Complicating the issues further is the exponential increase in the demand for wireless applications and services driven by Internet of Things (IoT) smart devices which yields huge data volume. Since the existing communication infrastructure was not designed for 21st Century challenges, it is confronted with the major issues of managing, processing, and storing such amounts of generated data. Fundamentally, this has changed the data traffic of wireless networks [
6]. Considering the interest in the innovation of SG in both the developing and developed countries, recent works in the literature have devoted their attention to designing and planning the network architecture that supports the level of Quality of Service (QoS) requirements emerging with diverse SG applications [
4]. Despite the SG’s promising benefits, power grids have always been known by their complex design nature [
7]. However, the path towards the realization of SG as an effective solution to these issues seems promising since it is still an ongoing innovation. Contributing to the benefits emerging with SG deployment is the Advanced Metering Infrastructure (AMI), which is perceived as an initial step towards SG innovation. An approach to exploit the limited data from AMI is presented in [
8]. The proposed approach is concerned with mitigating the underlying limitations such as communication, storage, and computing power.
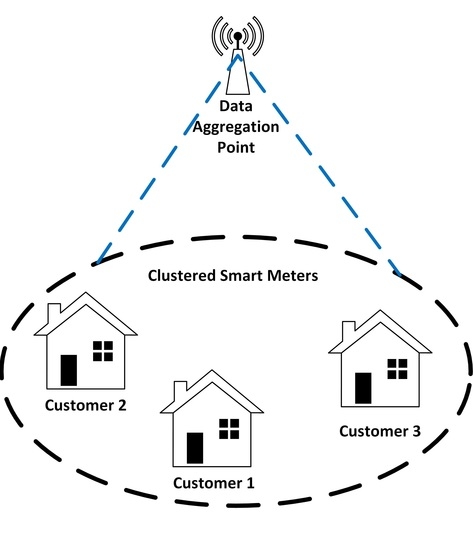
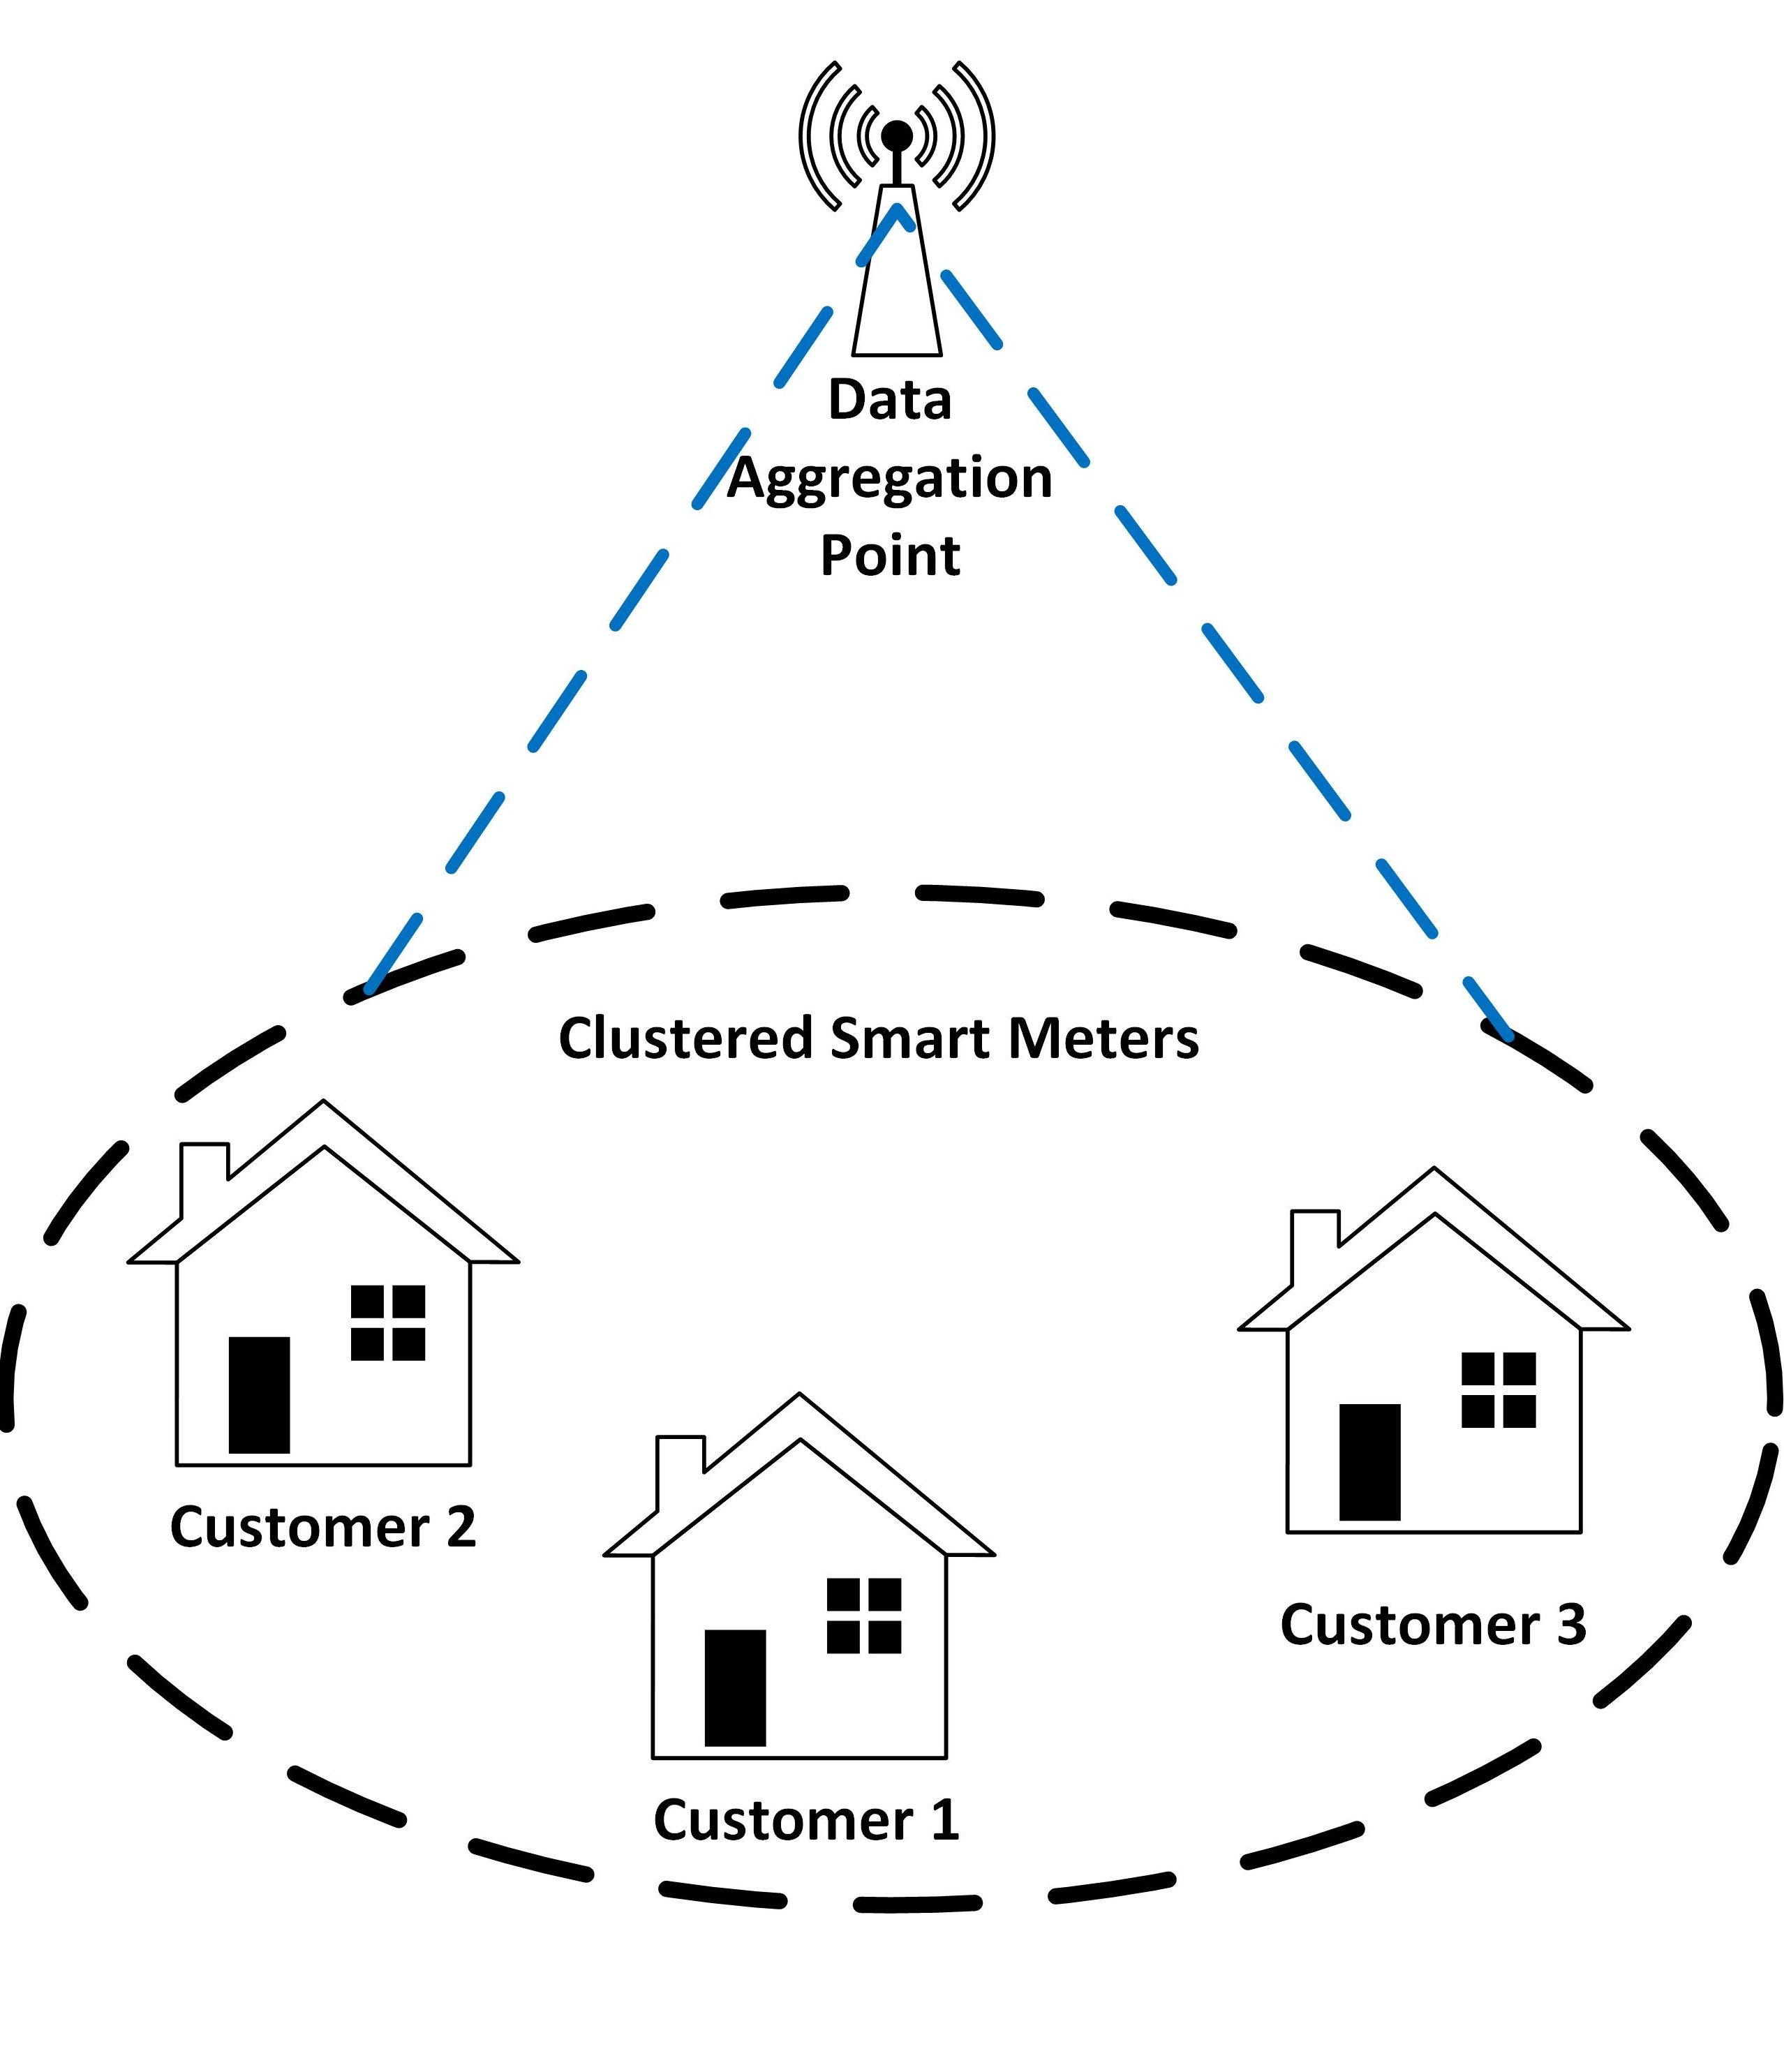
Therefore, this paper aims to evaluate the importance of AMI in SG deployment by proposing a placement Neighborhood Area Network (NAN) scheme based on the combination of unsupervised K-means clustering algorithm and Poisson Point Process (PPP). A typical AMI, as depicted in
Figure 1, consists of large-scale deployment of Smart Meters (SMs), sensors, smart IoT devices, and two-way communication, among others.
In this configuration, the SMs are used as an essential component to collect the power consumption data from all smart electrical appliances within the premises and allow frequent monitoring of the power grid status in real-time using sensors. In this manner, UCC may be able to control and optimize the load control commands, which can lead to effective decision-making. The Data Aggregation Points (DAPs) distributed within NANs are employed to serve as intermediary nodes between the SMs and UCC as well as enabling effective and reliable communication. For this reason, the efficient number of DAPs employed as well as their optimal locations have a great impact on the given QoS communication requirements for each SM within the network and the overall network performance of NAN. This may be in terms of coverage probability, latency, packet error probability, and outage probability, among others [
4,
5]. Considering the limited communication capacity of each DAP within the network, NAN may be confronted with huge data traffic, which may result in packet losses and latency if not managed in a timely manner. The data traffic in SG may be classified into fixed scheduling and event-driven data traffic depending on the type of data transmitted. For ease of our explanation, each DAP within NAN has a limited maximum number of SMs that it can be associated with for communication purpose, which needs to be taken into consideration during network planning in SGs. Furthermore, the limited bandwidth within NAN may contribute to design issues as it is not guaranteed to support the level of QoS requirements from SMs [
5].
Several methods have been proposed in the literature to mitigate the limited resource issues in large-scale networks, such as the allocation model and scheduling algorithms, among others [
9]. Therefore, this paper aims to compliment the existing works in the literature by proposing a hybrid NAN scheme without compromising the given QoS requirements of SMs in terms of coverage probability and connectivity. Given the large-scale random distribution of SMs within NAN, our proposed scheme will consider an effective heuristic model with the capability of grouping SMs into sets of clusters to mitigate the limited capacity of DAPs and minimize the transmission costs within NAN. In addition, the scheme uses the silhouette index method to measure how similar the SMs assigned to one DAP are to one another in terms of closeness and also how dissimilar they are to the SMs assigned to the neighboring DAPs (compactness). This may result in minimized data traffic and energy consumption within the network. In a nutshell, the problem in this paper has been formulated as the optimization problem, where the efficient number of DAPs required for a given SM’s density is determined and also their best locations in which the coverage probability and connectivity for SMs is satisfied [
9].
Unlike the existing works in the literature, a unique approach to solve the constraints of power independence, power robustness, and communication robustness was presented in [
10]. The optimization problem that has resulted as an NP-hard problem has been formulated with the aim of minimizing the installation costs of DAPs with QoS requirements taken into consideration. In [
11], a similar approach has been taken with the optimization problem formulated as an integer problem. In addition, the K-means clustering algorithm has been adopted to increase the effectiveness and minimize the complexity of mitigating the DAPs placement problem. In [
12], to minimize computational complexities in solving DAPs placement problem such as the Set Covering Problem (SCV), the proposed model divides the major problem into set of subproblems that are optimally solved. The proposed model is called Memory Oriented Split using K-means with Post Optimization Unification (MOSKOU) [
12]. The optimization of DAPs placement problem has been extensively studied in the literature [
13,
14]. In [
13], authors approached the DAPs placement problem from the angle of mitigating the latency and overhead issues in AMI. Both the wireless and wired communication technologies have been incorporated into the infrastructure to enhance the information exchange between consumers and microgrid. Therefore, following the approach taken in the aforementioned works, we also propose to solve the DAPs placement problem as a clustering problem. This paper considers, an effective model based on the K-means clustering algorithm to subdivide SMs into groups where the minimum distance is taken as a similarity metric. As such, we propose to simulate the effectiveness of selected DAP locations using the coverage probability as the performance metric. Compared to the prior works in the literature, the scheme proposed in this paper takes the randomness of SM locations into consideration using PPP. In prior works, K-means clustering algorithm has indicated satisfactory and reliable results in solving the DAPs placement problem. The clustering, also referred to as cluster analysis, has been applied in a wide variety of application domains such as business intelligence, psychology and social science, information retrieval, pattern classification, bioinformatics, localization, and service segmentation, among others [
15,
16,
17].
The main aim of clustering in its application is to identify groups of similar objects referred to as clusters and, in return, help to discover the distribution of patterns and interesting correlations in large data sets [
18]. As such, clustering may be classified into different types of algorithms, namely, prototype-based, density-based, graph-based, hybrid, and algorithm-independent methods [
19]. Usually, these clustering methods are distinguished by their unique structural designs. A clear distinction among these methods has been extensively studied in [
15]. Despite their unique benefits in their applications, prototype-based clustering algorithms are the most adopted technique, particularly K-means clustering [
20,
21]. In recent works, the K-means clustering algorithm has been utilized as a benchmark method in a wide variety of both unsupervised and supervised learning algorithms to improve the robustness and effectiveness of the model [
19]. Despite the variety of works based on K-means clustering algorithm in the literature, the work by Sinaga and Yang [
20] caught our attention as an appropriate model to address our DAPs placement problem formulated as clustering problem [
20]. The proposed algorithm in this paper considers the Expectation–Maximization (EM) algorithm to address the initialization problem in the traditional K-means clustering algorithm, since it is very sensitive to such a problem. Unlike the works in the literature that rely on knowing the number of clusters beforehand, the proposed algorithm automatically finds the number of clusters by incorporating the entropy method into their proposed model. A detailed description of the entropy method has been highlighted in [
15]. The precise locations of SMs in high-dimensional environments such as SG NANs are usually unknown. Therefore, the attention in modeling the locations of SMs prior to clustering has been diverted to stochastic geometry tools such as PPP [
22]. In addition, this has been driven by the increase in the randomness and irregularity of SM locations in NANs. The key contributions of this paper are outlined as follows:
A self-sustainable placement NAN scheme based on unsupervised K-means clustering is proposed to determine the efficient number of DAPs for a given SM density [
23,
24].
To address the randomness of SM locations, the SMs are assumed to be deployed according to PPP.
The silhouette index method is deployed to measure the accuracy of the proposed clustered scheme. This method measures how accurate the membership of each SM with respect to their associated DAP is compared to that of the neighboring DAPs.
The network coverage and connectivity are used to evaluate the performance of each SM within the network under the corresponding DAP.
The rest of this paper is organized as follows:
Section 2 presents the review on the existing and recent works in relation to mitigating the DAPs placement problem. In
Section 3, the system model proposed in this work is extensively discussed. The problem formulation based on unsupervised K-means clustering algorithm along with the summary of the algorithm is presented in
Section 4. In
Section 5, the simulation of the system model and performance evaluation is presented. The results achieved in
Section 5 are further discussed in
Section 6. Finally, the paper is concluded in
Section 7.
2. Related Works
There are several approaches proposed in the literature in the effort to solve the DAPs placement problem in wireless networks [
5,
10,
11,
12,
13,
14]. That is, modeling the optimal locations of the DAPs within the network, with the aim of ensuring that all the QoS requirements of the SMs are satisfied. The location modeling for DAPs is of key importance for the improvement of NAN performance in terms of coverage optimization and minimized QoS requirements such as communication delay, packet losses, and many more [
25]. In the literature, [
5] developed an analytical model to quantify the QoS metrics of SMs distributed within the network with the minimum number of concentrators deployed. In addition, the authors proposed mitigating the limited bandwidth issues by developing a channel allocation between the groups of SMs headed by the serving concentrators. The terms DAPs, transmitters, and concentrators are used interchangeably in the literature.
In communication networks with many channels such as wireless networks (e.g., cellular, fiber optics), the stochastic geometry approach has been suggested in prior works as an effective solution to address the randomness among distributed nodes [
26]. The most significant challenge in NAN is to ensure an effective interoperability among the smart IoT devices without excessive costs for the communication infrastructure [
27]. In this manner, the high cost of communication with respect to computation cost in wireless networks necessitates the importance of aggregation [
28]. A cost-minimization DAP placement (CMDP) as a constrained optimization problem has been formulated to minimize the cost of DAPs placement in NAN [
10], while an extensive investigation based on the DAPs placement problem in AMI was conducted in [
11]. The simulation results achieved in this work have highlighted the impact of selected DAP locations on SM density at a given communication range.
Among the issues arising in cellular network analysis is modeling the maximum number of users to be associated with a relevant base station (BS) [
29]. Unlike the works in the literature, the maximum capacity of SMs each DAP may be able to accommodate has been considered in [
10,
11]. Due to the evolution of machine learning in various business domains, clustering has been realized as an effective tool to address the localization problem in wireless networks [
17]. In [
14], an investigation on the application of partitional-based clustering algorithms—namely, K-means, Fuzzy C-means (FCM), and Self-Organizing Map (SOM)—has been conducted. In addition, multihop shortest path distance (MSPD) has been used as a similarity metric to evaluate the performance of these algorithms. Considering the large-scale deployment of smart IoT devices in SG, the sensor placement problem has been mitigated by FCM with the effect of extracting a high-dimension dataset from the network with minimum communication delay [
30]. As such, the fundamental concept of FCM is similar to that of traditional K-means clustering, which is concerned with clustering or grouping datasets with huge similarity but also huge dissimilarity with datasets belonging in other clusters.
Despite the benefits emerging with the K-means clustering algorithm, initialization of numbers beforehand is a challenging issue, especially in high-dimensional datasets [
31]. An alternative approach to mitigating the initialization of traditional K-means clustering has been addressed in [
20]. A novel unsupervised K-means clustering algorithm has been developed to automatically find the cluster number based on the insight discovered within the datasets. The EM algorithm, which is very sensitive to initialization, has been incorporated in parallel with the well-known and oldest K-means clustering algorithm. One distinguishing factor of this proposed novel scheme by Sinaga and Yang [
20] from the existing works in the literature is its ability to automatically find the cluster number. The works such as [
16] have adopted the optimized hybrid approach of K-means to cluster the learners with the aim of improving the education system.
3. System Model
The communication model of AMI is considered in this paper as depicted in
Figure 1, where each customer’s premises consist of vast amount of smart electrical appliances embedded within them. Each premises is assumed to have an SM installed that is used to collect the data from smart electrical appliances periodically or timely depending on the latency sensitivity of the data collected. For example, power consumption data may be transmitted periodically due to its latency tolerance, whereas monitoring and controlling data may be transmitted in a timely manner. Since the UCC is usually located far away from the customer’s premises, the communication system may not be able to satisfy the QoS requirements from SMs, which may yield degradation in network performance. In this sense, the DAPs are deployed within NAN to serve as the communication gateways between the premises and remote control center to allow reliable data transmission.
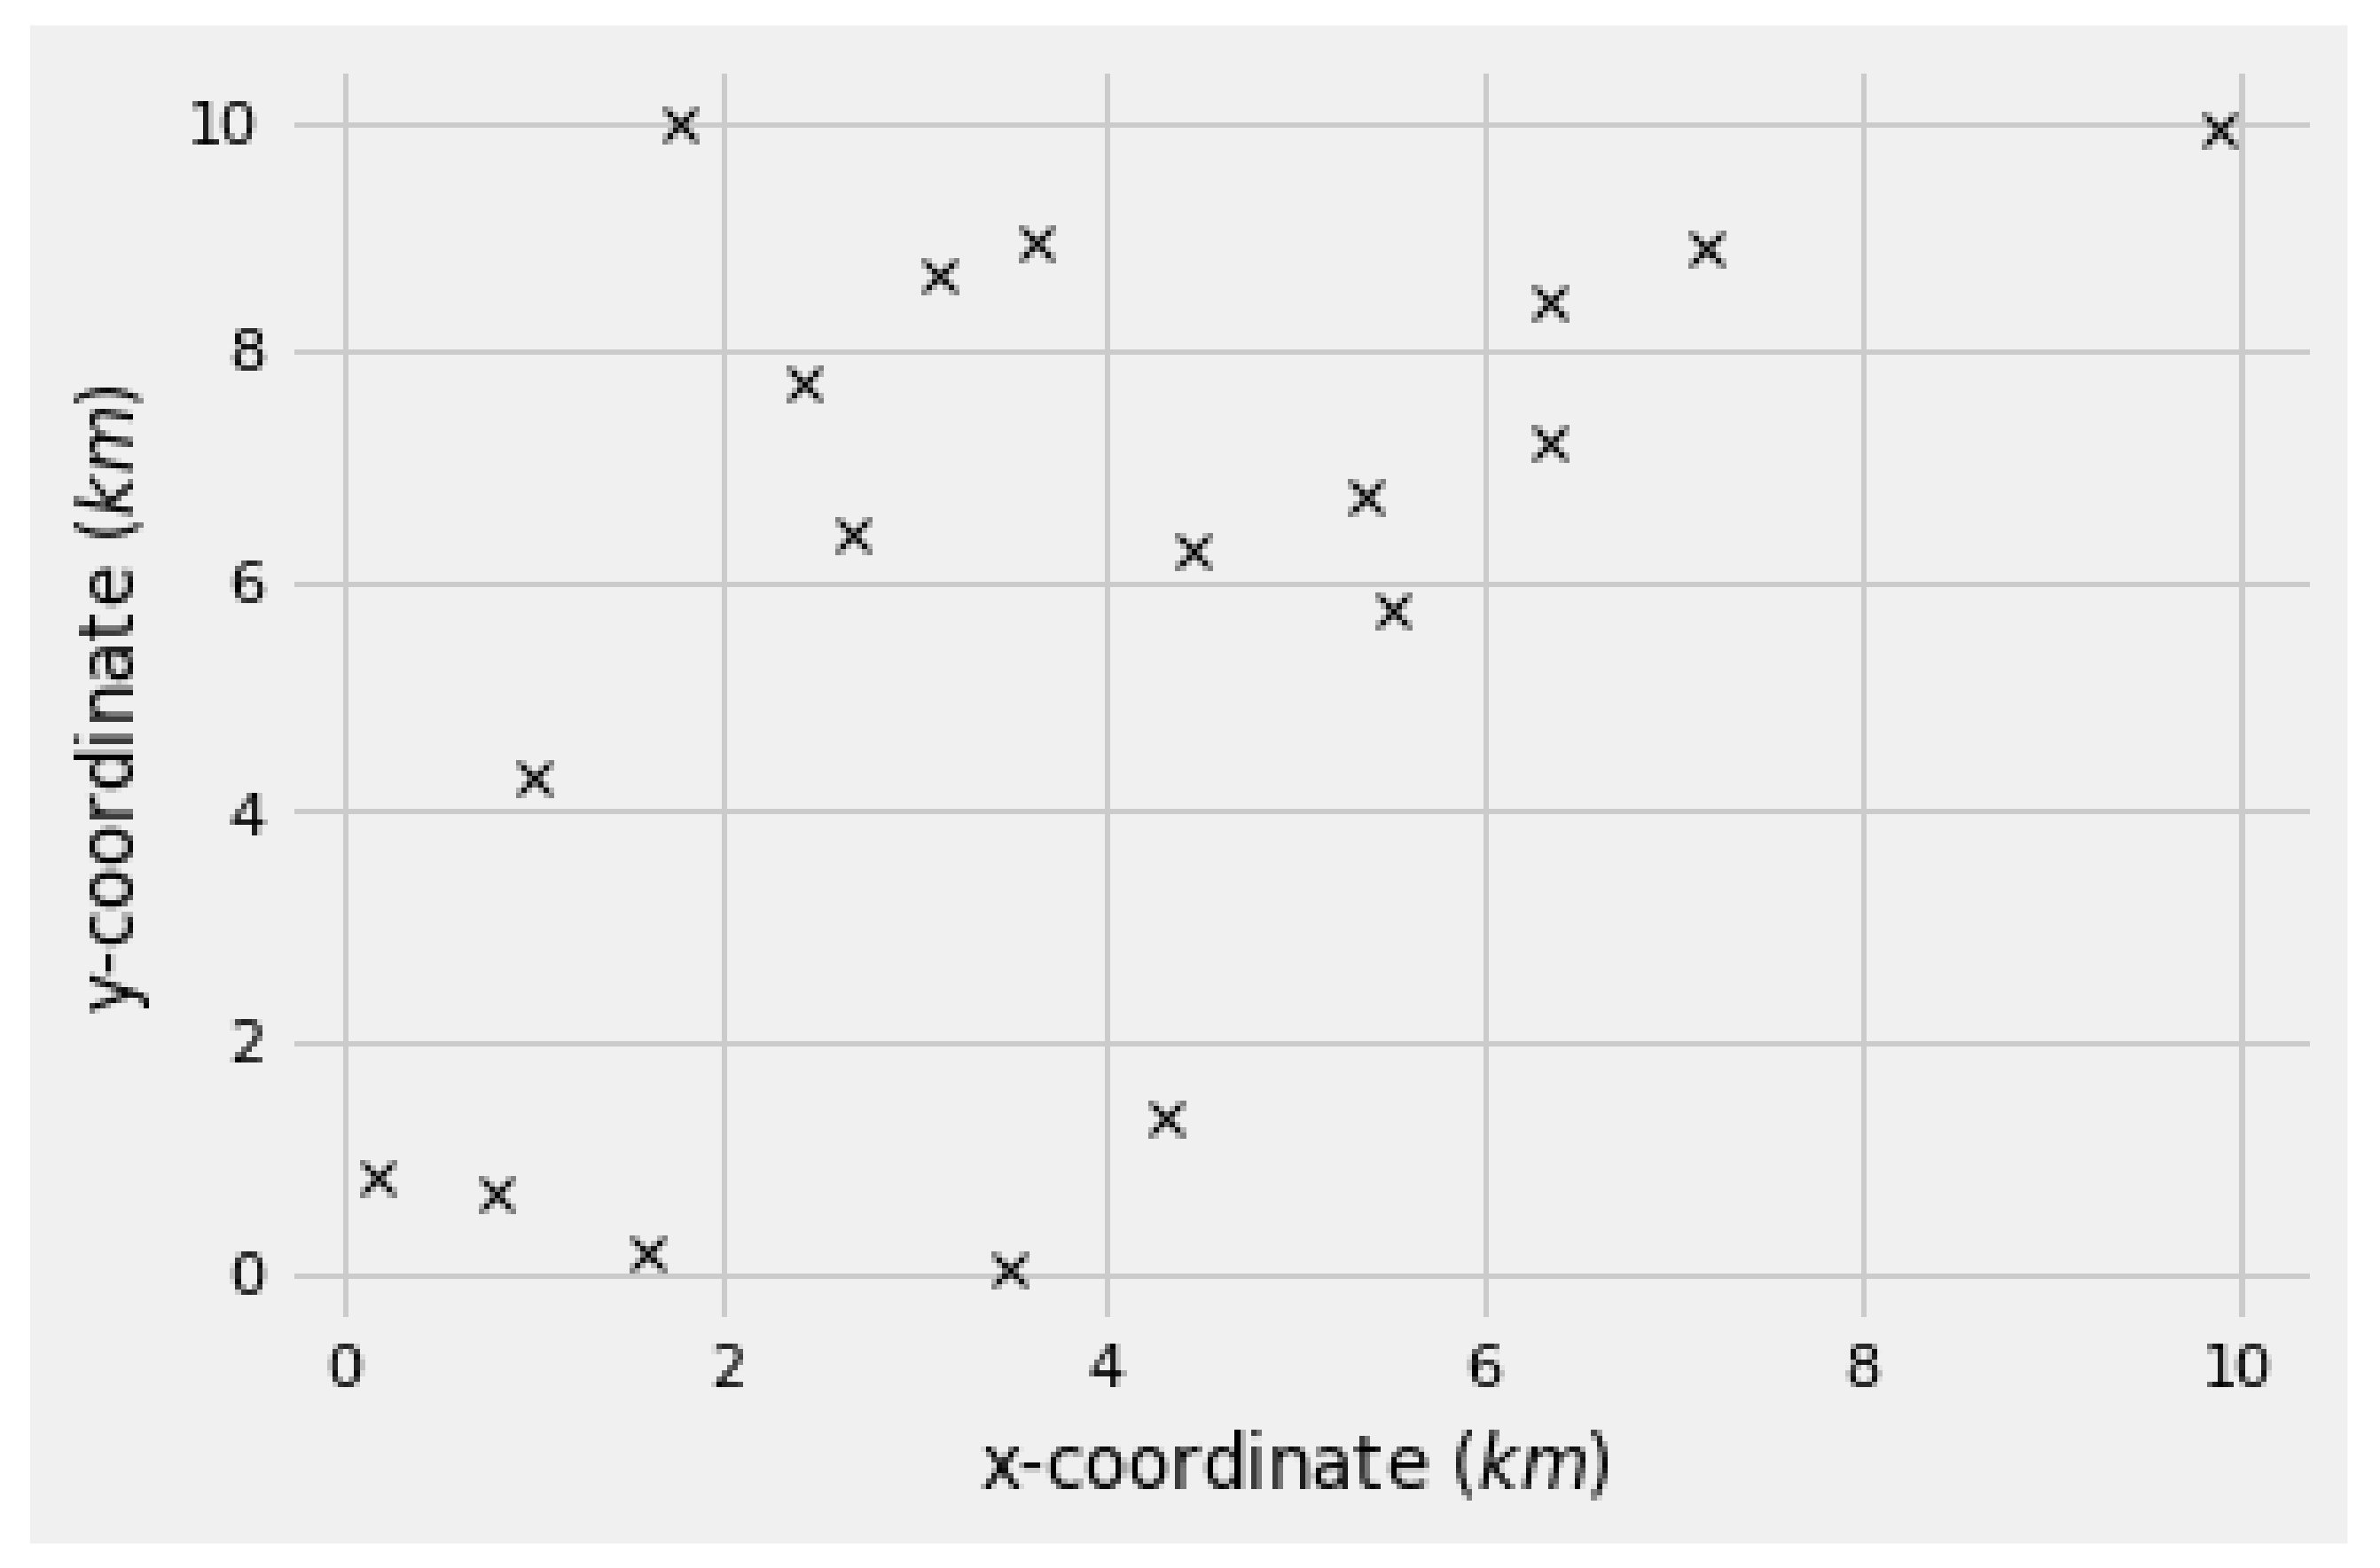
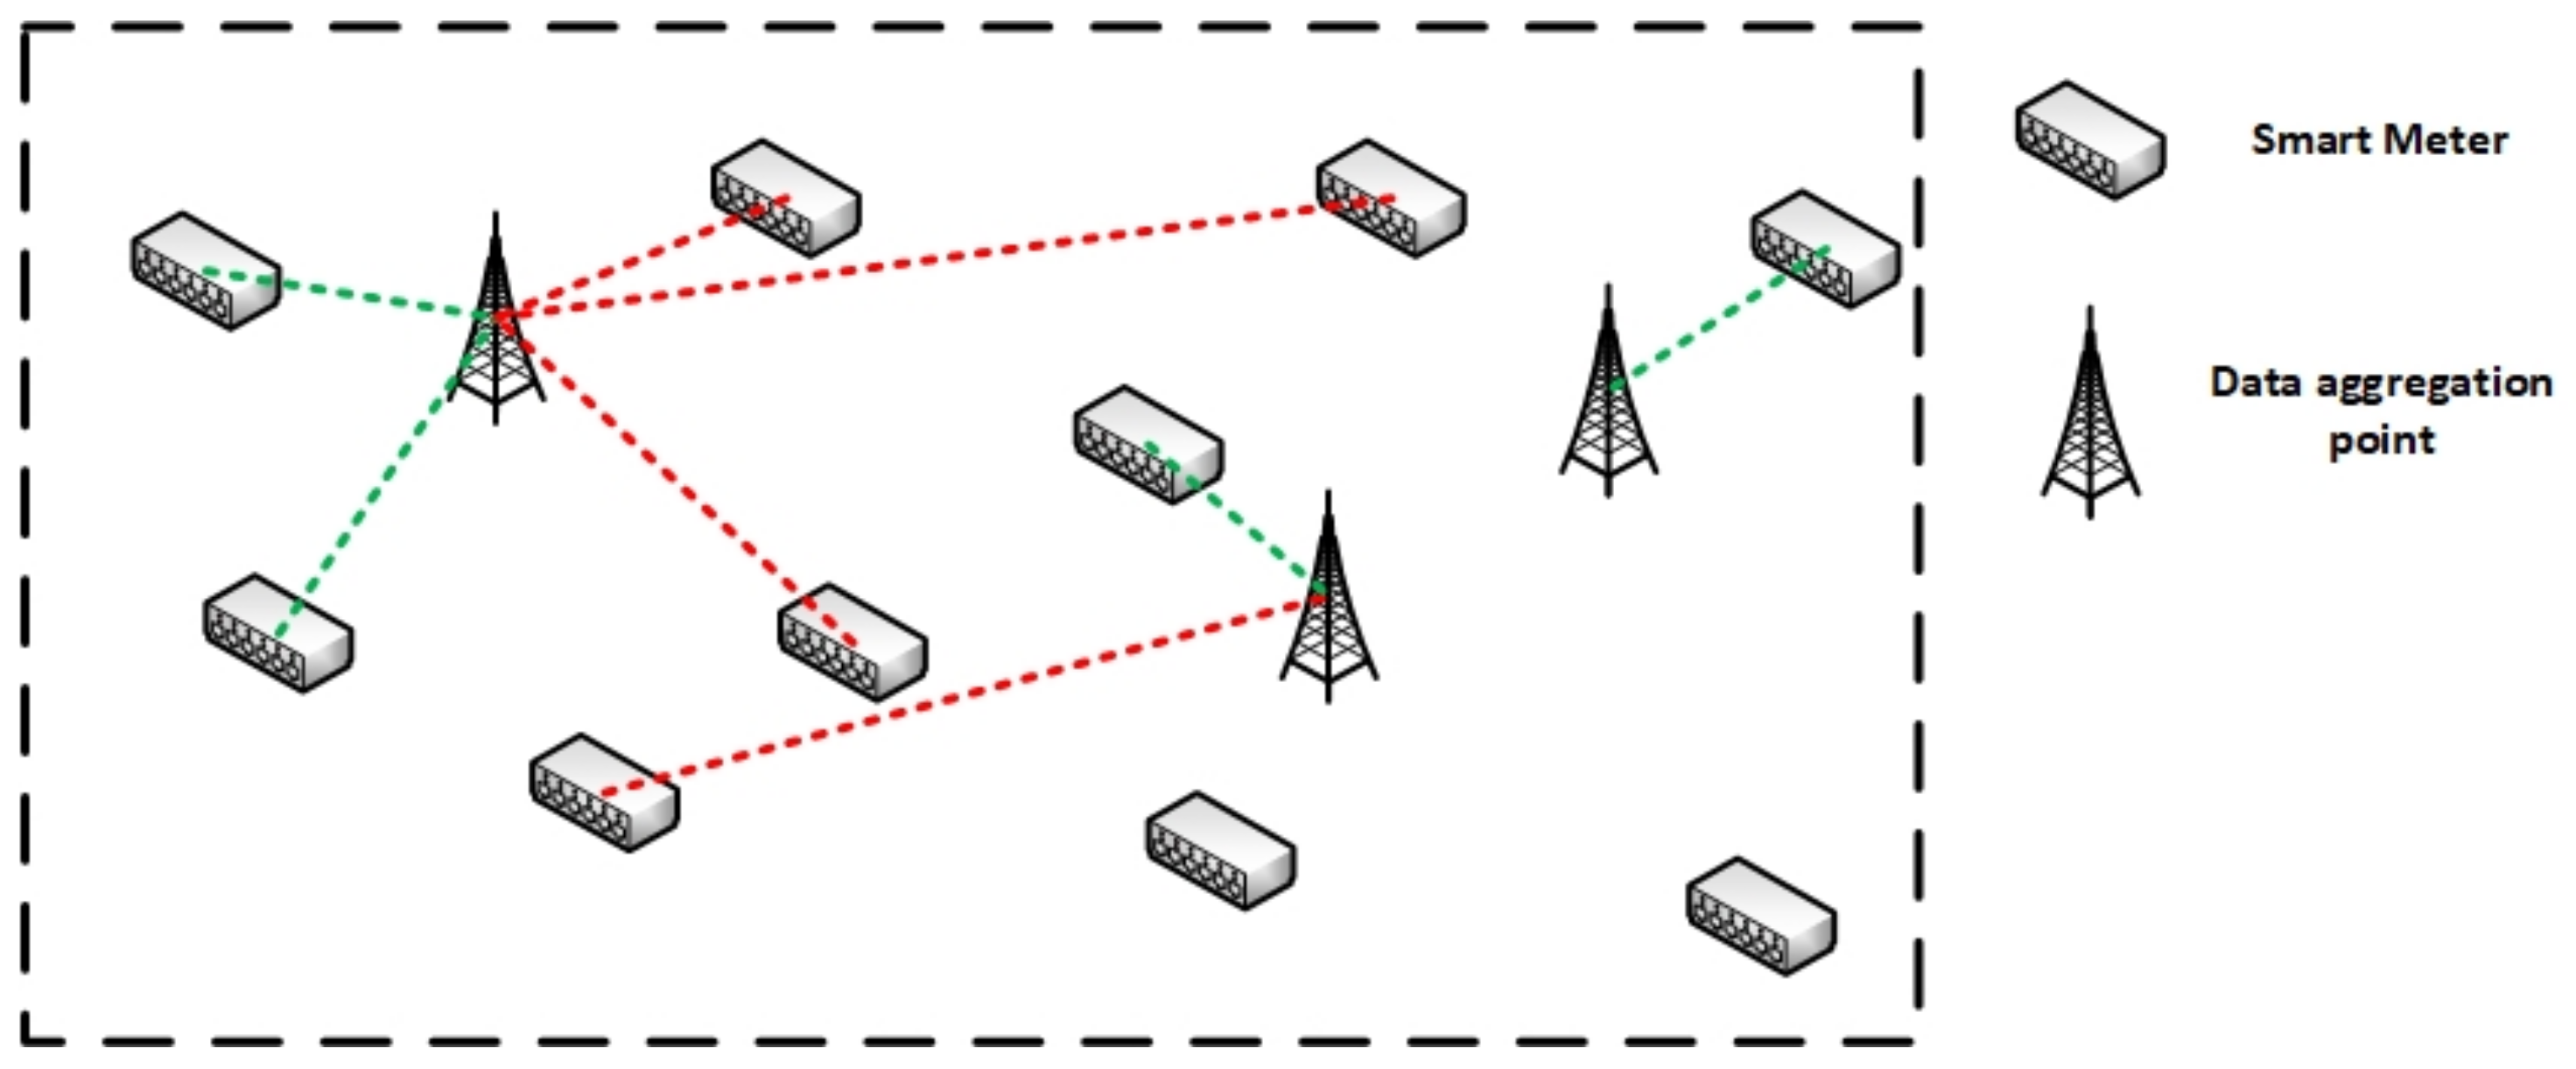
In this paper, we consider the two-dimensional geographical area
A, which consists of a random distribution of SMs and DAPs. Due to the large-scale environment of a typical AMI, the precise locations of the SMs are unknown beforehand. In this manner, the set of
DAPs and
SMs are considered to be modeled according to PPP with intensities of
and
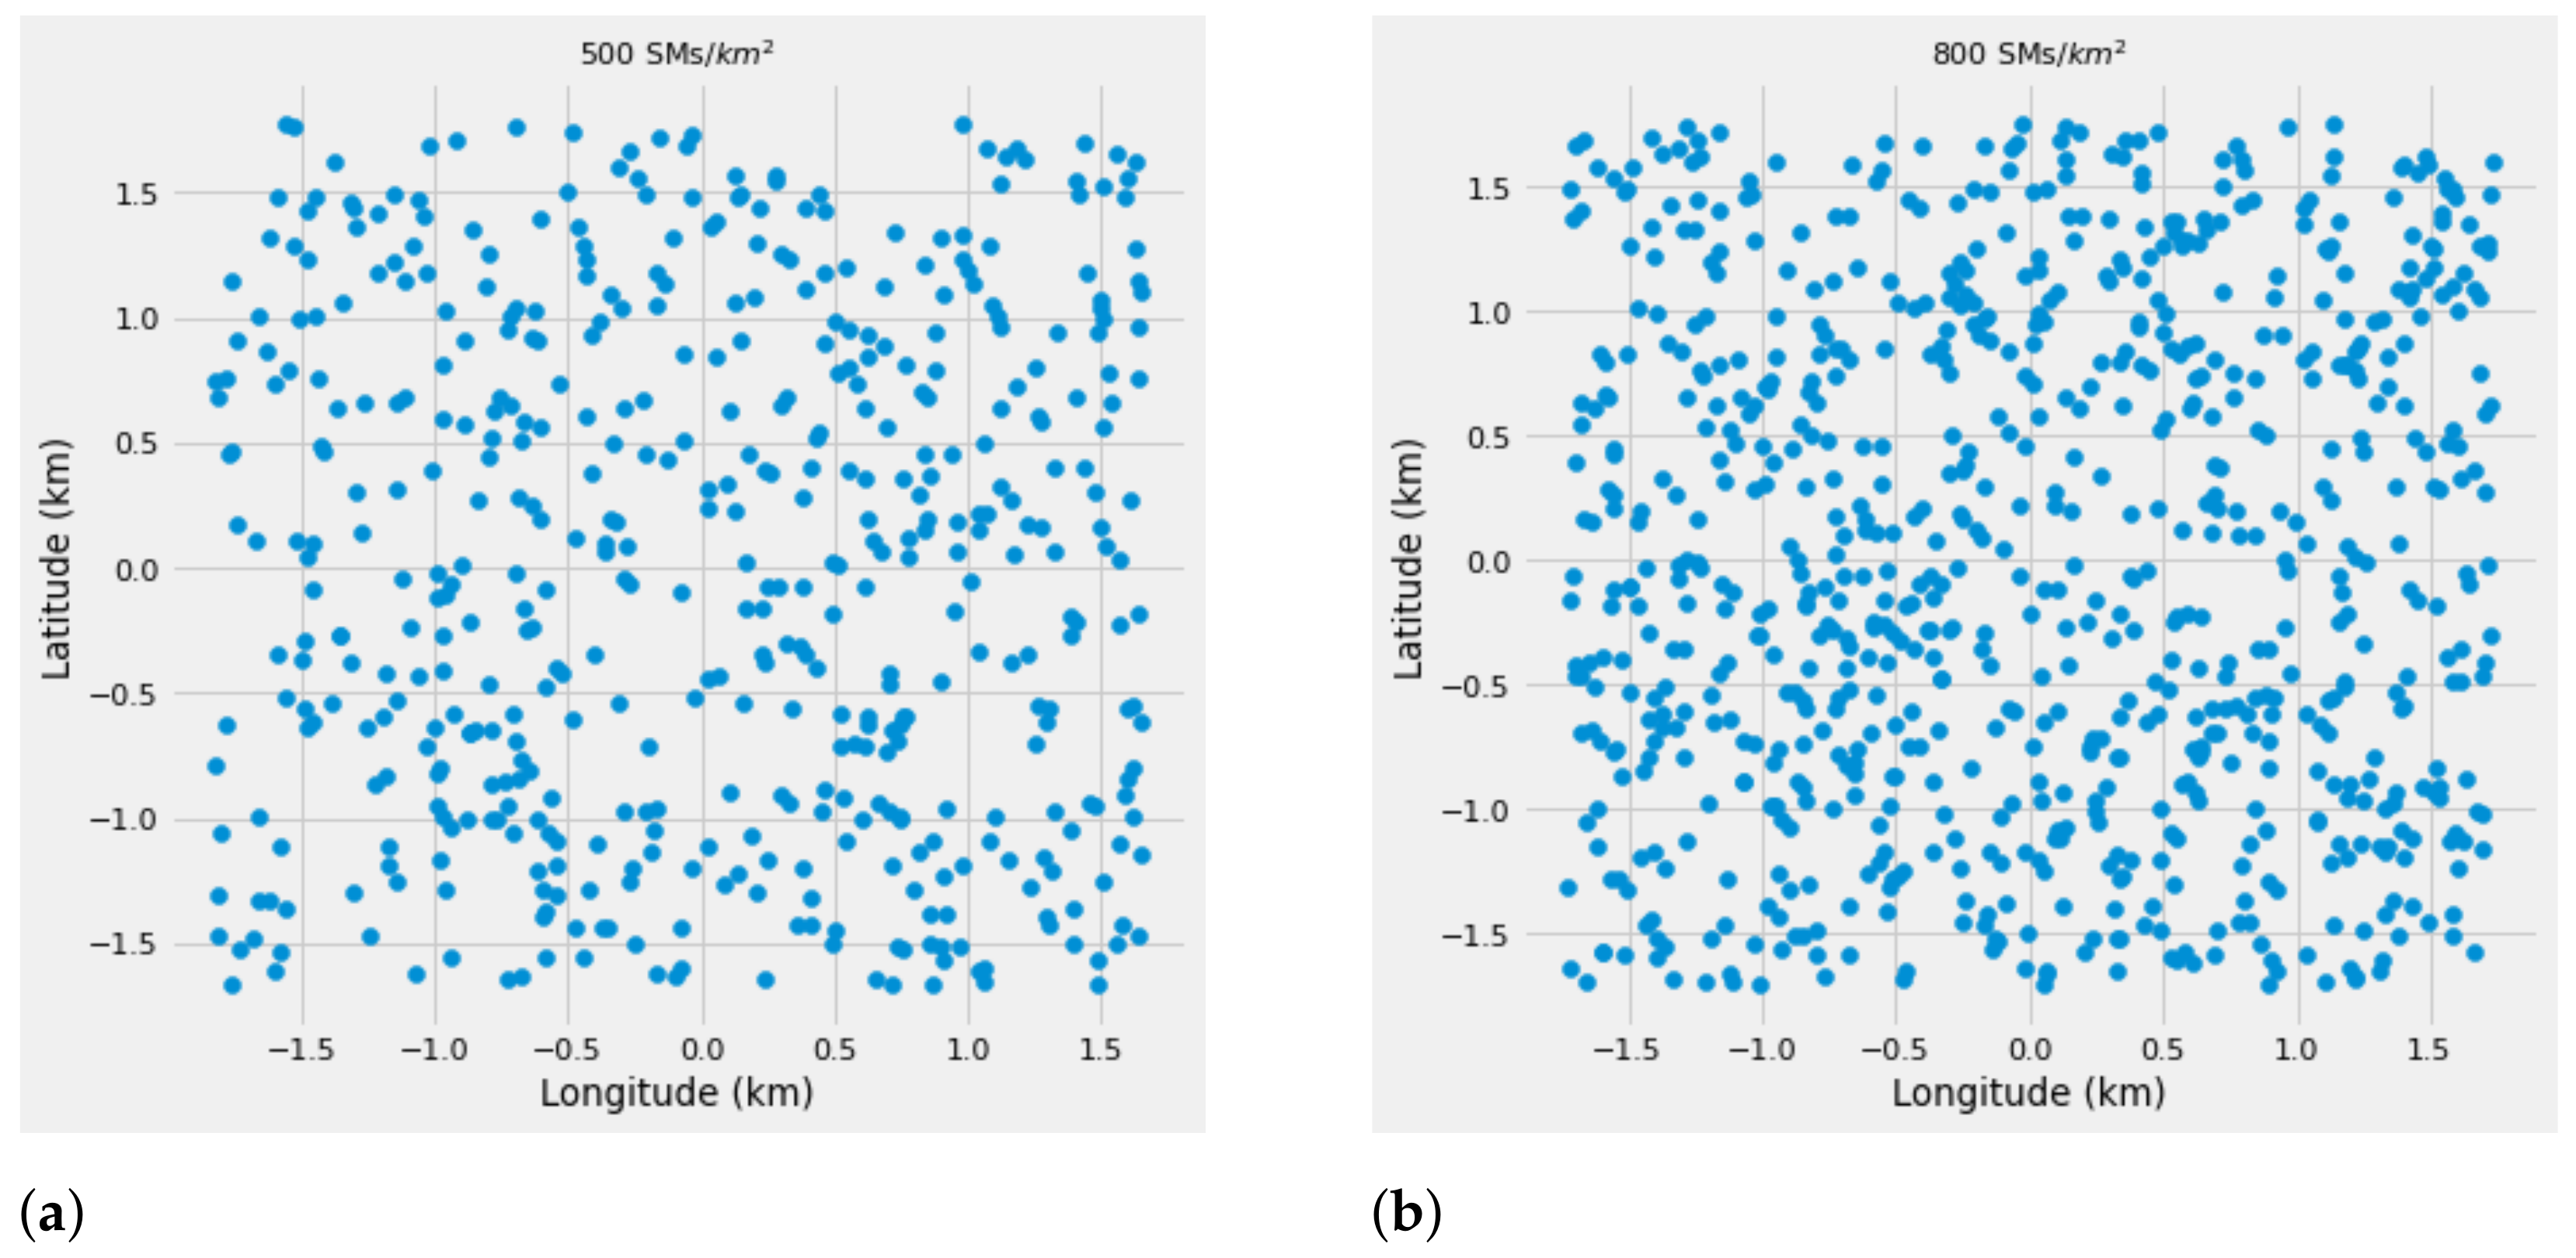
, respectively. The typical distribution of SMs according to PPP is depicted in
Figure 2. Each SM within the network is assumed to be associated with the DAP whose signal strength is the highest to achieve the desired network coverage. In this sense, we consider the location of DAP
to be denoted by
.
For simplicity, the DAPs deployed within this network are assumed to be communicating at the same time with a transmitting power of
P. For each
, we consider an SM located at
that forms a typical communication pair. In this sense, the received signal-to-interference-plus-ratio (SINR) by the SM, located at distance
r from the corresponding DAP, is given by
The distance
r may be computed as the Euclidean distance denoted by
, where
and
denotes the channel gain and the distance-dependent path loss function with the path loss exponent given by
, respectively. The channel gain experienced by the SM located at
y from its corresponding DAP at
x is assumed to follow Rayleigh fading with zero mean and unit additive white Gaussian noise (AGWN) variance [
24]. Since the DAPs within the network are assumed to be communicating at the same time, we also consider the interfering signals that may be experienced by the DAP of interest, as mathematically expressed by
. The typical link of each communication pair in the network is used to measure the coverage probability of each SM within the network as defined below:
Definition 1. Coverage probability: The probability that the SM located athas received a signal from the associated DAP located atthat is above the given threshold value τ. In other words, the SM installed within the premises may be considered to be covered by the associated DAP, if and only if the received SINR from the DAP is greater than the given signal threshold value (SINR).
In this sense, the coverage probability of an SM located at may be modeled according to Definition 1.
4. Problem Formulation
The main objective of this paper is to determine the best locations for DAPs deployment within the given
and concurrently determine the minimum number of DAPs to be deployed for the given SM’s density
. Given the locations of the SMs represented by
in
Section 3, we take
x as an input parameter of our proposed UK-means clustering algorithm borrowed from [
20]. The summary of our proposed model is presented in Algorithm 1 below. Unlike the traditional K-means clustering algorithm, which requires the number of clusters beforehand, this algorithm automatically finds the optimal number of clusters required based on the dataset given. Due to the randomness of DAPs within the dimensional space, we consider
to represent the random locations of the DAPs within the space, whose density is represented by
, as highlighted in
Section 3. Let the association problem for the
i-th SM and its corresponding
k-th DAP be formulated as the membership function
, where
is used as an indicator function and
denotes the membership matrix. In this case, the membership matrix is made up of the total number of SMs distributed on the
, denoted by
n and their corresponding cluster labels
c. Since we have knowledge regarding SM location within the
, with
denoting the reference location of the serving DAP, we can further express the association problem as follows:
where
denotes the Euclidean distance from the
i-th SM to the associated
k-th DAP. The constraint of this model is that the SM within the geographical area can only be considered to be associated with the relevant DAP if and only if its signal strength is the highest compared to other DAPs within the same geographical area. Thus, the SM is associated to the nearest DAP. To avoid the allocation of SMs to DAPs more than once, we use the indicator function −
to represent the probability of having an SM already assigned to the relevant DAP—thus, ensuring that the SM is assigned to the DAP with the highest signal strength over the neighboring DAPs on network. We further adopt the QoS requirements in terms of successful probability for information transmission with respect to network coverage to analyze the performance of the associated DAP, as defined in
Section 3.
Due to the large-scale environment of NAN, the most efficient number of DAPs is unknown; we consider any node within the dimensional space to represent the random location of the DAP
to serve as the reference point. In this context, we can consider
as the initial location of the DAP modeled as the Poisson point [
24]. This can also be derived using the d-variate model
as the average SM location information from the geographical area. This is termed as the entropy according to [
32]. Therefore, the objective function of this algorithm, which is concerned with obtaining a minimum distance between the SMs and serving DAP can be formulated as
where
is the constant and the membership for each SM within the network, which is based on the minimum distance as the objective function, is denoted by
, as defined in Equation (3). Additionally, the total number of SMs per km
and number of clusters is denoted by
n and
c, respectively. To avoid the initialization of cluster number, we consolidate the EM algorithm into the traditional K-means algorithm, which allows the computation of the groups of SMs headed by serving DAP belonging within the
k-th class. Therefore, the proportions of
can be given by
| Algorithm 1 Unsupervised K-Means Clustering Algorithm. |
- 1:
Input: Initial locations for SMs and their associating DAPs , given the initial values: t = 0, . - 2:
Output: Membership for each SM on the network and the best locations for DAPs deployment . - 3:
Randomly select K to determine the structure of the given x SMs, which serve as the initial cluster centers (DAPs). - 4:
Compute the Euclidean distance between the i-th SM and the associated k-th DAP within , . - 5:
Compare the distance values obtained in Step . - 6:
Compute the membership of all SMs using Steps and until all SMs are assigned to relevant clusters. - 7:
Divide the SMs into sets of clusters based on the highest membership. - 8:
Using , compute the initial locations of centroids and the cluster numbers . - 9:
Update the membership for all SMs after each t iteration until the termination condition of iteration is satisfied. - 10:
Compute the arithmetic mean for all the SMs belonging within the same cluster. - 11:
Update the locations for all the centroids given by the results in Step . - 12:
Using Steps (9) and (11), update the cluster number from to , discarding the neighboring clusters whose distance is very minimum. - 13:
Finally, determine and by comparing the difference between the initial number of clusters in Step (8) and the final results obtained in Step (11). - 14:
if, STOP - 15:
end if - 16:
Increment the iteration until convergence, .
|
The introduced entropy is concerned with the maximization likelihood of having an SM assigned to the relevant DAPs based on the minimum distance. As such, the maximization of
can be equivalent to the minimization of
, thus, we adopt
as our next entropy term. This yields to the objective function of the UK-means clustering expressed as
where
and
can be used as the learning parameters of the proposed algorithm. Based on the objective of our proposed scheme, which is concerned with determining the candidate locations of the DAPs at the minimum QoS from SMs, we can use these two parameters to learn the data traffic within the network, which is proportional to the QoS requirements. By reducing the packet delay, which can be achieved at minimum distance, we can use
in this instance, whereas
can be used to ensure the successful transmission probability of the data packet sent within the obtained minimum distance at minimal to zero packet error probability. Therefore, the Lagrangian of
with constraint of
can be formulated as
With all the SMs within the dimensional space assigned to their relevant clusters headed by centroid, we can now calculate the arithmetic mean of all the SMs clustered around each centroid. Therefore, the candidate location of the DAP along with the new membership of the SM after each iteration can be formulated by taking the partial derivative of Equation (
6) with respect to
,
, and
. Firstly, we let the derivative to be equated to zero:
This yields
where the parameter
can be given as
Substituting Equation (
9) into Equation (
7), the left-hand side of Equation (
7) results in
With the candidate locations of the DAPs given by the
, we can now update its best location by computing the arithmetic mean of all the SMs surrounding the DAP denoted by
. Therefore, the updated location of the
k-th DAP may be expressed as
To avoid assigning the SMs to the DAP with the lowest signal strength, which is located far away, the SMs are further subdivided into clusters to ensure that each cluster consists of the SMs with the highest membership. This implies that the SMs belonging within each cluster should be as close as possible. Therefore, the updated membership of each SM after each iteration can be given as
Based on the updated equations formulated in Equations (
11) and (
12), representing the membership of all SMs within the given area and the candidate locations of the DAPs, we can now estimate the desired number of clusters for the given SM density
as follows:
where
t denotes the iteration number and
represents the maximum capacity of SMs that the DAP has been assigned after each iteration. When the assignment of SMs to the relevant DAPs along with their candidate locations have converged, we can now denote the best location of the DAP, where the network coverage probability, as highlighted in Definition 1, is satisfied.
5. Simulation and Performance Evaluation
The network coverage is a reliable performance metric that has been used to analyze the performance of wireless networks. Using the network coverage, in this paper, we consider a
dataset that consists of two features (latitude and longitude) to represent the locations of the SMs on a given geographical area. In addition, an area of
km
is designed as the testing bed for finding the best locations for DAPs deployment, where all the SMs are covered within their transmission range. For the purpose of analysis, the different SM densities per km
have been considered,
and
, as depicted in
Figure 3.
The main objective of this paper is to determine the best locations for DAPs deployment, where the efficient number of DAPs may be required to cover all the SMs within their communication distance. Firstly, an initial value of K as highlighted in Step (3) of the summarized framework has been given
to determine the initial structure of the given SM’s density. In this sense, the initial number of clusters is determined from the initial structure, which also gives the initial locations of the centroids denoted by
. The method of the Euclidean distance is employed to compute the distance between the
i-th SMs and the corresponding
k-th DAP.
Figure 4 shows the analytical results when
SMs. From the distance values obtained, all the SMs within the network denoted by the random points are assigned to the nearest cluster. For each cluster, the arithmetic mean is computed to determine the candidate locations for centroids (DAPs),
. The maximum iteration number of
, to iteratively search for the best locations for DAPs deployment by updating the membership of each SM through the membership function
, and also the efficient number of clusters suitable for the given
.
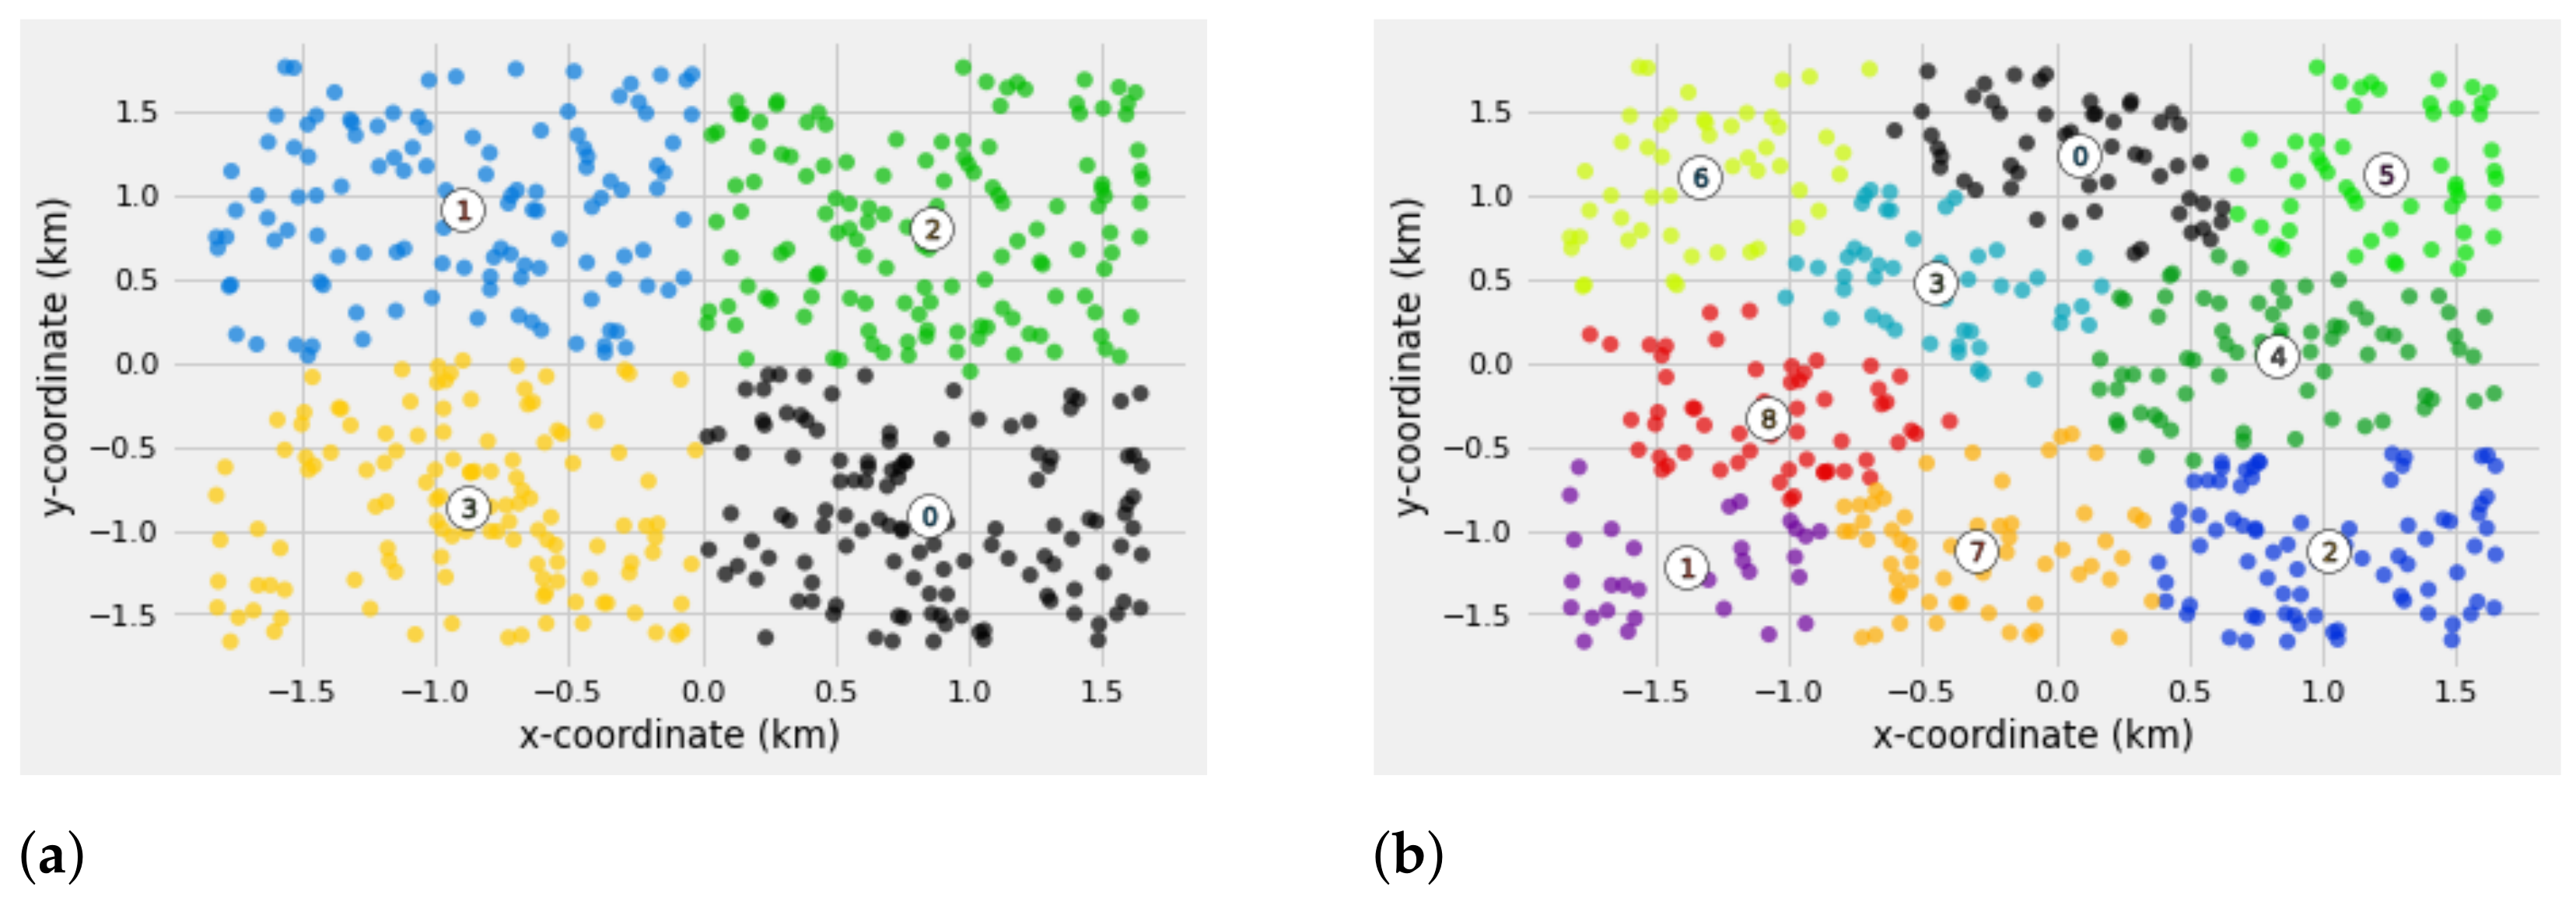
Figure 4 illustrates the analytical results of
and
for
SMs/area. The memberships for each SM are distinguished by different colors with the DAP locations and their corresponding labels denoted by the numbers. From the simulation results, it can be seen that when
, the SM capacities assigned to each cluster are more or less the same. This implies that the number of SMs assigned to each other are balanced. Whereas, for
, the probability of having an SM assigned to the wrong cluster is high as it can be seen on the cluster labels (0, 4, and 5) that there is overlapping of clusters.
However, the results of this will be validated through the silhouette analysis method.
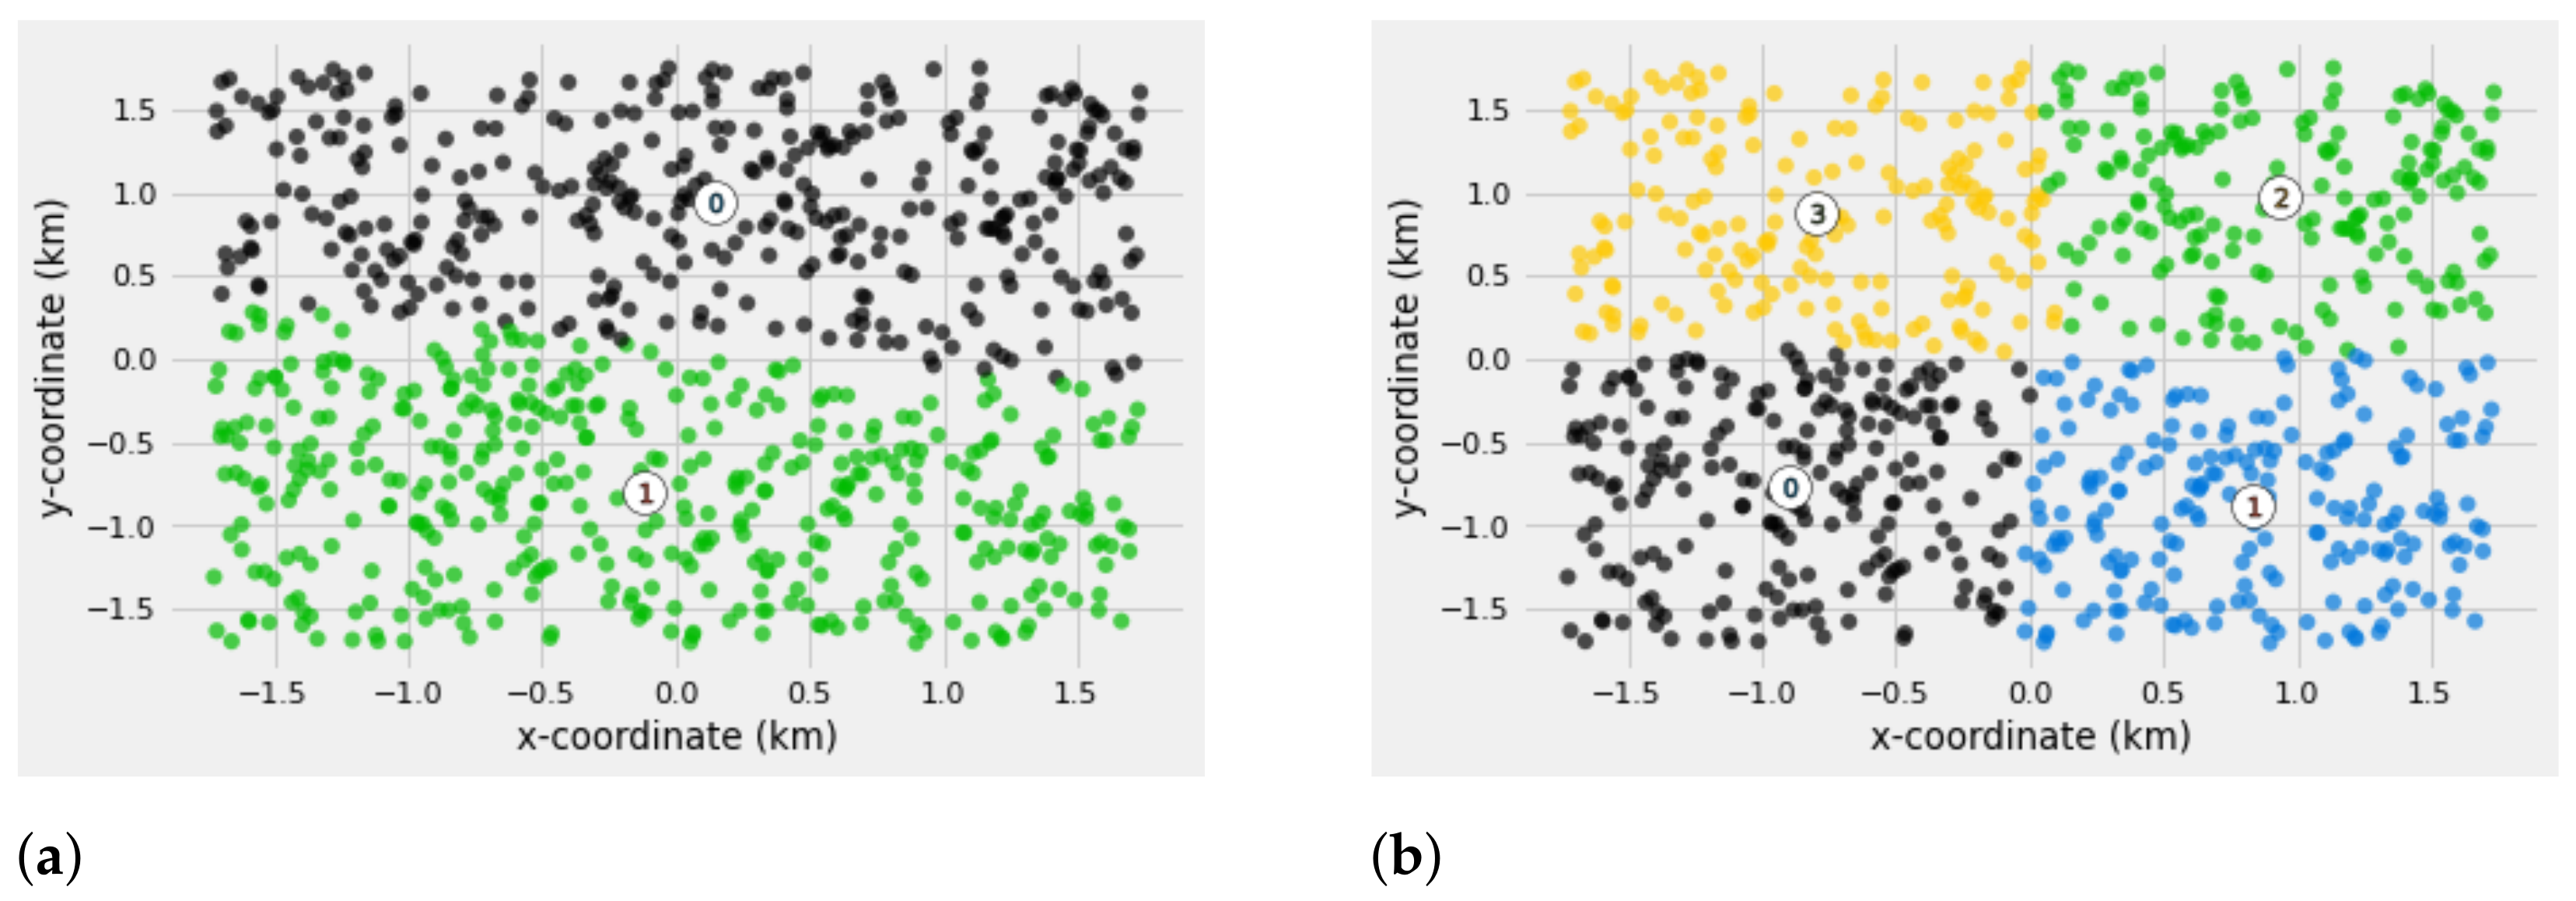
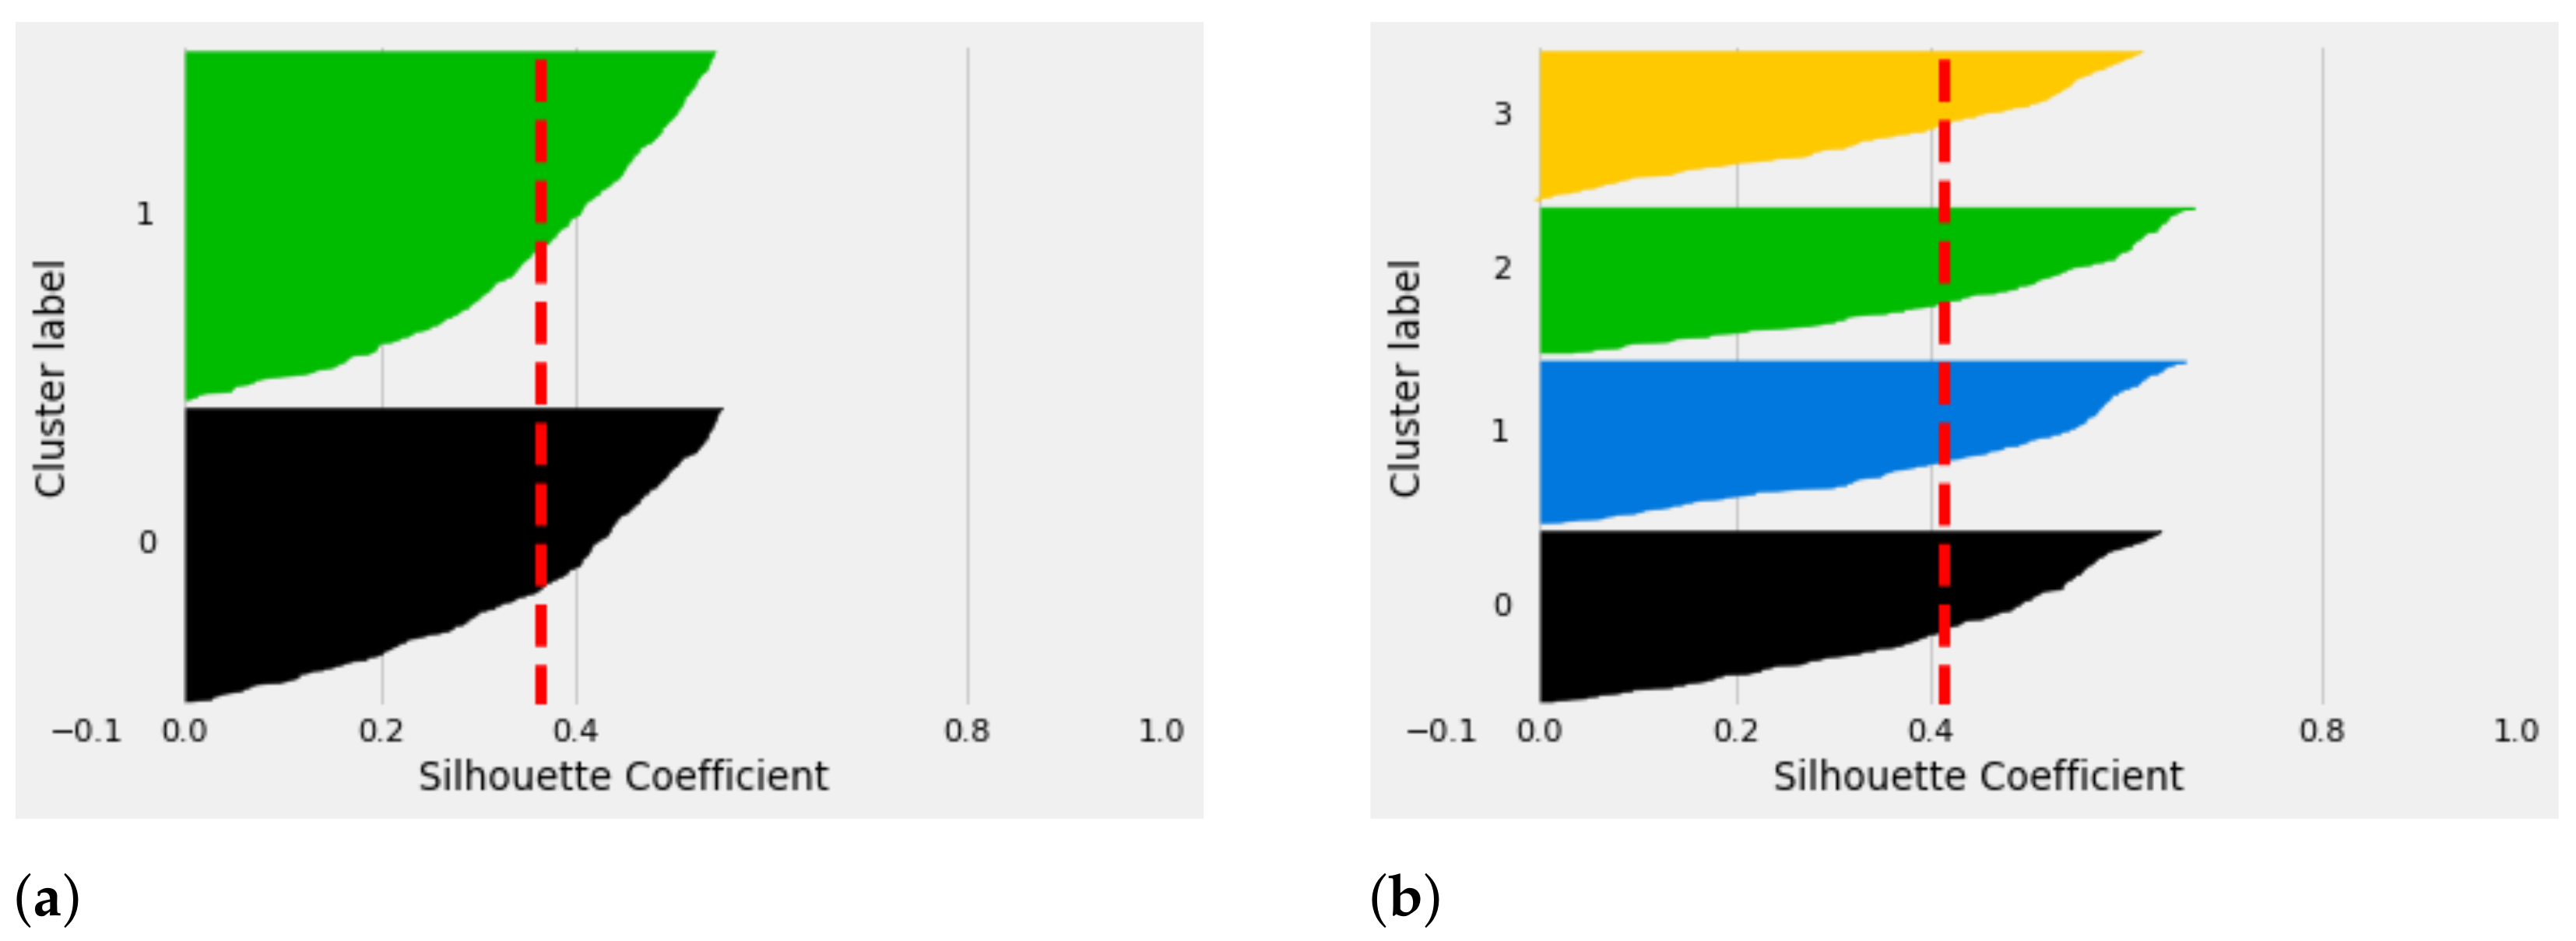
Figure 5 illustrates the structure for a given SM density of
when
and
, respectively. From the simulation results, both results are satisfactory as there is no overlapping of the clusters and the SM capacities for all the clusters are balanced.
To analyze the effectiveness and satisfaction for each SM’s density, as illustrated in
Figure 4 and
Figure 5, in terms of the number of clusters in Equation (
13) and the optimal locations for each centroids as defined in Equation (
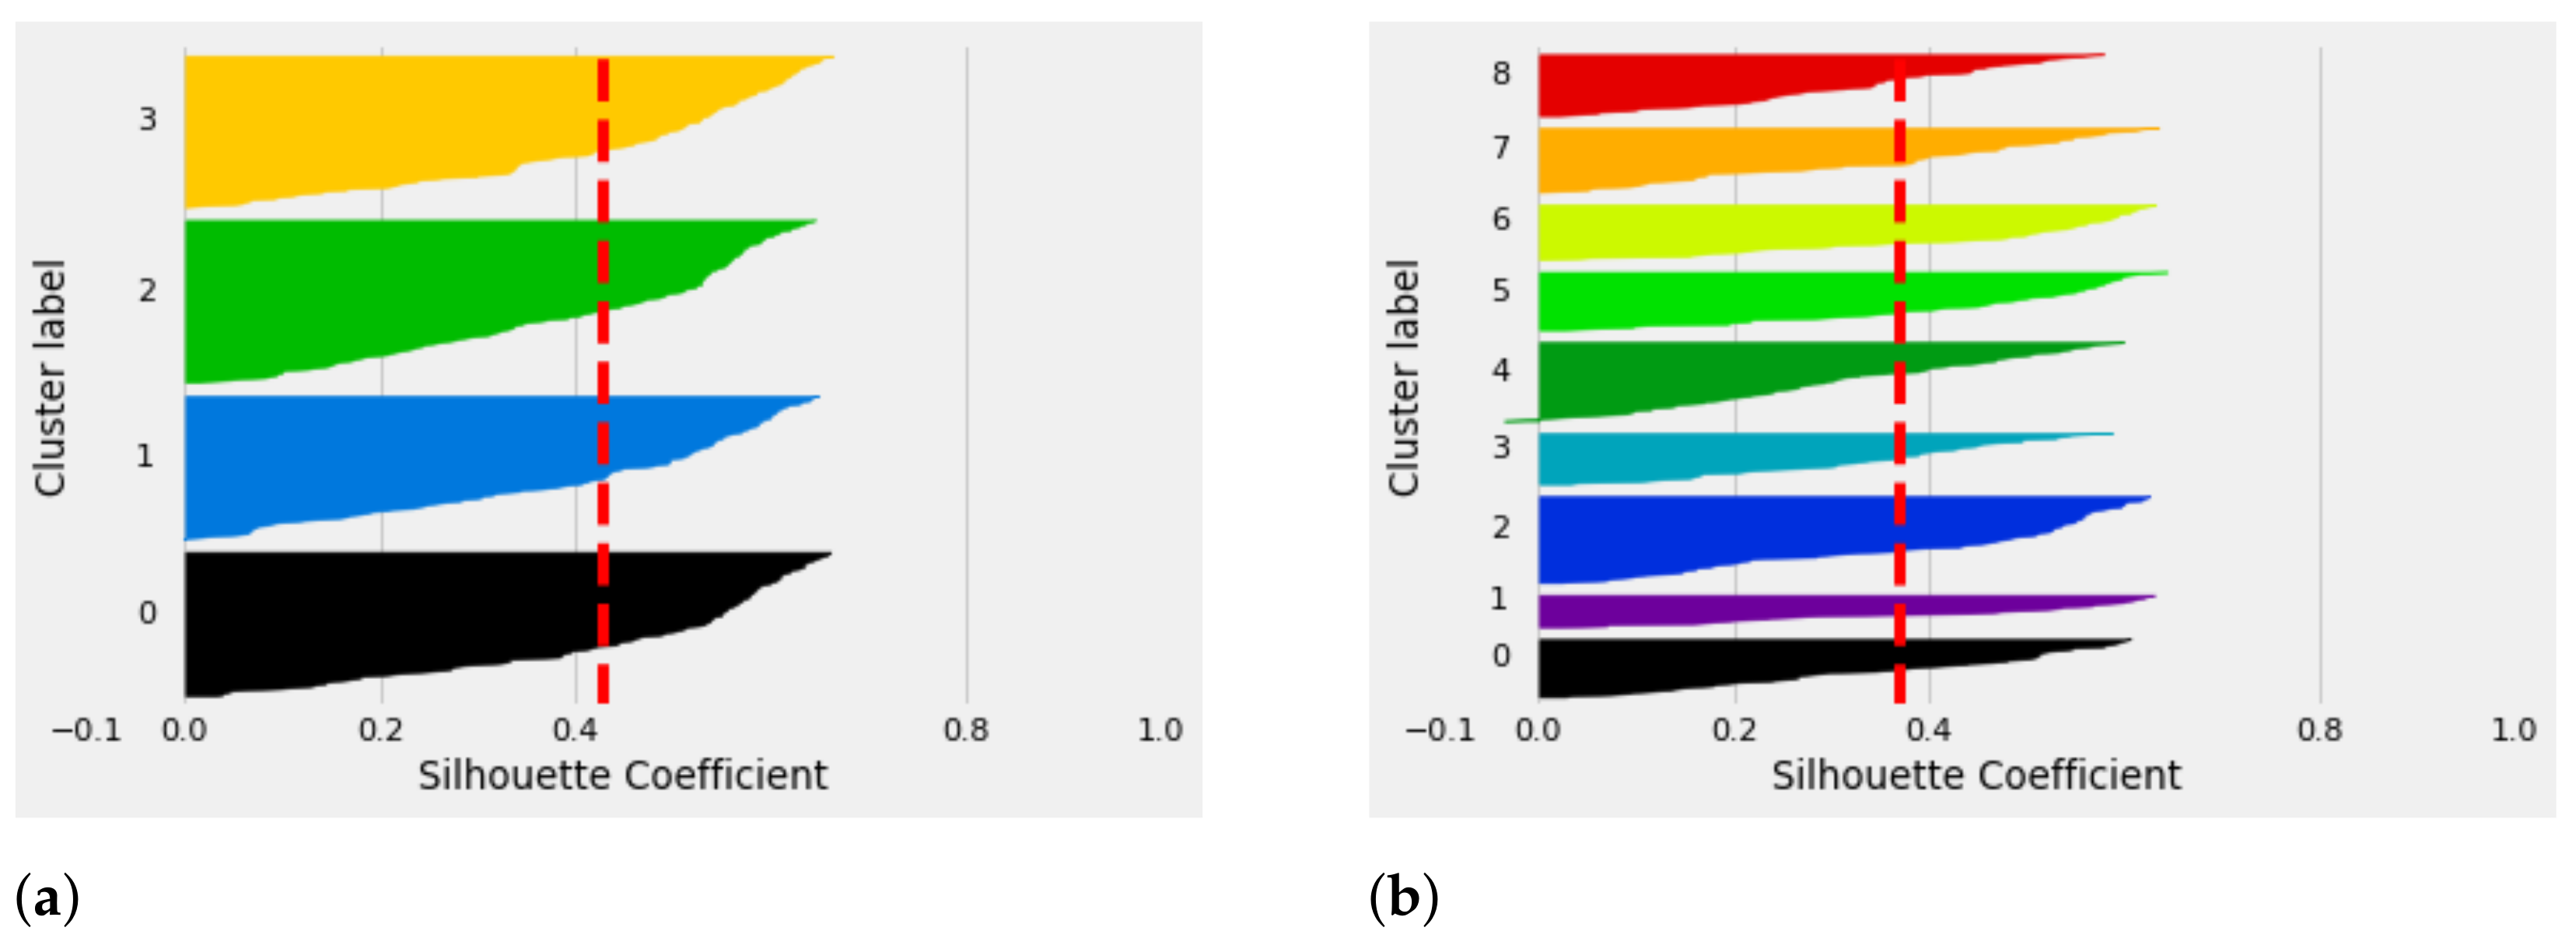
11), the UK-means clustering algorithm with the additional silhouette index is employed. The analytical results, as depicted in
Figure 6a,b, show the efficient results when
compared to when
. The silhouette index method is concerned with validating the accuracy of the clustering results, i.e., by analyzing the membership of each SM within the assigned cluster with respect to the neighboring clusters. In this sense, the silhouette coefficient is computed to determine how close the
i-th SM is to the SMs belonging within the same cluster and how far it is from the SMs belonging within the neighboring clusters. The silhouette coefficient is computed to measure the goodness in the membership of each SM within the network. From the analytical results depicted in
Figure 6 of
with the cluster label of 4, there are outliers that show there are SMs that have been wrongly assigned to cluster number 4. In addition, this may degrade the performance of the network, as those SMs may not be covered by their corresponding DAP. As a result, the communication infrastructure leads to the communication delay. In summary, for a 500 SM density, 4 DAPs may be efficient to meet the coverage probability requirement for each SMs within the dimensional space with full connectivity guaranteed.
In
Figure 7, the analytical results for
is illustrated. From the silhouette plot, for
, both
and
indicate efficient results. In this sense, we may conclude that for 800 SMs, the number of DAPs required to meet the network coverage probability for each SM may range between
.


