Article

A VSG-Based Coordinated DC Voltage Control for VSC-HVDC to Participate in Frequency Regulation

1
Sichuan Energy Internet Research Institute, Tsinghua University, Chengdu 610213, China
2
New Energy (Photovoltaic) Industry Research Center, Qinghai University, Xining 810016, China
3
Department of Electrical Engineering, Tsinghua University, Haidian District, Beijing 100084, China
4
Electric Power Research Institute, State Grid Sichuan Electric Power Company, Chengdu 610072, China
*
Author to whom correspondence should be addressed.
Energies 2021, 14(9), 2712; https://doi.org/10.3390/en14092712
Submission received: 29 March 2021 / Revised: 26 April 2021 / Accepted: 7 May 2021 / Published: 9 May 2021

Abstract

:
In this paper, a coordinated DC voltage control strategy is proposed based on the VSG (virtual synchronous generator) method for the VSC-HVDC transmission system to participate in the frequency regulation of the connected weak grid. The voltage and power control capability of the VSC-HVDC is explored to attenuate the rate of change of frequency and to diminish the deviation of frequency. This is realized by the coordinated control of DC voltages at both the sending and the receiving ends with the VSG method. A small-signal model is established to investigate the dynamics of the control system. A tuning method for the selection of control parameters is also discussed in detail. The validity and superiority of the proposed control strategy are tested in the scenarios of sudden load changes and short circuit faults.

1. Introduction

Nowadays, developing renewable energy is widely accepted as a solution to the worldwide energy crisis and carbon emission issue. However, the abundant renewable energy resources, such as large-scale wind farms and photovoltaic plants, are mainly located far away from the centers of consumption. For example, in China, the renewables are mainly distributed in the West and North, while the major load centers are located in Eastern and Central [1]. To facilitate power allocation, the technology of remote and bulk power transmission is advocated. The voltage source converter high voltage direct current (VSC-HVDC), emerges as one of the most potential technologies because of its flexibility in independent active and reactive power control at each end, and will no doubt gain more and more application in the future [2,3,4].
With the penetration of renewable energy increases constantly, some grids will be mainly supplied by the renewable resources connected with VSC-HVDC transmission. However, because the renewable energy power station and the grid are decoupled by the VSC-HVDC system, the grid frequency variation could not be sensed by the renewable energy power generators even though they possess the energy reserve for frequency regulation [5,6]. In this situation, immediate frequency support might not be available when a disturbance emerges.
Several novel ancillary control strategies are proposed to enable the frequency regulation capability of the VSC-HVDC systems [7,8,9,10]. To provide an inertial response for the grid, the energy stored in the capacitor of HVDC transmission is exploited. When a sudden increase in power demand occurs, the voltage of the capacitor is forced to decrease to release its energy, which is used to compensate for the power vacancy and mitigate frequency variations [11]. However, the stability of the DC part may be threatened if the capacitor voltage decreases too much to make up for the massive power shortage. Increase the capacity of the capacitor may be an effective tradeoff, but it will render incremental cost. To overcome this deficiency, the idea of blending the energy stored in the HVDC link and the energy reserved from the remote power station is put forward in [12]. The DC voltage is decreased to release energy for an inertial response, and the voltage deviation is detected by offshore wind farms, which will adjust their active power output to recovery the DC voltage. Similar work can be found in [13,14,15]. Recently, the VSG (virtual synchronous generator) method, which could mimic the operating mechanism of synchronous generators, is attracting more and more concerns in the control of voltage source converters [16,17]. In [18,19], the VSG method is introduced into the control of the convert at the sending end of the VSC-HVDC. When the grid frequency changes, the output power of the VSC station will adjust accordingly to slow the rate of change of frequency and reduce the frequency deviation.
However, in the literature above, little attention has been paid to the interaction between the AC part and the DC part of VSC-HVDC. Actually, the DC voltage fluctuation caused by AC side variation will affect the output power of the VSC-HVDC, making it hard to output the exact power needed for frequency regulation. Besides, if the DC voltage decreases too much and even exceeds the safety range, the system stability may be threatened. Some methods consider the DC voltage variation, but they only compensate it to the nominal value when it decreases too much. These methods could guarantee the stability of the DC part, but fail to fully exploit the potentiality of the VSC-HVDC transmission system in frequency regulation.
Motivated by the aforementioned limitations, this paper proposes a novel coordinated DC voltage control strategy, whose main features, compared with those already work, include:
  • A coordinated control strategy is proposed to improve the response speed and capability in frequency regulation by adjusting DC voltage both at the sending and the receiving end.
  • A method to design the transmitted power reference for frequency regulation by analyzing the process of traditional power system frequency regulation.
  • An optimization model is built to derive the DC voltage reference for transmitted power adjustment.
  • The small-signal model of the system is established to investigate the system dynamics and to select the tuning control parameters.
This paper is organized as follows. The calculation method of transmitted power by VSC-HVDC for frequency regulation and the advantage of adjusting DC voltage at both ends are analyzed in Section 2. The detailed coordinated DC voltage control strategy is presented in Section 3. In Section 4, the small-signal model of the system is established and the tuning methods of the control parameters are discussed in detail. Time-domain simulation results are given in Section 5 to verify the feasibility and validity of the proposed strategy, and the conclusions are given in Section 6.

2. Problem Formulation

2.1. VSC-HVDC Control in Frequency Regulation

The typical topology of VSC-HVDC is shown in Figure 1. On the grid side, the load is supplied by two synchronous generators and a VSC-HVDC transmission system. When power mismatch occurs, e.g., a load is added to the system, the rotors of SGs will decelerate because the electromagnetic power is getting larger and exceed the input mechanical power, this deceleration process will release the kinetic energy stored in the rotors, and the energy released by the deceleration of rotors can be calculated as [20]:
P inertia = J eq ω d ω d t
The frequency may deviate from its nominal value even though the rotors decelerate to release their kinetic energy. To prevent the frequency from deviating seriously, the prime mover of the synchronous generator will take urgent measures to adjust the input mechanical power to balance the power generation and consumption to recover the frequency. The added power for frequency regulation is proportional to the frequency deviation, which can be expressed as [20]:
P prime = K ( ω ω 0 )
The Pinertia and Pprime represent the active power caused by the inertial response and prime frequency regulation respectively, and ω and ω0 are the actual and rated angular frequency of the grid. Jeq and K is the equivalent inertia and droop coefficient.
One feasible way for the VSC-HVDC transmission system to participate in frequency regulation is that it alters its transmitted power depending on the frequency variation of the weak grid, and two terms should be considered. One of them is the inertial response, which is proportional to the rate of change of frequency (ROCOF), and the other one is proportional to the error of the frequency (EOF), which emulates the primary frequency control. Hence, the calculation for power reference P* could be designed as
P = P 0 K I f d f d t K P ( f f 0 )
where P0 is the transmitted active power in steady-state. The KI characterizes the inertia of the VSC-HVDC, and the KP represents the primer frequency regulation ability of VSC-HVDC. The tuning methods of them are shown below.
The inertia time constant TJ is widely used to characterize the synchronous generator, which is defined as
T J = J SG Ω 0 2 2 S n
where JSG is the moment of inertia of synchronous generator rotor; Ω0 is the rated speed of the rotor; Sn is the rated capacity of synchronous generator.
If the number of pole-pairs is p, the relationship among the electric angular speed ω, the angular speed of the rotor Ω, and power system frequency f can be expressed as
ω = p Ω = 2 π f
The kinetic energy stored in the rotor of the synchronous generator is
E k = 1 2 J SG Ω 2
When frequency changes, the power released by the rotor can be calculated as
P = d E k d t = J SG Ω d Ω d t = 2 T J S n f 0 2 f d f d t
where f0 is the rated frequency. By analogy to (3), the KI could be chosen as
K I = 2 T J S n f 0 2
For synchronous generators, the typical value of TJ is 2–10 s, which is a reference for the tuning of KI.
Assume the maximum of allowed frequency deviation is Δfmax, and the maximum of power of VSC-HVDC transmission system for frequency regulation is ΔPmax. The KP could be chosen as
K P = Δ P max Δ f max

2.2. Advantages of Coordinated DC Voltage Control

Assume the VSC stations and transformers in Figure 1 are ideal and lossless, and the loss of reactor could be neglected, the transmitted active power from renewable energy generators to the weak grid could be calculated as
P = V dc 1 V dc 2 2 R V dc 2
The transmitted active power is depending on the DC voltages of the VSC1 station and VSC2 station, and control Vdc1 or Vdc2 to make the transmitted active power trace the power reference P* may be feasible. However, adjust Vdc1 or Vdc2 alone may limit the potential of frequency regulation or render a slow response. Concretely speaking, suppose the DC voltage of VSC1 station and VSC2 station in steady-state is V dc 1 0 or V dc 2 0 , and the safety range of them are [ V dc 1 L , V dc 1 H ] and [ V dc 2 L , V dc 2 H ] respectively. The maximal power for frequency regulation in different condition are
{ P 1 max = V dc 1 H V dc 2 0 2 R V dc 2 0 , adjust V dc 1 alone P 2 max = V dc 1 0 V dc 2 L 2 R V dc 2 L , adjust V dc 2 alone P 3 max = V dc 1 H V dc 2 L 2 R V dc 2 L , adjust both V dc 1 and V dc 2
It is obvious that P 2 max P 3 max with respect to V dc 1 0 V dc 1 H . To compare P 1 max and P 3 max , the partial derivative of P with respect to Vdc2 is calculated
P V dc 2 = V dc 1 2 V dc 2 2 R
Generally, R is very small and Vdc1 is approximately equal to Vdc2, so ∂P/∂Vdc2 < 0, yielding that P 1 max P 3 max with respect to V dc 2 L V dc 2 0 .
Besides, adjusting both Vdc1 and Vdc2 will accelerate the adjustment of transmitted active power, leading a fast response in frequency regulation. Hence, the coordinated DC voltage control is adopted in this paper.

3. Control Strategy Design

3.1. VSG-Based DC Voltage Control Scheme

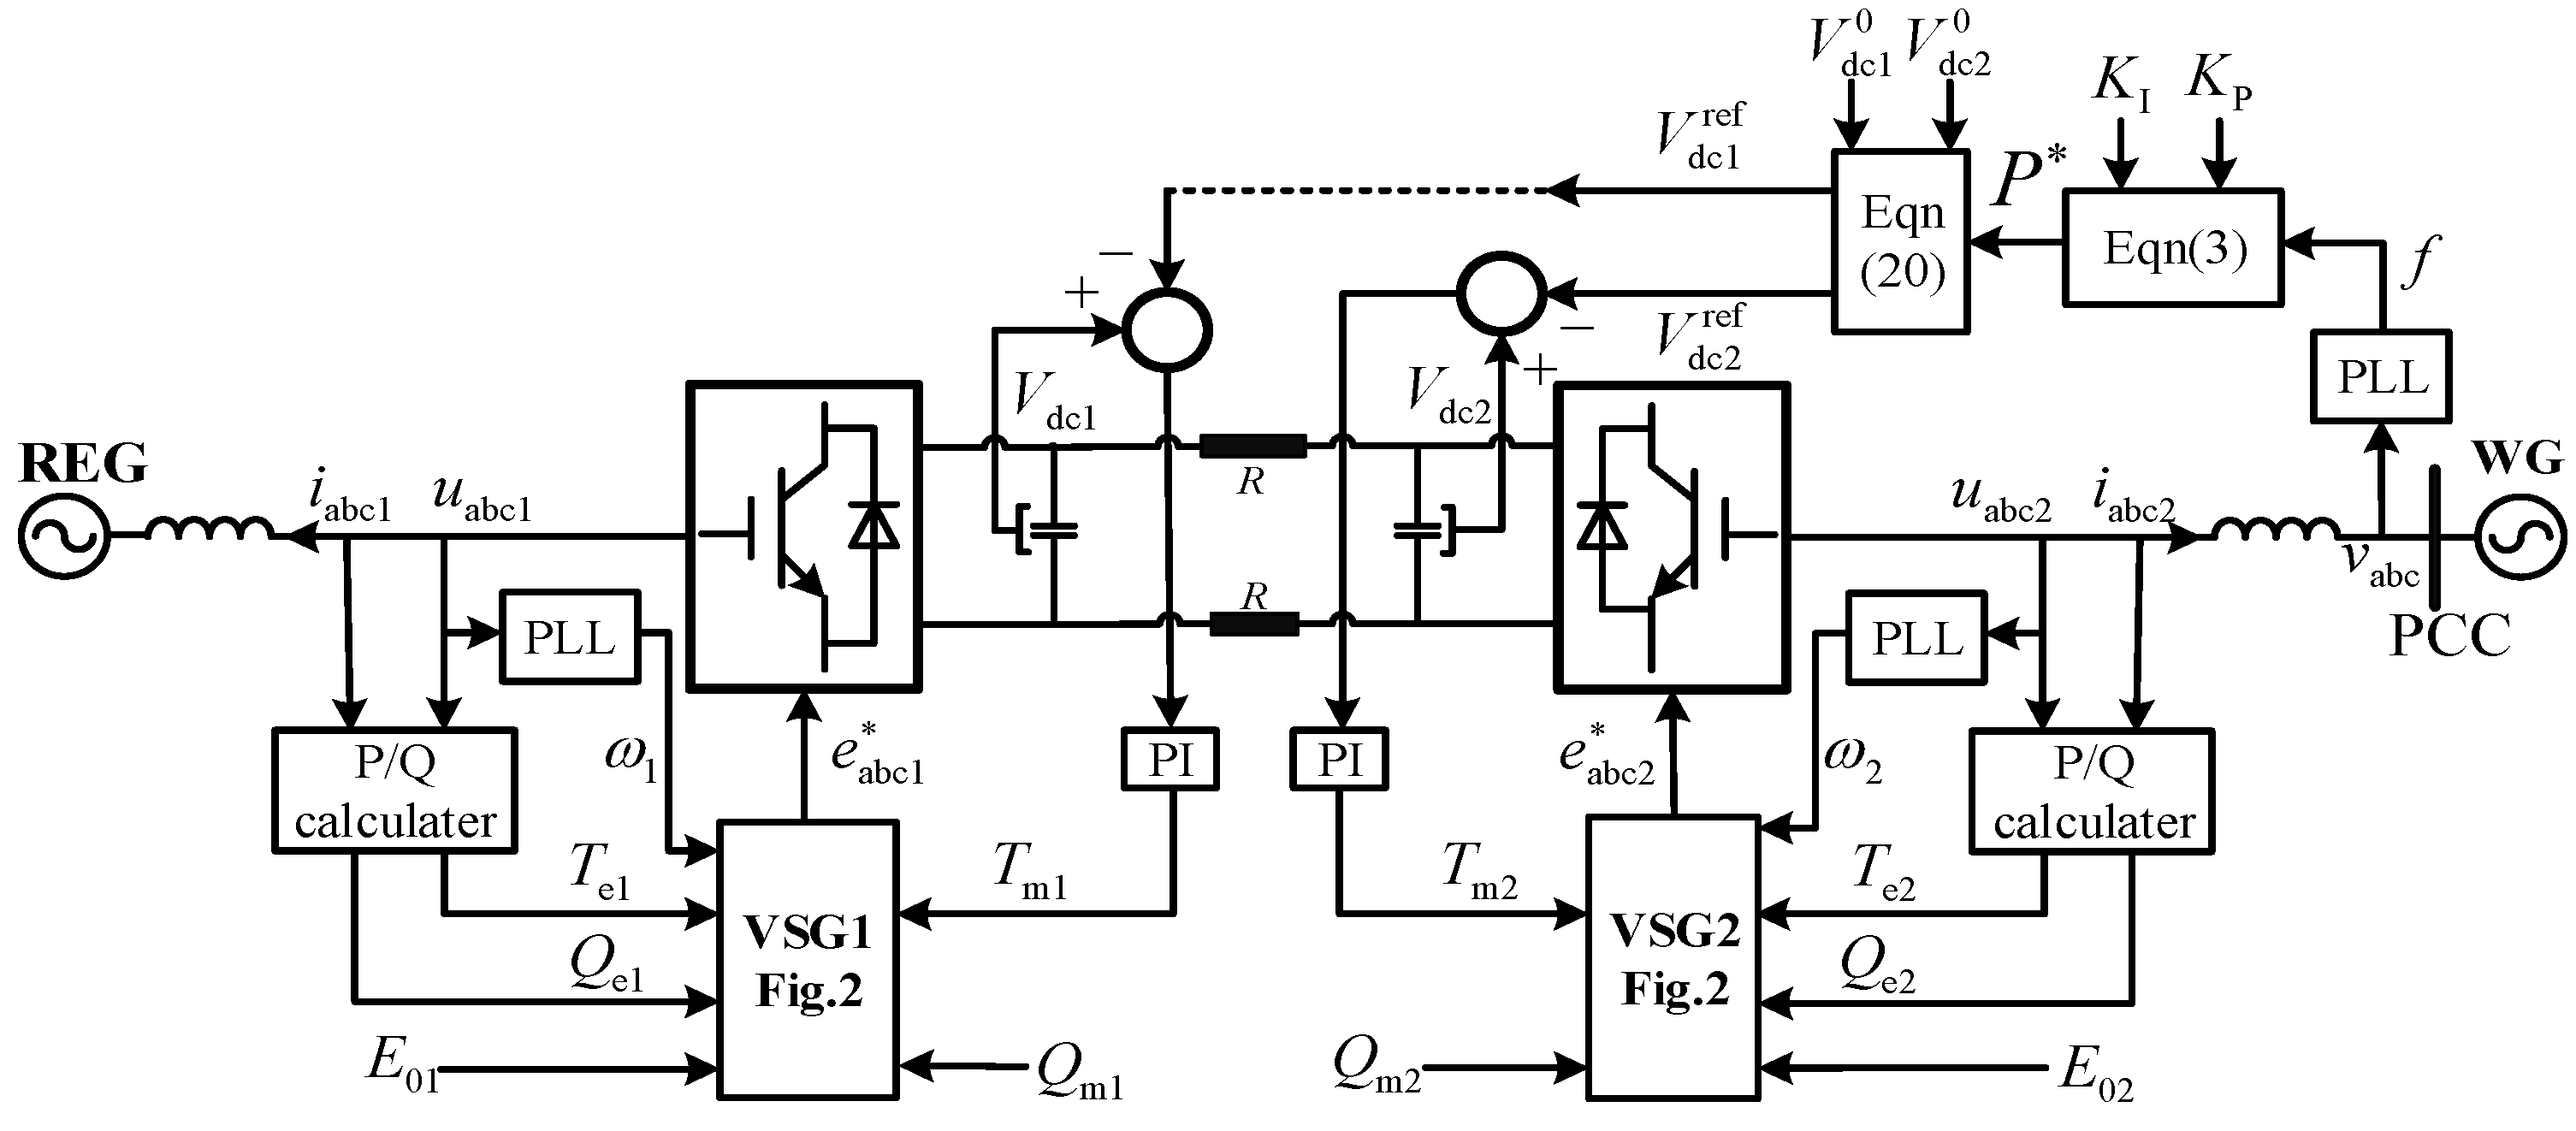
The VSG method has the good property of power tracking since the control parameters could be adjusted flexibly. In this paper, the second-order VSG is utilized to realize the DC voltage tracking, and the typical control diagram is shown in Figure 2 [19].
Where Tm is input torque, and Te is electromagnetic torque; δ and ω are power angle and angular frequency of VSG; J is the virtual inertia and D is the damping factor. Uref and U are the reference and the measured value of AC voltage; Qref and Qe are the reference and the output of reactive power; Kv and Kq are the coefficients of voltage and reactive power, respectively.
The DC voltage is related to the active power, which mainly depends on the power angle deviation between the VSC station and AC system. This deals with the P-f control of VSG, which could be expressed as
{ d δ d t = ω J d ω d t = T m T e D ( ω ω 0 )
To control the DC voltage of the converter to track the given value, the proportional-integral (PI) controller is introduced to generate the Tm, and the systemic control diagram is shown in Figure 3.
The frequency of the weak grid could be obtained through the voltage vabc at the point of common coupling (PCC) with PLL, which is used to calculate the active power reference P* by Equation (3). Then, the DC voltage references are calculated according to Equation (20). Since these processes are implemented in the receiving end, the V dc 2 ref could be used to generate the input torque for VSG2 directly. While the sending end VSC station is far away from the receiving end, the communication infrastructure will be introduced to transmit the V dc 1 ref , which is shown in the above figure with a dotted line. Similarly, the input torque for VSG1 is computed by the PI controller on the deviation between V dc 1 ref and Vdc1.

3.2. Optimization of DC Voltage References

To obtain the DC voltage references, an optimization model is established as follows.
min V dc 1 , V dc 2 ( V dc 1 V dc 1 0 ) 2 + ( V dc 2 V dc 2 0 ) 2 s . t .   P * = V dc 1 V dc 2 2 R V dc 2 V dc 1 L V dc 1 V dc 1 H V dc 2 L V dc 2 V dc 2 H
where V dc 1 * and V dc 2 * are DC voltage reference of VSC1 station and VSC2 station, respectively.
The optimization goal is to minimize the combination of deviation between V dc 2 * and V dc 2 0 as well as the deviation between V dc 2 * and V dc 2 0 . The physics meaning of this goal could be understood from two aspects. One is that smaller deviation takes less time for adjustment, which accelerates the change of transmitted power; the other one is that bigger deviation may jeopardize the DC capacitor and even threaten the stability of the DC side of the VSC-HVDC system. The first constraint in (14) guarantees that the transmitted power from renewable energy generators to gird is equal to P* calculated in (3). The last two constraints are the safety range of DC voltages.
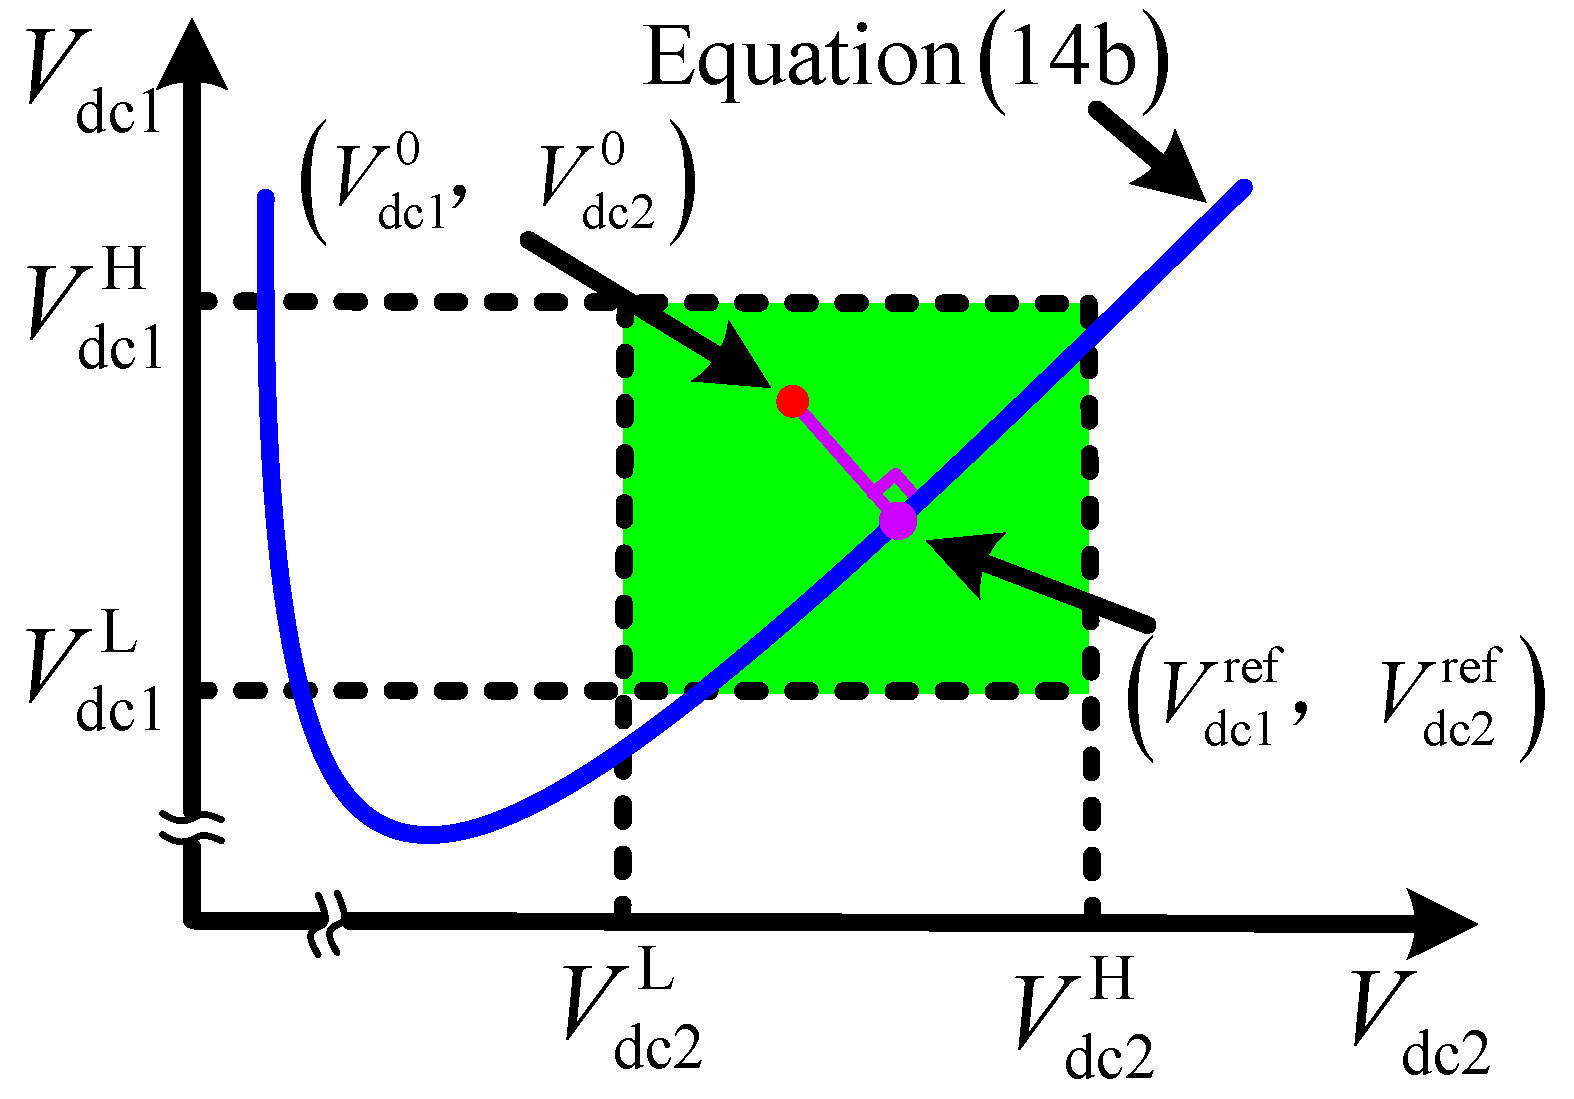
To solve (14) with general methods may be tedious. Actually, the optimization goal and constraints have a clear geometric meaning if (14) is expressed in a graph, as shown in Figure 4.
The red dot represents the initial state, the physics meaning of (14) is to find a candidate point on the blue line in the green area whose distance from the red dot is shortest. Obviously, when the line connecting the red dot and the candidate point is perpendicular to the tangent line of the candidate point, the candidate point is just the solution of (14).
The slope of the tangent line of the candidate point can be calculated from (14), which is
k 1 = d V dc 1 d V dc 2 = 1 2 R P V dc 2 2
The slope of the line connecting the red dot and candidate point is
k 2 = V dc 1 V dc 1 0 V dc 2 V dc 2 0
These two lines are vertical yielding that
k 1 k 2 = 1
Substitute (15) and (16) to (17), and with (14) into consideration, the below equation can be obtained
V dc 2 V dc 2 0 V dc 1 0 V dc 1 = 1 + V dc 2 V dc 1 V dc 2
In practice, V dc 2 * V dc 1 * << V dc 2 * , so we have
V dc 2 V dc 2 0 = V dc 1 0 V dc 1
The physics meaning is that the deviation between V dc 1 * and V dc 1 0 is equal to the deviation between V dc 2 * and V dc 2 0 . The final solution of (14) could be expressed as
{ V dc 1 ref = 3 ( V dc 1 0 + V dc 2 0 ) ( V dc 1 0 + V dc 2 0 ) 2 16 R P 4 V dc 2 ref = V dc 1 0 + V dc 2 0 + ( V dc 1 0 + V dc 2 0 ) 2 16 R P 4

4. Small Signal Model and Parameters Tuning

4.1. Small Signal Model

In Figure 4, the injected active power Pe from VSC2 station to the weak grid can be calculated as
P e = 3 U V X sin δ
where U and V are AC voltage RMS values at the terminal of VSC2 station and PCC respectively; δ is the phase deviation between U and V; X represents the equivalent inductance. Suppose Pe = Te/ωTe/ω0, and the small signal of P-f control of VSG could be obtained from Figure 3.
Where
S E = P e δ | δ = δ 0
According to Figure 5, the transfer function from ΔTm to ΔTe can be obtained as
Δ T e Δ T m = ω n 2 s 2 + 2 ξ ω n + ω n 2
where
{ ω n = S E J ω 0 ξ = D 2 ω 0 J S E
The damping ratio characterizes the dynamic process of VSG. An overdamping system may have a slow response; while an underdamped system may introduce too much overshoot and lead to instability. Thus, critical damping is adopted, which is a balance between response time and stability. The undamped natural angular frequency ωn will be discussed in the design of the voltage control loop below.
The active power injected into the VSC2 station could be calculated as
P in = V dc 2 ( V dc 1 V dc 2 2 R C d V dc 2 d t )
where C is the equivalent capacitance in the DC side of the VSC2 station. To analysis the dynamic of the VSC2 station, the Vdc1 could be regarded as constant and equal to V dc 1 0 , and the small signal model of Pin and Vdc2 is
Δ P in = 2 V dc 2 0 V dc 1 0 2 R Δ V dc 2 V dc 2 0 C d Δ V dc 2 d t
Suppose the VSC2 station is ideal and losses, which satisfies that the input power ΔPin is equal to output power ΔPe, by Laplace transform, the (26) can be expressed as
Δ V dc 2 Δ P e = 2 R 2 R V dc 2 0 C s + 2 V dc 2 0 V dc 1 0
According to (23), (27), and Figure 5, the small signal model of voltage control diagram of VSC2 can be obtained as shown in Figure 6.
The open-loop transfer function of the voltage control diagram is
G V ( s ) = 2 R ω n 2 ω 0 ( k p s + k i ) s ( s 2 + 2 ξ ω n + ω n 2 ) ( 2 R V dc 2 0 C s + 2 V dc 2 0 V dc 1 0 )

4.2. Parameters Tuning

To achieve better performance in frequency regulation, the parameters related to active power control need to be fine-tuned.
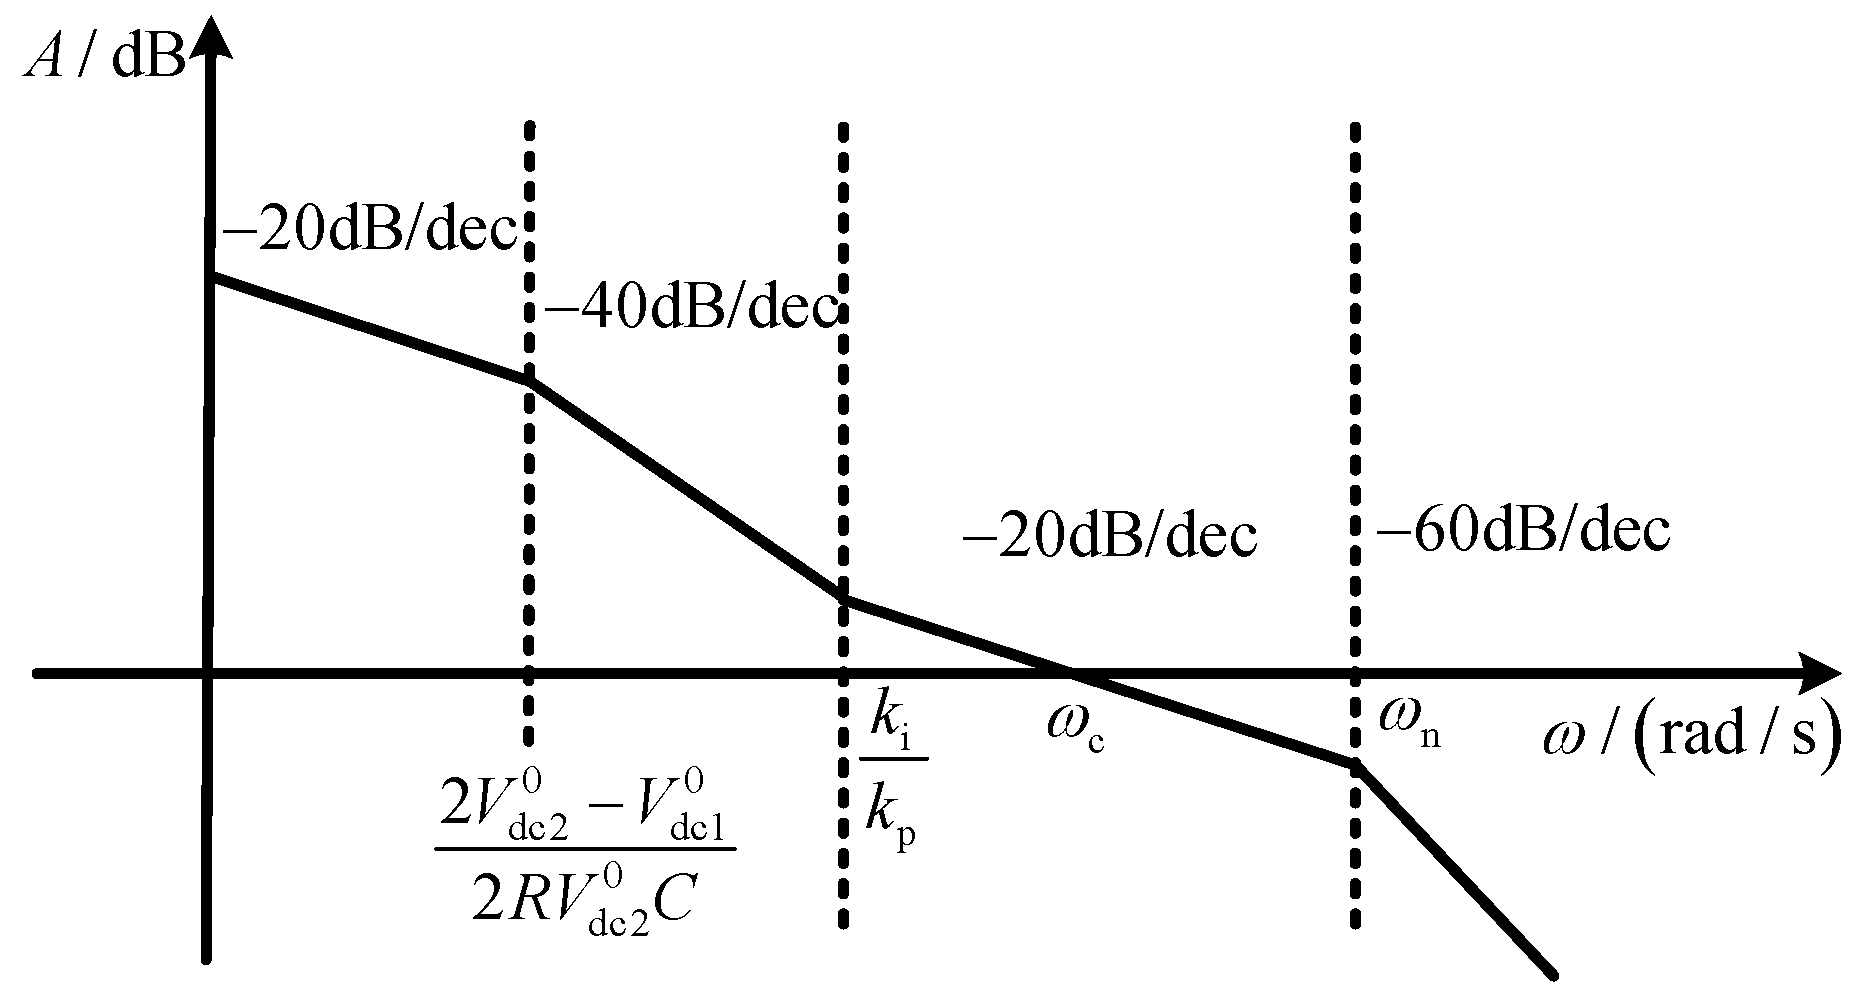
The open transfer function of the proposed voltage control has three poles and one zero point, and the Bode diagram analysis is utilized to design parameters for admirable performance. To ensure voltage stability, the crossing frequency ωc should be at the −20 dB/dec part of the amplitude frequency curve. Besides, the ωn should be greater than ωc, otherwise, the phase margin will be so small that the robustness of the system becomes weak. The desired Bode diagram can be plotted as shown in Figure 7.
Firstly, determine the crossing frequency ωc. When the three-phase voltage at the AC side are asymmetrical, the voltage at the DC side will ripple, whose minimum frequency is twice the power frequency [21]. To avoid their bad influence on voltage control, the cut-off frequency ωc could be chosen as one-tenth of the minimum frequency of harmonic. For example, if power frequency is 50 Hz, ωc = 1/10·2π·50 (rad). As discussed before, the ωn should be greater than ωc, but if ωn is too high, the high frequency harmonics will not be effectively attenuated. Hence, the ωn could be selected around twice or three times as the ωc. From (24) and the critical damping characteristic (ζ = 1) of (23), the inertia J and damping factor D could be selected as
{ J [ S E 9 ω 0 ω c 2 , S E 4 ω 0 ω c 2 ] D = 2 J S E ω 0
Then, determine the phase margin γ, which could be calculated from (28) and expressed as
γ = 90 + arctan ( k p ω c k i ) arctan ( 2 ω n ω c ω n 2 ω c 2 ) arctan ( 2 R V dc 2 0 C ω c 2 V dc 2 0 V dc 1 0 )
It is shown that γ depends on the ratio of kp to ki. In practice, the phase margin γ is usually designed to be around 60°. On the other hand, When s = c, the amplitude of GV in (28) is equal to 1, which can be expressed as
2 R ω n 2 ω 0 k p 2 ω c 2 + k i 2 ω c ( ω n 2 + ω c 2 ) ( 2 R V dc 2 0 C ω c ) 2 + ( 2 V dc 2 0 V dc 1 0 ) 2 = 1
Combine (30) with (31) and the kp to ki could be selected as
{ k i = ω c ( ω n 2 + ω c 2 ) ( 2 R V dc 2 0 C ω c ) 2 + ( 2 V dc 2 0 V dc 1 0 ) 2 2 R ω n 2 ω 0 m 2 ω c 2 + 1 k p = m k i
where m satisfy
arctan ( m ω c ) = arctan ( 2 ω n ω c ω n 2 ω c 2 ) + arctan ( 2 R V dc 2 0 C ω c 2 V dc 2 0 V dc 1 0 ) 30

5. Simulation Results

The proposed control strategy is tested on the system shown in Figure 1 to evaluate its validity and superiority. In the testing system, the weak grid is on the right dashed area of Figure 1, which is supplied by the VSC-HVDC transmission system and two synchronous generators (SG1 and SG2). These two SGs use the typical second-order model in the MATLAB/Simulink [22], whose main parameters are shown in Table 1. The parameters of the VSC-HVDC transmission system are shown in Table 2.
The control parameters of VSC stations are selected according to Figure 3 and are shown in Table 3.
The proposed control strategy is tested in the scenarios of sudden load changes and short circuit faults, comparing with the same simulation scenarios using the control method in [18,19], which is noted as the ‘traditional control mode’, to highlight the effectiveness of the proposed control strategy.

5.1. Sudden Load Changes

Initially, the total load is 850 MW. The output power of SG1 and SG2 are 300 MW and 250 MW respectively. The initial value of Vdc1 and Vdc2 are 305.1 kV and 294.9 kV, respectively, and the transmitted power calculated by (10) is equal to 300 MW, which ensures the balance of power supply and consumption.
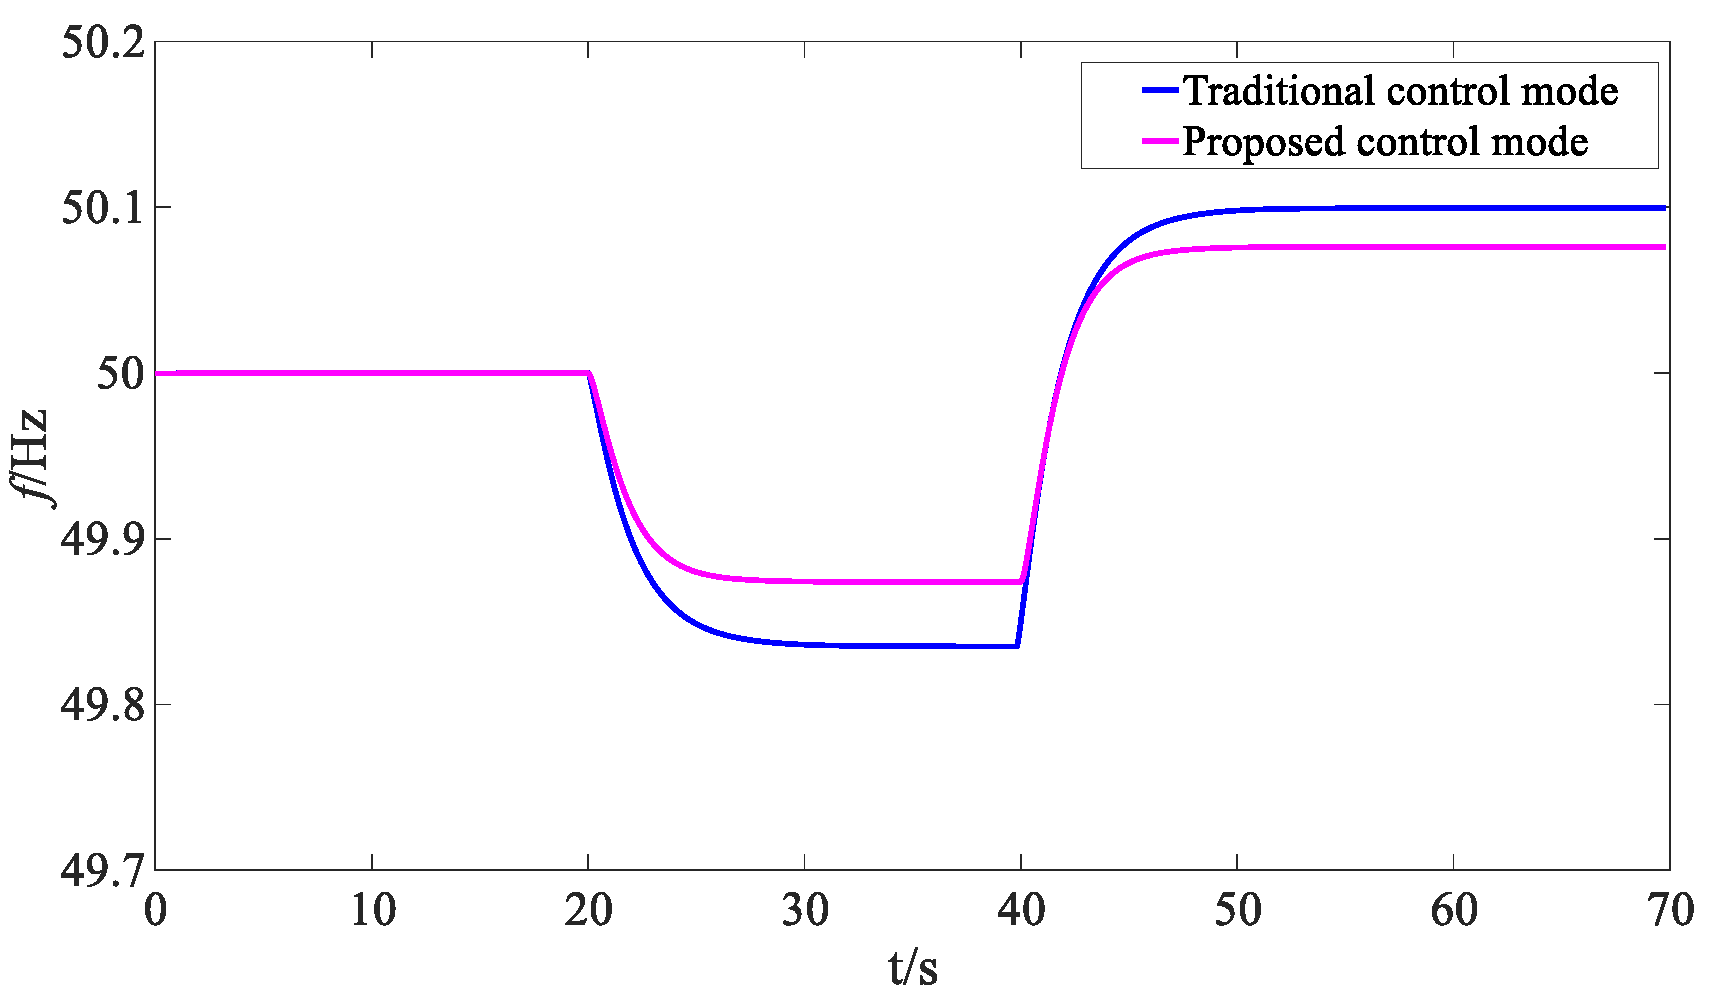
At t = 20 s, a load of 50 MW is added; at t = 40 s, a load of 80 MW is removed. The weak grid frequency variations and output power of different sources in different control modes are shown in Figure 8.
It can be seen from Figure 8 that in the traditional mode, the maximum frequency deviation is 0.16 Hz, and it decreases to 0.12 Hz when the proposed control strategy is adopted. Besides, the rate of change of frequency is also reduced. The reason is that in the proposed control mode, the transmitted power of VSC-HVDC is adjusted fast to eliminate the imbalance between the power supply and demand, which is shown in Figure 9. This also alleviates the adjustment burden of other SGs in the weak grid.
To show the mechanism of the control strategy in detail, the variations of DC voltages of both VSC stations are shown in Figure 10.
When the load is added, the power demands increase. The Vdc1 increases and Vdc2 decreases, which increases the transmitted power of VSC-HVDC. Contrarily, when the load is removed, the power demands decrease, and Vdc1 decreases, and Vdc2 increases, which decreases the transmitted power of VSC-HVDC. This operating mechanism will no doubt contribute to the frequency regulation of weak grid.

5.2. Short Circuit Faults

The initial condition is the same as Section 5.1. The total load (850 MW) is supplied by SG1 (300 MW), SG2 (250 MW), and VSC-HVDC (300 MW). At t = 20 s, a single phase to ground fault occurs at the terminal SG2, and the fault lasts for 1 s. Figure 11 and Figure 12 show the frequency variations and output power of different sources with different control strategies. The DC voltage variations of both ends are also shown in Figure 13.
When the short circuit fault occurs, massive power is consumed in the faults, and the frequency decreases even though SGs increase their output power. In traditional control mode, the transmitted power increment by VSC-HVDC is approximately 20 MW, and the frequency decreases to 49.54 Hz. If the proposed control strategy is adopted, the transmitted power by VSC-HVDC increases quickly and reaches about 350 MW, which reduces the change rate as well as the deviation of frequency.

6. Conclusions

In this paper, a coordinated DC voltage control strategy is presented to exploit the capability of the VSC-HVDC in frequency regulation. When the frequency of the grid changes, The VSC-HVDC system could adjust its output power more quickly and adequately to provide an inertial response and prime frequency support by altering the DC voltages both at the sending end and the receiving end. The proposed control strategy has accelerated the speed of transmitted power adjustment and explored the potential of the VSC-HVDC system in frequency regulation, which plays a vital role in attenuating the rate of change of frequency as well as diminishing the frequency deviation. This control strategy may be an alternative for the control of the VSC-HVDC transmission system in the future power system with little inertia.

Author Contributions

Conceptualization, T.Z. and L.C.; methodology, T.Z., L.C., and Y.G.; formal analysis, W.W. and B.Z.; investigation, writing—review and editing, T.Z., Y.G., and X.S.; supervision, L.C. All authors have read and agreed to the published version of the manuscript.

Funding

This research was supported by the National Nature Science Foundation of China (52007100), Qinghai Fundamental Research Project (2020-ZJ-741).

Institutional Review Board Statement

Not applicable.

Informed Consent Statement

Not applicable.

Data Availability Statement

Not applicable.

Conflicts of Interest

The authors declare no conflict of interest.

References

  1. Tan, Z.; Chen, K.; Ju, L.; Liu, P.; Zhang, C. Issues and solutions of China’s generation resource utilization based on sustainable development. J. Mod. Power Syst. Clean Energy 2016, 4, 147–160. [Google Scholar] [CrossRef] [Green Version]
  2. Flourentzou, N.; Agelidis, V.G.; Demetriades, G.D. VSC-Based HVDC Power Transmission Systems: An Overview. IEEE Trans. Power Electron. 2009, 24, 592–602. [Google Scholar] [CrossRef]
  3. Zhan, P.; Li, C.; Wen, J.; Hua, Y.; Yao, M.; Li, N. Research on hybrid multi-terminal high-voltage DC technology for offshore wind farm integration. J. Mod. Power Syst. Clean Energy 2013, 1, 34–41. [Google Scholar] [CrossRef] [Green Version]
  4. Egea-Alvarez, A.; Bianchi, F.; Junyent-Ferre, A.; Gross, G.; Gomis-Bellmunt, O. Voltage Control of Multiterminal VSC-HVDC Transmission Systems for Offshore Wind Power Plants: Design and Implementation in a Scaled Platform. IEEE Trans. Ind. Electron. 2013, 60, 2381–2391. [Google Scholar] [CrossRef]
  5. Zhang, Z.-S.; Sun, Y.-Z.; Lin, J.; Li, G.-J. Coordinated frequency regulation by doubly fed induction generator-based wind power plants. IET Renew. Power Gener. 2012, 6, 38. [Google Scholar] [CrossRef]
  6. Mauricio, J.M.; Marano, A.; Gómez-Expósito, A.; Martinez Ramos, J.L. Frequency regulation contribution through varia-ble-speed wind energy conversion systems. IEEE Trans. Power Syst. 2009, 24, 173–180. [Google Scholar] [CrossRef]
  7. Roncero-Sánchez, P.; Torres, A.P.; Vázquez, J.; López-Alcolea, F.; Molina-Martínez, E.; Garcia-Torres, F. Multiterminal HVDC System with Power Quality Enhancement. Energies 2021, 14, 1306. [Google Scholar] [CrossRef]
  8. Liu, H.; Chen, Z. Contribution of VSC-HVDC to Frequency Regulation of Power Systems with Offshore Wind Generation. IEEE Trans. Energy Convers. 2015, 30, 918–926. [Google Scholar] [CrossRef]
  9. Fuchs, A.; Imhof, M.; Demiray, T.; Morari, M. Stabilization of Large Power Systems Using VSC–HVDC and Model Predictive Control. IEEE Trans. Power Deliv. 2013, 29, 480–488. [Google Scholar] [CrossRef]
  10. Sanz, I.M.; Chaudhuri, B.; Strbac, G. Inertial Response from Offshore Wind Farms Connected Through DC Grids. IEEE Trans. Power Syst. 2014, 30, 1518–1527. [Google Scholar] [CrossRef] [Green Version]
  11. Zhu, J.; Booth, C.D.; Adam, G.P.; Roscoe, A.J.; Bright, C.G. Inertia Emulation Control Strategy for VSC-HVDC Transmission Systems. IEEE Trans. Power Syst. 2013, 28, 1277–1287. [Google Scholar] [CrossRef] [Green Version]
  12. Junyent-Ferre, A.; Pipelzadeh, Y.; Green, T.C. Blending HVDC-Link Energy Storage and Offshore Wind Turbine Inertia for Fast Frequency Response. IEEE Trans. Sustain. Energy 2015, 6, 1059–1066. [Google Scholar] [CrossRef] [Green Version]
  13. Phulpin, Y. Communication-Free Inertia and Frequency Control for Wind Generators Connected by an HVDC-Link. IEEE Trans. Power Syst. 2012, 27, 1136–1137. [Google Scholar] [CrossRef]
  14. Stojković, J.; Lekić, A.; Stefanov, P. Adaptive Control of HVDC Links for Frequency Stability Enhancement in Low-Inertia Systems. Energies 2020, 13, 6162. [Google Scholar] [CrossRef]
  15. Nanou, S.I.; Papathanassiou, S.A. Grid Code Compatibility of VSC-HVDC Connected Offshore Wind Turbines Employing Power Synchronization Control. IEEE Trans. Power Syst. 2016, 31, 5042–5050. [Google Scholar] [CrossRef]
  16. Zhong, Q.-C.; Weiss, G. Synchronverters: Inverters That Mimic Synchronous Generators. IEEE Trans. Ind. Electron. 2011, 58, 1259–1267. [Google Scholar] [CrossRef]
  17. Wu, H.; Ruan, X.; Yang, D.; Chen, X.; Zhao, W.; Zhong, Q.C. Small-signal modeling and parameters design for virtual syn-chronous generators. IEEE Trans. Ind. Electon. 2016, 63, 4292–4303. [Google Scholar] [CrossRef]
  18. Guan, M.; Pan, W.; Zhang, J.; Hao, Q.; Zhang, Z. Synchronous generator emulation control strategy for voltage source con-verter (VSC) stations. IEEE Trans. Power Syst. 2015, 30, 3093–3101. [Google Scholar] [CrossRef]
  19. Aouini, R.; Marinescu, B.; Ben Kilani, K.; Elleuch, M. Synchronverter-Based Emulation and Control of HVDC Transmission. IEEE Trans. Power Syst. 2016, 31, 278–286. [Google Scholar] [CrossRef]
  20. Kundur, P. Power System Stability and Control; McGraw Hill: New York, NY, USA, 1994. [Google Scholar]
  21. Han, M.; Nguyen, P.; Yan, W. Inter-harmonics in multi-terminal VSC-based HVDC systems. J. Mod. Power Syst. Clean Energy 2016, 4, 282–291. [Google Scholar] [CrossRef] [Green Version]
  22. MathWorks MATLAB Simulink SimPowerSystems Blockset. Available online: http://www.mathworks.com/ (accessed on 7 January 2021).
Figure 1. Single-line diagram of voltage source converter high voltage direct current (VSC-HVDC) transmission system.
Energies 14 02712 g001
Figure 2. Typical virtual synchronous generator (VSG) control diagram.
Energies 14 02712 g002
Figure 3. Proposed VSG-based coordinated DC Voltage control strategy for VSC-HVDC.
Energies 14 02712 g003
Figure 4. The process of solving (14).
Energies 14 02712 g004
Figure 5. Small signal model of P-f control diagram of VSG.
Energies 14 02712 g005
Figure 6. Small signal model of voltage control diagram of VSC2.
Energies 14 02712 g006
Figure 7. Bode diagram of voltage open-loop control.
Energies 14 02712 g007
Figure 8. Frequency variation in different control modes under sudden load changes.
Energies 14 02712 g008
Figure 9. Output power of different sources in different control modes under sudden load changes.
Energies 14 02712 g009
Figure 10. DC voltage variation of proposed control under sudden load changes.
Energies 14 02712 g010
Figure 11. Frequency variation in different control modes under short circuit fault.
Energies 14 02712 g011
Figure 12. Output power of different sources in different control modes under short circuit fault.
Energies 14 02712 g012
Figure 13. DC voltage variation of proposed control under short circuit fault.
Energies 14 02712 g013
Table 1. The parameters of SG1 and SG2.
ParameterSG1SG2
Apparent Power400 MVA300 MVA
Rated voltage380 kV380 kV
Rated frequency50 Hz50 Hz
Inertial impedance6 Ω, 0.2 H5 Ω, 0.2 H
Inertia9 s7 s
Damping factor285 pu257 pu
Table 2. The parameters of VSC-HVDC.
ParameterValue
Rated apparent Power400 MW
Nominal DC voltage300 kV
Nominal AC voltage220 kV
DC capacitance3.3 mF
Cable length100 km
Cable resistance0.05 Ω/km
Table 3. The control parameters of the VSC station.
ParameterValue
Virtual inertia J1200 kg·m2
damping factor D3.4 × 105 N·m·s/rad
ki1300
kp95
Publisher’s Note: MDPI stays neutral with regard to jurisdictional claims in published maps and institutional affiliations.