Article

Measuring the Energy Efficiency of Evaporative Systems through a New Index—EvaCOP

by
Alexandre F. Santos
1,2,
Pedro D. Gaspar
1,3 and
Heraldo J. L. Souza
2,*
1
Department of Electromechanical Engineering, University of Beira Interior, 6201-001 Covilhã, Portugal
2
FAPRO—Professional College, Curitiba 80230-040, Brazil
3
C-MAST—Centre for Mechanical and Aerospace Science and Technologies, 6201-001 Covilhã, Portugal
*
Author to whom correspondence should be addressed.
Energies 2021, 14(9), 2689; https://doi.org/10.3390/en14092689
Submission received: 3 April 2021 / Revised: 22 April 2021 / Accepted: 5 May 2021 / Published: 7 May 2021

Abstract

:
Evaporative systems are probably the oldest technology for thermal comfort. However, they are still an essential technology in the food industry, environments for thermal comfort, and even for cooling data centers. Standards have been improved to compare the energy efficiency of this type of equipment. Using AHRI concepts with temperature data from the 29 most populous cities in the world, an EvaCOP index was created from temperatures that are easier to simulate than current parameters. The index parameters were tested in a laboratory located in Curitiba (Brazil). EvaCOP values of 45.58 and 25.77 W/W were found in the calculation in two different simulated equipment and compared with the compression cycle systems that in the most efficient machines is around 6.29 W/W.

1. Introduction

Evaporative systems are among the oldest cooling techniques. In Egypt, plasterwork dating from around 2500 A.D shows slaves opening water jars to cool pharaohs’ rooms. In France, King Francis I used clay vases from Portugal to make water colder by the effect of evaporation. Leonardo da Vinci probably developed the first mechanical evaporative cooling system with a hollow water wheel through which air was drawn in chambers and exchanged heat with water, cooling and cleaning the air. Leonardo da Vinci also developed the first hygrometer that used a wool ball to provide an indication of humidity level. In the Midwestern United States of America, settlers between 1920 and 1930 slept in protected windows on balconies, where they used wet sheets to get relief from the summer heat [1].
In 1946, only six companies sold 200,000 evaporative systems. In 1955, evaporative systems improved considerably after the revolutionary rigid pad invented by Carl Munters, author of more than 1000 patents and inventor of the multilayer paper, which is the precursor to evaporative pads [2]. From then on, sales of evaporative systems increased significantly. In 1958, 25 companies sold 1,250,000 evaporative systems, despite the huge sales of window air conditioning systems at that time [1].
Evaporative systems are currently used for air washers, cooling towers, and condensers cooling, as well as for human thermal comfort, with many applications of heating, ventilation, and air conditioning (HVAC) for office buildings, supermarkets, cinemas, sports centers, data centers, etc. [3]. Currently, evaporative systems are used for cooling data centers [4]. Nei and Masanet [5] modeled the energy efficiency of data centers using evaporative cooling in the cooling towers and free cooling. The Energy Usage Effectiveness Design (EUED) [6] and Perfect Design Data Center (PDD) [7] methodologies also consider the evaporative system essential to measure energy efficiency. In fact, the California Energy Commission [8] states that evaporative coolers can use 75% less energy than conventional air conditioning.
Air conditioning equipment already has many regulations to evaluate and compare energy efficiency. Almost all of them are explicit in ASHRAE 90.1-2019, although the values of the coefficient of performance (COP) and integrated part-load value (IPLV) serve as a baseline; for example, for a LEED certification. The test methodologies are in general established by the Air-Conditioning, Heating, and Refrigeration Institute (AHRI). Among these standards, the following can be mentioned [9]:
  • AHRI 210/240 (2017)—Performance Rating of Unitary Air-Conditioning and Air-Source Heat Pump Equipment [10].
  • AHRI 340/360 (2019)—Performance Rating of Commercial and Industrial Unitary Air-Conditioning and Heat Pump Equipment [11].
  • AHRI 365 (2009)—Performance Rating of Commercial and Industrial Unitary Air-Conditioning Condensing Units [12].
  • AHRI 551/591 (2011)—Performance Rating of Water-Chilling and Heat Pump Water-Heating Packages Using the Vapor Compression Cycle [13].
  • AHRI 560 (2000)—Absorption Water-Chilling and Water-Heating Packages [14].
  • AHRI 310/380 (2017)—Packaged terminal air conditioners and heat pumps [15].
  • AHRI 390 (2003)—Performance Rating of Single Package Vertical Air Conditioners and Heat Pumps [16].
  • AHRI 1230 (2014)—Performance Rating of Variable Refrigerant Flow (VRF) Multi-split Air-Conditioning and Heat Pump Equipment [17].
  • AHRI 1361 (2017)—Performance Rating of Computer and Data Processing Room Air Conditioners [18].
  • AHRI 1360 (2017)—Performance Rating of Computer and Data Processing Room Air Conditioners [19].
  • AHRI 1201 (2017)—Performance Rating of Portable Flue Gas Combustion Analyzers [20].
  • AHRI 921 (2015)—Performance Rating of DX-Dedicated Outdoor Air System Units [21].
It should be noted that there are methodologies for analyzing the energy efficiency of heating, ventilation, and air conditioning (HVAC) systems by conventional air conditioning systems (compression cycle) in various ways, whether at full or partial load, in addition to various classifications of types of equipment, from simple unitary equipment installed on windows to sophisticated variable refrigerant flow (VRF)-type equipment with high on-board technology, and even huge chillers. However, this whole range of standards to measure and compare energy efficiency makes it difficult to standardize the measurement and comparison of energy efficiency in adiabatic equipment. Thus, this paper proposes a new energy efficiency index, EvaCOP, to compare the energy efficiency of these types of equipment that have so much history (existing before the compression cycle) and that today are used even in modern data centers.
Evaporative systems are generally divided between direct and indirect systems. Direct evaporative considers direct contact between the air and the evaporative panel and/or atomization system. In an indirect evaporative cooling system, the supply air is passively cooled before it enters the space by passing over a medium that has been directly evaporatively cooled on an adjacent but isolated side. Thus, no moisture is added to the supply air stream [8].
A direct evaporative cooling system works simply when unsaturated air is placed in contact with water. Part of the water evaporates, reducing the temperature of the air while increasing its humidity; that is, the cooling and humidification of the air occur due solely to the evaporation of the water, without the need for additional energy. For every 1 kg of evaporated water, there is a reduction in sensible heat of approximately 2428.34 kJ/kg.
The efficiency of an evaporative system with air washer atomizers or an evaporative panel is made up of many variables. A previous study considered the air intake geometry to increase saturation efficiency. Air intake in a triangular form has better performance. There are also studies on models used in the study of sprays and the multiple dynamics of water atomization. Some studies evaluated the heat exchange that occurs with evaporative panels of several water absorbent materials (cooling pads) with an aspen pad, a porous ceramic pad, palm fruit fiber, charcoal pieces, shredded latex foam, and Jute fiber [22,23].
In addition to these types of direct evaporative systems to be used with an atomizer or cooling pads, there are other relevant factors such as the air velocity frontal to the evaporative system, which influences efficiency. In general, the ideal air velocity at the cooling pad is from 200 to 400 FPM (1 to 2 m/s). The sensible exchange efficiency remains at levels from 70 to 95% for these air velocities. However, the air velocity directly influences the pressure drop, which, in turn, will also influence the electric power of the fan [24]. Regardless of the technology employed, the efficiency of the heat exchange of a direct or indirect evaporative can be measured by Equation (1).
E f = T i n T o u t T i n T s a t
where:
  • Ef: Evaporative efficiency;
  • Tin: Input dry-bulb temperature (°C);
  • Tout: Outside dry-bulb temperature (°C);
  • Tsat: Saturation temperature (°C).
Figure 1 shows a psychrometric chart with an example of the calculation of the evaporative efficiency. Considering an air input dry-bulb temperature, Tin = 33 °C (Point P1), an outside air dry-bulb temperature, Tout = 25 °C (Point P2), and an air saturation temperature, Tsat = 24 °C (red line), the evaporative efficiency becomes, Ef = 89%.
There are methodologies to define the best place to install an adiabatic system. Camargo et al. [25] developed a study with the temperatures of multiple Brazilian cities, observing the feasibility of installing an evaporative system. Kinney et al. [26] also carried out a feasibility study on the use of an evaporative system for the western half of the USA. However, although these studies focus on the feasibility of these systems, no comparison exists between evaporative devices. In addition to the psychrometric issues, an evaporative system also requires a water pump and an air ventilation system. In this sense, there are several fan options such as centrifugal, axial, and electronic with a variable velocity proportional to the pressure loss. According to the US Department of Energy Efficiency and Renewable Energy (DOE), significant energy savings are achieved if the fan can adequately serve the system at a lower speed. One method of reducing fan speed is to adjust the ratio of the pulley diameters of the motor and the fan. Fan rotational velocity is typically measured in revolutions per minute (rpm). Fan rotational velocity has a significant impact on fan performance [27], as shown in Equations (2)–(4).
Airflow final = Airflow initial ( RPM final RPM initial )
Pressure final = Pressure initial ( RPM final RPM initial ) 2
Power final = Power initial ( RPM final RPM initial ) 3
All these variables such as pressure losses, various types of fans and pumps, as well as a huge range of temperatures, both dry and wet bulbs, make it difficult to develop a methodology for comparing evaporative equipment. Just as a split system air conditioner has three speeds, an evaporative air conditioning system, for example, to cool a train station with an electronic fan, could also have multiple speeds. Using the fan laws, a fan that nominally works at 60 Hz can generate energy savings up to 42% working at 50 Hz (Equation (4)).

2. Method for Analyzing Energy Efficiency of Evaporative Equipment
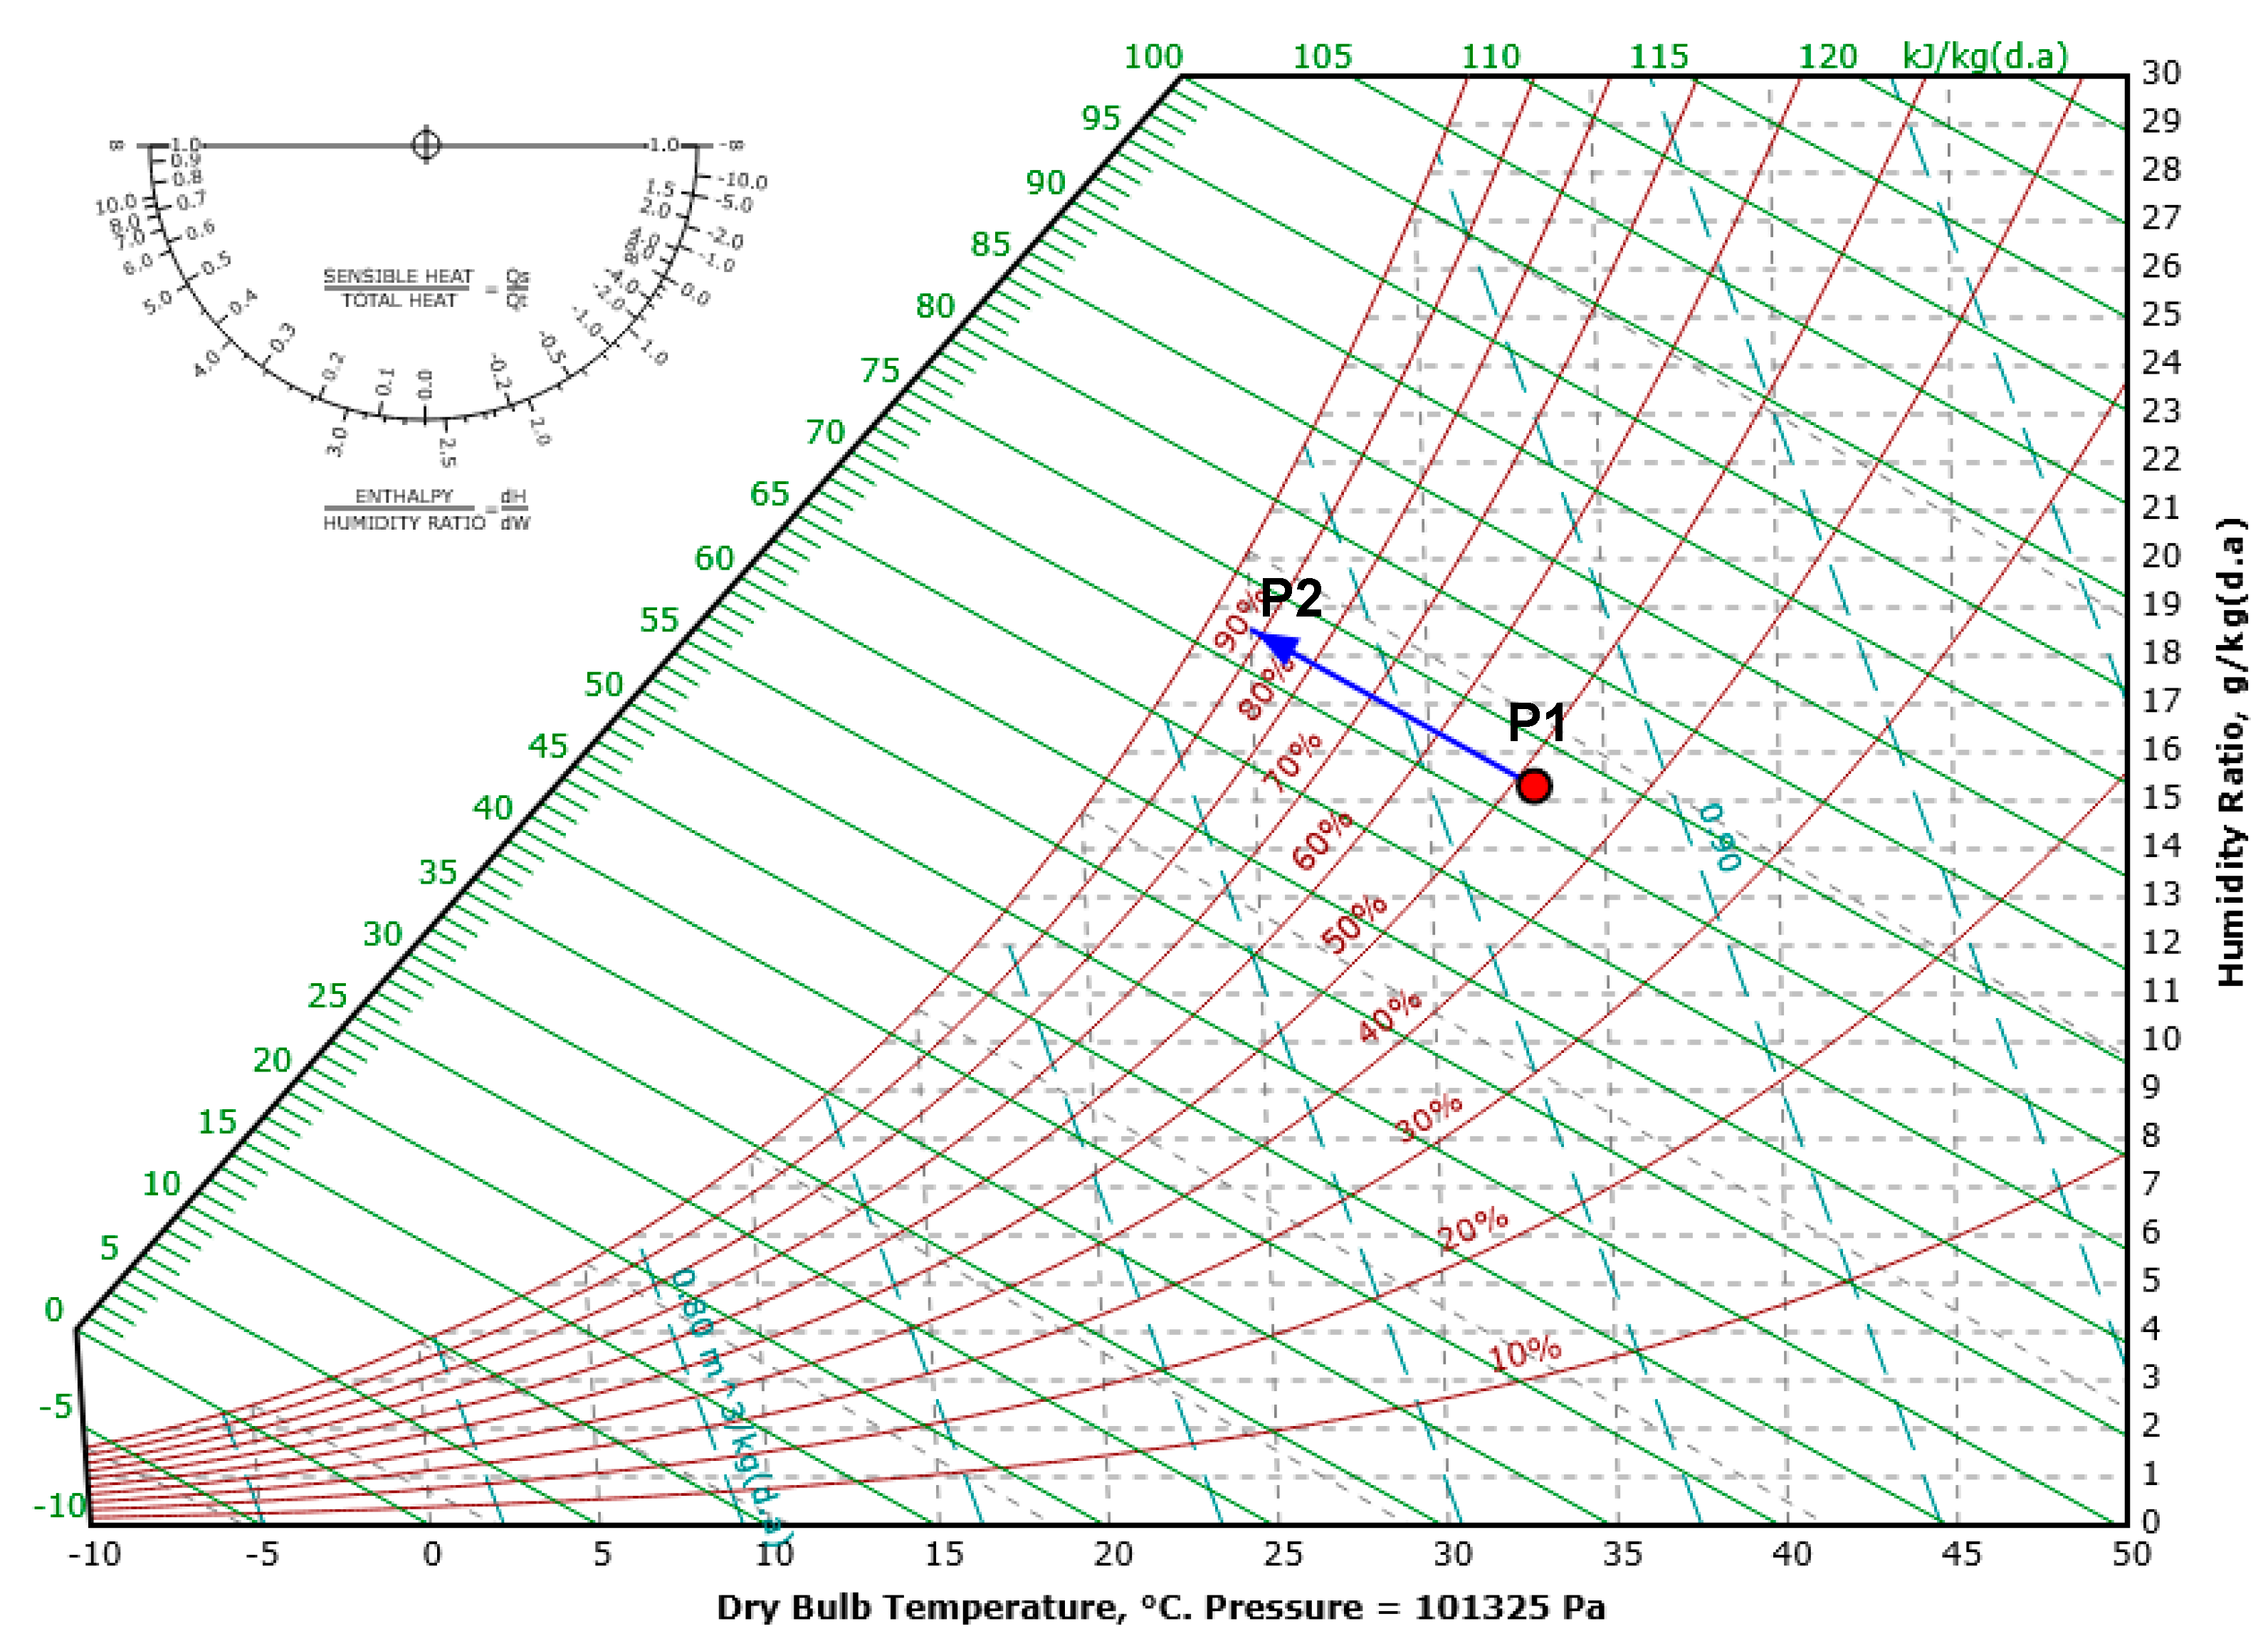
Eurovent has a certification program for evaporative systems. The certifications are classified as evaporative-type direct evaporative cooling (DEC) and indirect evaporative cooling (IEC). The DEC certification is the program RS/9/C/004-2018 and IEC RS/9/C/005-2018 [28,29]. However, these programs exclude portable equipment, all equipment with air flow rates below 2500 m3/h, and equipment with flow rates above 120,000 m3/h. Specifically, the major players in the evaporative market operate in the portable equipment market, such as SPX Cooling Technologies, Inc., Kansas, U.S.A., Kelvion Holding GmbH, Baltimore Aircoil Company, Inc., Evapco, Inc., Ebara Refrigeration Equipment & Systems Co. Ltd., Luoyang Longhua Heat Transfer and Energy Conservation Co., Ltd., Xiamen Mingguang Machinery Manufacturing Co., Ltd., Lanpec Technologies Ltd-A, Condair Group AG, and Honeywell International Inc [30].
In addition to the exclusion of portable equipment, there is also the issue of available static pressure, which is set at 80 Pa for flow less than 14,400 m3/h and 120 Pa for flow above this value. There is no classification for duct or equipment without duct.
This fixed available static pressure is very high for medium and small equipment, and 120 Pa is very low for large equipment. In a facility such as a railway station, only a saturated Merv 12 filter would be enough to drastically reduce the air passage [31].
Additionally, there is the simplification of the simulation temperatures being extremely high with dry bulb of 38 °C and wet-bulb temperature of 21 °C. These temperatures end up generating a lot of energy in the calorimeters for the simulation in the case of the dry bulb, besides a drying of air to constantly achieve a wet-bulb temperature of 21 °C [28,29]. In Australia, there are parameters for the tests known as “Evaporative Australian Standards,” which are analogous to Eurovent. In California, the air intake temperature parameters are 32.8 °C for the dry bulb and 20.6 °C for the wet bulb [32].
AHRI uses a methodology based on a variation of thermal load and temperatures based on the 29 most populous cities in the USA to develop the integrated part-load value (IPLV) index [33]. If this approach is considered worldwide, the 29 most populous cities according to the 2018 United Nations report [34] will be selected, as shown in Table 1.
The data from the ASHRAE Weather Data Viewer [35] can be used as a reference for evaporative equipment. This software records temperatures and relative humidity of 8760 h per year in the most important cities in the world. For this study, the data obtained for each city were the dry-bulb (DBT) and wet-bulb (WBT) temperatures in the 175.2 hottest hours of the year (2% of annual hours) [35]. On the hottest days in the most populous cities in the world, the wet-bulb temperature is low. The cities with the lowest WBT are Bogota, Mexico City, and Los Angeles. The cities with the highest WBT are Dhaka, Kolkata, Shanghai, and Manila. The standard air intake temperatures for tests on the evaporative equipment suggested based on data from the 29 most populous cities in the world is shown in Table 2 Are:
  • DBT = 32 °C.
  • WBT = 23 °C.
With the input data of an evaporative system, it is possible to elaborate a standard method for comparison between evaporative systems of various brands and different models. This comparative index is named Evaporative System Coefficient of Performance (EvaCOP). It is important to highlight that the air intake standard DBT and WBT must be maintained with Equation (5) to 32 and 23 °C, respectively.
EvaCOP = Q total   sensible   reject   ( W ) P o w e r   I n p u t   ( W )
where:
  • Q total   sensible   reject = V ˙ ·   ρ ·   C p   · Δ T : Total rejected sensible heat (W);
  • V ˙ : Flow rate (m3/h);
  • ρ : Density (kg/m3);
  • C p : Specific heat of the air (W/kg.°C);
  • ΔT: Sensible temperature difference (°C), based on the standard air intake DBT = 32 °C minus the evaporative discharge temperature.
  • W: Total power input given by the sum of all electrical supplies in the system; that is, fans and pumps (W).
Eurovent uses the energy efficiency ratio (EER) as a methodology to calculate the efficiency of an evaporative system. However, the same acronym is used to measure the efficiency of split-type systems and so many other refrigeration systems according to the compression cycle. The advantage of using an acronym such as EvaCOP is to make it clear that the purpose of the evaporative systems is to reduce sensible heat, as conventional air conditioning equipment reduces both sensible and latent heat.
Experimental tests were performed on two existing evaporative systems: Munters Bb 150 and Munters FCA 5–20, shown in Figure 2 and Figure 3, respectively.
Munters Bb 150 is an industrial unit with a 200 mm thick panel, while Munters FCA 5–20 is for residential use with a 100 mm thick panel and single-phase fan motor.
Munters Bb 150 has fixed axial fans with six-bladed propellers that are statically and dynamically balanced seeking a lower noise and vibration level. As the system was located in Curitiba (Brazil), sensible heating was carried out to match the environmental conditions suggested in the EvaCOP method.
The data obtained in field tests are shown in Table 3.
Using Equation (5), the following results were obtained:
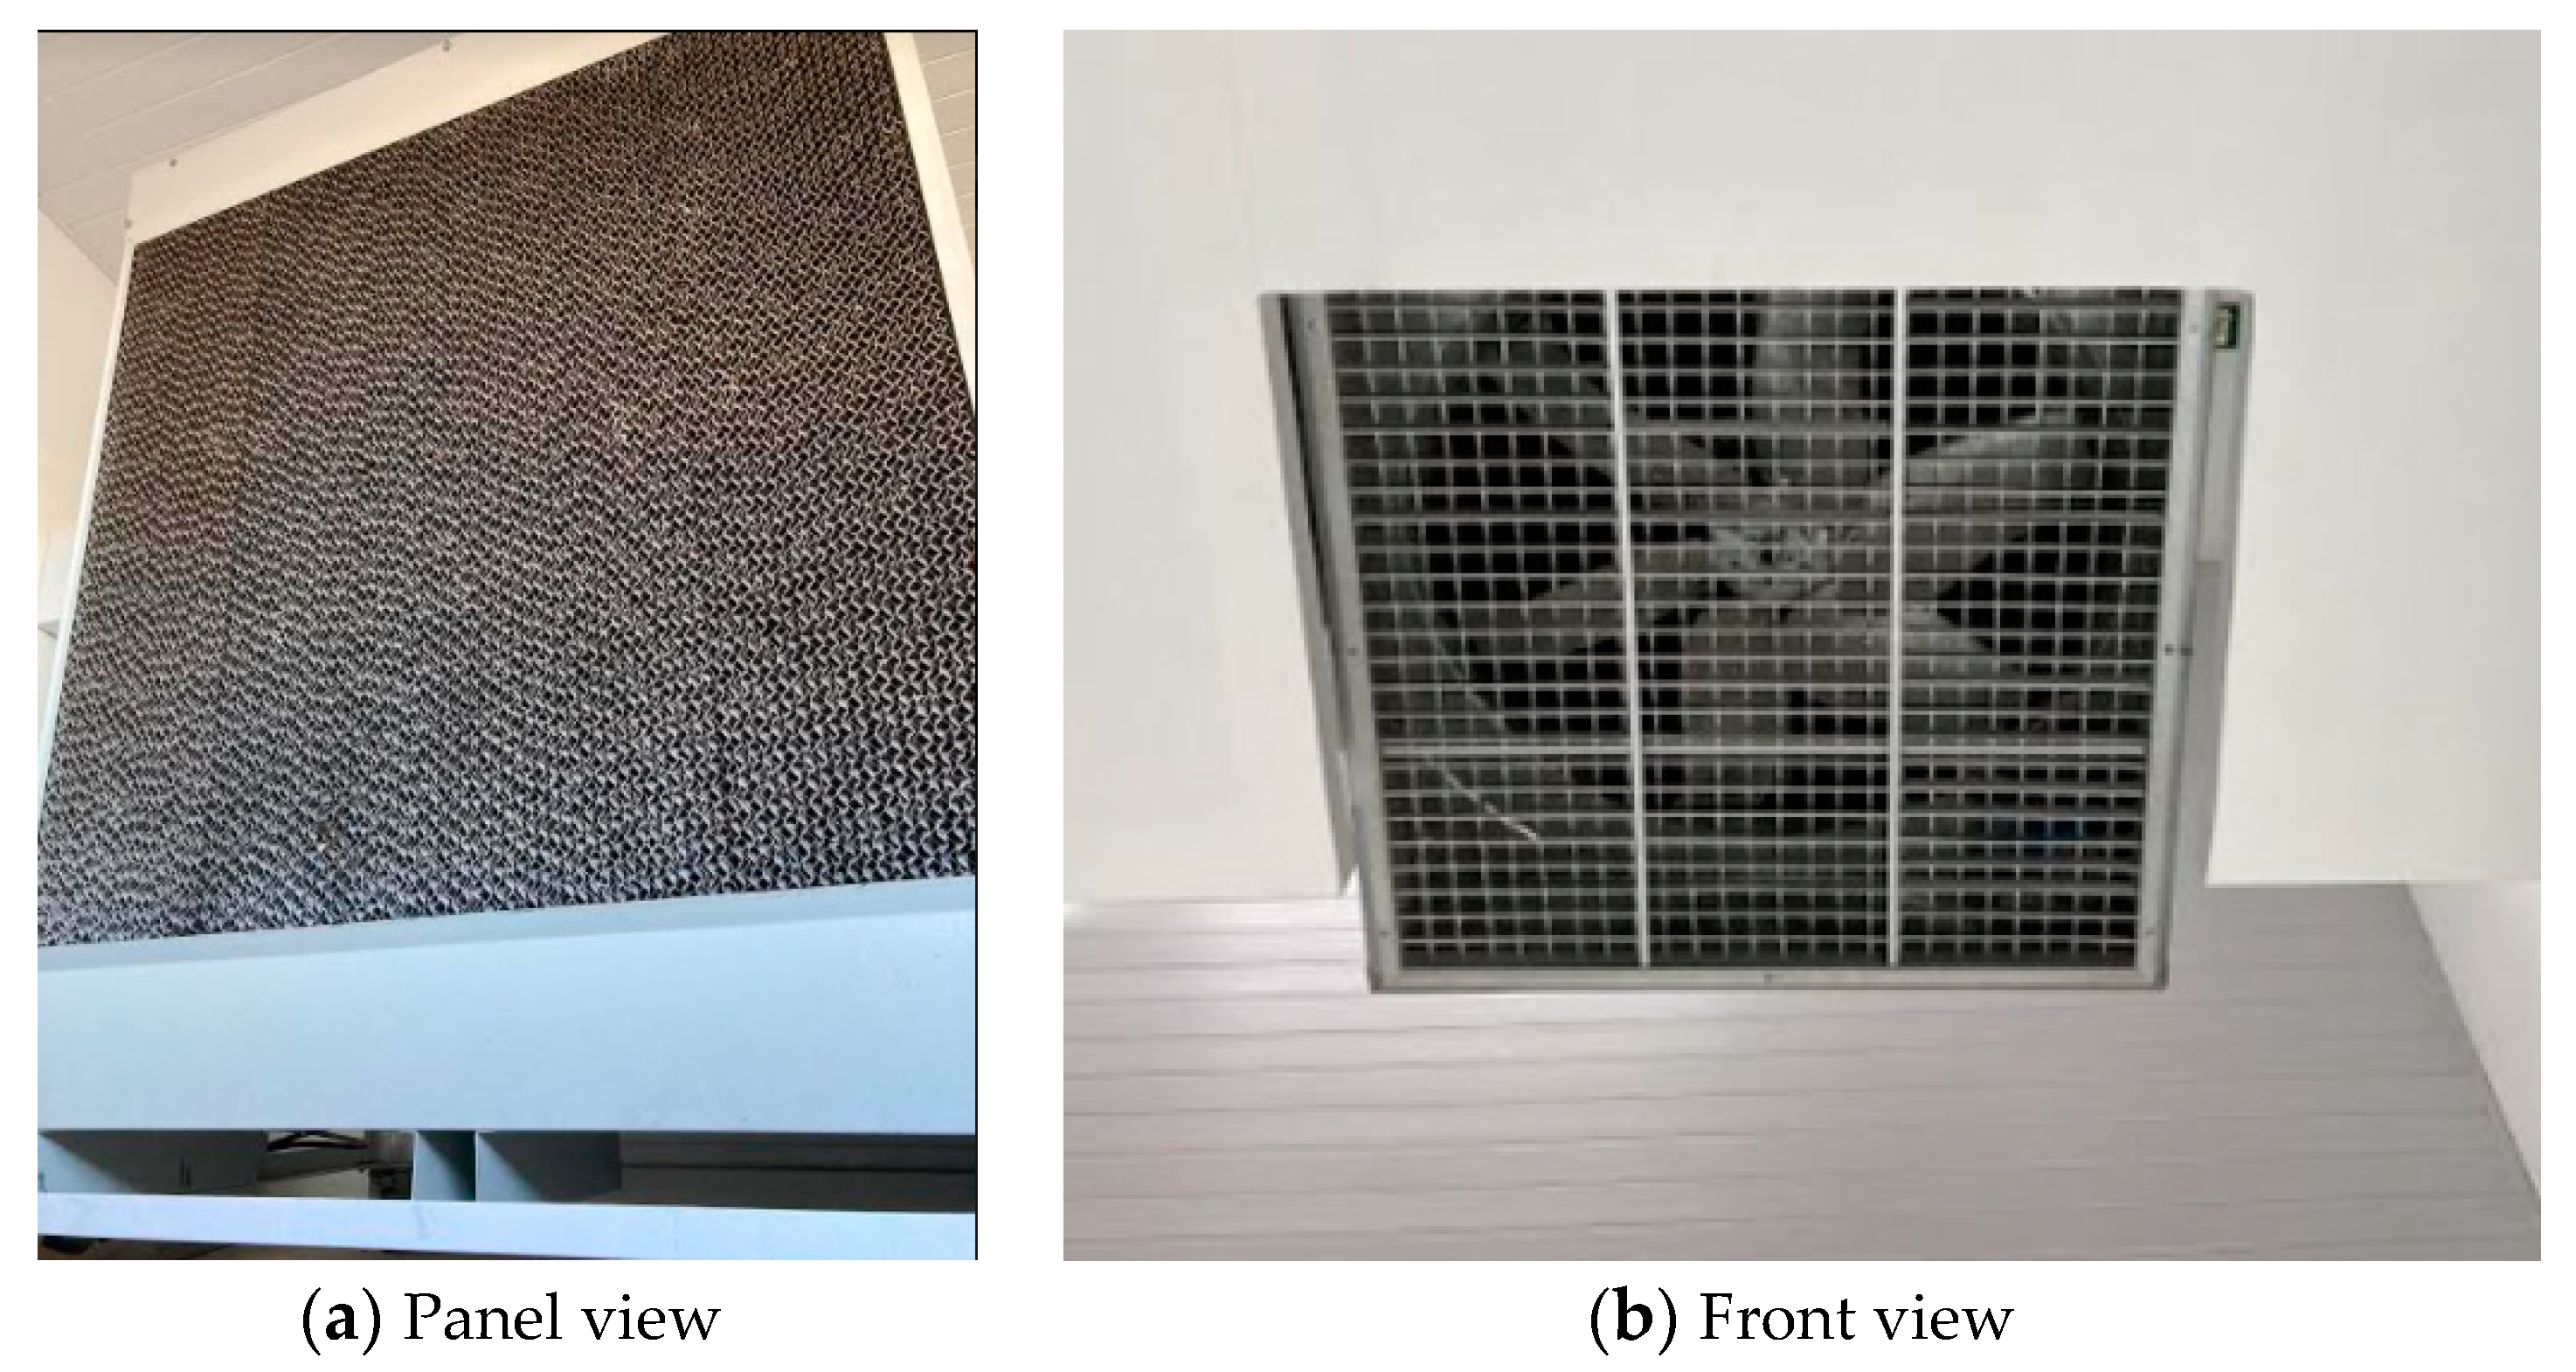
  • EvaCOPMunters Bb 150 = 45.58 W/W.
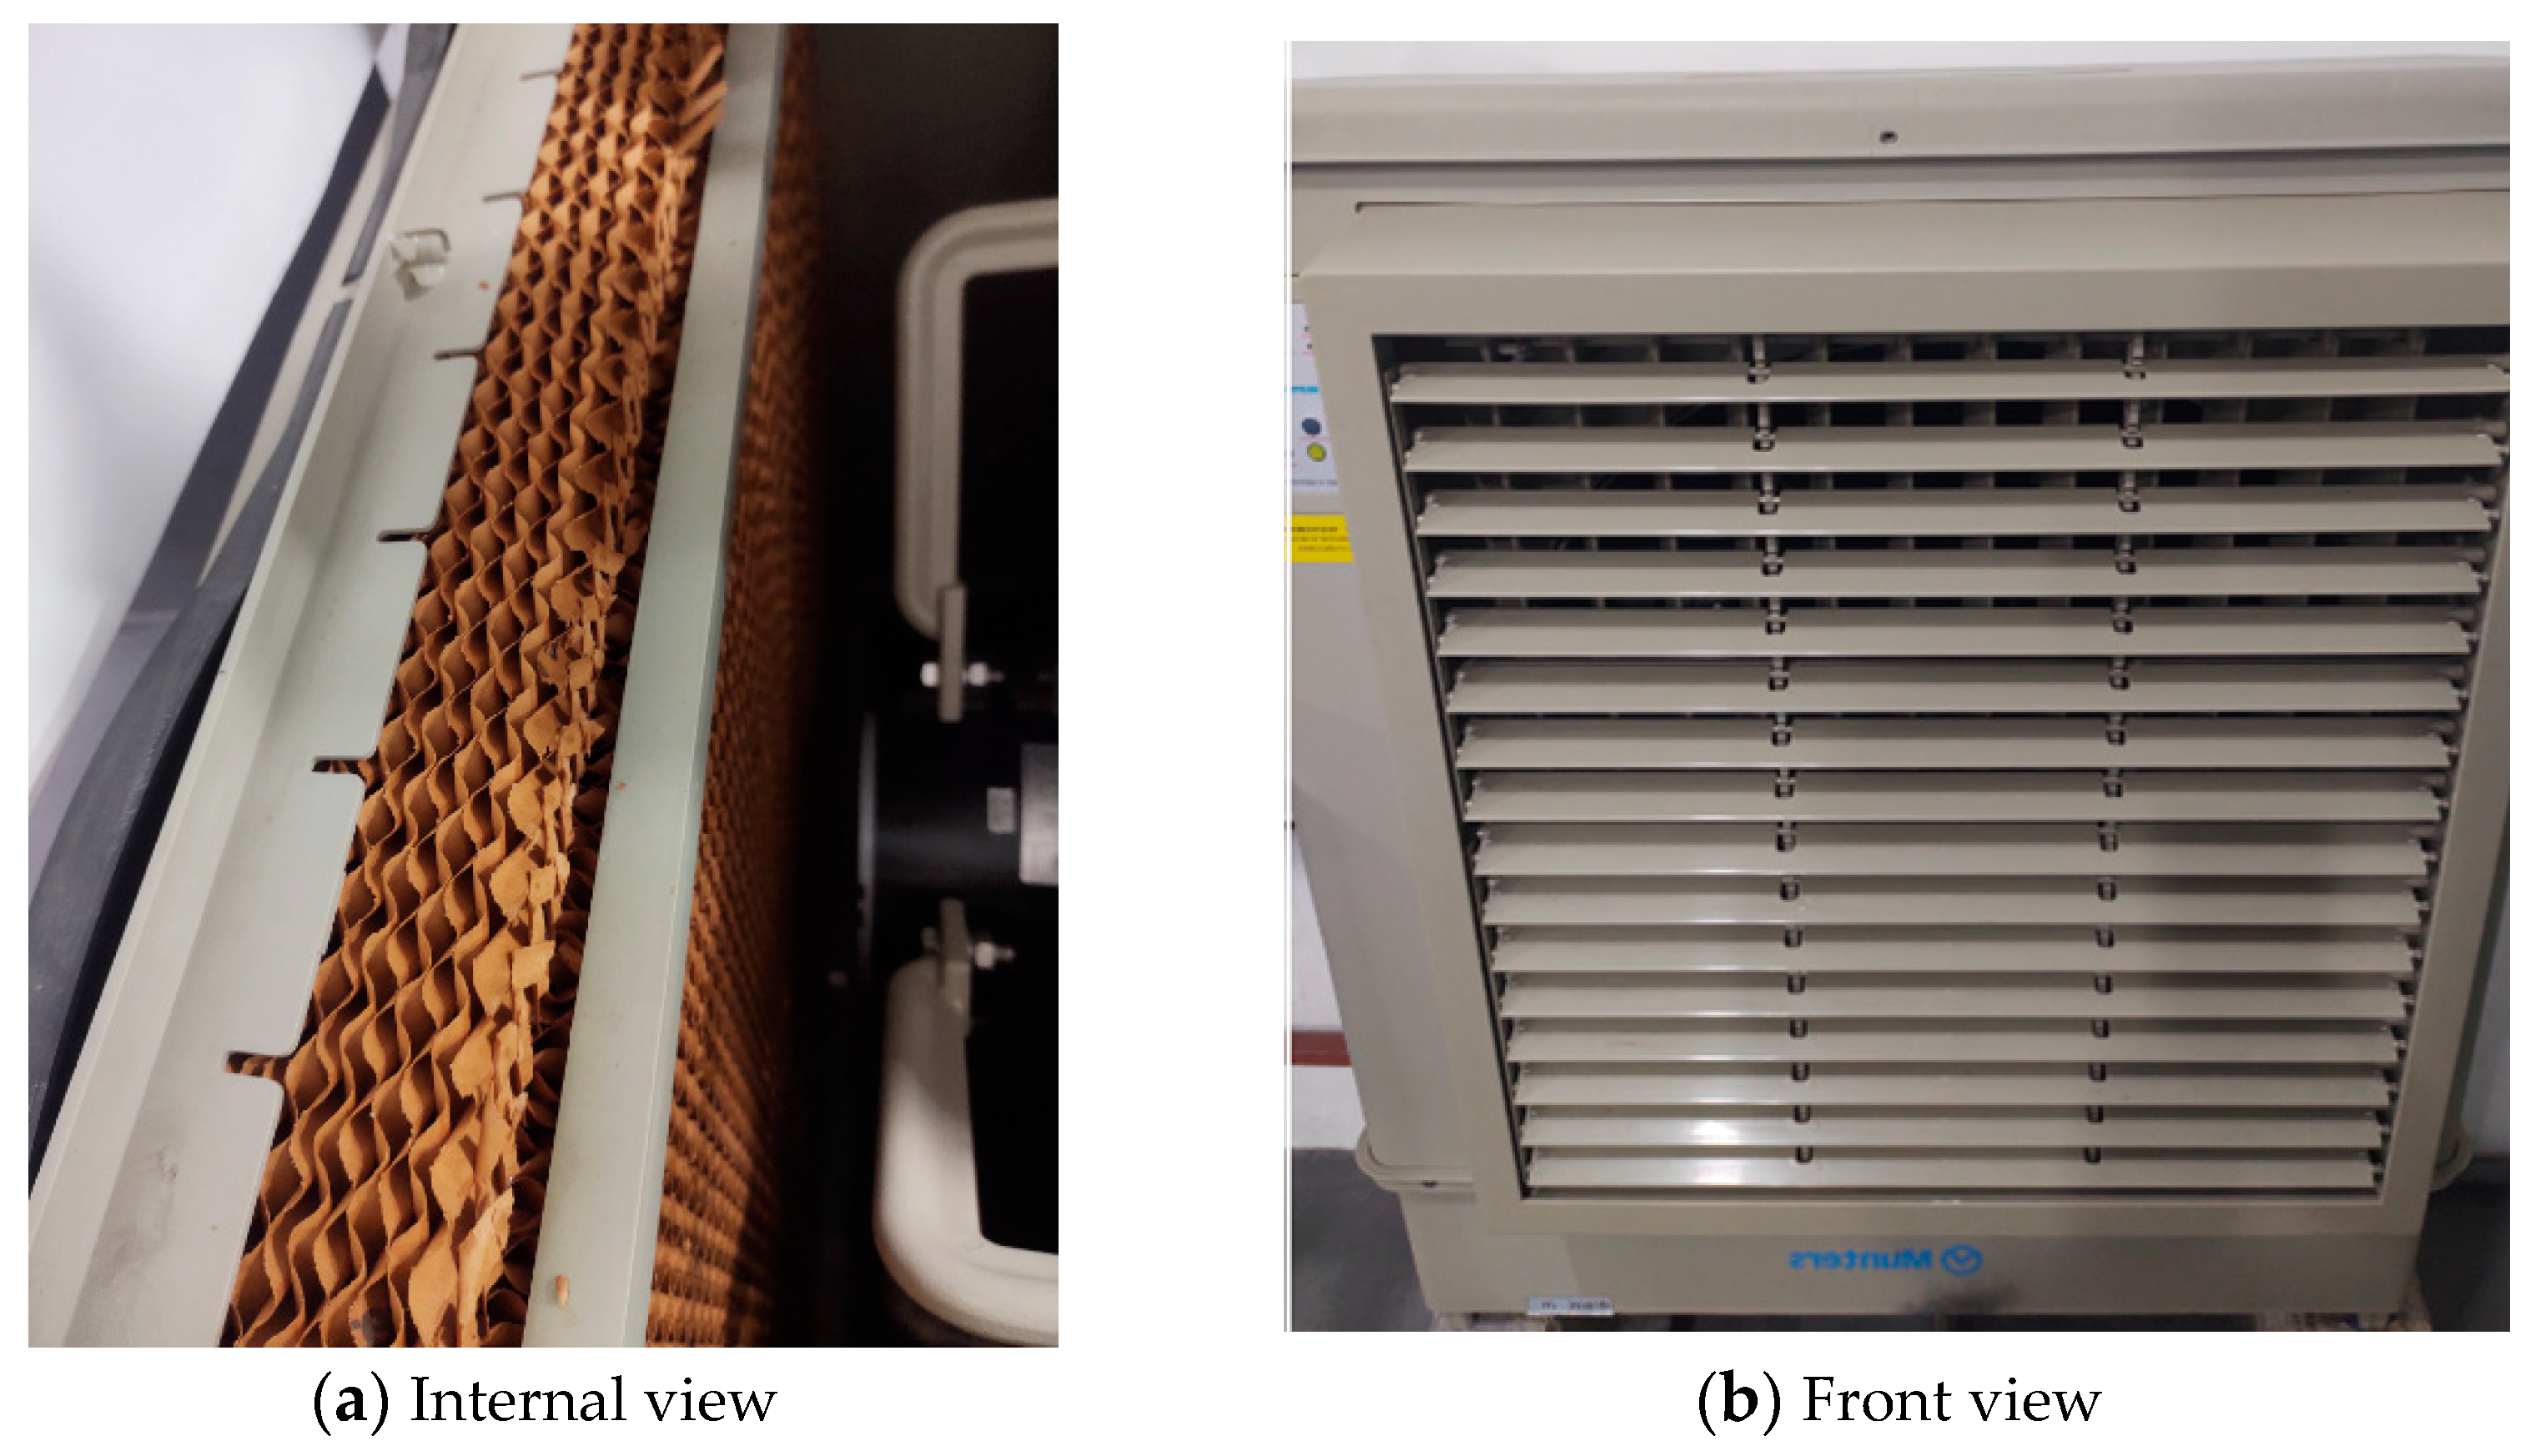
  • EvaCOPMunters FCA 5–20 = 25.77 W/W.

3. Results and Discussion

The Munters Bb 150 evaporative system, which has a 200 mm thick evaporative panel and high-performance fan, achieved a much better result than the small evaporative system with a single-phase motor and only 100 mm of panel thickness. In order to obtain the results of the two different evaporative systems, two tests were carried out on each piece of equipment. The flow was measured with a calibrated balometer and the dry- and wet-bulb temperatures with a calibrated psychometer. A difference of 1.8 times shows the effectiveness of the EvaCOP index in comparing evaporative equipment. Although the equipment is energy efficient, electronic fans would certainly increase the energy efficiency. In the case of higher static pressure being required, the actual or other types of fans, such as centrifugal, limited load, or plenum, would need more electricity. This index can use the same equation but separated into categories as already occurs in other equipment, for example in VRF. The EvaCOP index can be separated into ductless evaporative cooling (EvaCOP ductless) and duct evaporative cooling (EvaCOP duct).
An advantage of the EvaCOP index is that manufacturers can compare the efficiency of various models; for example, by testing 6 inch, 8 inch, or 12 inch cooling pads and with various fan static air pressure ranges, without fixed static pressure, being able to simply associate the index with its specific static pressure, specifically in the portable equipment fixing the air flow. In addition, it is an index of easy interpretation, as the performance of the evaporative panels is related to the energy efficiency resulting from the efficient electric consumption of fans and pumps connected to the panel’s efficiency, so the EvaCOP index merges these conditions into a single value, making it possible to compare various technologies, models, and brands of evaporative systems. It has its parameters basically established in the performance coefficient (COP), with more real air intake data using data from the 29 most populous cities in the world. It becomes more feasible to compare evaporative systems with air conditioning with a compression cycle. Table 4 compares the COP [36] of HVAC systems with EvaCOP.
Although air conditioning and evaporative systems are different technologies, both aim to reject heat. The COP in a traditional refrigeration system with a compression cycle (refrigeration cycle) is the ratio of the total net cooling capacity to the total input power.
The EvaCOP is the ratio of the sensible capacity by the total input power.
In refrigeration cycles, there are variations of COP according to the different technologies. Water-cooled chillers with centrifugal compressors can reach 6.29 W/W, while small air conditioning systems with condensing units can reach 3.81 W/W. It is important to highlight that these parameters of ASHRAE 90.1-2019 are for high-performance equipment used on a baseline for the Leadership in Energy and Environmental Design (LEED) certification. Just as the technology influences the COP of the refrigeration cycle, the EvaCOP methodology is able to measure COP in adiabatic systems with different technologies in evaporative systems.
In many situations, the cooling solutions in the traditional refrigeration cycle compete with evaporative systems, for example in turbines cooling. In other systems, they are complementary, as in condensers cooling. Additionally, in other systems, they are hybrid, as in data center cooling.
As shown in Table 4, the differences in values between systems’ COPs are large. While the best COP in the refrigeration cycle was obtained for a water-cooled centrifugal chiller system (COP = 6.286 W/W), the EvaCOP for Munters Bb 150 was 45.58 W/W, and for Munters FCA 5–20, the EvaCOP was 25.77 W/W, a difference of 7.24 times and 4.09 times, respectively, to the best COP value.
Energy saving is a great advantage of evaporative cooling, but it goes far beyond, as the refrigerant fluid (R-410 A) of the air conditioning systems with a compression cycle has a high global warming potential (GWP). For example, a thermal load of 400 tons of refrigeration with a variable refrigerant flow (VRF) system leaves the factory with refrigerant fluid that generates CO2 emissions of 1,064,880 kg [37], while the emission of the evaporative cooling system is null, as the fluid that exchanges heat is water [38].
The aim of this paper is to holistically visualize the energy efficiency of removing sensible heat from evaporative systems, but the association of direct and indirect cascade evaporation may include a new additional indicator that would be how close the air supply is to the dew point temperature. For example, a supposedly perfect evaporative cascade (with 100% efficiency of direct and indirect evaporative exchangers) in the conditions of the 29 most populous cities in the world (DBT = 32 °C and WBT = 23 °C in the admission of air in the evaporative system) could have an air supply temperature equal to the dew point, which in this case would be at sea level of 18.8 °C. With low environmental impact, there are also evaporative systems associated with desiccant systems that can combine the ability to remove sensible and latent heat with the absence of refrigerant fluid [39].

4. Conclusions

Creating real parameters to measure energy efficiency in evaporative systems is essential, given the difficulty justified by the large number of variables. The EvaCOP index proposed in the article aims to contribute to this direction, providing a simple and viable parameter to measure and evaluate the energy efficiency of evaporative systems. While the air conditioning equipment based on the values of ASHRAE 90.1-2019 has parameters close to the usual characteristics such as the IPLV, which takes into account the main cities in the United States of America, the same does not happen in evaporative systems. Although air conditioning and evaporative systems are different technologies, both aim to reject heat. The performance differences can be significant. EvaCOP allows simplifying the comparison of the energy efficiency of the systems. EvaCOP is an index based on the weighted average dry- and wet-bulb temperatures of the 29 most populous cities in the world. It can be an index to help improve energy efficiency technology globally. As Lord Kelvin said: “If you can’t measure it, you can’t improve it.”

Author Contributions

Conceptualization, A.F.S. and P.D.G.; methodology, A.F.S.; validation, A.F.S. and H.J.L.S.; formal analysis, A.F.S. and P.D.G.; investigation, A.F.S.; resources, H.J.L.S.; data curation, A.F.S. and P.D.G.; writing—original draft preparation, A.F.S. and H.J.L.S.; writing—review and editing, P.D.G.; visualization, H.J.L.S.; supervision, P.D.G.; project administration, A.F.S. All authors have read and agreed to the published version of the manuscript.

Funding

This research did not receive any specific subsidies from funding agencies in the public, commercial or non-profit sectors.

Institutional Review Board Statement

Not applicable.

Conflicts of Interest

The authors declare no conflict of interest.

Abbreviations

AHRIAir-Conditioning, Heating, and Refrigeration Institute
EvaCOPEvaporative System Coefficient of Performance
COPCoefficient of performance
EUEDEnergy usage effectiveness design
PDDPerfect Design Data Center
DCData center
ASHRAEAmerican Society of Heating, Refrigeration, and Air Conditioning Engineers
IPLVIntegrated part-load value
LEEDLeadership in Energy and Environmental Design
VRFVariable refrigerant volume
USAUnited States of America

References

  1. Watt, J.R. Evaporative Air Conditioning Handbook, 2nd ed.; Library of Congress Cataloging-in-Publication Data; Springer Science & Business Media: Berlin/Heidelberg, Germany, 2012. [Google Scholar] [CrossRef]
  2. Munters, C.G. Method of Impregnating Multilayer Paper Insulation. U.S. Patent 777,534, 2 October 1947. [Google Scholar]
  3. Porumba, B.; Ungureşana, P.; Tutunarua, L.F.; Serband, A.; Bălana, M. A review of indirect evaporative cooling operating conditions and performances. In Proceedings of the Sustainable Solutions for Energy and Environment, EENVIRO—YRC 2015, Bucharest, Romania, 18–20 November 2015. [Google Scholar]
  4. Taware, O.H.; Hanumant, K.G.; Manohar, J.V.; Sunil, K.A.; Balaso, D.R. Review paper on evaporative cooling system (141053). Int. J. Innov. Eng. Res. Technol. 2017, 1, 34–39. [Google Scholar]
  5. Lei, N.; Masanet, E. Statistical Analysis for Predicting Location-Specific Data Center PUE and Its Improvement Potential. In Energy; Department of Mechanical Engineering, Northwestern University: Evanston, IL, USA; Department of Chemical and Biological Engineering, Northwestern University: Evanston, IL, USA; Bren School of Environmental Science and Management, University of California: Santa Barbara, CA, USA, 15 June 2020; Volume 201. [Google Scholar]
  6. Santos, A.F.; de Souza, H.J.L.; Gaspar, P.D. Evaluation of the heat and energy performance of a data center for a new efficiency indicator: Energy Usage Effectiveness Design—EUED. Braz. Arch. Biol. Technol. 2019, 62. [Google Scholar] [CrossRef]
  7. Santos, A.F.; Gaspar, P.D.; de Souza, H.J.L. New datacenter performance indicator: Perfect Design Datacenter—PDD. Climate 2020, 8, 110. [Google Scholar] [CrossRef]
  8. Zero Net Energy. Indirect Evaporative Cooling; California Public Utilities Commission (CPUC) Energy Efficiency Strategic Plan; ZNE Technology Application Guides; Net Zero Energy Design: Hoboken, NJ, USA, 2013. [Google Scholar]
  9. ASHRAE. Standard 90.1-2019 (SI Edition)—Energy Standard for Buildings Except Low-Rise Residential Buildings (ANSI Approved; IES Co-Sponsored); ASHRAE: Atlanta, GA, USA, 2019. [Google Scholar]
  10. AHRI 210/240—Performance Rating of Unitary Air-Conditioning & Air-Source Heat Pump Equipment; AHRI: Arlington, VA, USA, 2017.
  11. AHRI 340/360—Performance Rating of Commercial and Industrial Unitary Air-Conditioning and Heat Pump Equipment; AHRI: Arlington, VA, USA, 2019.
  12. AHRI 365—Performance Rating of Commercial and Industrial Unitary Air-Conditioning Condensing Units; AHRI: Arlington, VA, USA, 2009.
  13. AHRI 551/591—Performance Rating of Water-Chilling and Heat Pump Water-Heating Packages Using the Vapor Compression Cycle; AHRI: Arlington, VA, USA, 2011.
  14. AHRI 560—Absorption Water Chilling and Water Heating Packages; AHRI: Arlington, VA, USA, 2000.
  15. AHRI 310/380—Package Terminal Air-Conditioners and Heat Pumps; AHRI: Arlington, VA, USA, 2017.
  16. AHRI 390—Performance Rating of Single Package Vertical Air-Conditioners and Heat Pumps; AHRI: Arlington, VA, USA, 2003.
  17. AHRI 1230—Performance Rating of Variable Refrigerant Flow (VRF) Multi-Split Air-Conditioning and Heat Pump Equipment; AHRI: Arlington, VA, USA, 2014.
  18. AHRI. AHRI Standard 1361. Standard for Performance Rating of Computer and Data Processing Room Air Conditioners; AHRI: Arlington, VA, USA, 2017. [Google Scholar]
  19. AHRI 1360—Performance Rating of Computer and Data Processing Room Air Conditioners; AHRI: Arlington, VA, USA, 2017.
  20. AHRI 1201—Performance Rating of Portable Flue Gas Combustion Analyzers; AHRI: Arlington, VA, USA, 2017.
  21. AHRI 921—Performance Rating of DX-Dedicated Outdoor Air System Units; AHRI: Arlington, VA, USA, 2015.
  22. Dhamneya, A.K.; Rajput, S.P.S.; Singh, A. Thermodynamic performance analysis of direct evaporative cooling system for increased heat and mass transfer area. Ain Shams Eng. J. 2018, 9. [Google Scholar] [CrossRef]
  23. Ndukwu, M.C.; Manuwa, S.I. Review of research and application of evaporative cooling in preservation of fresh agricultural produce. Int. J. Agric. Biol. Eng. 2014, 7, 85–102. [Google Scholar] [CrossRef]
  24. Munters. CELdek® 7090-15—Evaporative Cooling Pad. Available online: https://www.munters.com/globalassets/inriver/resources/products/coolers--humidifiers/1782-celdek-7090_15_gb.pdf (accessed on 20 November 2020).
  25. Ebinuma, C.D.; Camargo, J.R.; Cardoso, S. Three Methods to Evaluate the Use of Evaporative Cooling for Human Thermal; Universidade de Taubaté—Departamento de Engenharia Mecânica: Taubaté, SP, Brazil; Universidade do Estado de São Paulo—Departamento de Energia: Guaratinguetá, SP, Brazil, 2006. [Google Scholar]
  26. Kinney, L. Evaporative Cooling for a Growing Southwest: Technology, Markets, and Economics, Southwest Energy Efficiency Project.
  27. NREL. Improving Fan System Performance, a Sourcebook for Industry; DOE/GO-102003-1294; U.S. Department of Energy Efficiency and Renewable Energy—NREL; Air Movement and Control Association International, Inc.: Arlington Heights, IL, USA, 2003.
  28. EUROVENT. Rating Standard for the Certification of Direct Evaporative Cooling. Available online: https://www.eurovent-certification.com/sites/default/files/downloads/EC%20-%20RS%209_C_004-2018%20-%20DEC.pdf (accessed on 21 April 2021).
  29. EUROVENT. Rating Standard for the Certification of Indirect Evaporative Cooling. Available online: https://www.eurovent-certification.com/sites/default/files/downloads/EC%20-%20RS%209_C_005-2018%20-%20IEC.pdf (accessed on 21 April 2021).
  30. Alliedmarketresearch. Portable-Evaporative-Air-Cooler-Market. Available online: https://www.alliedmarketresearch.com/portable-evaporative-air-cooler-market (accessed on 21 April 2021).
  31. Energyvanguard. Do High-MERV Filters Always Reduce Air Flow? Available online: https://www.energyvanguard.com/blog/do-high-merv-filters-always-reduce-air-flow/ (accessed on 21 April 2021).
  32. Saman, W.; Bruno, F.; Tay, S. Technical Research on Evaporative Air Conditioners and Feasibility of Rating Their Energy Performance; Institute for Sustainable Systems e Technologies—UNISA: Sydney, Australia, 2010. [Google Scholar]
  33. AHRI Standard 550/590 (I-P). Performance Rating of Water-Chilling and Heat Pump Water-Heating Packages Using the Vapor Compression Cycle; AHRI: Arlington, VA, USA, 2015. [Google Scholar]
  34. United Nations Department of Economic and Social Affairs, Population Division. The World’s Cities in 2018; ST/ESA/SER.A/417 Data Booklet; UN: New York, NY, USA, 2018. [Google Scholar]
  35. ASHRAE. SHRAE Weather Data Viewer, Version 5.0; ASHRAE: Atlanta, GA, USA, 2016. [Google Scholar]
  36. Yu, Z.; Santos, A.F.; Bidarmaghv, A.; Narsilio, G.; Aye, L. Heating and Cooling Loads of a Poultry Shed in Central Coast; University of Melbourne: Melbourne, Australia, 2017. [Google Scholar]
  37. Santos, A.F.; Gaspar, P.D.; Souza, H.J.L. Ecoenergetic comparison of HVAC systems in data centers. Climate 2021, 9, 42. [Google Scholar] [CrossRef]
  38. Dubey, M.; Rajput, S.P.S. Development and performance evaluation of a semi indirect evaporative cooler. In Proceedings of the International Refrigeration and Air Conditioning Conference, West Lafayette, IN, USA, 14–17 July 2008. [Google Scholar]
  39. Narayanan, R.; Halawa, E.; Jain, S. Article performance characteristics of solid-desiccant evaporative cooling systems. Energies 2018, 11, 2574. [Google Scholar] [CrossRef] [Green Version]
Figure 1. Example of efficiency of an evaporative system.
Energies 14 02689 g001
Figure 2. Munters Bb 150 evaporative equipment.
Energies 14 02689 g002
Figure 3. Munters FCA 5–20 evaporative equipment.
Energies 14 02689 g003
Table 1. World cities and their populations [34].
N.°CityCountryPopulation (×1000)
1TokyoJapan37,468
2DelhiIndia28,514
3ShanghaiChina25,582
4São PauloBrazil21,650
5Mexico CityMexico21,581
6Al-Qāhirah, CairoEgypt20,076
7MumbaiIndia19,980
8BeijingChina19,618
9DhakaBangladesh19,578
10OsakaJapan19,281
11New YorkUSA18,810
12KarachiPakistan15,400
13Buenos AiresArgentina14,967
14ChongqingChina14,838
15IstanbulTurkey14,751
16CalcuttaIndia14,681
17ManilaPhilippines13,482
18LagosNigeria13,462
19Rio de JaneiroBrazil13,293
20TianjinChina13,215
21KinshasaDemocratic Republic Congo13,171
22GuangzhouChina12,638
23Los AngelesUSA12,458
24MoscowRussia12,410
25ShenzhenChina11,908
26LahorePakistan11,738
27BangaloreIndia11,440
28ParisFrance10,901
29BogotaColombia10,574
Table 2. Single and dry-bulb temperature [35].
N.°CityCountryDBT(2%) [°C]WBT(2%) [°C]
1TokyoJapan31.124.3
2DelhiIndia40.822.5
3ShanghaiChina32.626.3
4São PauloBrazil30.020.4
5Mexico CityMexico26.913.6
6Al-Qahirah-CairoEgypt35.821.8
7MumbaiIndia33.923.4
8BeijingChina32.022.4
9DhakaBangladesh35.426.8
10OsakaJapan32.224.7
11New YorkUSA28.721.7
12KarachiPakistan36.023.5
13Buenos AiresArgentina28.522.3
14ChongqingChina34.225.2
15IstanbulTurkey29.121.0
16CalcuttaIndia35.426.8
17ManilaPhilippines33.226.3
18LagosNigeria40.820.8
19Rio de JaneiroBrazil31.824.8
20TianjinChina31.723.0
21KinshasaDemocratic Republic Congo32.924.5
22GuangzhouChina33.826.1
23Los AngelesUSA25.317.9
24MoscowRussia25.619.1
25ShenzhenChina32.426.2
26LahorePakistan40.123.0
27BangaloreIndia32.619.8
28ParisFrance26.618.6
29BogotaColômbia20.113.3
Average 32.0523.14
Table 3. Laboratory test results.
ParameterBb 150 MuntersFCA 5–20 Munters
Environment DBT (°C)3232
Environment WBT (°C)2323
Flow rate (measured), V ˙ ˙ (m3/h)14,8005050
Flow rate (catalog), V ˙ (m3/h)15,0005000
Discharge DBT (°C)25.426.8
Discharge air density, ρ (kg/m3)1.021.02
Power consumption, W (W)610290
Cooling pad typeCeldek Munters 8 inch
(≈200 mm thick)
Celdek Munters 4 inch
(≈100 mm thick)
Table 4. Comparison of the ASHRAE 90.1 index with EvaCOP.
HVAC SystemCapacity Range (kW)COP ASHRAE 90.1-2019 (W/W)
Air-cooled air conditioners<193.81
Space constrained, air cooled<93.52
Small duct, high velocity, air cooled<193.52
Air-cooled air conditioners>19 and <403.22
Air-cooled air conditioners>70 and <2233.22
Air-cooled air conditioners>40 and <712.87
Air-cooled chillers<5282.98
Air-cooled chillers>5282.98
Water-cooled centrifugal chillers<5285.77
Water-cooled centrifugal chillers>528 and <10555.77
Water-cooled centrifugal chillers>1055 and <14076.29
Water-cooled centrifugal chillers>1407 and <21106.29
Water-cooled centrifugal chillers>21106.29
Capacity range (kW)Laboratory test (W/W)
EvaCOP Munters Bb 15020.745.58
EvaCOP Munters FCA 5–207.4725.77
Publisher’s Note: MDPI stays neutral with regard to jurisdictional claims in published maps and institutional affiliations.

