1. Introduction
In modern times energy and information form the backbone of any economy and are a key component of economic growth and prosperity [
1]. Energy is considered to be a crucial factor for economic development [
2], an important driver for society [
3] and civilization [
4], and a principal facilitator of social development [
5]. Energy is required in many sectors, among them are industry, transport, residential, and services [
6], and that is why humankind is using diverse sources of energy to meet its needs [
7]. Most current activities, the standard of living of modern societies and the health of economies depend on a reliable, efficient, and affordable energy supply. Unexpected disturbances in energy supply systems may have enormous costs and other repercussions. For this very reason energy security has become vitally important worldwide [
8]. Currently the demand for energy is growing faster than ever, particularly in developing countries, which makes energy security a primary and extremely significant measure of national security [
9]. Moreover, energy security, as a cause of interdependence, is a key factor in international relations [
10]. It is often defined as “a feature (measure, situation, or status) in which a related system functions optimally and sustainably in all its dimensions, freely from any threats” [
11]. According to the Asia Pacific Energy Research Centre, energy security is defined as “the ability of an economy to guarantee the availability of the supply of energy resources in a sustainable and timely manner with the energy price being at a level that will not adversely affect the economic performance of the economy” [
12].
Energy security problems appeared on the political agenda at the beginning of the 20th century [
13] and the interest of researchers in this topic is cyclical, depending on the situation on the energy markets. Recently there has been a renaissance in its popularity, with increased interest from researchers, managers, and policy makers [
14]. One of the first integrated analytical approaches to the energy problem was presented in [
15]. The term “energy security” has also been evolving. In the 1970s and 1980s it meant undisturbed deliveries of inexpensive oil and other energy sources [
16], some attention was paid to better management practices in energy projects [
17] and more efficient use of energy technologies [
18]. In the 2000s the focus moved to ensuring equal access to energy for all social groups, as well as limiting the negative impact of the energy sector on the environment [
19] and the climate [
20].
Energy security is a multifaceted and changing concept and it is becoming increasingly popular as a research subject [
21]. It has become a regular feature of both academic and policy discussions [
22]. A large body of research focuses on defining and measuring energy security, e.g., [
14,
23], and, despite the rich literature on the subject, there is still no universal definition acceptable to all interested parties [
24,
25,
26]. This is because of the difficulties with assigning monetary values to the various aspects of energy security [
27]. Therefore, it is reasonable to consider specific features of a nation or an energy system when evaluating energy security.
The relationship between scarcity of natural (i.e., energy) resources and economic process was not always clear and obvious. Awareness of the problem increased gradually [
28]. In modern definitions of energy security four main elements can be identified [
12,
29,
30,
31,
32]:
Availability—the physical existence of energy;
Accessibility—the possibility of gaining access to energy resources taking into account geographic, political, demographic, and technological constraints;
Affordability—the possibility of accessing affordable energy sources;
Acceptability—the possibility of accessing sources that do not raise any objections, especially environmental ones.
The approach to energy security changes depending on the field in which the concept is examined: theoretical research on energy security takes place in both social sciences and liberal arts (political science, international relations, and economics), and in natural sciences (math and physics) [
14]. In the social sciences, researchers usually focus on the analysis of international relations, geopolitics, or various other aspects of political science [
33,
34]. Several studies underline the interdisciplinary approach to energy security [
35].
The standard approach in energy security evaluation is to estimate the four fundamental parameters of energy resources: availability, accessibility, affordability, and acceptability [
32,
36], among which accessibility and affordability are considered to be more important due to their impact on other aspects of energy security [
37]. The main components that are usually part of the definition of energy security are resource nationalism [
38], unthreatened supply of affordable energy, diversifying energy sources by creating an energy mix and using different suppliers, secure energy, issues related to infrastructure for transport and transmission of energy, future, expected and unexpected, market and geopolitical changes, as well as threats arising from or affecting the supply chain [
39]. The traditional concepts related to energy security, and hence to national security, are now also linked with the issues of human rights, personal security, energy justice, and sustainable development [
26].
The nature and meaning of the term “energy security” depends on the context. It is dynamic and understood in a variety of ways [
23]. The following concepts are among the most frequently associated with it: “reliable and uninterrupted supply”, “reasonable or affordable price”, “energy availability”, “diversity”, etc. On the other hand, concepts such as: “threat”, “risk”, “disruption”, “robustness”, “vulnerability”, or “resilience” do not get enough attention during the process of energy security modeling.
In recent years, a number of papers have been published on modeling and assessing energy security in various contexts. Many of them present or utilize existing complex quantitative indices that use advanced mathematics to transform multiple energy security metrics into a numerical score [
40,
41,
42,
43,
44]. It seems to be useful in communicating results and comparisons across diverse contexts, but on the other hand, it requires making a lot of assumptions, which may conceal some important information [
27,
45,
46]. Aggregated indices and rankings sometimes give conflicting results [
47,
48]. This is why some authors prefer to use a range of indicators without aggregation [
45,
49].
Currently, there is no common agreement as to an official set of indicators to assess energy security, as well as whether and what economic and environmental indicators should be taken into account in the process of energy security modeling [
50].
At the same time, there is an ongoing discussion about energy security, brought about by tensions affecting international security and the emergence of new geopolitical threats. For this reason, the authors found it worthwhile to assess the value of natural gas stocks. The valuation is made from the point of view of individual countries and considers their attitudes to the risk of disruption of deliveries.
In this paper the authors present an approach that can be used for valuation of energy security concerning the security of natural gas supply using stochastic modelling and based on the mathematical model of the
Newsvendor problem known from Inventory Theory. The main purpose of Inventory Theory is to determine rules which can be used to minimize costs of inventory and, at the same time, meet demand. It may be considered as a complementary approach to the flows-fund model [
15].
The main focus of this paper is on the risk of disruption of natural gas deliveries, which is a part of the problem of energy security for natural gas. Calculations and figures were conducted and created with the use of R language and RStudio IDE [
51]. The concept developed in this paper was originally presented during the World Gas Conference in Washington DC in 2018 [
52].
The following sections of the article describe the natural gas market in Europe, portray the method used to evaluate the security of natural gas storage, discuss the results, and present the conclusions.
2. Natural Gas Markets in Europe
Natural gas markets in European countries are now undergoing a period of rapid change and transformation into a free-market model. There are still many restrictions: legal, technical, economic, and even mental, but the emergence of a common European gas market seems to be inevitable. There are two revolutions that we have been observing for some time. The first is the industrial production of unconventional gas, which alters the balance of forces in natural gas markets around the world (although attempts to develop unconventional gas production in Europe have so far failed). “Unconventional” means that the gas is produced from geological formations that were long considered as not viable because of low permeability and other unfavorable factors. It includes, e.g., shale gas, coalbed methane, or tight gas. It is now produced worldwide, e.g., in the USA and Australia.
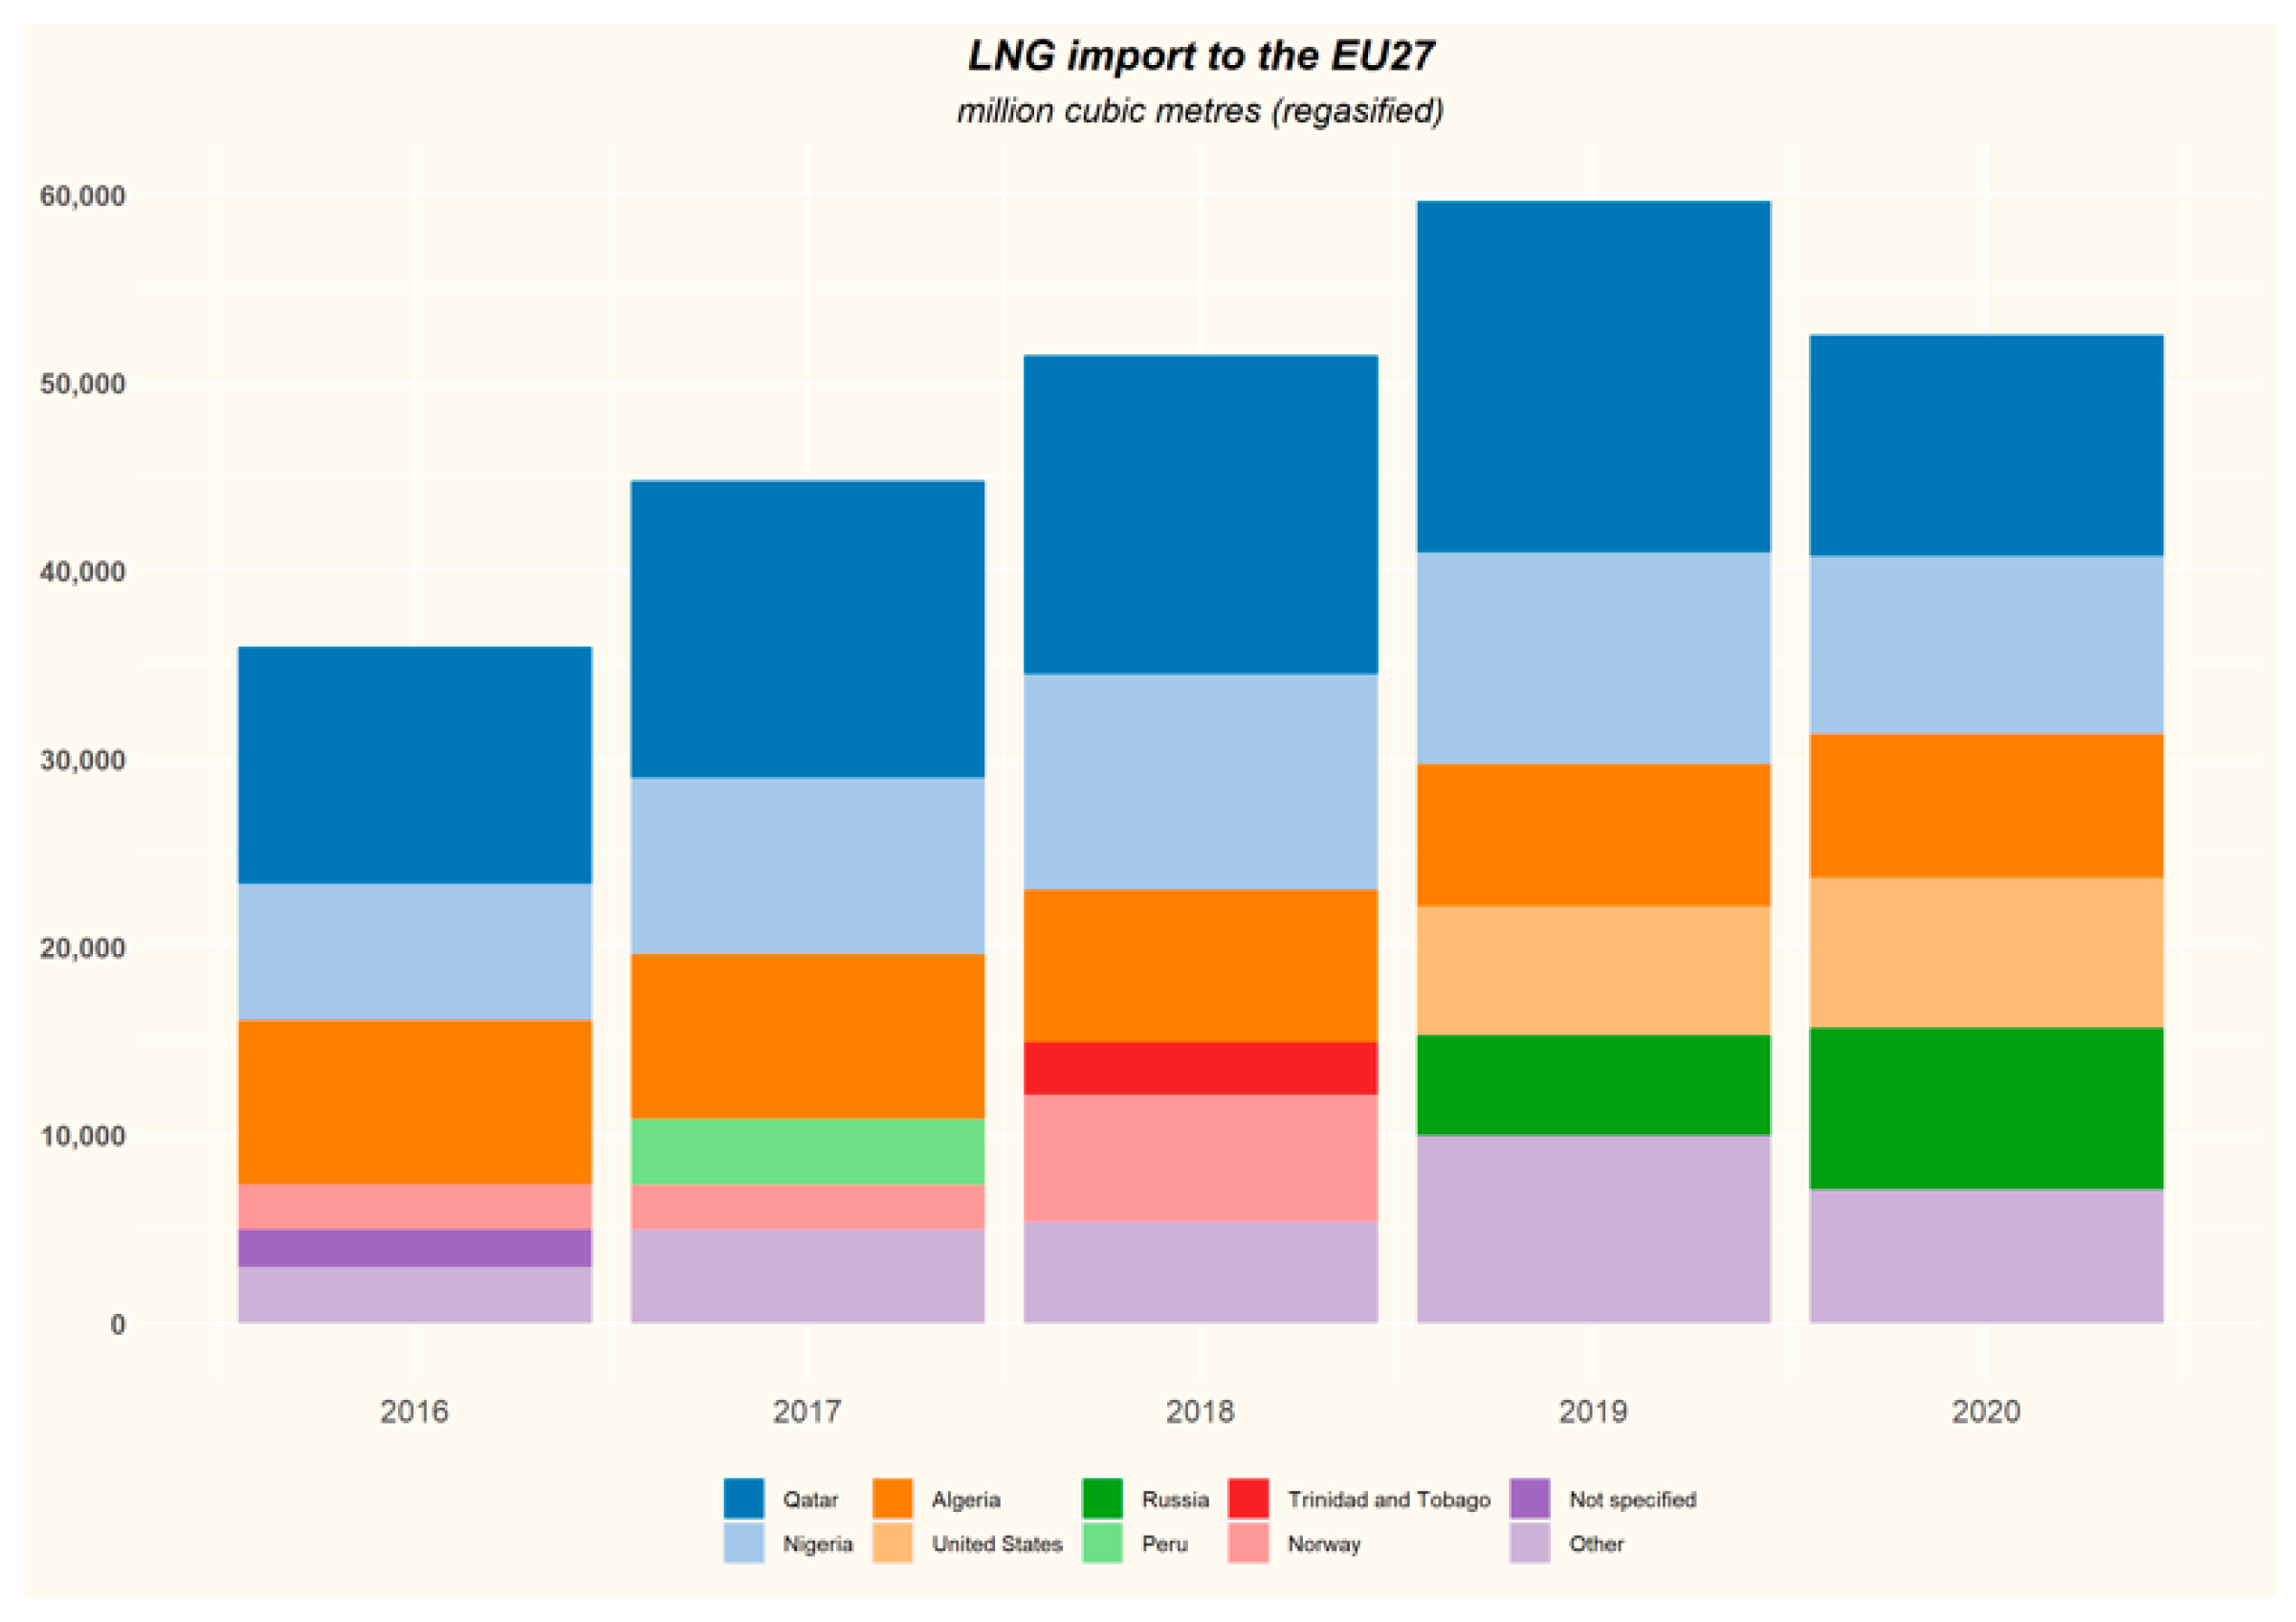
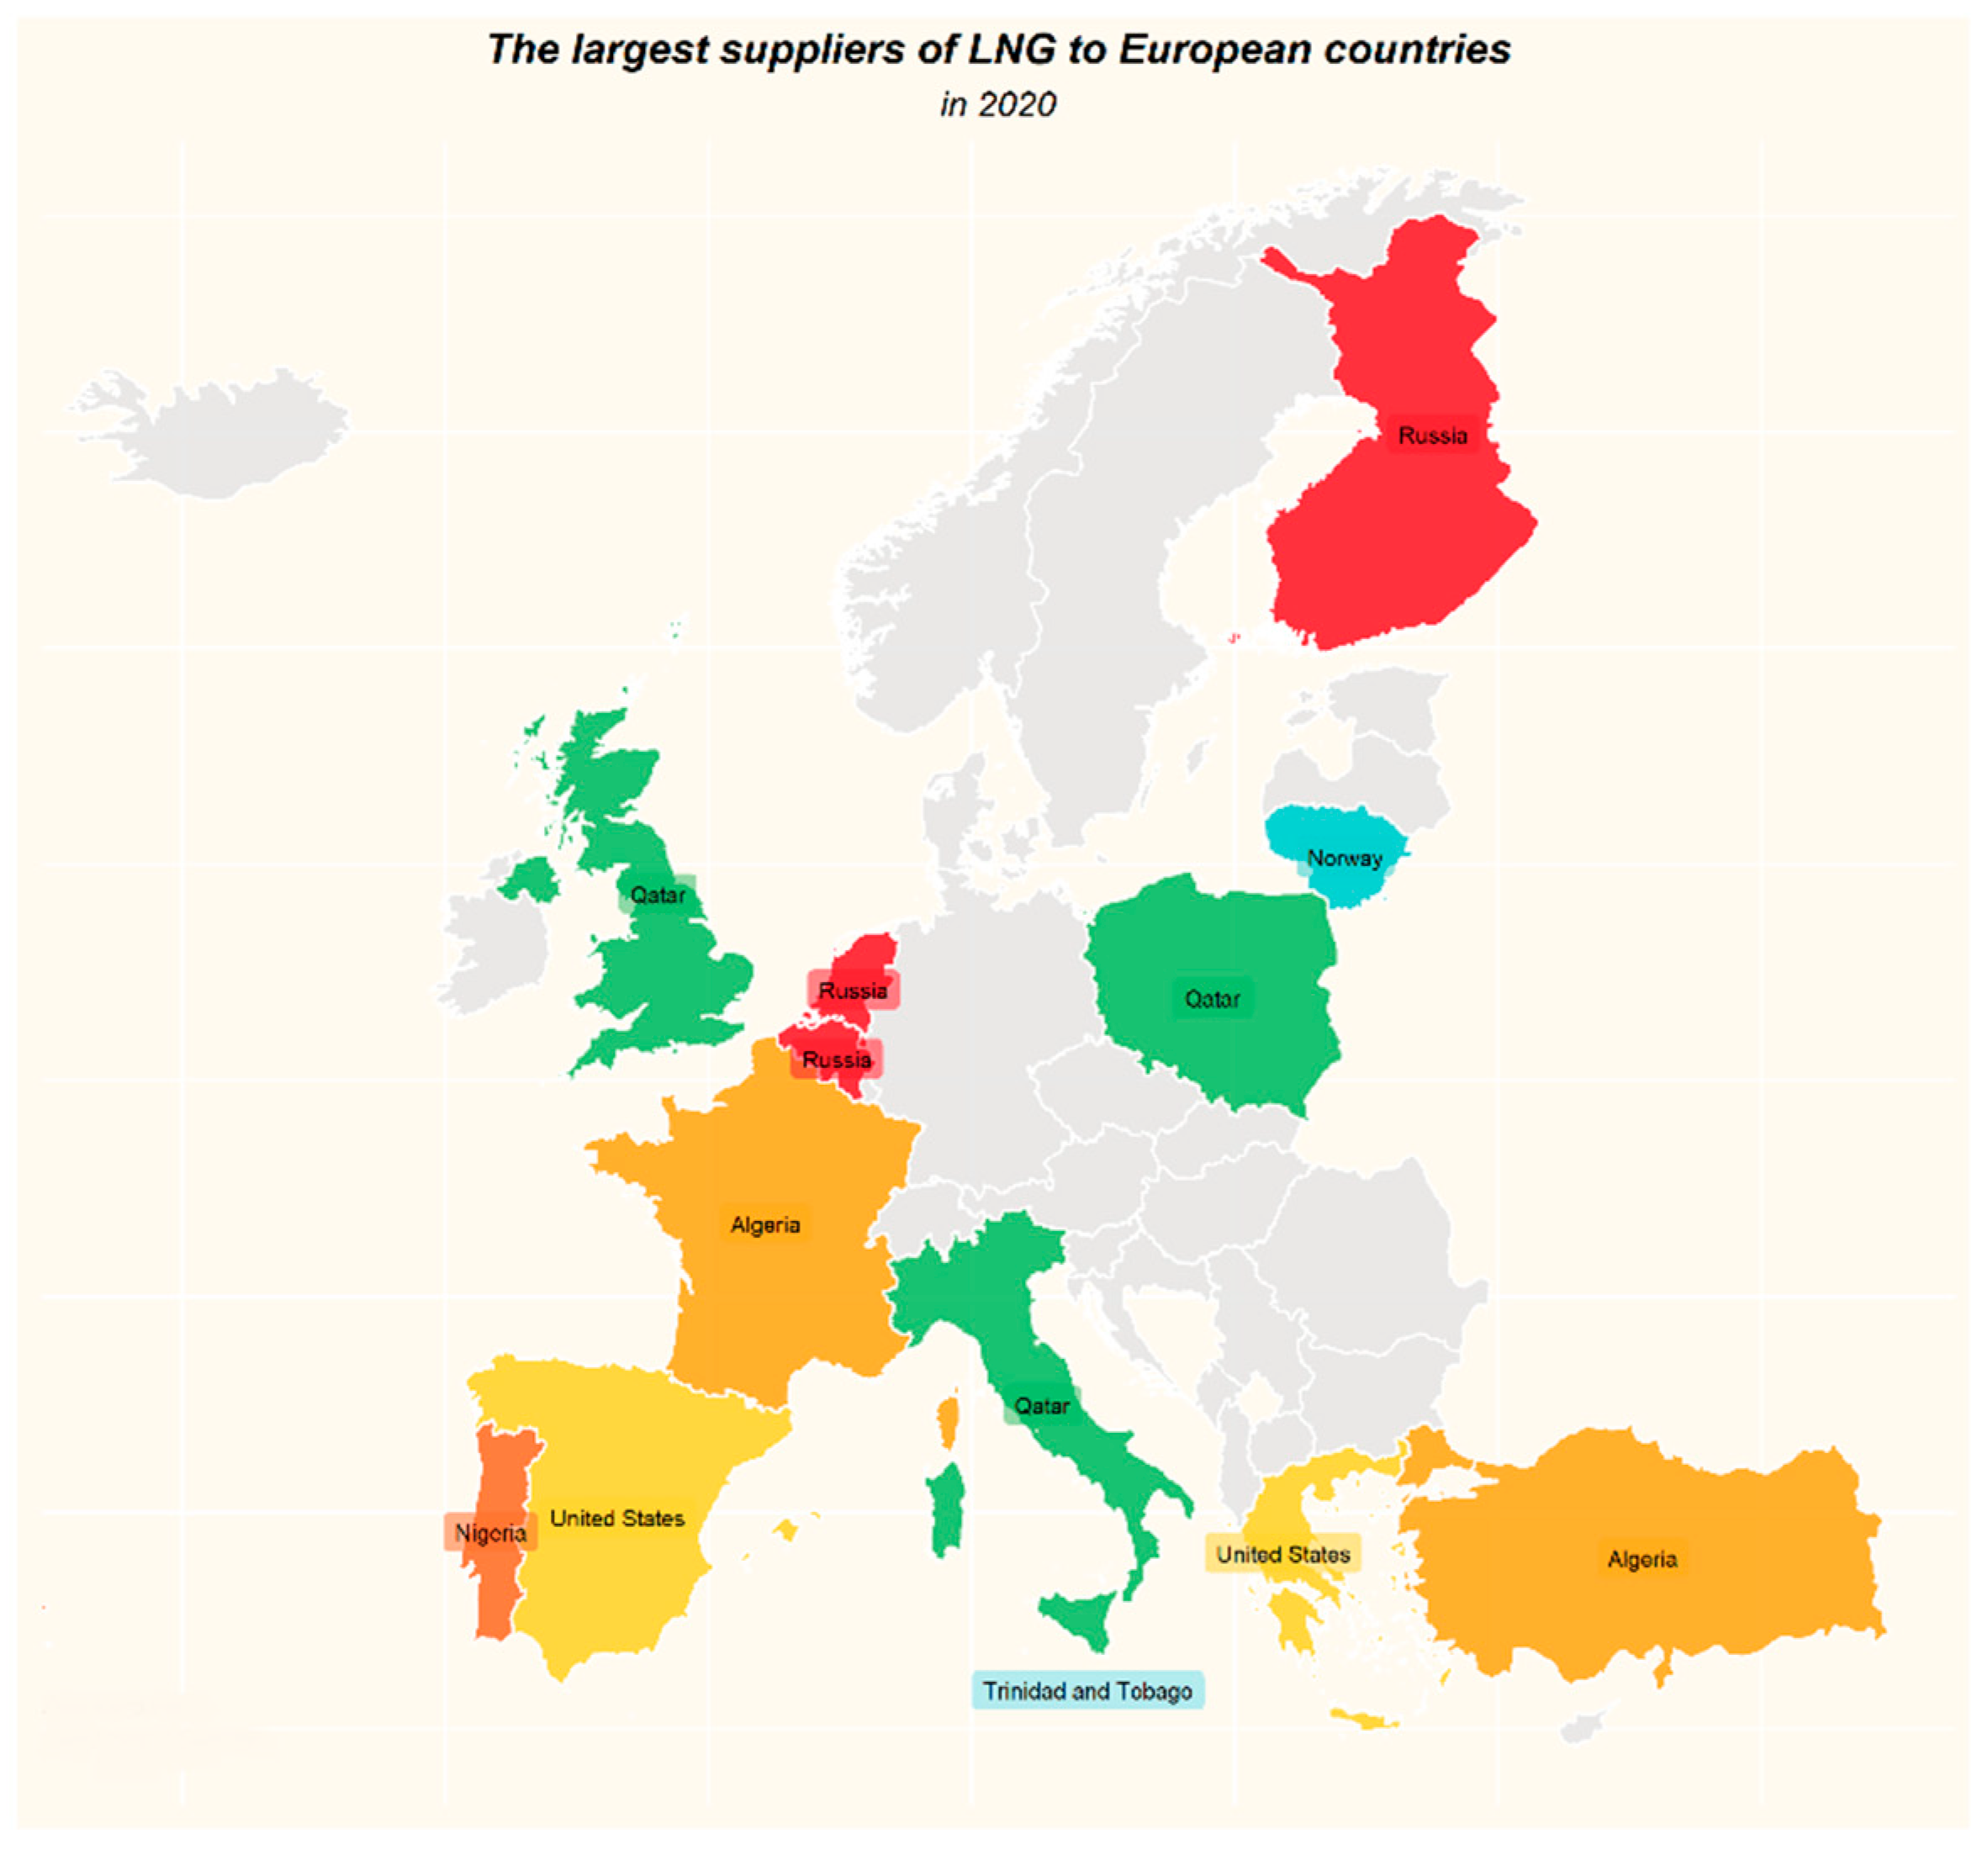
The second revolution is LNG technology, which overcomes one of the largest restrictions on free trade in natural gas—the possibility of efficient long-haul transport in a way other than through pipelines. With the development of LNG technology, it is possible to create a global natural gas market, just as in the case of crude oil. The import of LNG to Europe is constantly growing (
Figure 1). Some suppliers are distant countries and without LNG technology they would not be able to deliver natural gas in a traditional way (
Figure 2).
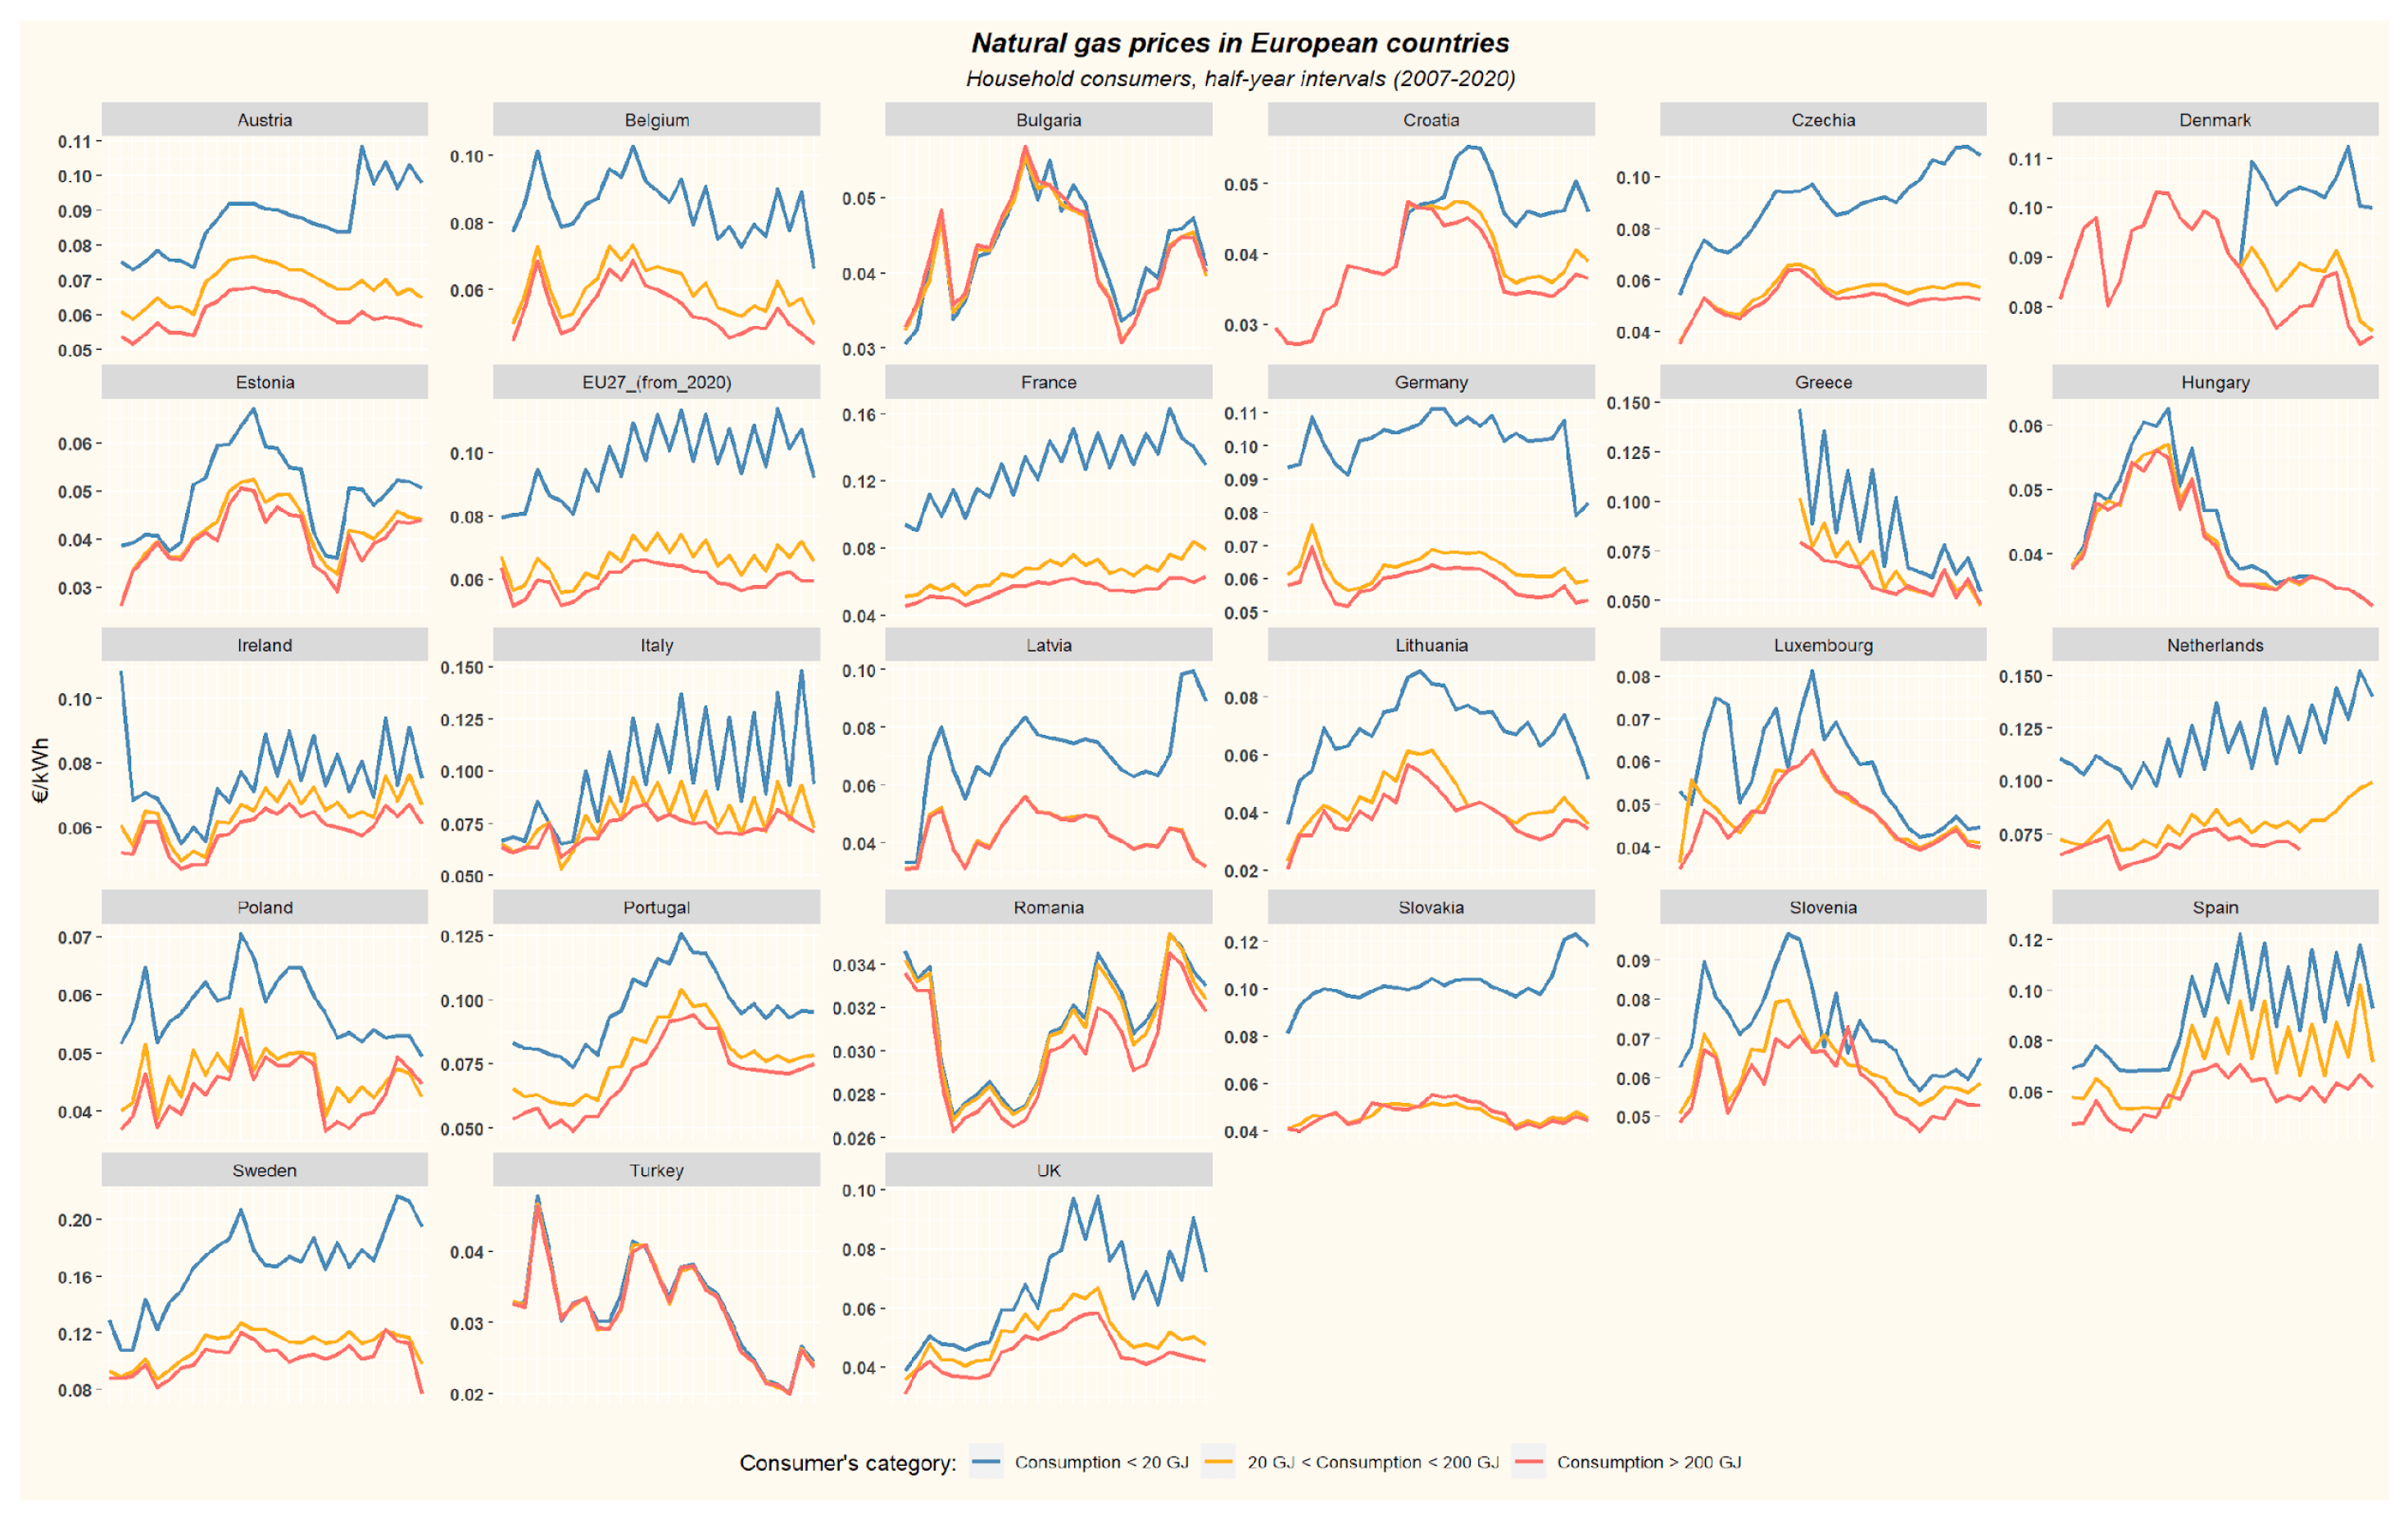
The consequence of these two phenomena and the other negative factors affecting the natural gas market is the recent oversupply of natural gas, which entails greater volatility in its price (
Figure 3).
The aforementioned activities were intended to stimulate the process of creating a common European free market in gas, but in fact it also resulted in blurred lines of responsibility for the security of the gas supply that had been transferred from big, often state-owned, companies to the free market. It is now unclear how to measure gas supply security in economic estimates and who should finance this security. The problem of financing Underground Gas Storage (UGS) under market conditions is getting more serious because seasonal differences in gas prices (spreads) are often lower than the cost of storage, which is, of course, likely to change at any time, e.g., because of climatic conditions, technical issues, or the political situation.
The main factors influencing European gas markets are:
Oversupply in the markets in recent years, leading to a drop in spot prices. Therefore, many natural gas customers expect changes in long-term contracts;
Legal changes—aimed at further liberating European gas and electricity markets;
Development of infrastructure—new interconnectors, expansion of the transmission grid. This significantly increases the possibility of gas flow between European markets and countries, improving energy security and stimulating development of gas markets;
Changes in attitudes and strategies of market players—a considerable proportion of traditional gas suppliers are bound by long-term contracts and must compete with fresh players, who have an opportunity to buy cheaper gas at spot prices. Such a situation forces adjustment activities and modifications of strategy.
The percentage of transactions carried out on commodity exchanges and in gas hubs has also increased in Europe. The growth in the importance of gas hubs and spot transactions shows the willingness of market players and governments to accept risks in exchange for access to market prices. However, it must be remembered that the spot price depends on the relationship between supply and demand, and under certain market or political conditions may mean a very high price.
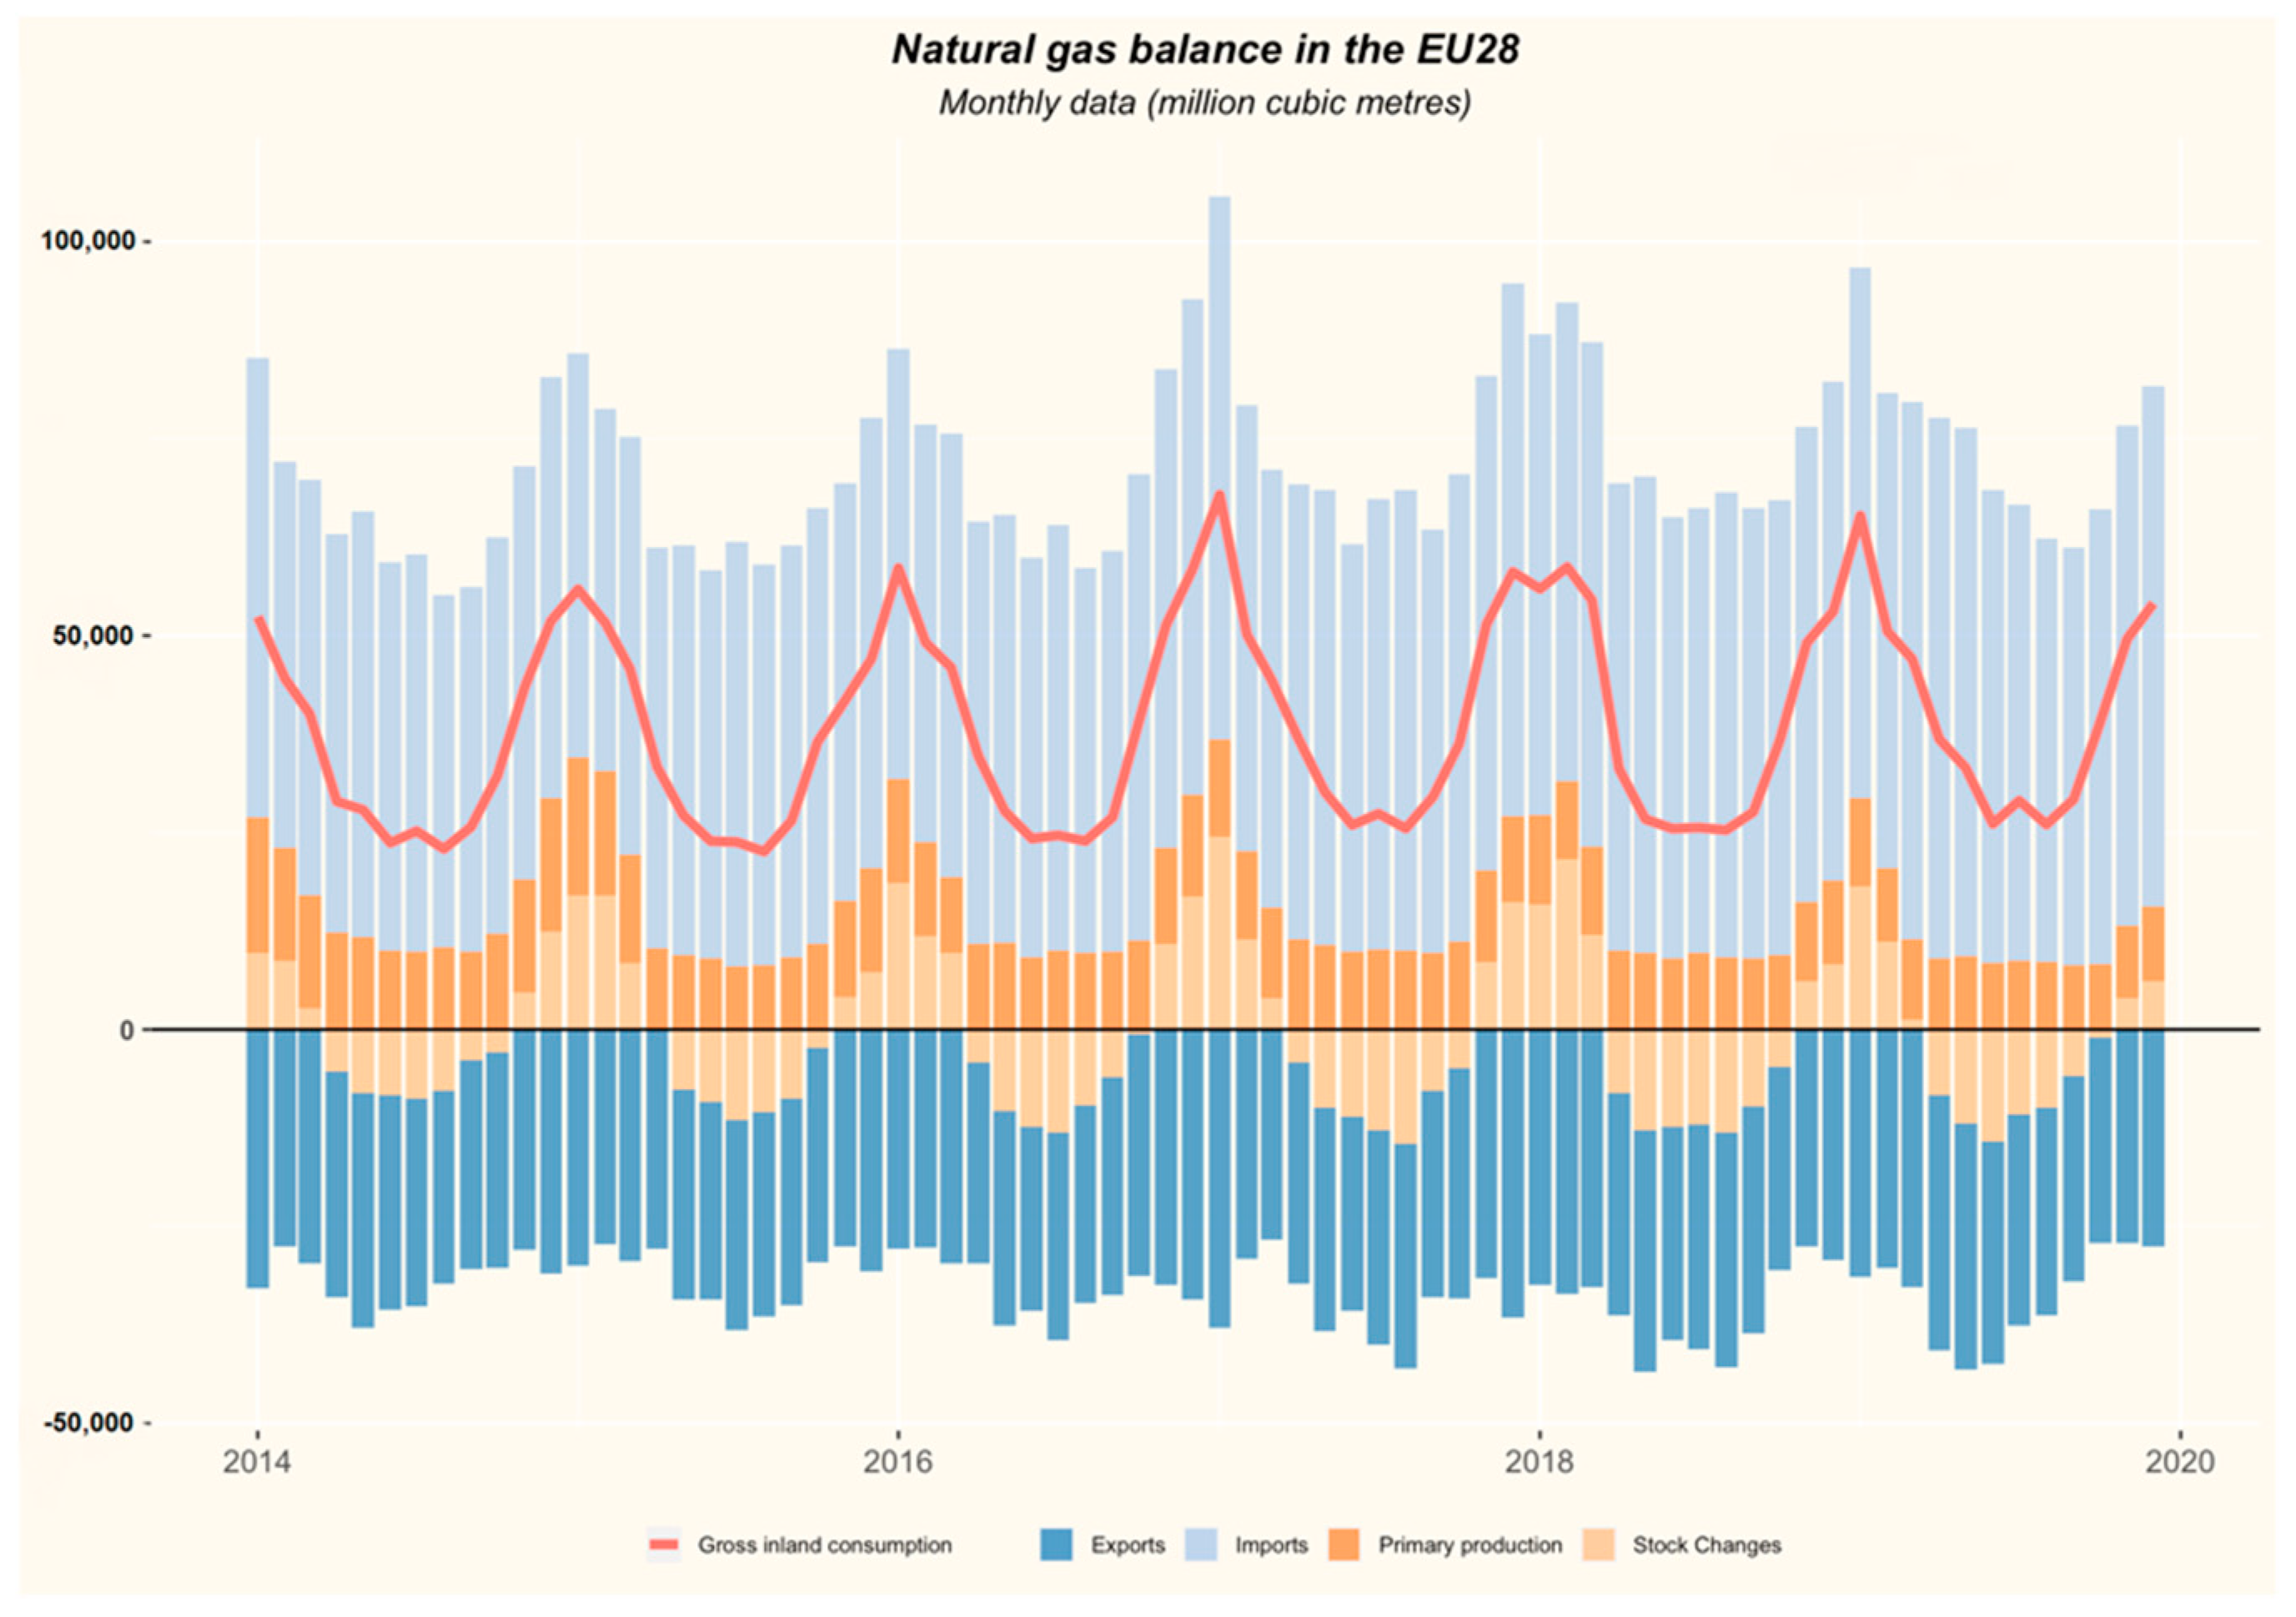
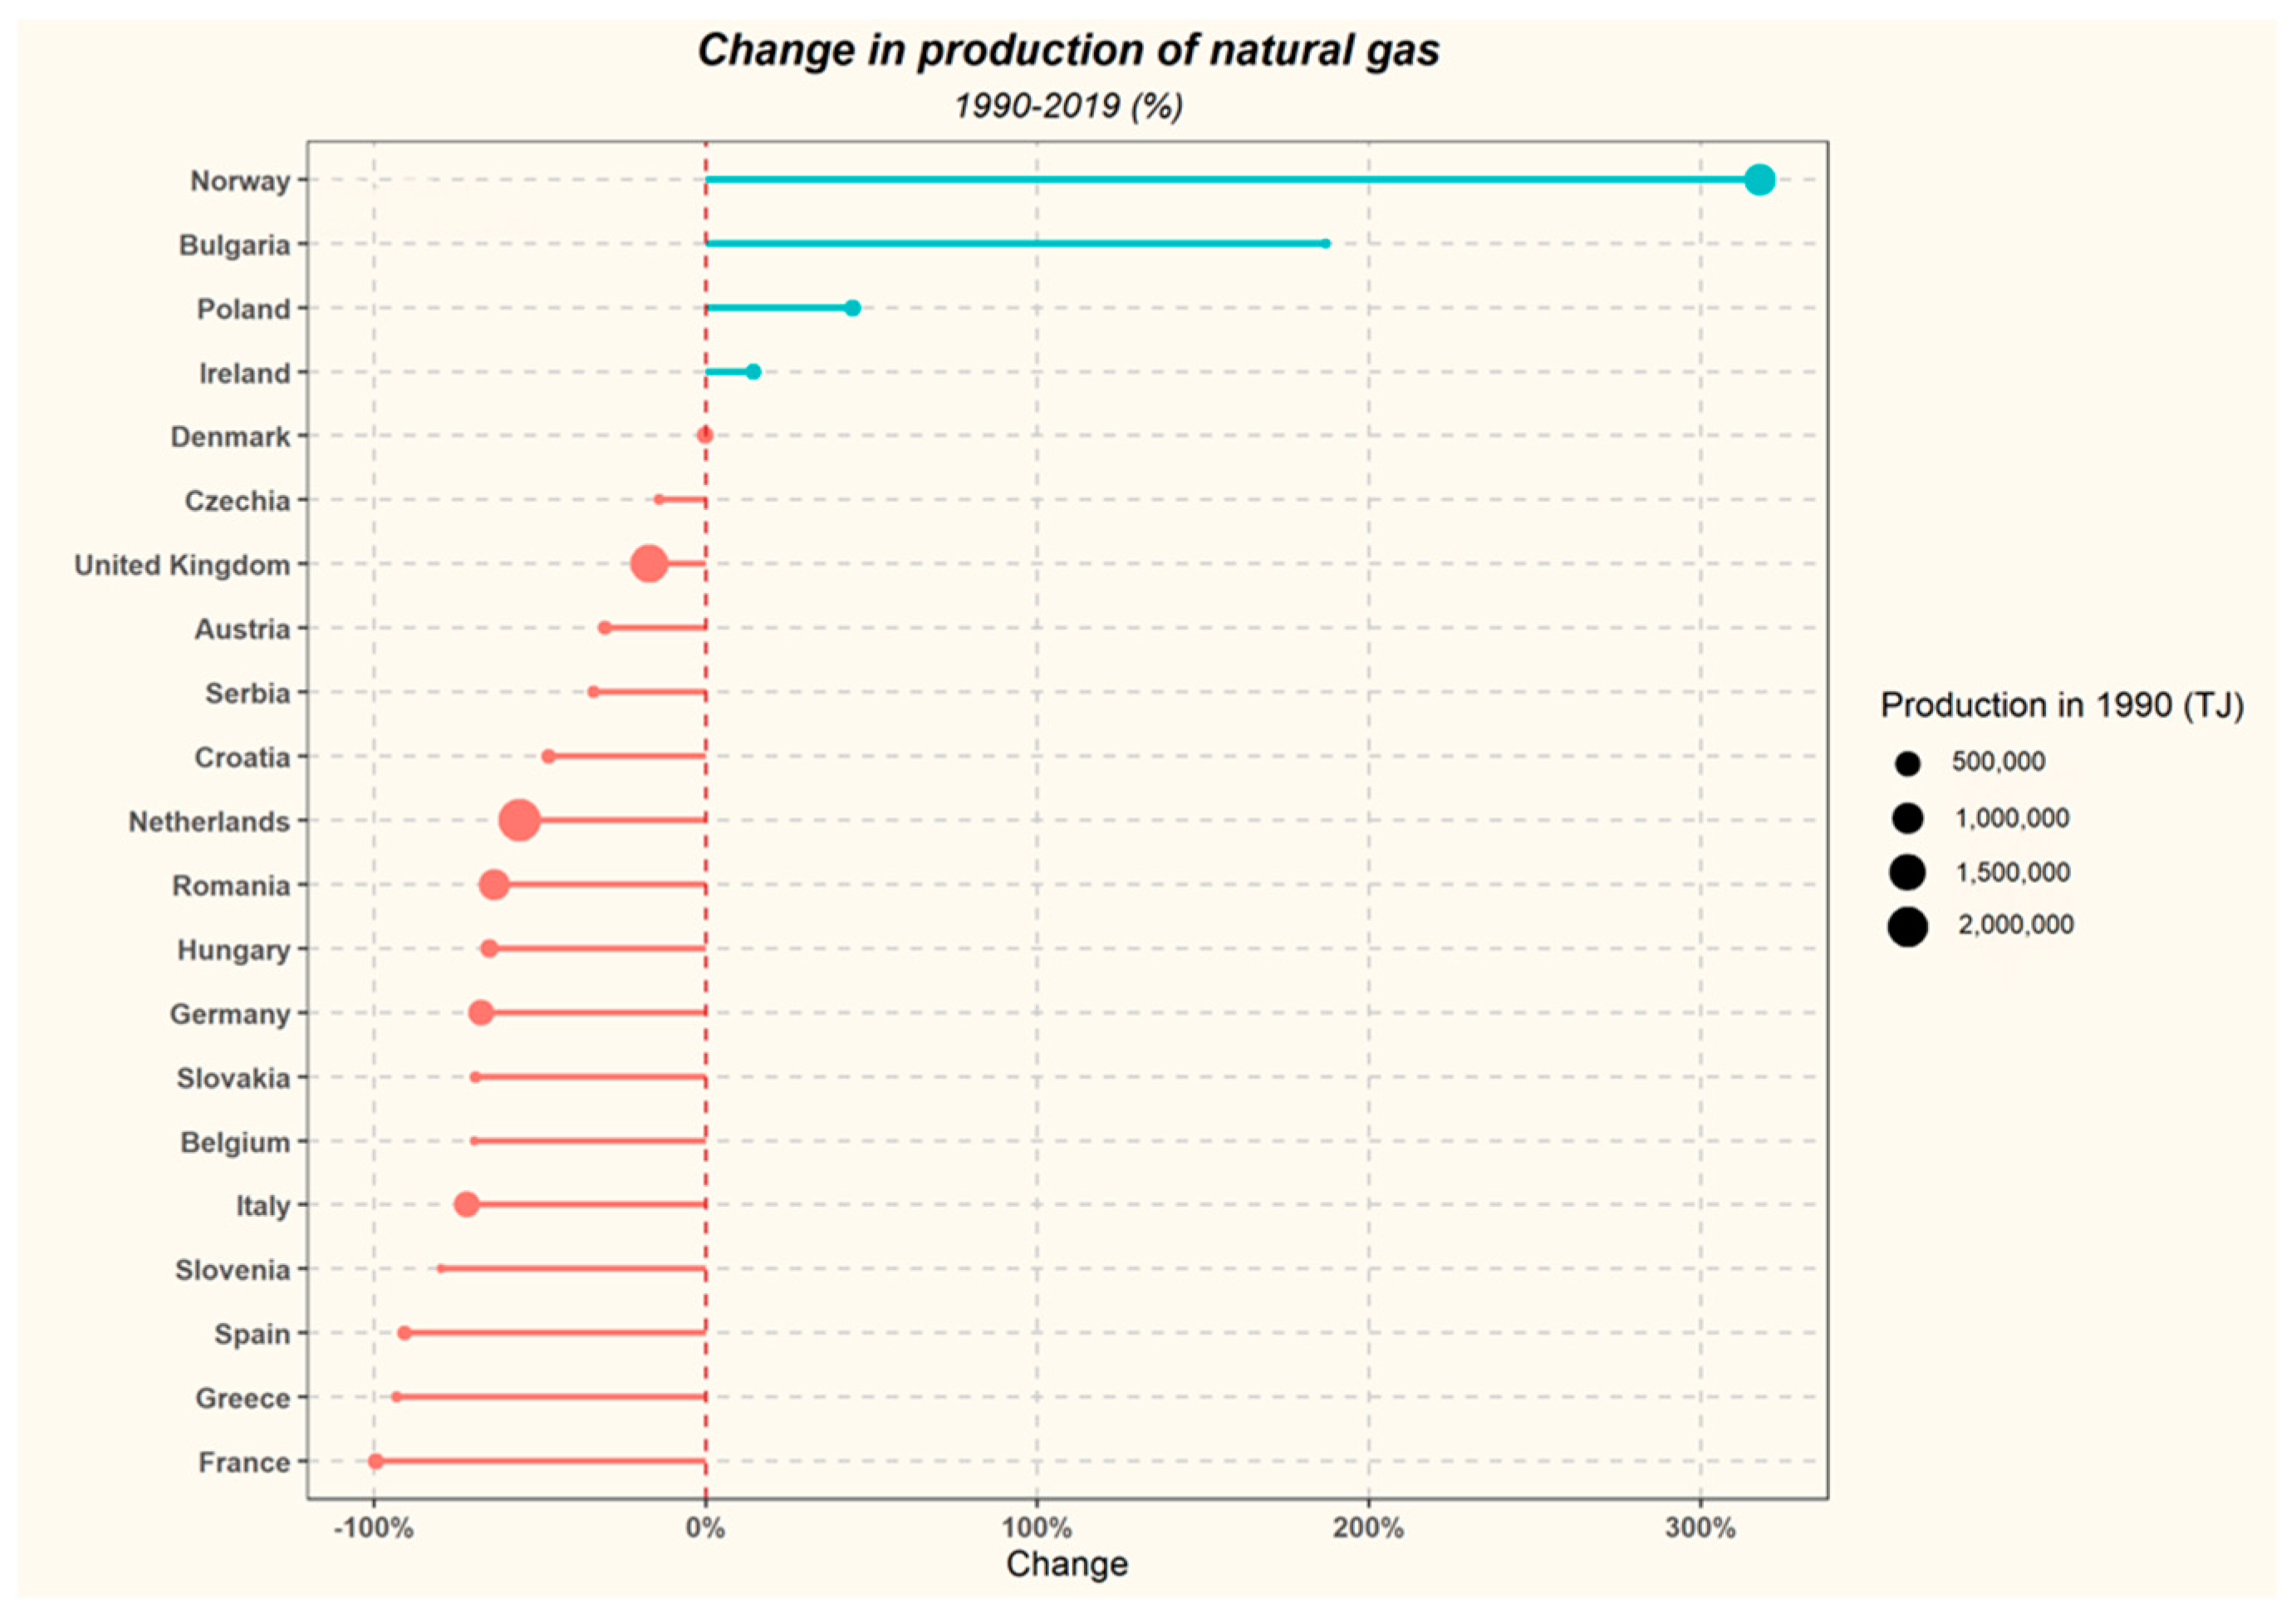
The volume of natural gas consumption and its supply structure in individual EU countries varies, but the attribute common to most countries is the strong dependence on gas imports (
Figure 4). In addition, the production of conventional natural gas in most of the countries is declining (
Figure 5), and production of unconventional gas in Europe now seems to be, in the best case, a very distant prospect.
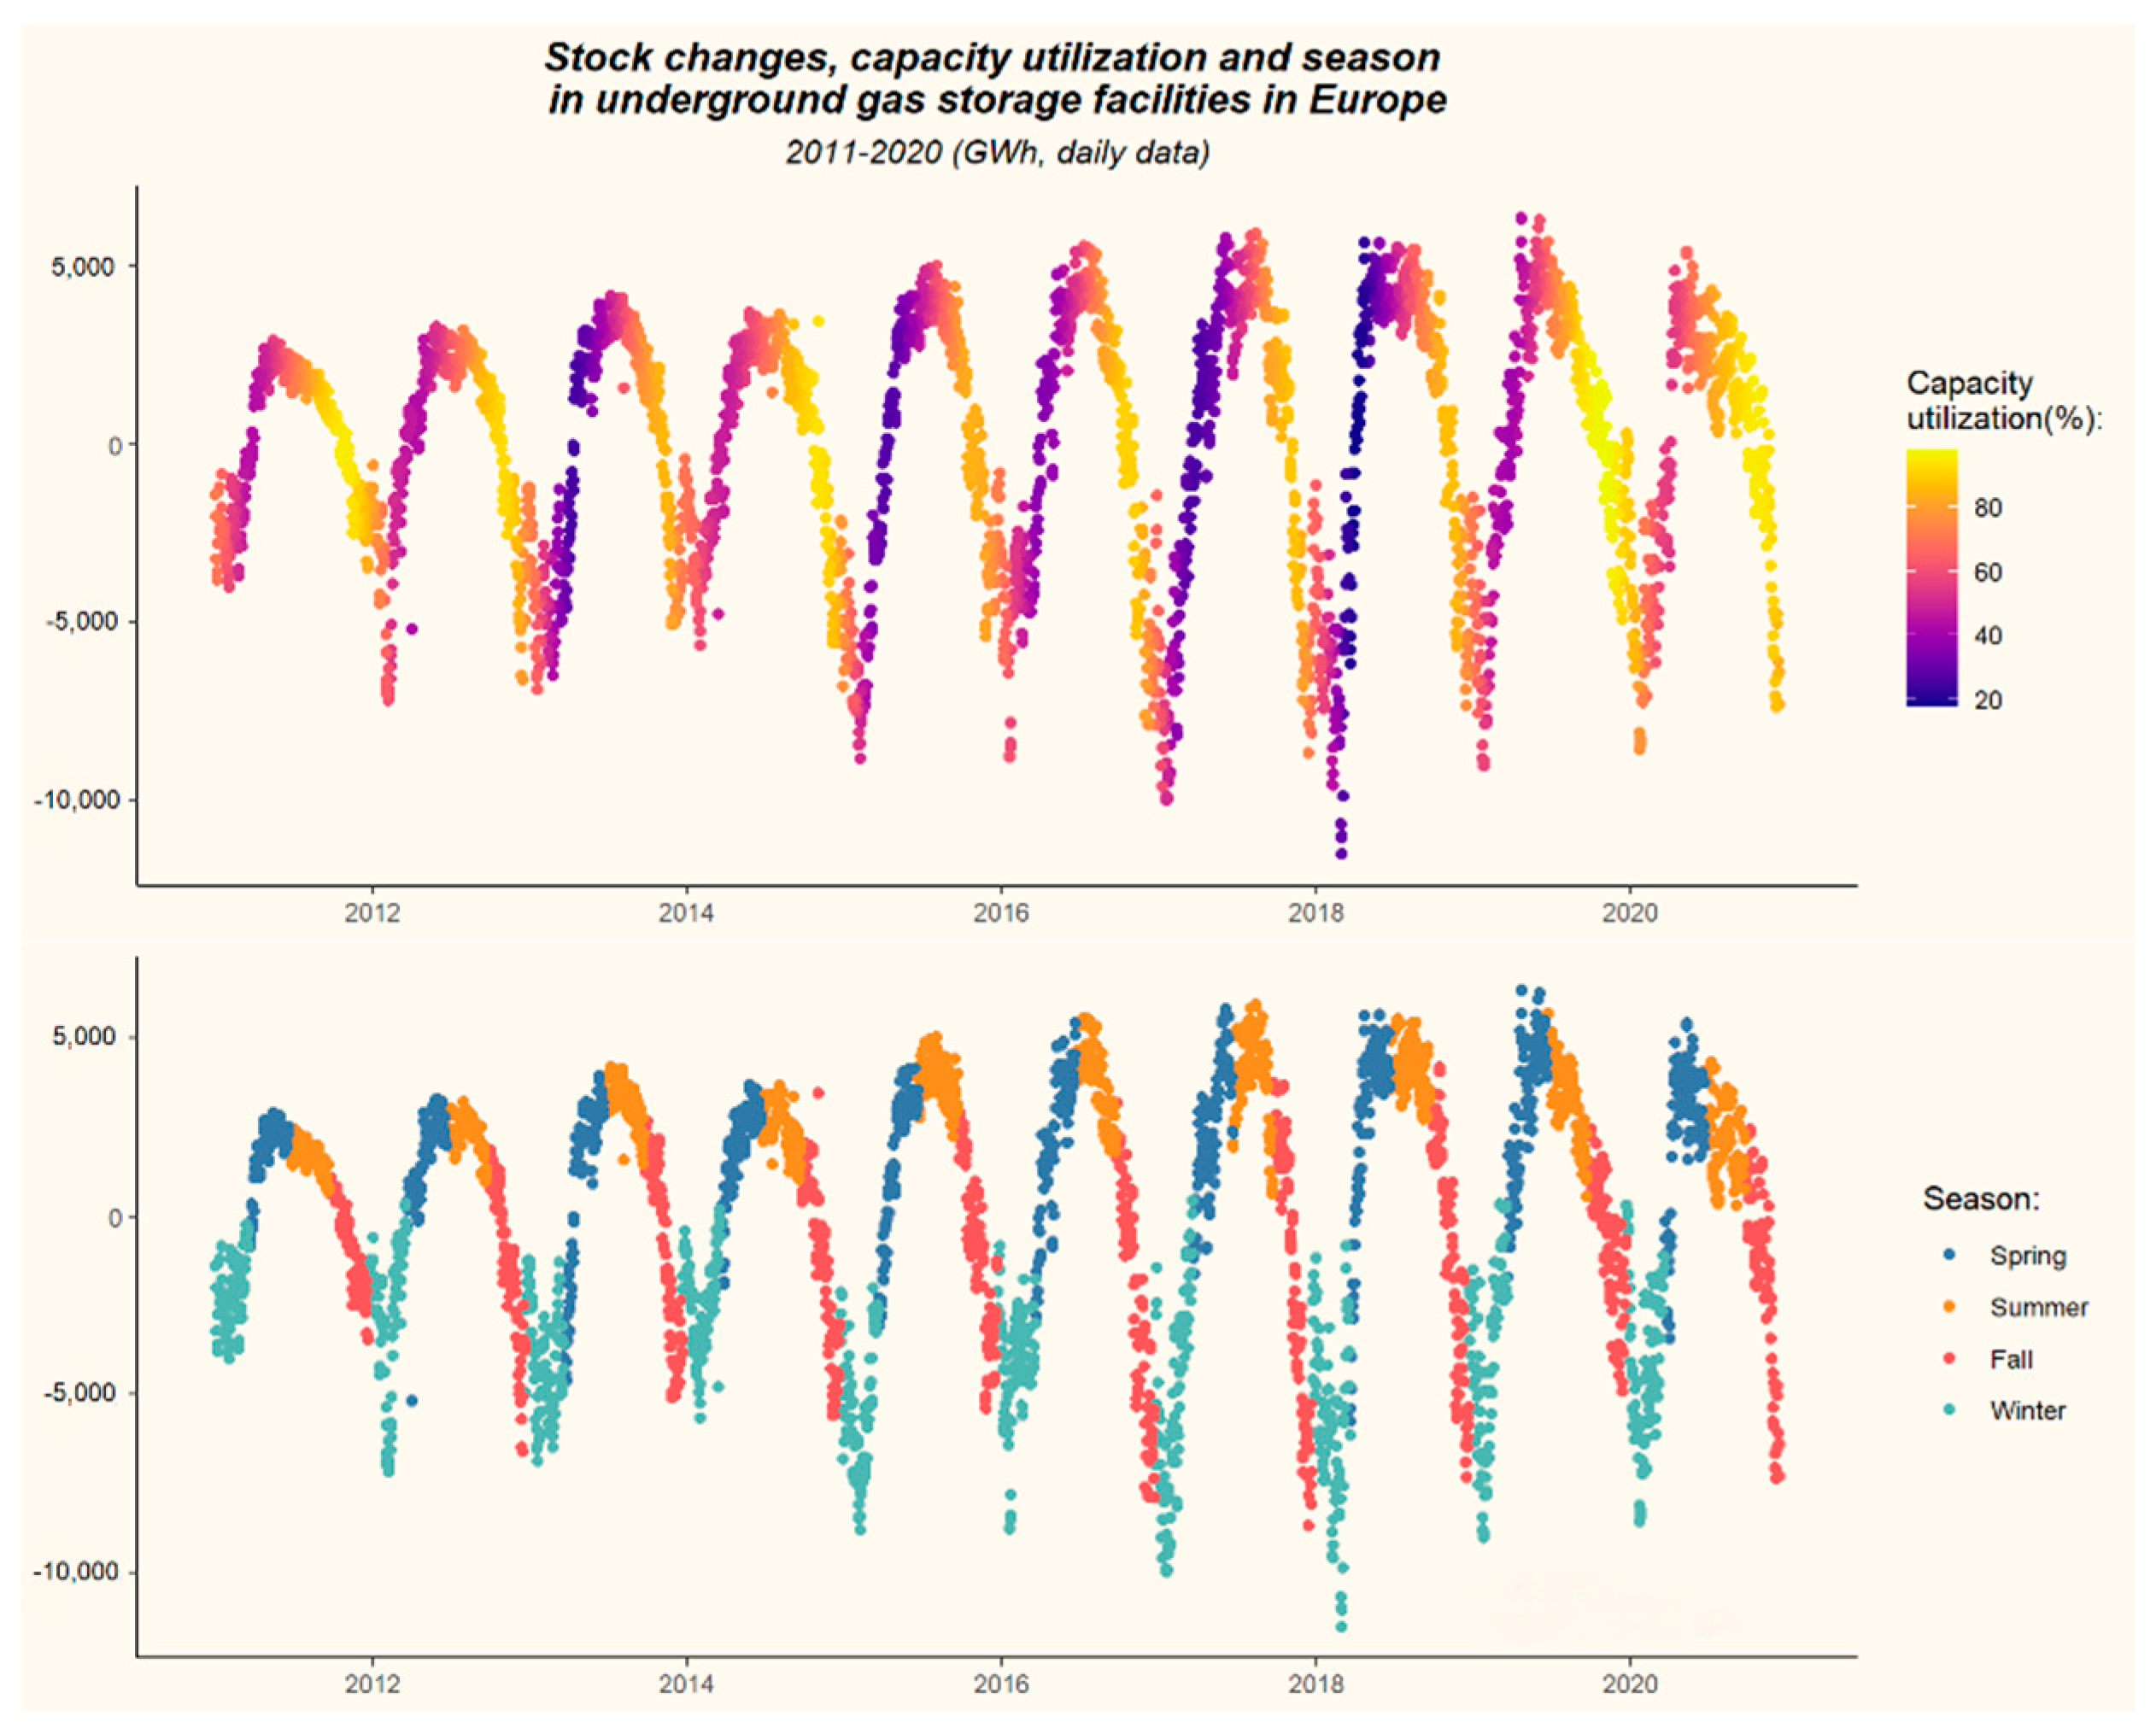
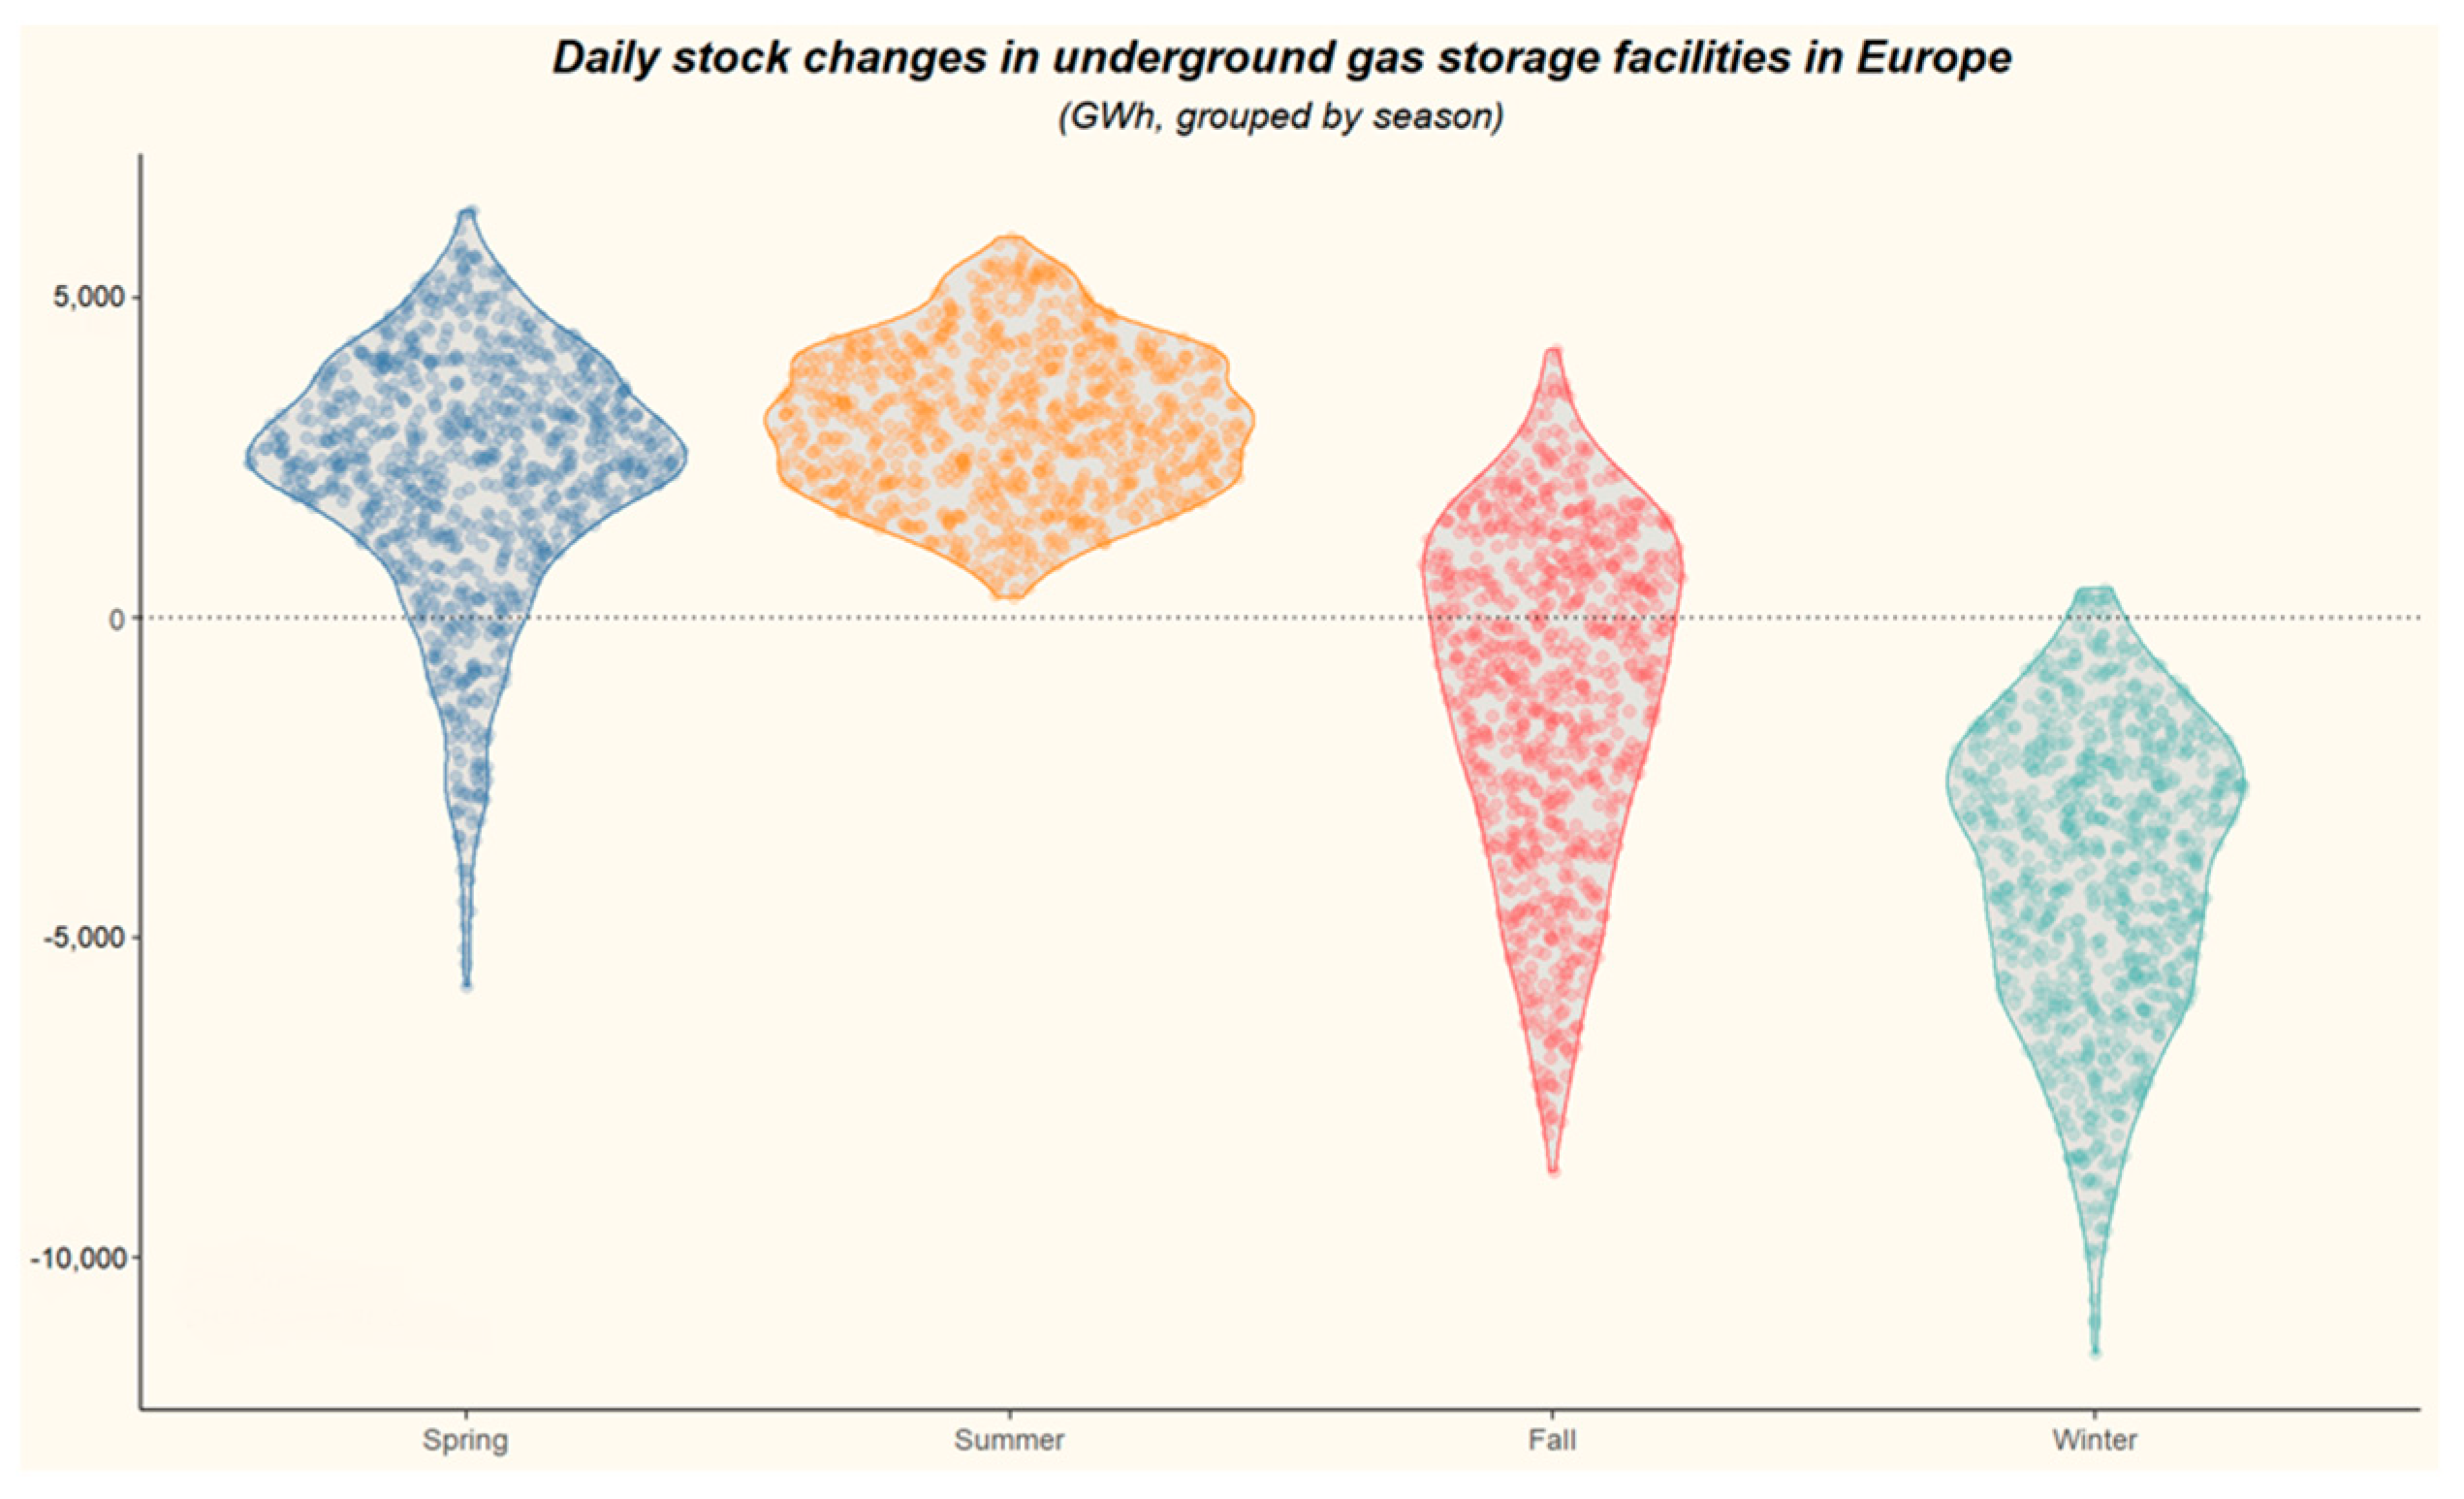
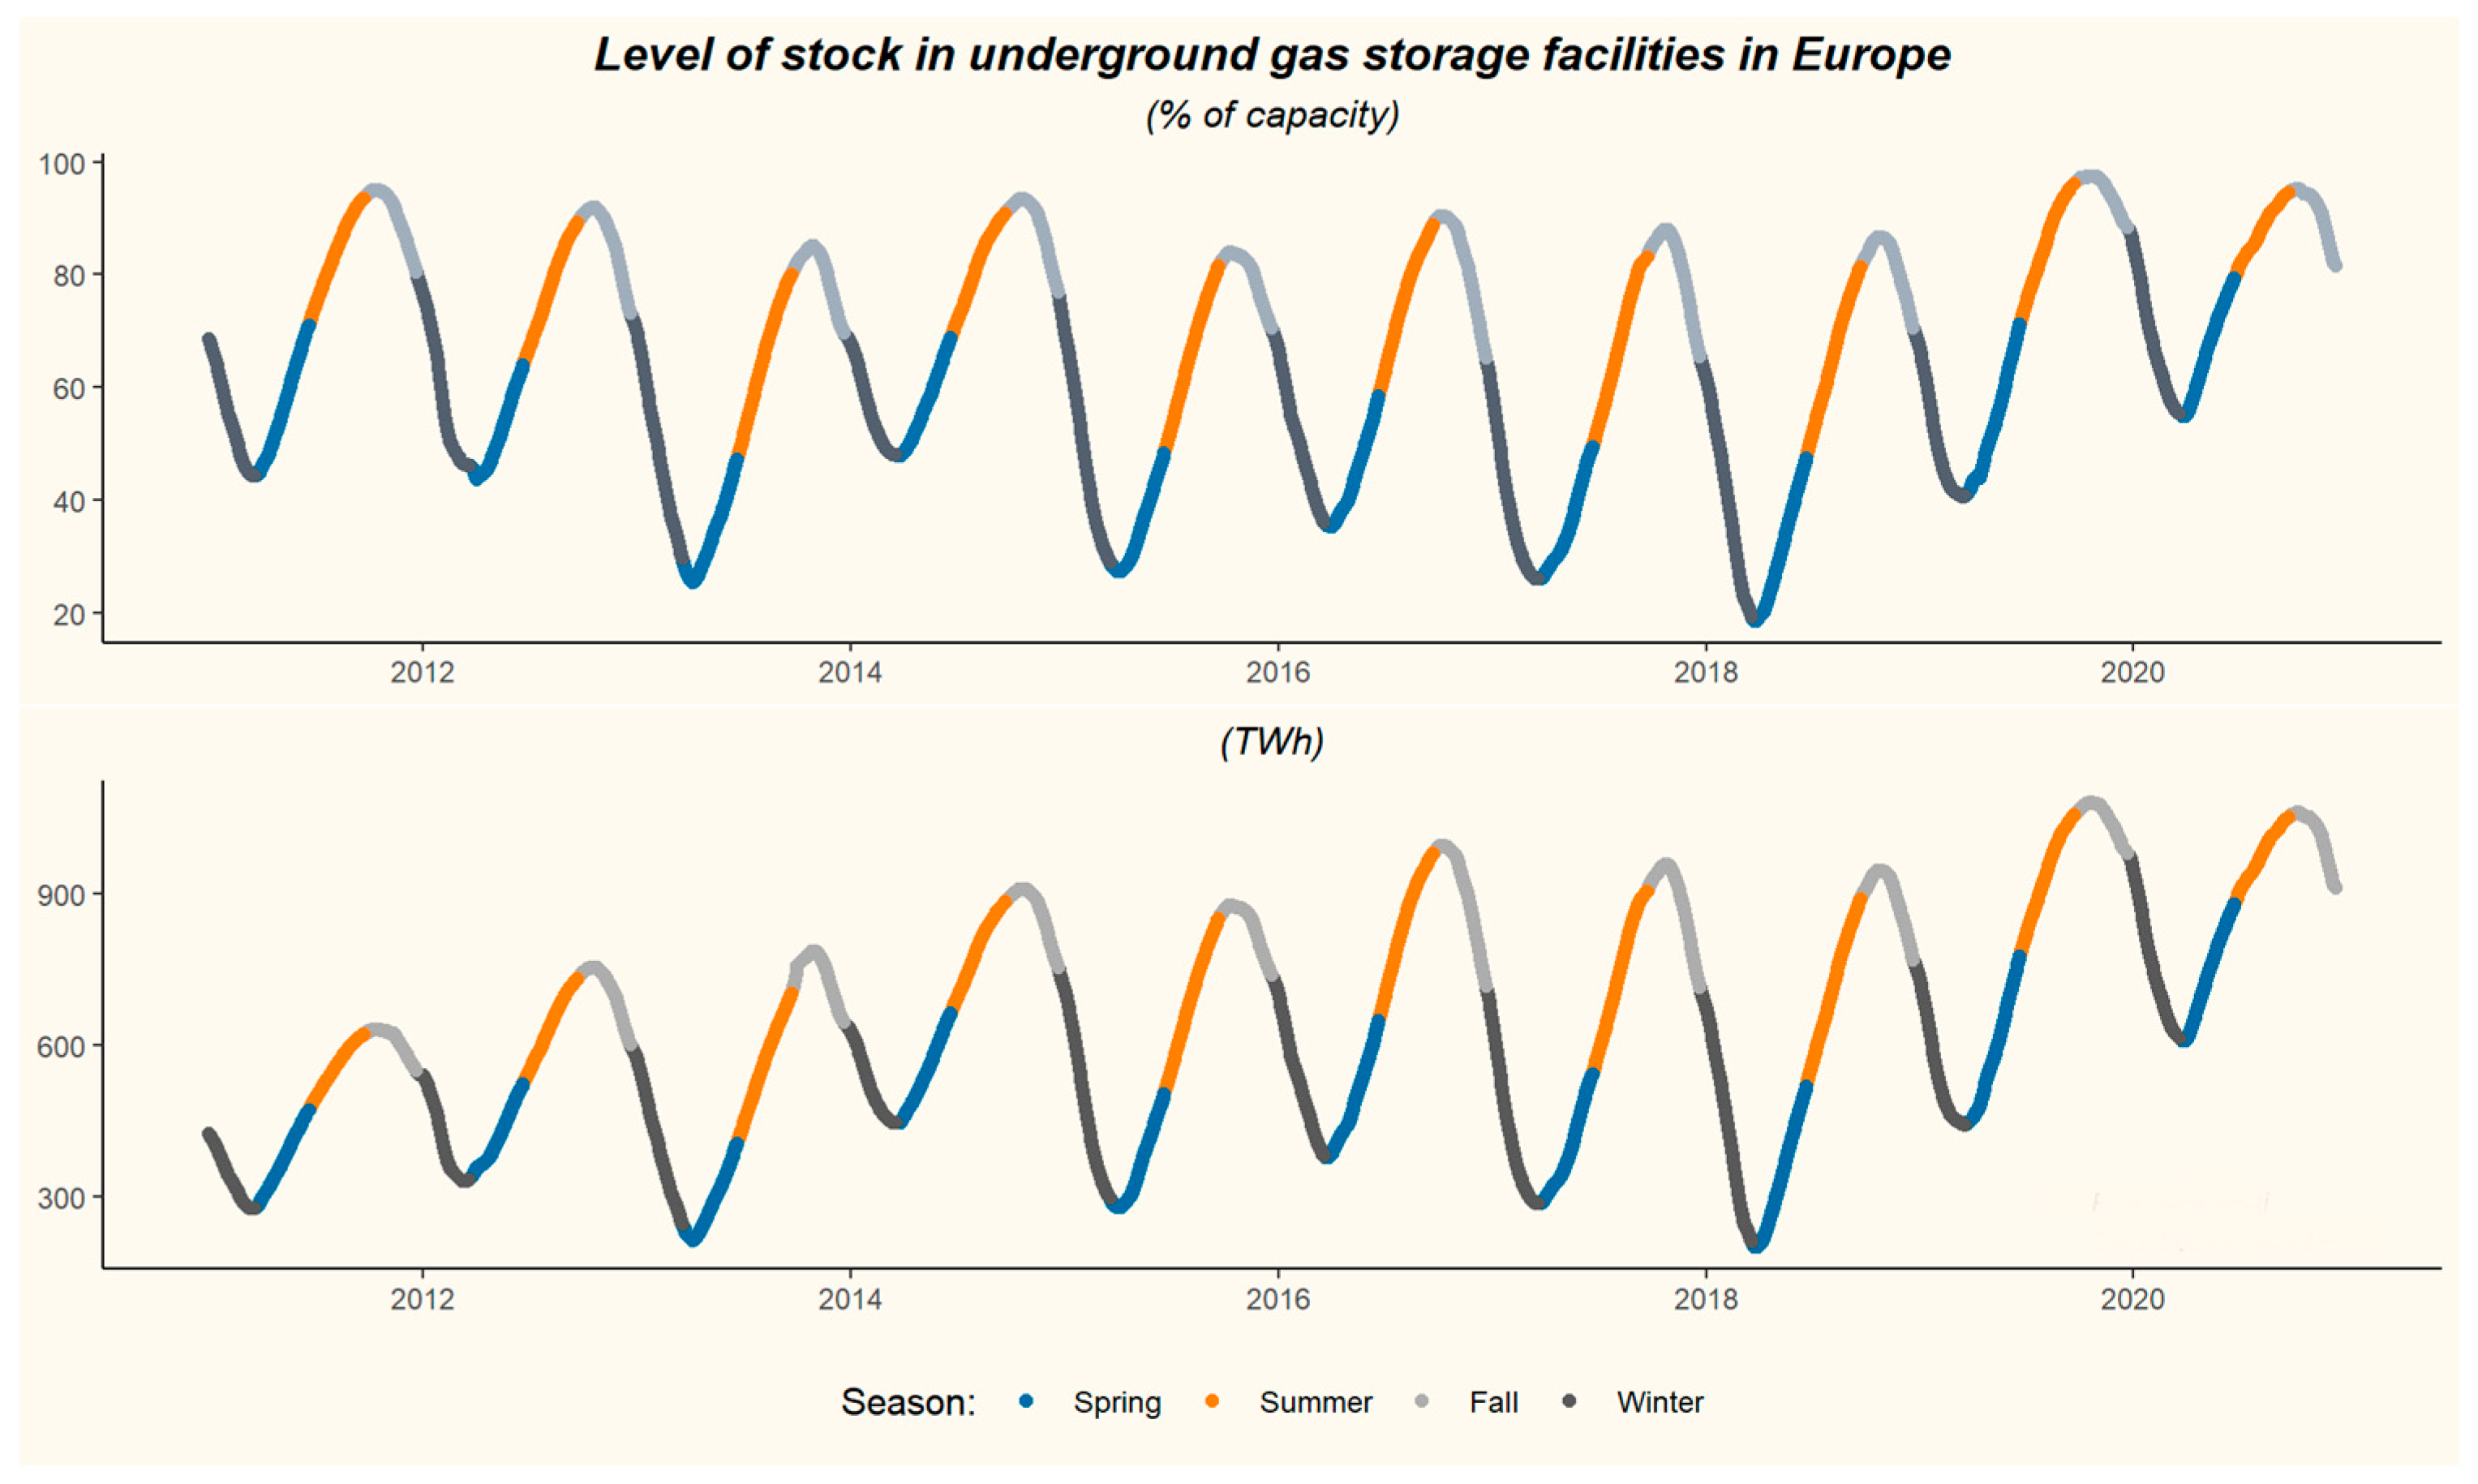
The distinguishing factor in the consumption of natural gas is the very strong seasonality, related to weather conditions—mainly air temperature. As a result, there are very large differences between consumption during the summer and winter seasons. This seasonality has a direct impact on the demand for storage capacity—with relatively little variation in production, import and export. There are very strong fluctuations in consumption, and, inversely proportional to these, changes in stocks in underground gas storage facilities (
Figure 6 and
Figure 7).
An interesting example of the need to store gas is the Netherlands, which was, in the 1990s, the largest producer of natural gas in Europe (excluding Russia). This production was mainly from one huge gas field—Groningen—the largest natural gas reservoir in Europe and one of the largest in the world. Production from that field, due to its size and other parameters, was characterized by great flexibility, allowing for seasonally adapting exploitation to demand. However, once the slow depletion of resources, the drop in reservoir pressure and the emergence of operational problems had an impact, further production in this way was no longer possible. The consequence of this situation was the need to stabilize exploitation using underground gas storage [
55].
Traditional (through pipelines) gas supply in Europe is dominated by only a few countries (e.g., Russia, Norway, Algeria, and Libya) with domestic production and LNG fulfilling a still small (but growing) part of the demand. In case of political crisis or technical disruptions, confidence in energy security may quickly fade away.
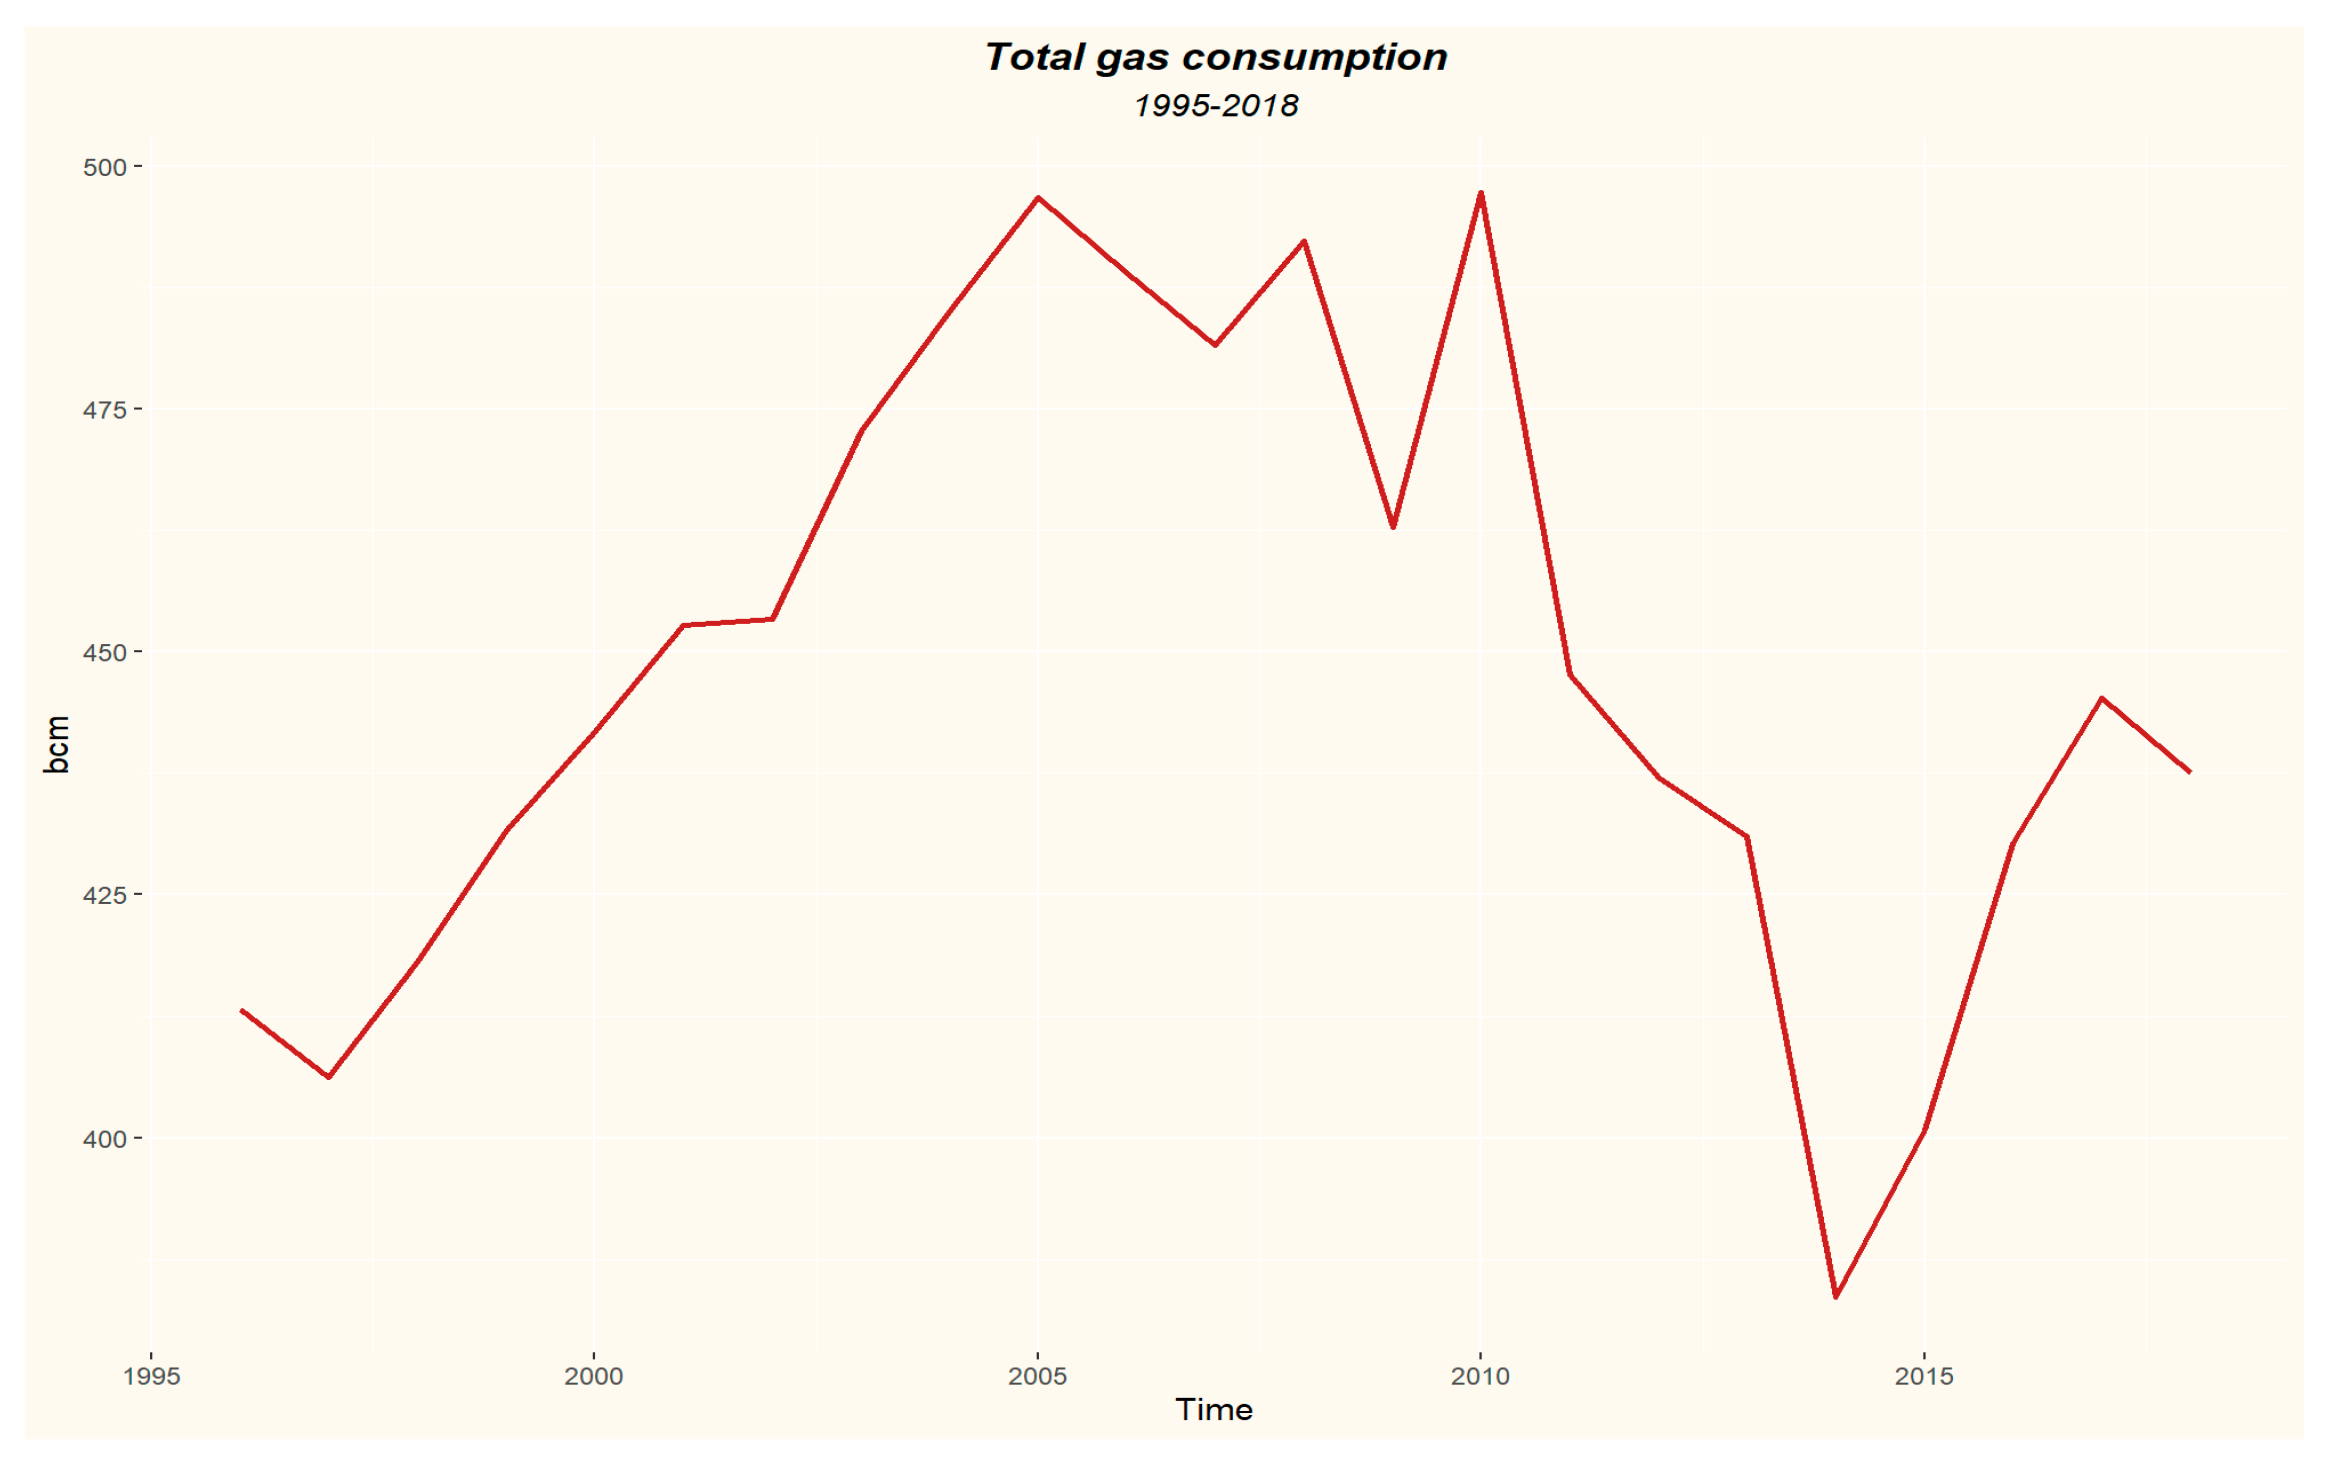
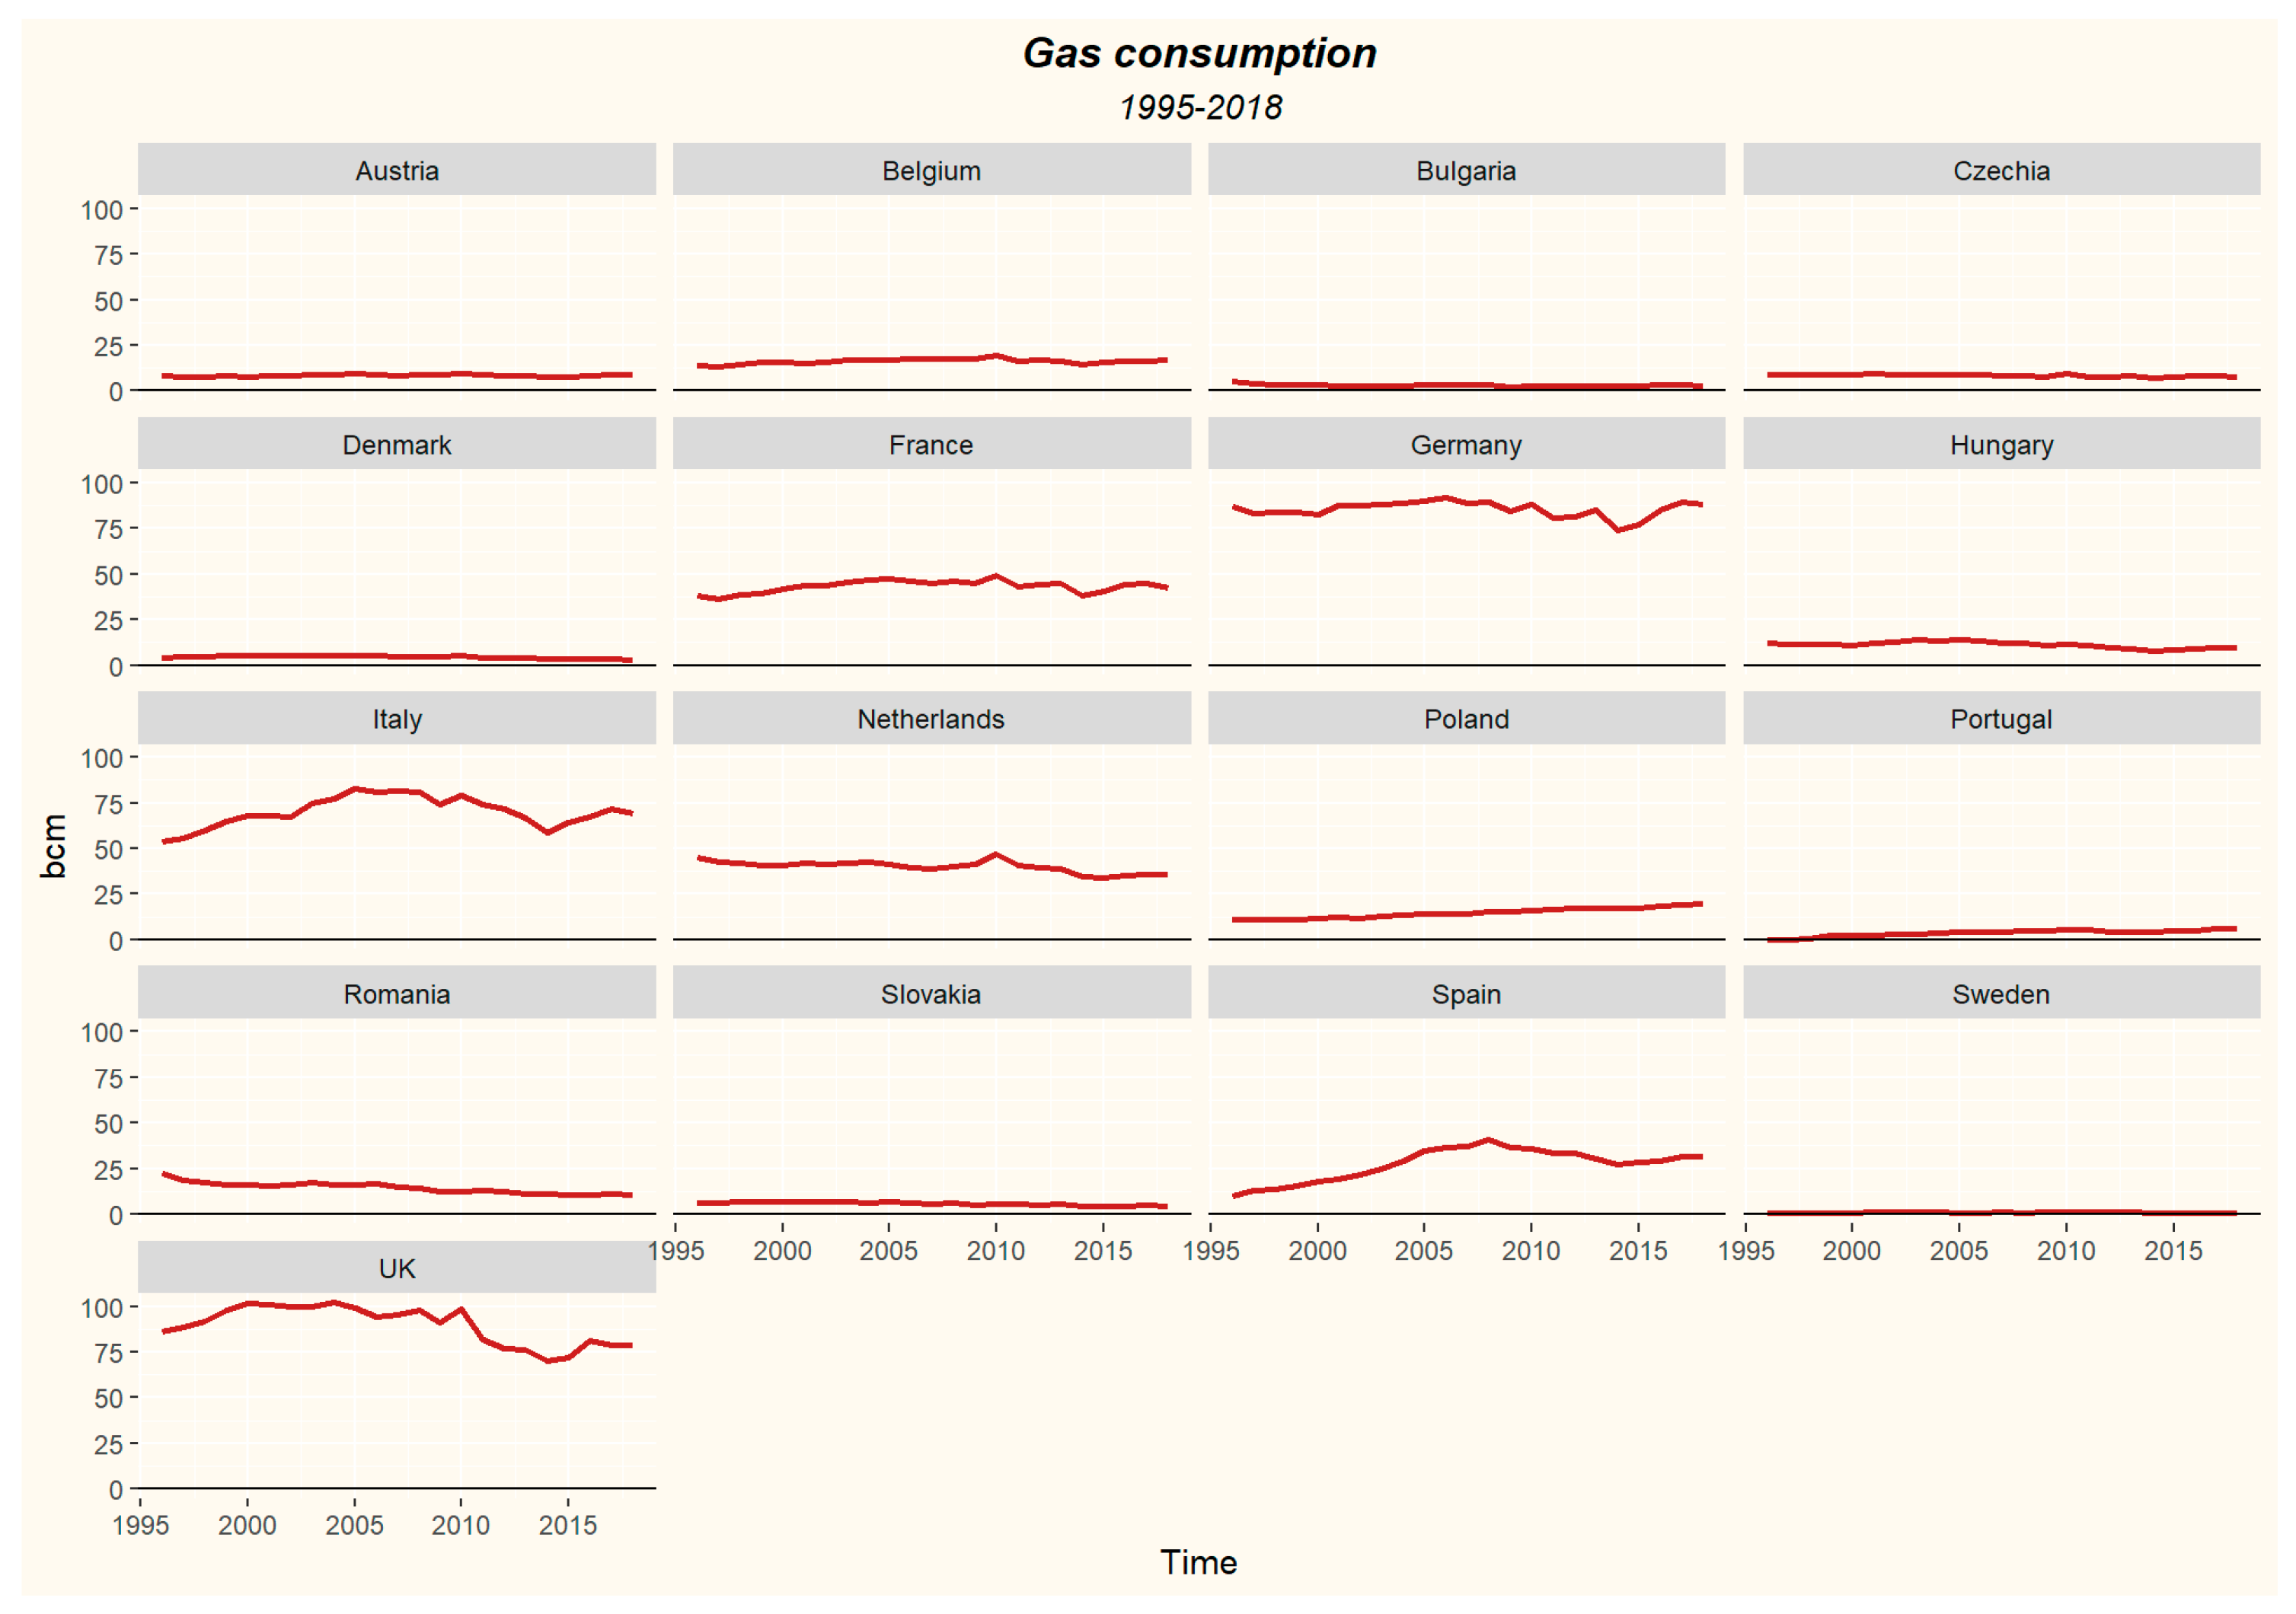
Figure 8 presents the total natural gas consumption in selected European countries between 1995 and 2018, which were subsequently split and presented in
Figure 9. The whole period can be divided into three parts: first, until 2010, when the total consumption was increasing, second, between 2010 and 2014, characterized by a sharp decline in consumption and third, up to the present, when we can see a return of the upward trend.
When it comes to individual countries (
Figure 9) the picture is not so clear. The fixed scale allows us to distinguish the biggest consumers, which are the UK, Germany, France, Italy, and the Netherlands.
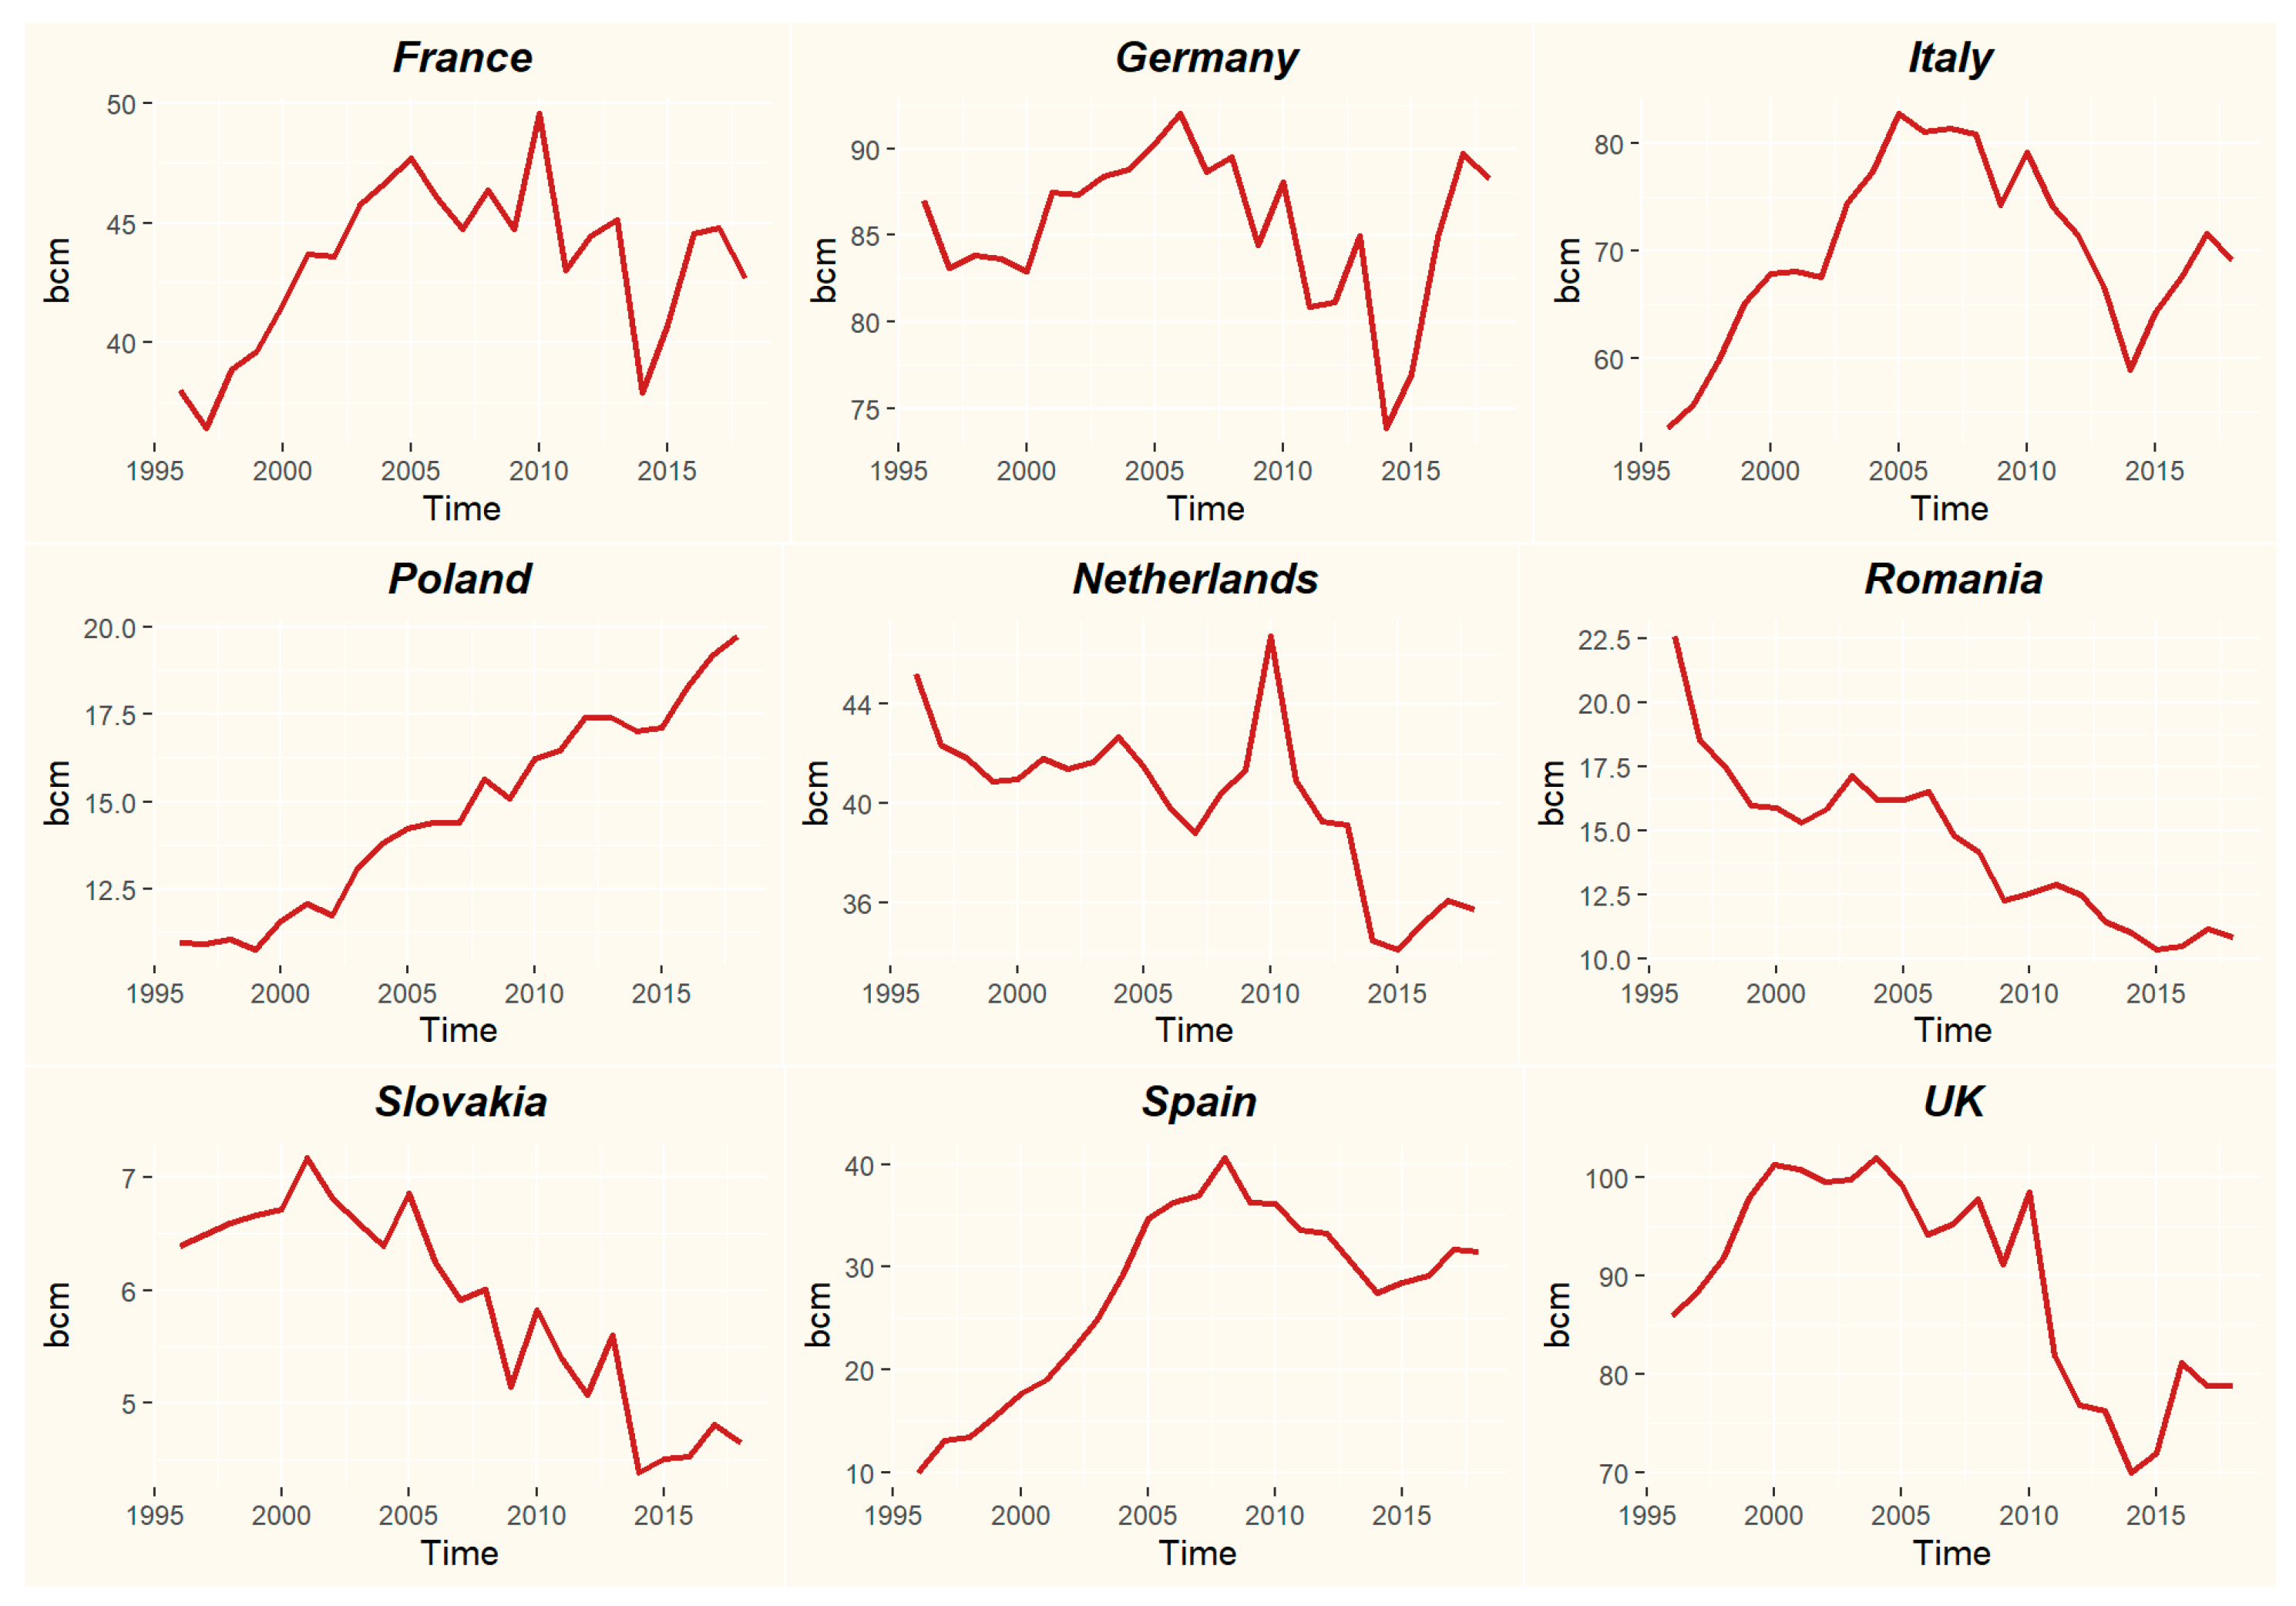
Trends in consumption are also different, which is clearly visible in
Figure 10, which shows consumption in nine European countries. The largest consumers follow the trend presented in
Figure 8, but there are also countries showing a steady fall in consumption (e.g., Romania and Slovakia) and countries, where the use of natural gas is increasing (e.g., Poland and Spain).
Underground gas storage (UGS) is an essential element of the gas system that affects all stages of the process of production, transmission, and distribution of natural gas. During the production phase UGS enables the rational exploitation of natural gas reserves, which should be carried out in a stable manner without rapid changes in the production level. To ensure the rational operation of gas wells, depression (pressure difference) exerted on the reservoir should not exceed the limit values and, where possible, be maintained at a constant level, which also limits the achievable performance (size of production rate). This action eliminates or reduces the negative impact of reservoir water (elimination of water cones, minimizing the risk of cutting off parts of the reservoir by water movement) and well sanding (destabilization of the rock structure surrounding gas wells). In the case of management of the operation of gas fields, the production of which fluctuates seasonally, this means that natural gas must be stored during periods of reduced demand in order to maintain stable operation of the gas field. Maintaining uniformity of gas production is also crucial for optimizing the level of natural gas exploitation costs.
Gas transmission grids also require stable flow rates. Since gas consumption is subject to major fluctuations, it is necessary to store gas during periods of reduced demand. This strategy is applied (if possible) by all gas companies in the world. As already mentioned, gas consumption is characterized by very strong volatility and fluctuations on an annual, weekly, and daily basis. If there were no underground gas storage facilities, both the production and transmission capacities would have to meet the peak demand for natural gas, and during periods of low demand their capacity would be utilized to a small extent. UGS also allows us to overcome local limitations of gas grid capabilities.
Liberalization of the market, the LNG revolution, and the development of infrastructure (pipelines, interconnectors, LNG terminals, etc.) have also changed the use and financial evaluation of UGS facilities. New functions of UGS have appeared, such as short-term storage, gas price arbitrage, etc.
Another important task of UGS is to maintain strategic reserves in a case of gas supply disruption. There are countries (e.g., Poland), which have introduced regulations imposing an obligation on energy companies to provide long term storage for a fixed percentage of gas imports. The modern functions of UGS are [
56]:
Strategic reserve in case of interruption of deliveries;
Seasonal balancing;
Short-term balancing;
Optimization of gas production;
Overcoming local limitations of gas grids;
General gas system optimization;
Gas prices arbitrage;
Underlying asset for financial derivatives.
Nowadays UGS are often seen as a profit-oriented business enterprise. However, the standard evaluation of the feasibility of UGS often does not include its role in reliability of gas supply. This may lead to an underestimation of the required storage capacity and a reduction in its profitability.
Europe is the third biggest underground gas storage market in the world after North America and the CIS (Commonwealth of Independent States) and storage working volume can cover ca. 20% of annual European natural gas consumption. However, despite the fact that new storage capacity is still being built in this market, there is a risk of stagnation. This threat is caused by limited consumption, a decrease in investment in gas-fired power plants, and the expansion of gas infrastructure, which is not fully exploited. This makes the economic conditions for underground gas storage difficult and forces investors to limit their investments. In the short term a plateau in storage capacity has probably been achieved [
57].
In the short term, intense competition, market pressure for increased flexibility in the services provided, less price volatility, and low seasonal spreads are all expected. Growing market share of LNG will also have an impact on the storage market. On the one hand, it seemingly reduces the demand for storage capacity associated with current demand coverage, but on the other hand, LNG supplies increase the demand for underground storage to provide energy security [
57].
In the long term, despite considerable uncertainty, there are some indications that the demand for storage capacity will increase. The vast majority of European natural gas fields are in the final stages of production and will have to be replaced by supplies from other sources that will require increased storage capacity. An additional factor that may affect the gas market is the development of biomethane production that can be utilized, transported, and stored together with natural gas. The potential for such production in Europe is significant and, additionally, its development is beneficial from an environmental point of view [
58,
59]. Increased production of renewable energy results in increased demand for peak gas power plants, which stabilize the energy system. These power plants, in turn, require a supply of natural gas that can be provided by underground gas storage facilities [
57].
Figure 11 presents the total amount of natural gas in storage in European countries with clearly visible seasonal fluctuations.
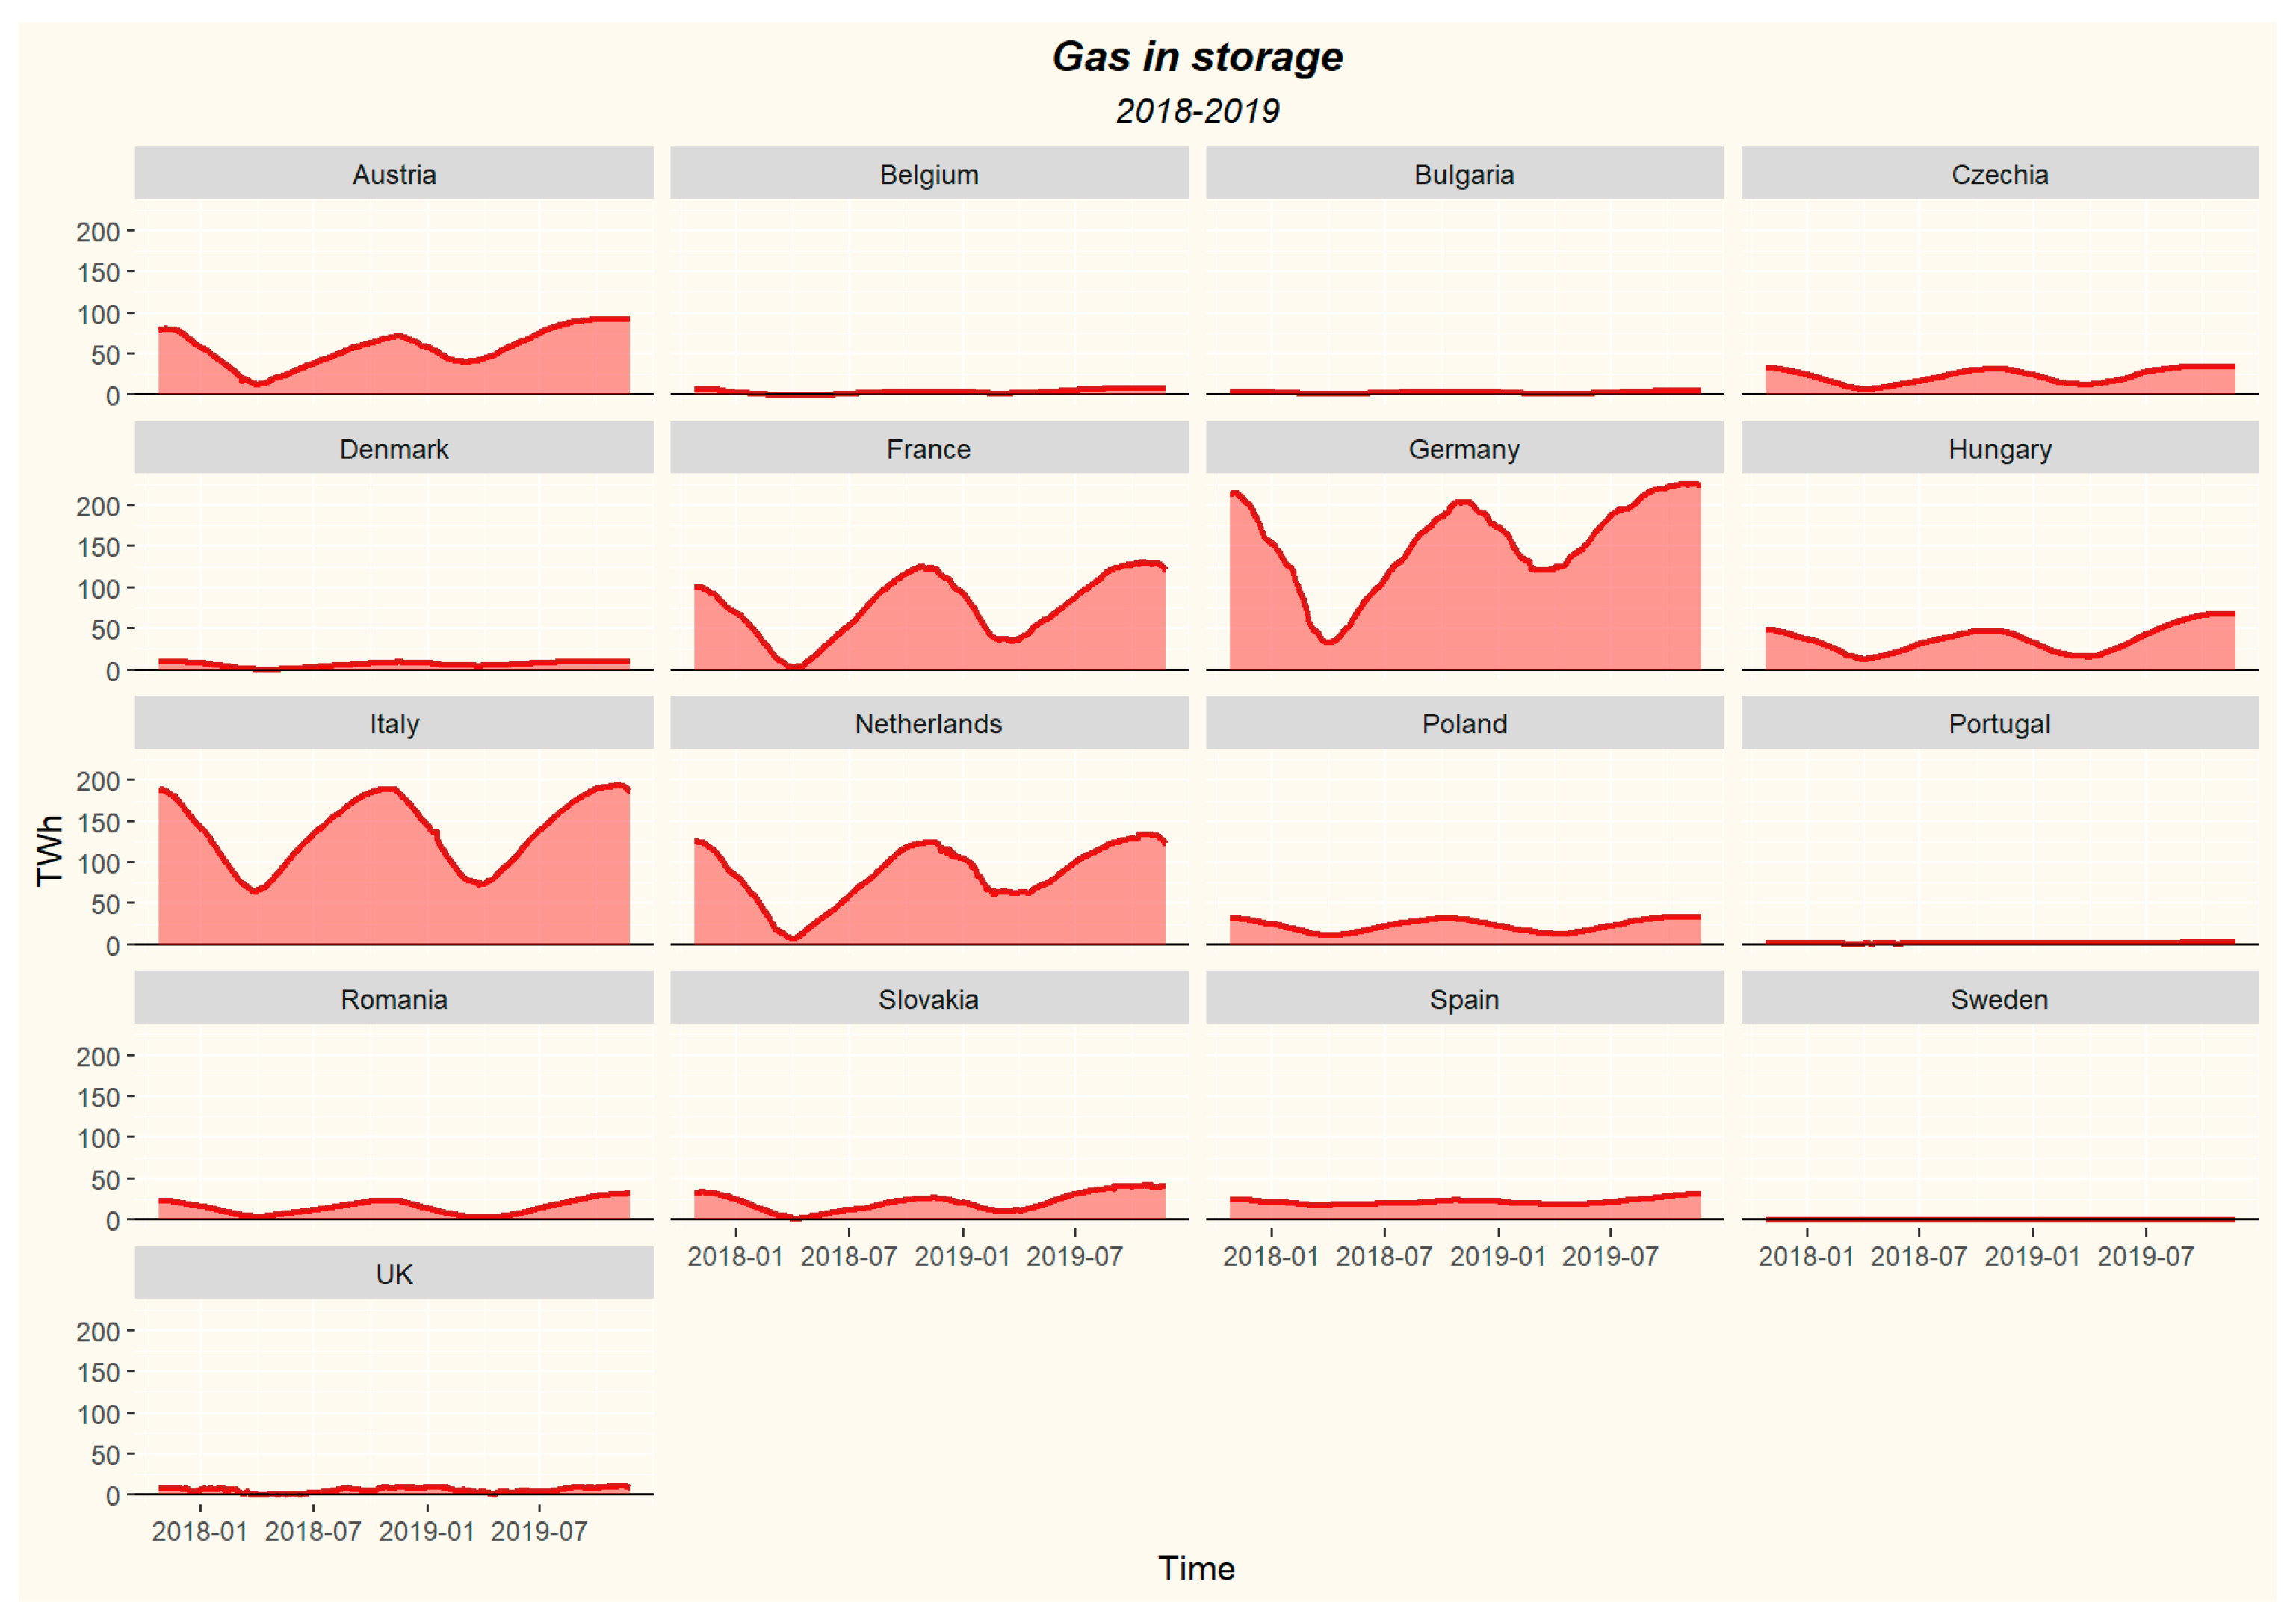
The amount of stock in individual countries differs (
Figure 12) and it is not always strictly associated with the consumption level. Germany, Italy, and France have the largest storage capacity and gas stocks. An interesting case is Austria, which has a relatively large natural gas stock vs. its domestic consumption, but this is a consequence of the fact that one of the largest European gas hubs (Baumgarten) is located in this country. It ensures stabilization of the gas market not only in Austria but also in neighboring countries (e.g., Germany).
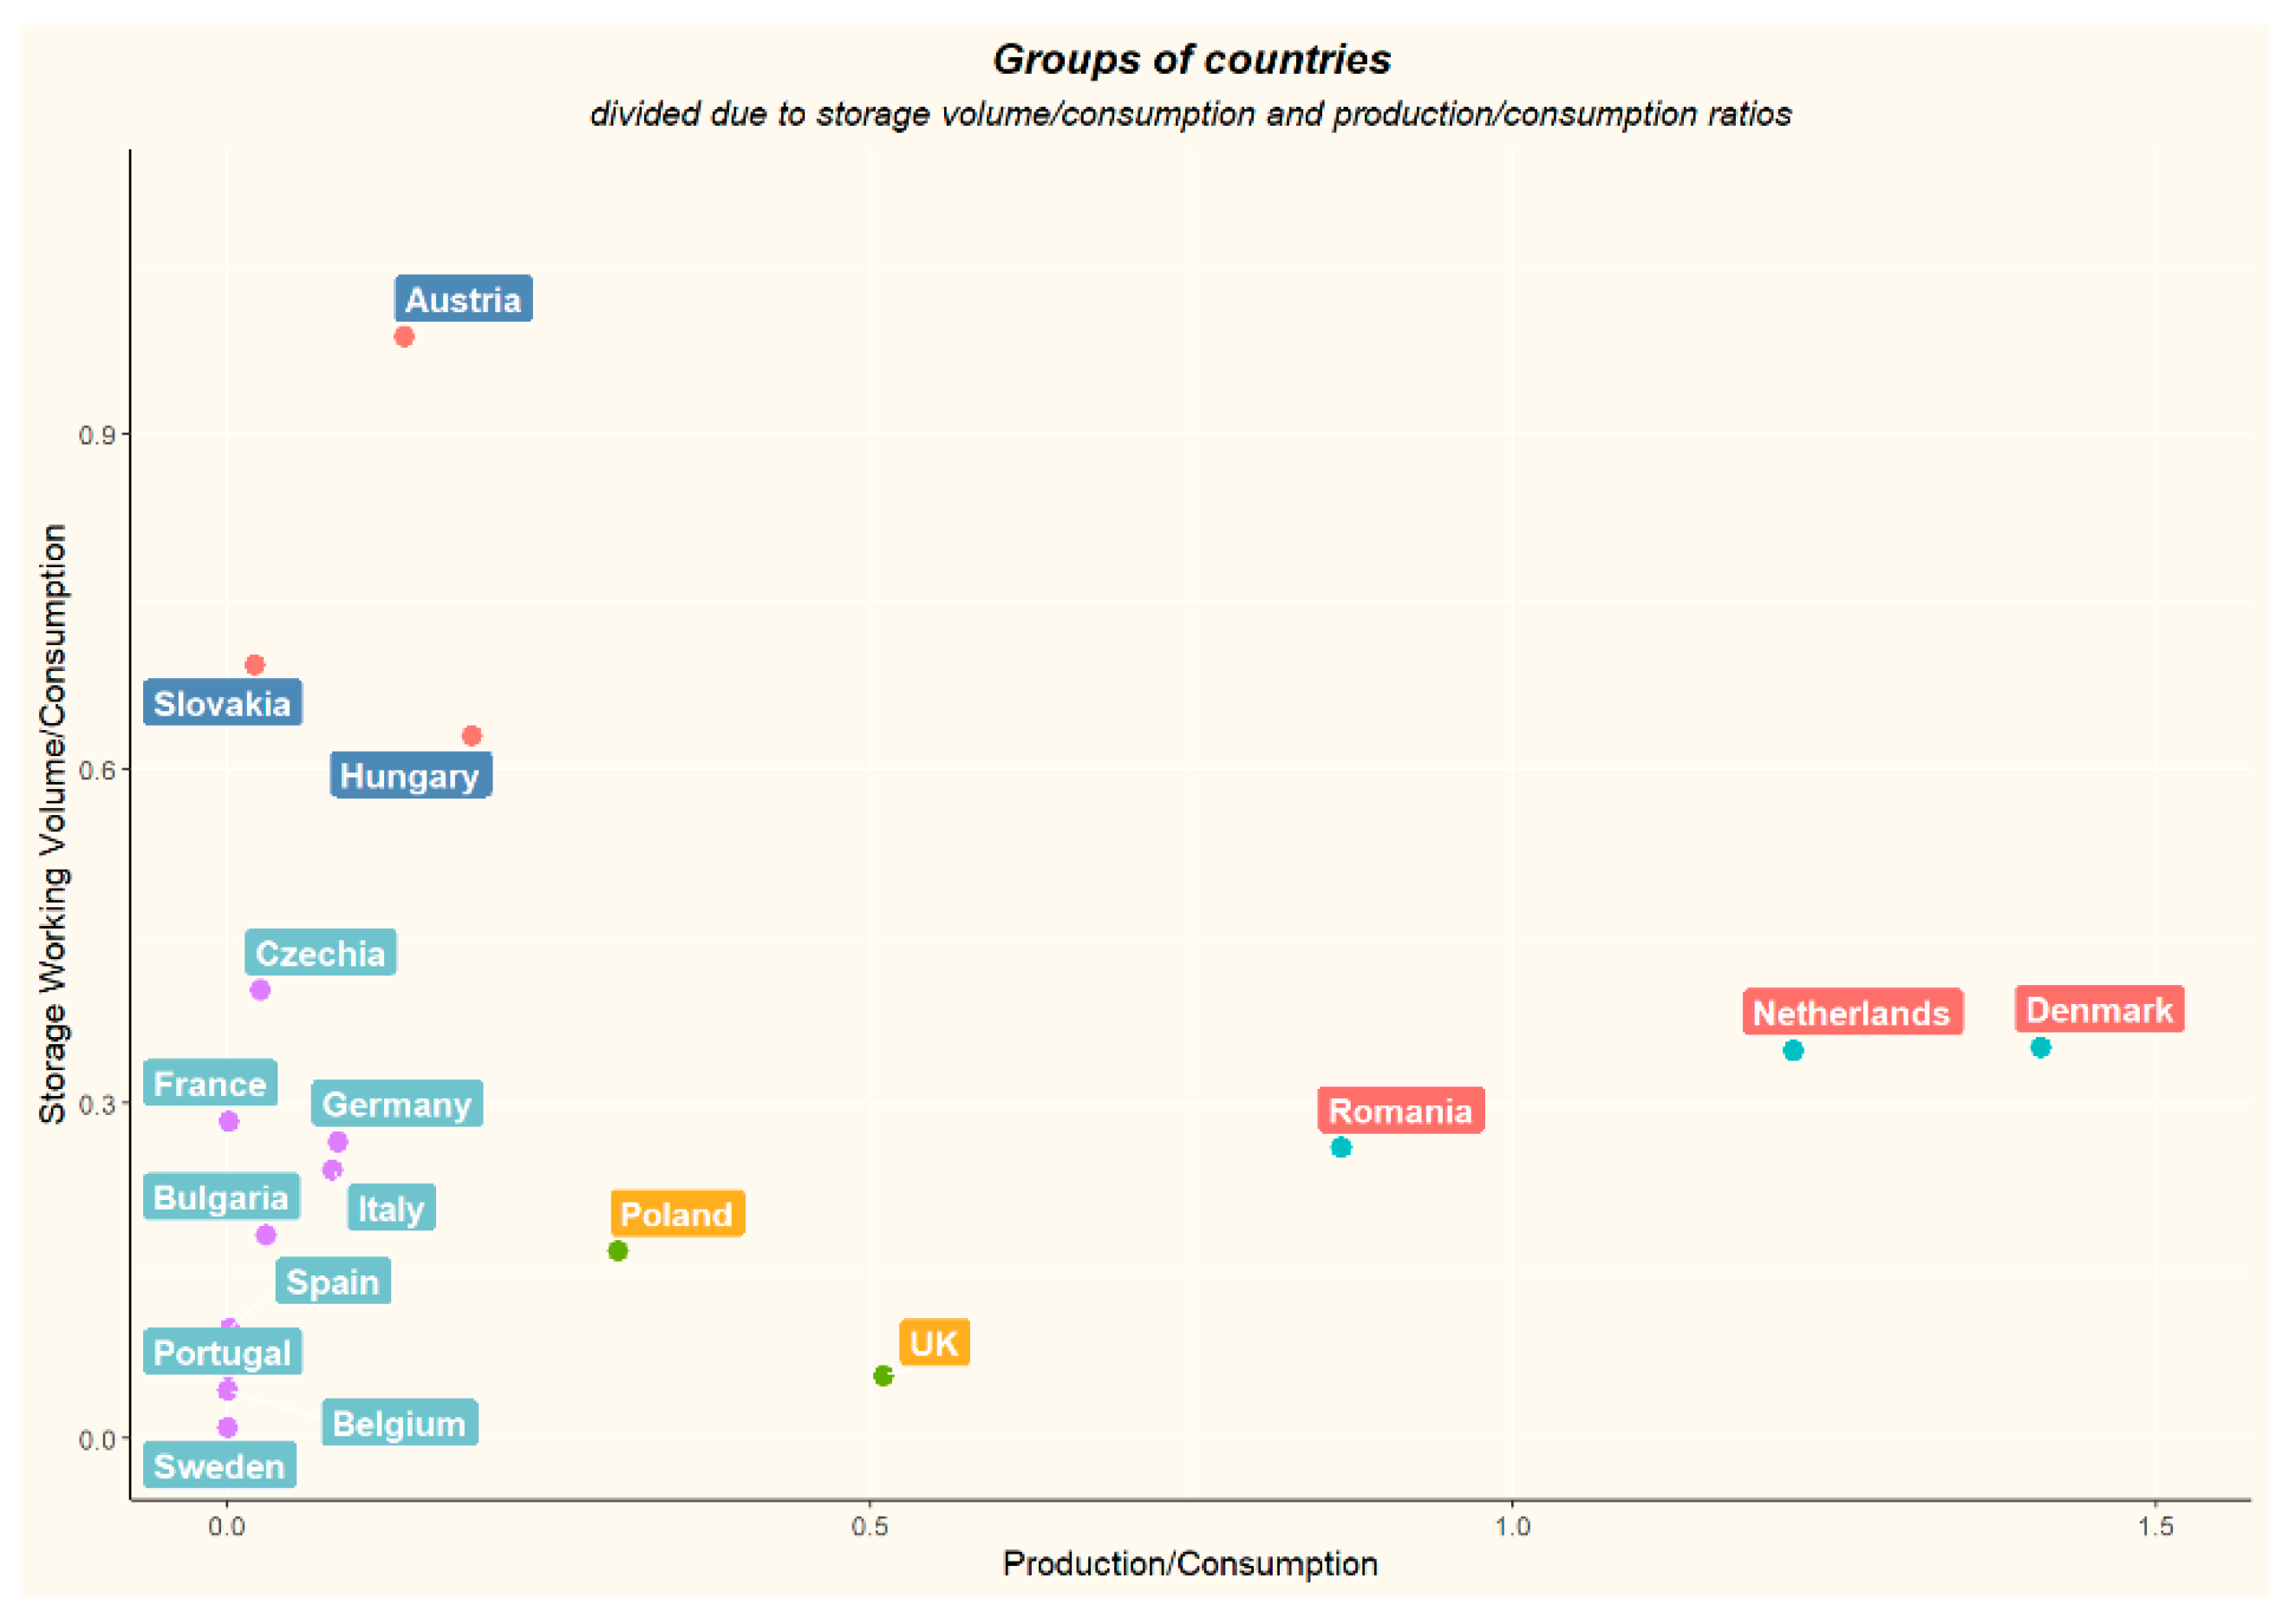
The relationship between the share of storage capacity and the share of own production in annual consumption in annual consumption can be an interesting measure.
Figure 13 presents countries divided into four clusters (using k-means clustering method) according to storage volume/consumption and domestic production/consumption of natural gas ratios. The first of these are the Netherlands, Denmark, and Romania, which are able to fulfil a significant part of (or even total) domestic demand for natural gas from their own sources and at the same time having relatively large storage capacities. The second group consists of Poland and the UK, which have their own resources and limited storage capacities. The third group contains Austria, Hungary, and Slovakia—countries with a small share of their own production in consumption, but with relatively large storage capacities and geographically located close to each other. These countries, due to their lack of access to the sea, have limited opportunities to diversify gas supplies. Additionally, a large gas hub operates in Austria. The fourth group (the remaining countries) encompasses countries where production covers only a small part of the demand for natural gas (or not at all) and the storage capacity in relation to consumption is small. Interestingly, this group includes countries that have the highest storage capacities in the EU (Germany, Italy, and France).
3. Materials and Methods
The value of gas supply security gained thanks to UGS capacities was estimated for selected European countries using stochastic modelling based on historical data. The mathematical model of the Newsvendor problem known from Inventory Theory was adopted assuming random gas demand [
60].
In the original form of this scenario, the decision-maker is a newsboy, who must decide how many newspapers he should buy for later resale. However, the demand for newspapers is a random variable and it can happen that the newsboy will not sell all of the newspapers (supply will be higher than demand). Every newspaper sold makes a profit. If he does not manage to sell the newspaper, then he suffers a loss. This scenario does not necessarily concern only the sale of newspapers but can also be applied to the resolution of other, similar, problems. In addition to the case of selling a product, this scenario can also be used in production planning—in this case the purchase price is equal to the cost of production (the manufacturer “buys” the product for himself).
This approach is slightly different from that existing in other models found in the literature. For example, in [
61] a model of supply security in a gas network is described. It is based on the Monte-Carlo simulation and graph theory. It evaluates gas networks for weakest links and nodes, vulnerability, bottlenecks, new infrastructure, etc. Another model, presented in [
62] examines cost-related objectives for gas transmission network design and planning.
The authors decided to use that model while making the assumption that the gas storage capacity in every country is optimal. They also consider the country’s attitude to the risk of gas supply disruption and take into account the costs of being out of stock that are acceptable to the country.
Such problem inverting enabled an assessment of the financial value of gas supply safety using the Newsvendor problem mathematical model.
The authors believe that the current level of storage capacities as compared to the demand for natural gas represents the attitude of each country to the risk and potential cost of stockout.
According to this approach the target value is not the optimal level of inventory but the cost of stockout.
Profit in this model is described as:
where:
Z—profit;
r—revenue;
c—storage cost;
k—unit cost of stockout;
X—demand;
Y—stock.
Expected total net profit is:
where:
To find the optimal level of inventory for the given profit level, the above equation is differentiated and compared to zero. In this case the assumption was made that the profit (when it comes to energy security) may be equal to 0 (but any other value can also be set).
As a result of successive transformations:
For the normal distribution,
F(
Y) is:
Therefore, the cost of undersupply (unit cost of stockout) is:
If the storage capacity in a given country is optimal at the moment, one can calculate the cost of the stockout estimated and accepted by that country. The higher it is, the more that country is concerned about the lack of sufficient natural gas supplies.
Table 1 presents input data for the analysis of the cost of stockout. For the purposes of the calculation, an average storage cost at EUR 50/Mm3 was used. It approximately reflects the level of storage costs, although it should be kept in mind that due to the specificity of underground gas storage, the operating costs of individual facilities vary and depend on their type (reservoir, aquifer, or salt cavern), size, surface infrastructure used, operating methods, etc. Revenue was defined as the difference between wholesale price and industry gas price.
It is assumed that the standard deviation (σ) in the demand for natural gas storage for each country is equal to 1/3 of the difference between used working storage capacity and the level of annual consumption. The figure arbitrarily assumed by the authors to determine the level of risk associated with the potential lack of natural gas stock.
The presented method of calculation has been applied to the historical data of gas consumption, storage, and prices in European countries.
5. Discussion
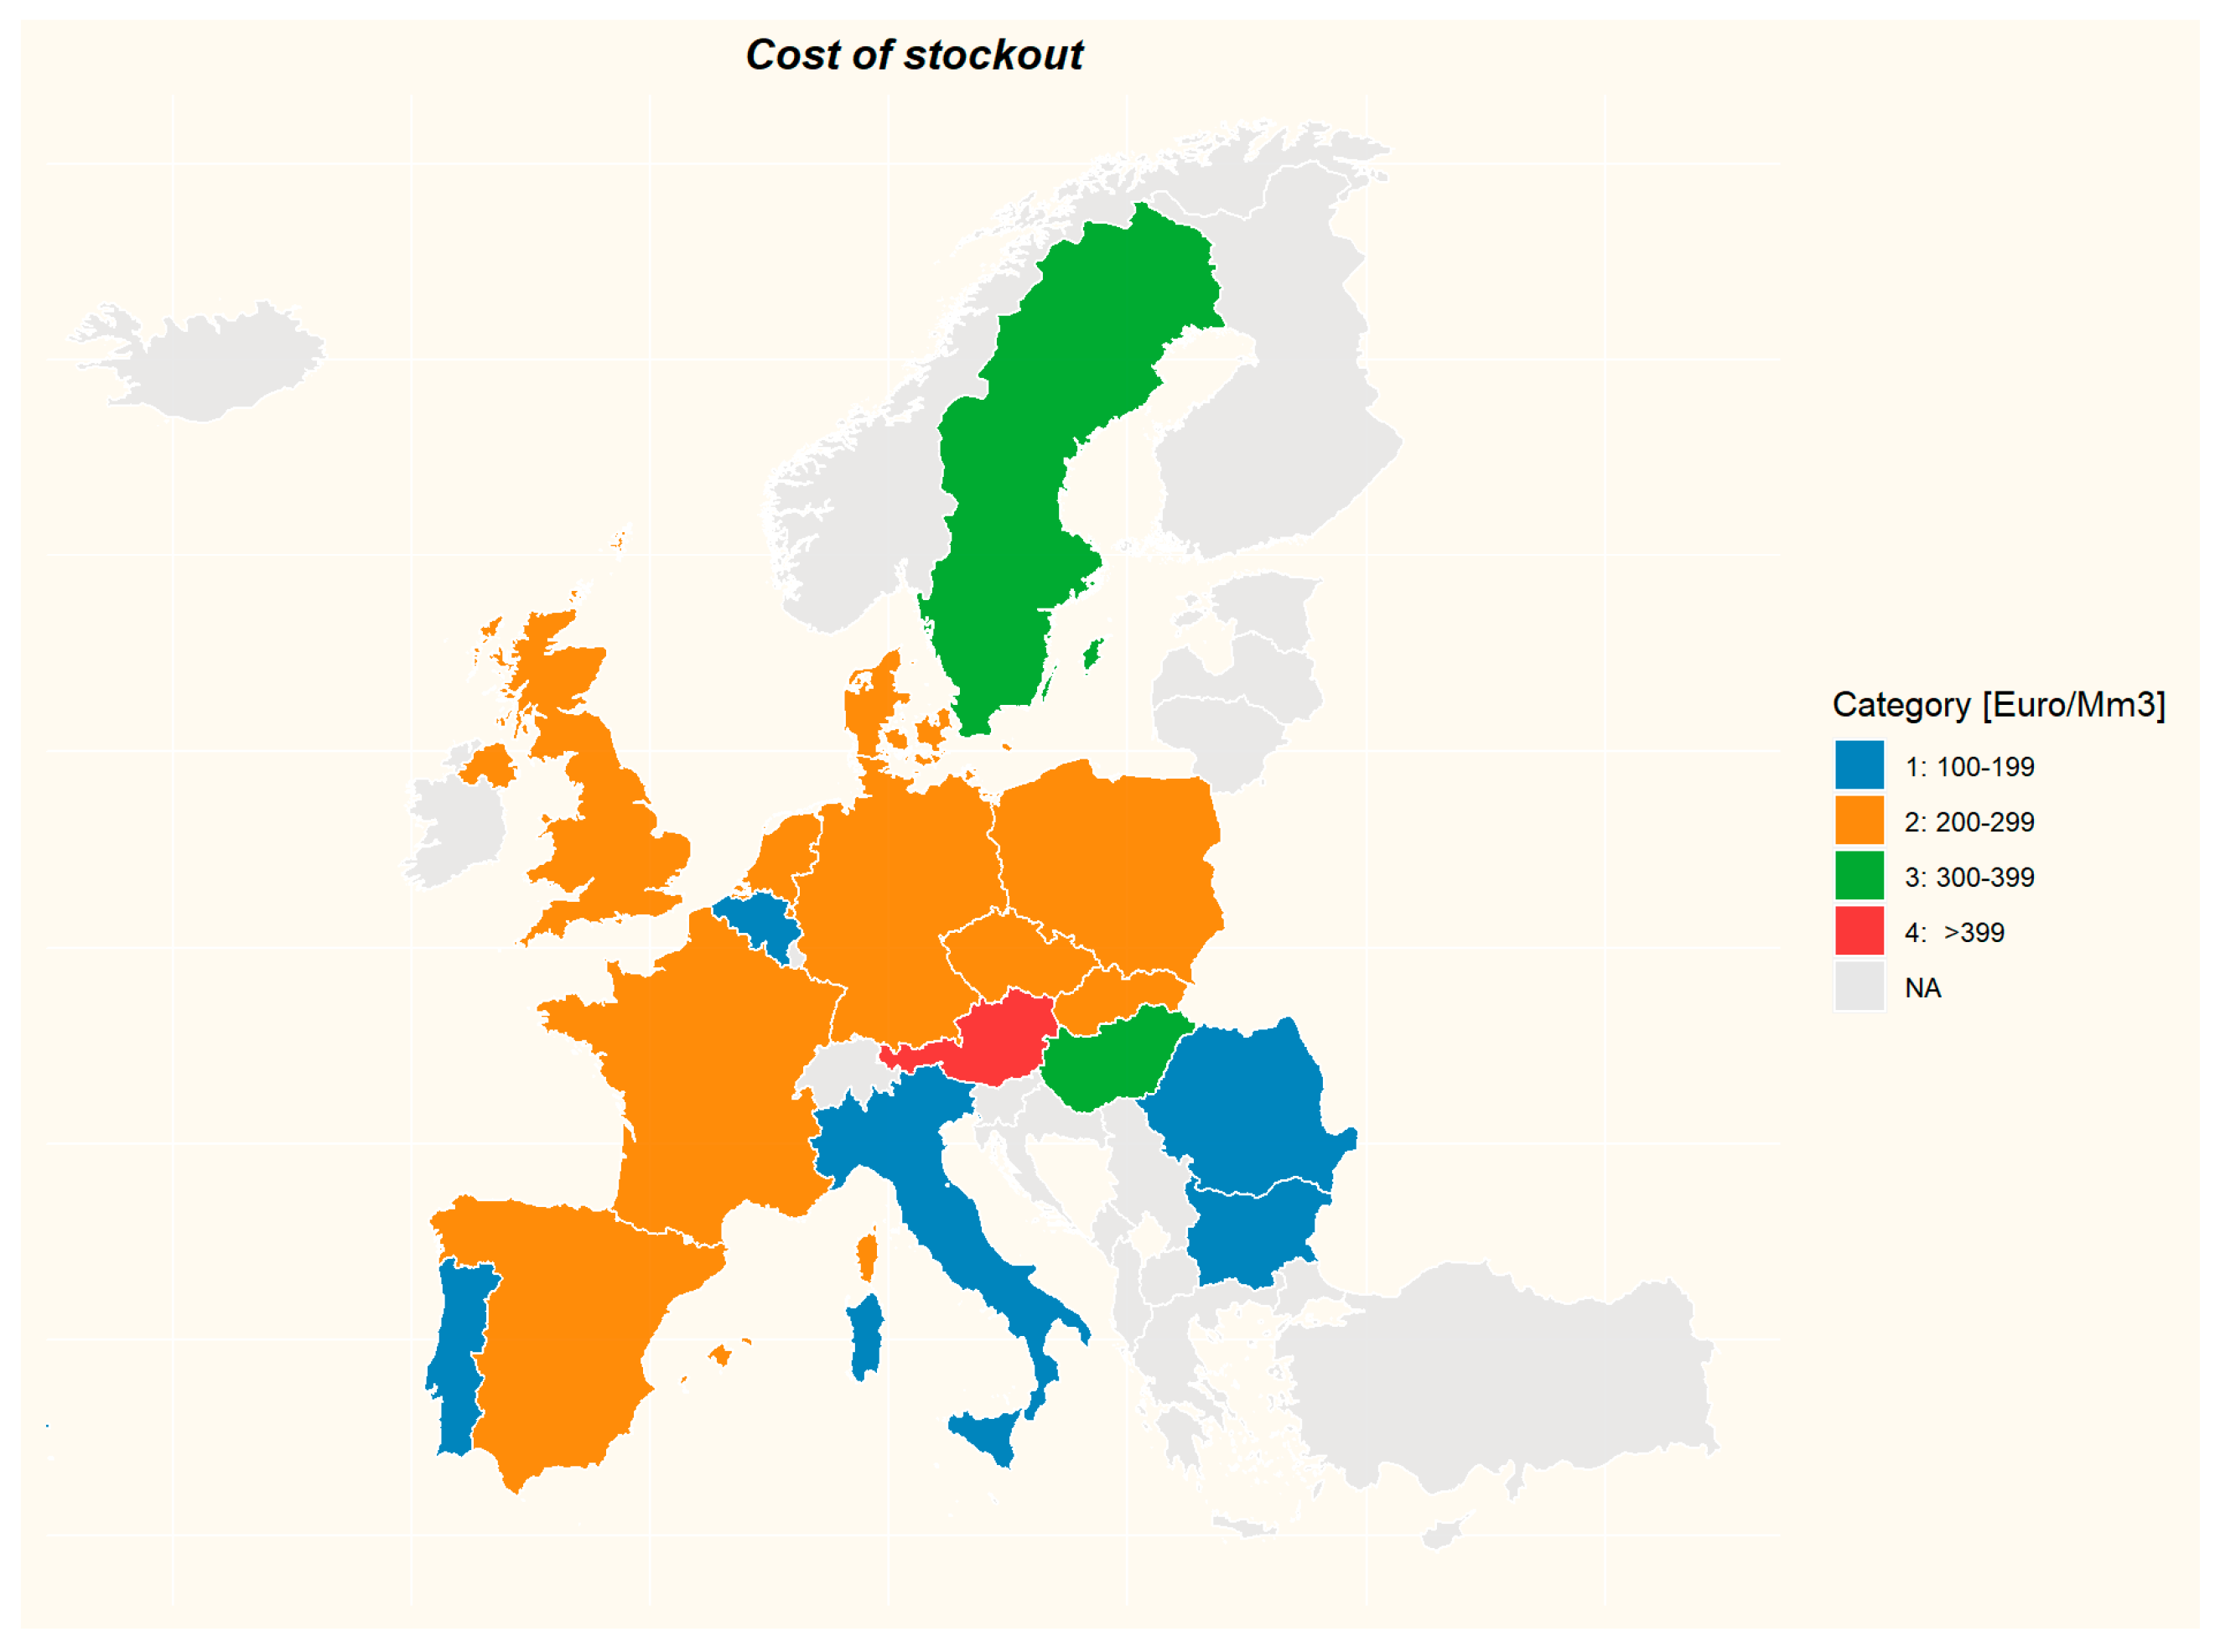
The authors of this paper estimated the value of risk of gas stockout for individual countries and grouped them accordingly. The calculations assumed that the current level of storage capacities as compared to the demand for natural gas reveals the attitude of each country to the risk and potential cost of stockout. If the storage capacity in a given country is optimal at the moment, one can calculate the cost of the stockout estimated and accepted by that country. The higher it is, the more that country is concerned about the lack of sufficient natural gas supplies.
The results show a significant variation in the assessment of this risk. Some countries can secure a large part of their consumption with underground gas storage facilities, which means they fear a shortage of supply and estimate its cost to be high. An example of such behavior is Austria, which, however, is a special case, because despite the small internal market it has a large gas hub in Baumgarten, and the gas infrastructure located on its territory also serves neighboring countries. Hungary is also characterized by a high stockout cost, but this country is very serious about the diversification of energy sources and energy security. That cost is high also for Sweden, but this country, due to the very small gas market, is not a very representative case. Most countries in Europe, assessed according to the proposed indicator, have an estimated cost of non-stock between 200 and 300 EUR/Mm3. This group includes, among others, countries with the largest gas markets in Europe (the UK, Germany, and France) apart from Italy. The latter, together with Romania, Bulgaria, Belgium, and Portugal, is one of the least concerned about the lack of natural gas. This may be attributed to several reasons, not always the same for all these countries, e.g., a relatively small market, such as in Portugal, relatively large domestic production as in Romania, or a milder climate such as in Italy or Portugal. This approach can also be explained by the ability to fulfil a large part of the demand from diversified external sources, or it could be an expression of no concerns about potential natural gas supply difficulties.
The proposed way of valuation of energy security, linked to the natural gas market, can be an interesting complement to energy security considerations, as it illustrates the attitude of individual countries to the risks associated with uninterrupted natural gas supplies. This valuation is important not only because of the specific monetary values that depend on the assumptions made in the calculations, but also because of the possibility of creating a hierarchy of countries, dividing them into similar groups, identifying their attitudes to risk, and analyzing the reasons for these attitudes.
6. Conclusions
Europe is the third biggest underground gas storage market in the world. However, even though new storage capacity is still being built in this market, there is a risk of stagnation. This threat is caused by limited consumption, a decrease in investment in gas-fired power plants and the expansion of gas infrastructure, which is not fully exploited. This makes the economic conditions for underground gas storage difficult and forces investors to limit their investments.
In recent years the UGS market in Europe has been the subject of major changes in the legal, organizational, and economic areas. A number of new regulations have been introduced, organizational structures have been adapted to comply with them, and commercial storage services, which are potentially accessible to all gas market players, have been introduced. However, one can get the impression that the regulatory environment and organizational structures are far ahead of market reality since most storage capacities are still used in the traditional way. There are also claims that underground storage of natural gas is a bad, unprofitable business, because, in the face of oversupply of gas, price spreads are too small to justify commercial storage, which is not a cheap service. As a result, the reasoning behind maintaining expensive UGS facilities is sometimes questioned. On the other hand, if there were no underground storage of gas, price spreads between summer and winter would be higher. It is therefore possible to say that, although UGS facilities do not actually operate on a completely commercial basis (despite the creation of such services), they are certainly responsible for the current state and safety of the gas market in Europe.
However, it cannot be forgotten that the impression of a stable situation in the European gas market can very quickly become a thing of the past because of political, technical, or economic turmoil, especially since the impact of the Russian Federation on this market is still very strong. In a crisis, the most important guarantor of the stability of the gas market will be stocks stored in UGS. Therefore, it is important to consider the energy security provided by UGS facilities.
Fierce competition and market pressure for increased flexibility in the services provided, decreasing price volatility, and low seasonal spreads are expected in the short term. Increasing market share for LNG will also have an impact on the storage market. On the one hand, it seemingly reduces the demand for storage capacity associated with current demand coverage, but on the other hand LNG supplies increase the demand for underground storage due to the desire for energy security in the long term. Despite considerable uncertainty, there are some indications that the demand for storage capacity will increase. The vast majority of European natural gas fields are in the final stages of production and will have to be replaced by supplies from other sources that will require increased storage capacity. Increased production of renewable energy results in an increase in demand for peak gas power plants, which stabilize the energy system. These power plants, in turn, require a supply of natural gas that can be provided by underground gas storage facilities.
Moreover, the future of natural gas as an important fuel and source of primary energy is not clear and unfavorable changes have been sped up by the COVID-19 pandemic. Lower energy demand, low spot gas prices, full storage facilities, and declining volumes were among the main problems plaguing European gas companies in 2020. The situation has improved slightly thanks to the harsher 2020/2021 winter, and the effect of the pandemic on the demand for gas was smaller than expected, but still the future of gas is at stake. Gas (energy) companies in Europe are turning to decarbonization and green energy, and the pandemic has accelerated these changes [
64]. European energy companies used to treat natural gas as a transition fuel which is a key part of their long-term decarbonization strategies, but now they are switching to a multi-energy model through massive investments in renewables and hydrogen. Additionally, blossoming green finance, which is any structured financial product or service created to ensure an improved environmental effect, can play a crucial role in accelerating this transition [
65,
66].
Experts expect that gas will remain an important part of Europe’s energy, but it may be gradually replaced by hydrogen and renewables.


