Article

Impact of Municipal, Road Traffic, and Natural Sources on PM10: The Hourly Variability at a Rural Site in Poland

by
Tomasz Mach
1,
Wioletta Rogula-Kozłowska
2,
Karolina Bralewska
2,
Grzegorz Majewski
3,
Patrycja Rogula-Kopiec
4 and
Justyna Rybak
1,*
1
Faculty of Environmental Engineering, Wrocław University of Science and Technology, Wybrzeże Wyspiańskiego 27, 50-370 Wrocław, Poland
2
Institute of Safety Engineering, The Main School of Fire Service, 52/54, Słowackiego St., 01-629 Warsaw, Poland
3
Institute of Environmental Engineering, Warsaw University of Life Sciences, 02-787 Warszawa, Poland
4
Institute of Environmental Engineering, Polish Academy of Sciences, 34 M. Skłodowska-Curie St., 41-819 Zabrze, Poland
*
Author to whom correspondence should be addressed.
Energies 2021, 14(9), 2654; https://doi.org/10.3390/en14092654
Submission received: 3 April 2021 / Revised: 24 April 2021 / Accepted: 26 April 2021 / Published: 6 May 2021

Abstract

:
The paper presents data from a monthly campaign studying the elemental composition of PM10, as measured by a specific receptor in Kotórz Mały (Opole Voivodeship)—located in the vicinity of a moderately inhabited rural area—measured in one-hour samples using a Horiba PX-375 analyzer. The hourly variability of SO2, NO, NO2, CO, and O3 concentrations, as well as the variability of meteorological parameters, was also determined. On average, during the entire measurement period, the elements related to PM10 can be arranged in the following order: As < V < Ni < Pb < Cr < Mn < Cu < Ti < Zn < K < Fe < Ca < Al < Si < S. Trace elements, including toxic elements—such as As, V, Ni, Pb, Cr, and Mn—were present in low concentrations, not exceeding 10 ng/m3 (average daily value). These elements had fairly even concentrations, both daily and hourly. The concentrations of the main elements in the PM10, as measured by the receptor, are subject to strong hourly changes related not only to changes in the structures of the sources identified in the statistical analysis, but also to wind speed and direction changes (soil and sand particle pick-up and inflow of pollutants from coal combustion). It has been shown that the transport emissions measured by the receptor can have an intense effect on PM10 in the afternoon.

1. Introduction

Particulate matter (PM)’s elemental composition is one of its critical characteristics, determined to characterize the environmental and health effects of the PM, as well as to define the PM’s origin at a particular receptor. Taking advantage of the fact that the elemental composition of PM leaving the emission source is more or less defined, the information about it can be used to define the origin of PM in almost any area. Various types of mathematical models are used for this purpose [1,2,3,4,5]. Data on element concentrations of PM are used to evaluate the origin of PM for two main reasons: First, excluding light elements—mainly carbon, nitrogen, and sulfur—most of the elements that form PM, under atmospheric conditions, occur in chemically stable compounds. These compounds, along with PM particles, are transported from the emitters to the receptor in more or less the same chemical form, and in amounts that strictly depend on the number of PM particles emitted by the emitters containing these elements [6,7,8,9]. The situation is different with carbon, sulfur, and nitrogen compounds, as their presence in PM at a specific receptor depends not only on the number of stable compounds in PM emitted from sources affecting this receptor, but also on the presence of gaseous organic and inorganic precursors of secondary aerosols in the atmosphere, as well as meteorological factors determining the intensity and direction of changes of volatile and semi-volatile compounds in the atmosphere [10,11,12,13]. The second reason why the knowledge of elemental composition facilitates the understanding of the temporal and spatial variability of PM origin in different regions is that some elements are effective markers of specific PM sources. More specifically, we can say that there are elements characteristic of only one source/emitter, or of a group of similar PM sources, that allow us to distinguish a given source/group of sources from others. For example, the presence of silicon or aluminum are characteristic of PM emitted from soil erosion or sand, while potassium suggests PM derived from biomass combustion [7,14,15,16]. Until recently, lead has been successfully applied as a marker for PM emissions from petrol combustion in car engines [17,18,19]. Sometimes the mass ratios of trace elements contained in PM are used to assess the origin of PM in a given area, as their characteristic values for PM emitted from different sources are known [1,20]. Today, it is known that the assessment of the origin of PM on the basis of its elemental content, and with the employment of various approaches and mathematical models, is more effective in areas where the elemental profiles of PM emitted from different sources are highly varied and approximately repeatable long term [1,2,3,21].
For the correct use of these models, and in order to obtain the right conclusions from the results, it is necessary to collect a large amount of data. Their number depends on many factors; in addition to the meteorological and emission characteristics of the area, it also depends on the model used.
In areas where PM emissions from different sources overlap and/or one source is clearly dominant, the correct determination of the origin of the PM may be very difficult or even impossible [22,23,24,25]. Presumably, in such regions, data from averaging measurements over time intervals shorter than 24 h could be more useful in assessing the origin of PM, determined by the elemental concentrations of the PM. Previous studies have shown, for example, that concentrations and chemical composition, including the elemental profiles of PM, dynamically change throughout the day, hour by hour, and that the main causes of this variability are road and municipal emissions. Unfortunately, it is often technically impossible to determine the composition of various elements of PM in samples taken over one hour. Such data come almost exclusively from studies conducted with automatic measurements using the XRF technique. So far, such research has never been conducted in Poland. Meanwhile, in almost all regions of Poland, in terms of PM origin, difficulties have been noted in performing such an analysis (PM origin analysis) based on daily data on the elemental composition of PM. This paper presents and analyses data from a monthly measurement campaign studying the elemental composition of PM10 measured in one-hour samples (averaged every hour). The data were used to assess the origins of PM10 in a rural area in southern Poland. The variability of the elemental composition of PM10, determining the variability of the participation of individual sources in the concentrations of PM10 at a specific receptor, was examined.

2. Materials and Methods
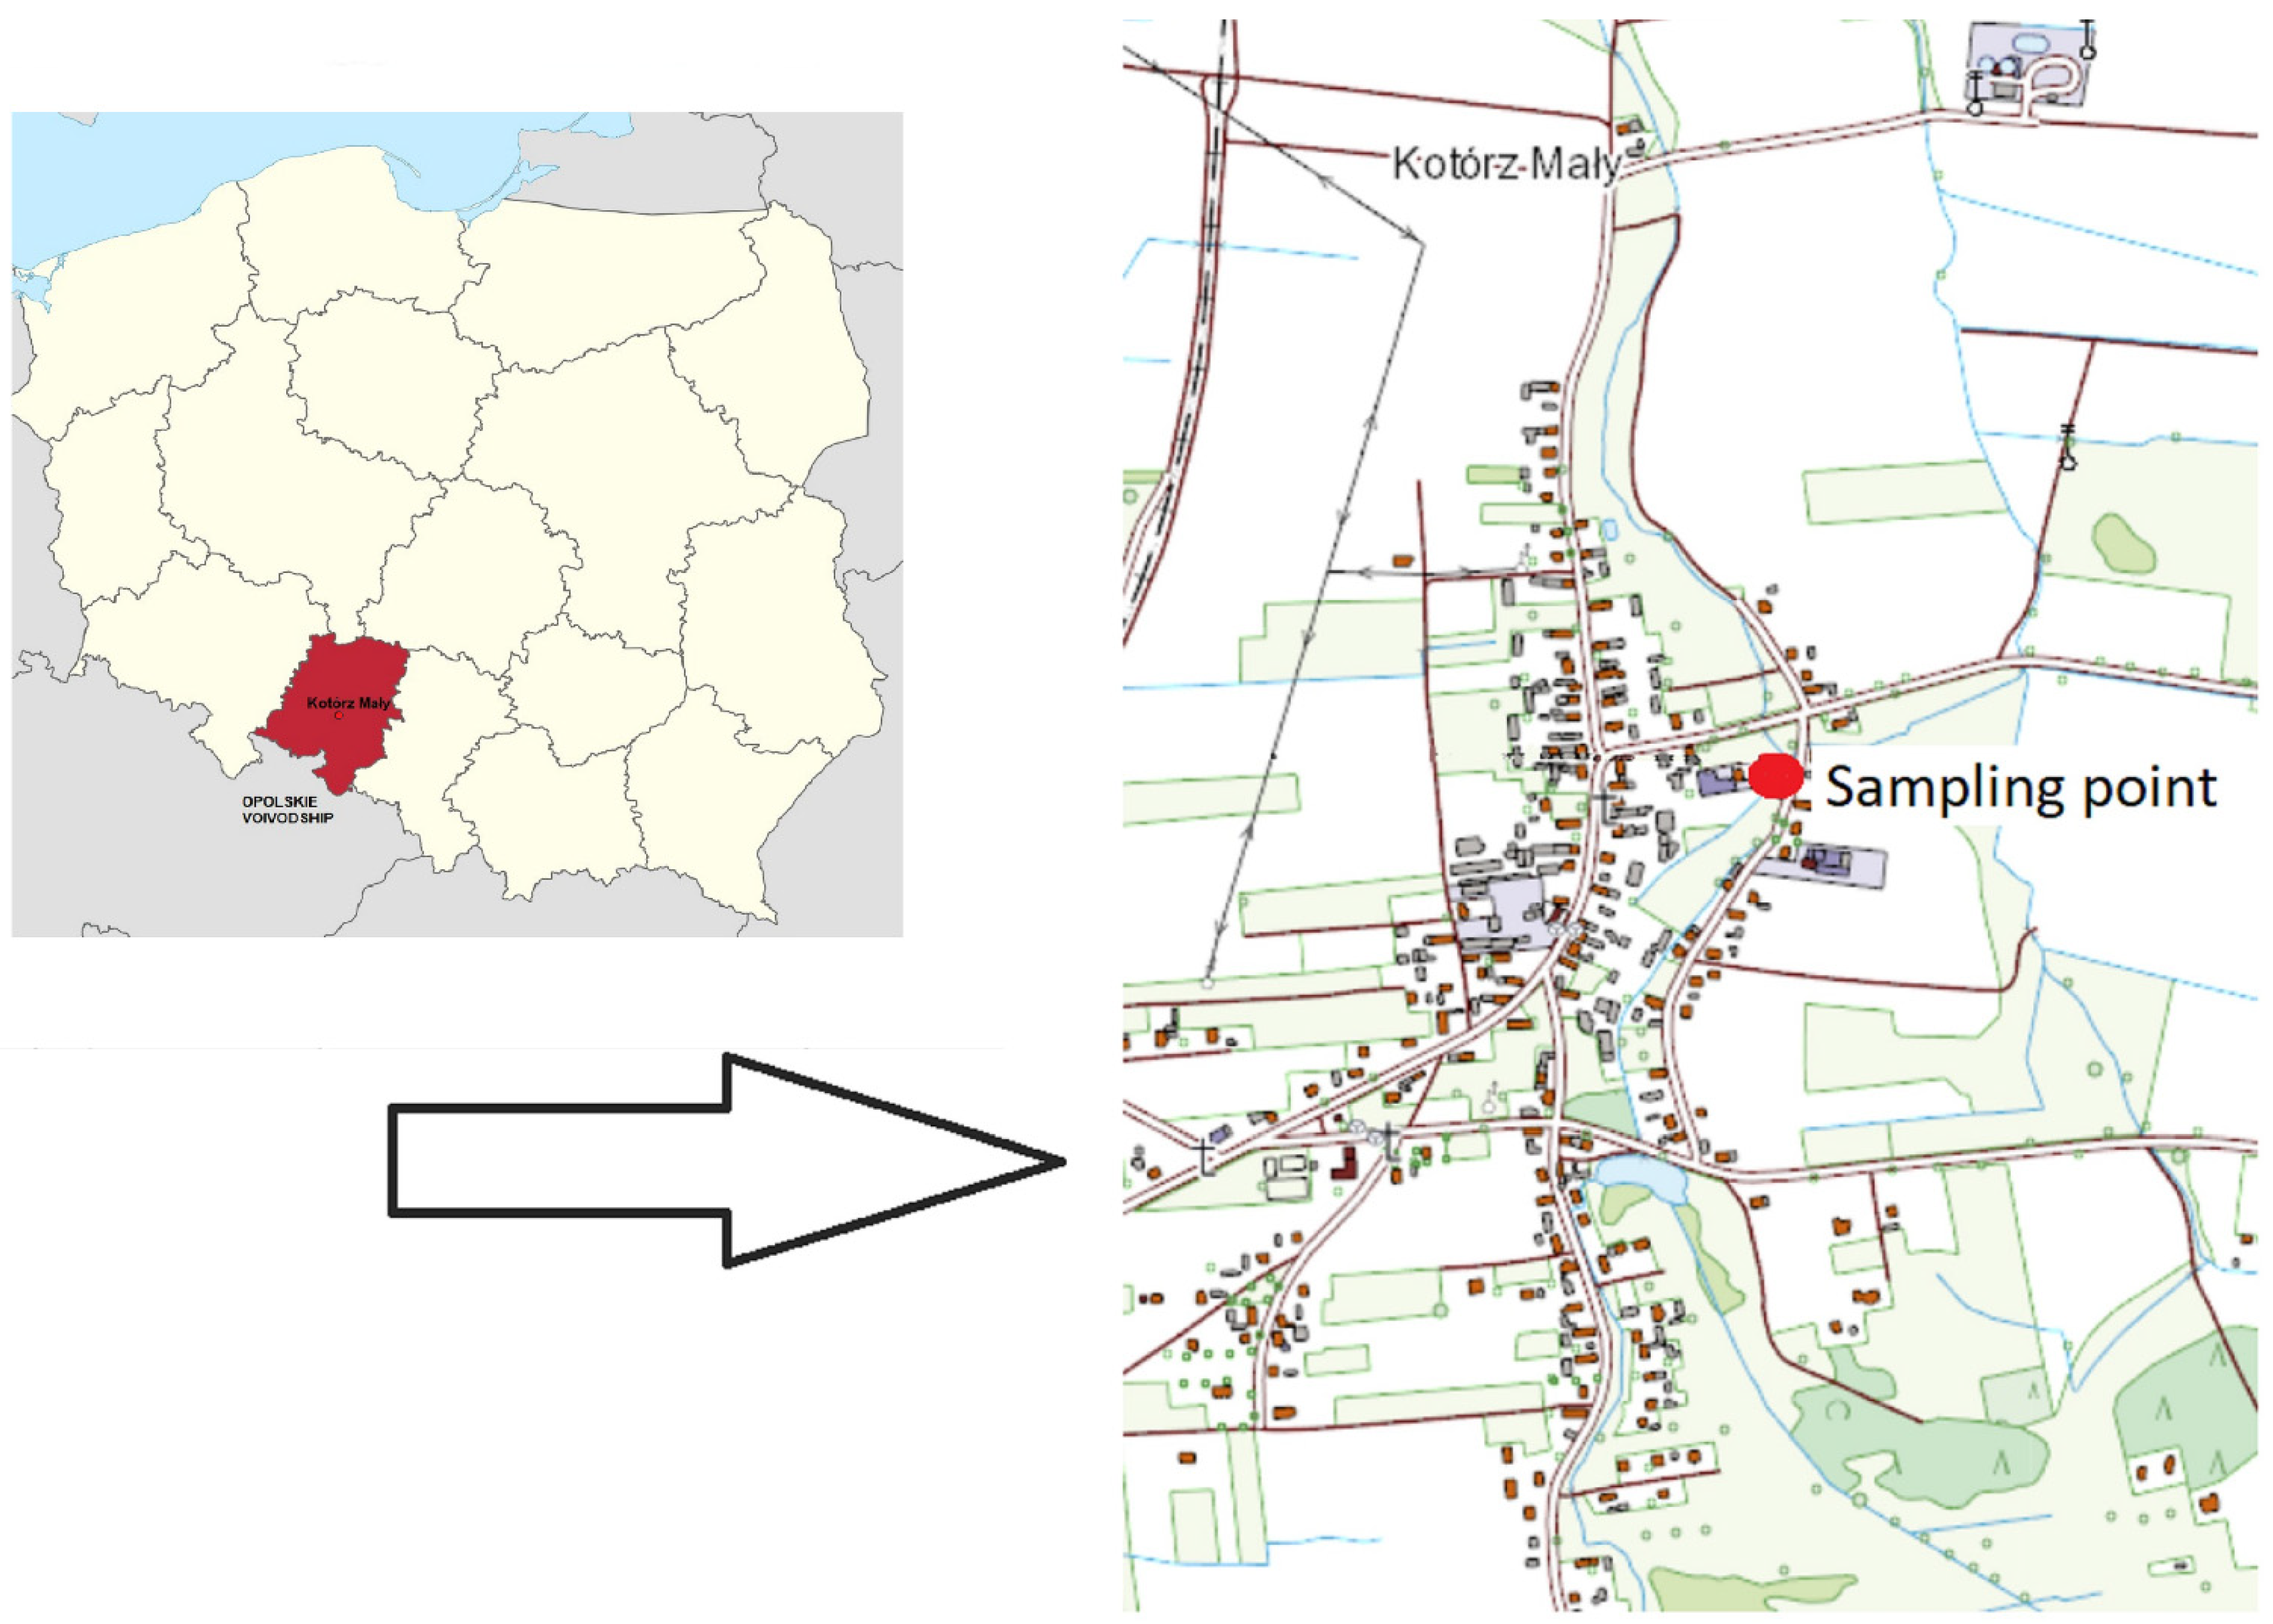
2.1. Sampling Site

As the receptor, the measurement point in the northern part of the village was selected, which is situated near a moderately inhabited rural area (Kotórz Mały, Opolskie Voivodeship; Figure 1) surrounded by meadows, low shrubs, and trees (50°43′66.02″ N; 18°02′06.80″ E, 162 m. a. s. l.). Kotórz Mały is a village with around 1000 inhabitants, which is located 15 km northeast of Opole, with 122,000 inhabitants. In this village three car services, two metal surface varnishing services, and two carpentries are situated, all of which are equipped with high-efficiency dust collection systems. Apart from these, there are no local sources of air contamination in Kotórz Mały. As is typical for Poland, natural emissions are the main sources of aerosol during the warm seasons, while domestic heating systems are the main local source of air contamination during the cold season [26]. Two national roads are situated within a few kilometers of the village: Road No. 45 to the northwest, with a traffic load of approx. 8000 vehicles/day, and Road No. 46 to the southeast, with approx. 9500 vehicles/day (data from General Director for National Roads and Motorways https://www.gddkia.gov.pl/userfiles/articles/g/generalny-pomiar-ruchu-w-2015_15598//SYNTEZA/WYNIKI_GPR2015_DK.pdf) (access date: 28 April 2021).

2.2. Measurement Method

PM10 mass and elemental concentrations of Al, As, Ca, Cr, Cu, Fe, K, Mn, Ni, Pb, S, Si, Ti, V, and Zn were measured hourly with an online XRF (Horiba PX-375, HORIBA ltd., Kyoto, Japan). This monitor applies reel-to-reel filter tape sampling, with analysis of beta ray attenuation, in order to determine the total PM10 mass. A nondestructive energy-dispersive X-ray fluorescence (EDXRF) spectroscopic analysis was applied to assess the selected elements’ concentrations. The EDXRF contains a complementary metal–oxide–semiconductor (CMOS) camera for sample images. A two-layer non-woven PTFE fabric filter was applied in order to stop the PM from passing onto the opposite side. PM10 inlet and filter tape was used for air, at a flow rate of 16.7 L/min, assuming a deposit of approx. 11.1 mm in diameter. After the collection of single samples every 60 min, beta ray attenuation EDXRF analyses were performed for 500 s (15 kV or 50 kV depending on the element per hourly sample) together with the collection of the subsequent sample. In addition, we could check the color of the samples, which gives more reliable results.
NIST-certified standard material, SRM 2783 (air particulate matter on filter media), was applied to determine the elemental quantification of X-ray spectra, and to obtain a quality control measure. Additionally, the lowest detection limits (LLD as double the standard deviation of the blank analyzed) were Al (56.7 ng/m3), As (3.7 ng/m3), Ca (1.1 ng/m3), Cr (2.05 ng/m3), Cu (1.85 ng/m3), Fe (7.00 ng/m3), K (4.8 ng/m3), Mn (1.45 ng/m3), Ni (0.9 ng/m3), Pb (1.05 ng/m3), S (1.55 ng/m3), Si (8.85 ng/m3), Ti (0.25 ng/m3), V (1.7 ng/m3), and Zn (1.25 ng/m3).
The measurements lasted from 3 to 31 July 2018. In addition to the concentration of PM10 and the elemental composition of PM10, the hourly variability of the concentrations was also examined during the measurement campaign:
-
SO2 (Monitoring für Leben und Umwelt API-MLU100 automatic analyzer; in accordance with PN-EN 14212 (Atmospheric air quality. Standard fluorescent UV method for determining the concentration of sulfur dioxide); the limit of detection and measurement accuracy is 2.850 µg/m3). This analyzer ranges from 0–50 ppb to 0–20 ppm, and is based on the UV fluorescence principle. The optical shutter and a reference detector provide high stability;
-
NO/NO2 (Monitoring für Leben und Umwelt MLU200E automatic analyzer; in accordance with PN-EN 14211 (Atmospheric air quality. Standard chemiluminescent method for measuring the concentration of monoxide and nitrogen dioxide); the limit of detection and measurement accuracy is 1.025 µg/m3). This analyzer ranges from 0–50 ppb to 0–20 ppm, and has independent ranges for NO, NO2, and NOx. The analyzer is based on the chemiluminescence detection principle. Measurements are compensated for temperature, pressure, and flow changes. An auto-zero circuit provides a true zero reference, which gives good stability;
-
O3 (Monitoring für Leben und Umwelt MLU400E automatic analyzer; in accordance with PN-EN 14625 (Atmospheric air quality. Standard method for measuring ozone concentration using UV photometry); the limit of detection and measurement accuracy is 4.280 µg/m3). This analyzer ranges from 0–100 ppb to 0–10, ppm and has single-path ultraviolet absorption. The analyzer is based on the Beer–Lambert law for measuring low ranges of ozone in ambient air. The idea is that a 254 nm signal of UV light passes through the sample cell, where it is absorbed in proportion to the concentration of ozone present;
-
CO (Monitoring für Leben und Umwelt MLU400E automatic analyzer; in accordance with PN-EN 14626 (Ambient air quality. Standard method for the determination of carbon monoxide using non-dispersive infrared spectroscopy); the limit of detection and measurement accuracy is 0.125 mg/m3). This analyzer ranges from 0–1ppm to 0–1000 ppm, and has a gas filter wheel for CO-specific measurement, and a 14 m path length for sensitivity. The idea of measurement is based on the comparison of infrared energy absorbed by a sample to a reference sample according to the Beer–Lambert law. This is accomplished with a gas filter correlation wheel, which allows a high-energy light source to pass through both a CO-filled chamber and one with no CO. The light path passes through the sample cell, and the energy loss through this cell is compared with the zero reference signal provided by the gas filter to produce a signal proportional to concentration, with little effect from interfering gases within the sample;
Meteorological parameters—e.g., air temperature, humidity, wind speed, wind direction, atmospheric pressure, and precipitation—were measured with a Gill Instruments Windsonic 2D wind speed and direction sensor, and an LSI DMA572 temperature and humidity sensor, according to the instructions of the network of state weather stations operated by the Institute of Meteorology and Water Management (IMWM).

2.3. Data Analyses

First, the hourly data on each measured day were averaged. Descriptive statistics of all of the parameters tested during the measurement period, averaged to the 24-h value, are presented in Table 1.
In the case of the concentrations of PM10 and PM10-bound elements, the hourly variability of the concentrations during the day was also tested (Figure 2 and Figure 3). For this purpose, the average concentrations determined for each hour were averaged over the entire measurement period (29 concentrations for 0.00 h; 29 for 01.00 h, etc.).
The enrichment factor (EF) was estimated for each element, measured separately for the average concentration of the element in each hour of the day, and for the averaged concentration of the element over the whole campaign. The method of calculating the EF for the elements, and the assumptions for the calculations, were done in the same way as in previous works [22,23,24,27,28,29]. The enrichment factor allowed us to determine quantitatively the influence of anthropogenic effects on the PM10-bound elements’ concentrations.
Additionally, principal component analysis (PCA) was applied to the 15 × 29 data matrix [23,24] representing the 1-h PM10-bound elements’ concentrations.
All calculations were done using Statistica 8.0 software (StatSoft, Tulsa, OK, USA).
All documentation photos of the experiment and the research are available in the Supplementary Materials (Figures S1–S5).

3. Results and Discussion

3.1. Concentrations of PM10

The 24-h concentrations of PM10 in Kotórz Mały ranged from 7.1 to 48.4 µg/m3 (Table 1). The mean PM10 concentration over the whole measurement campaign was 20.8 µg/m3. This is below the daily PM10 concentration limit established by the European Commission (50 µg/m3; not to be exceeded on more than 35 days per year) [30]. PM10 concentrations fluctuated throughout the day, although the changes were relatively small (±5 µg/m3) (Figure 2). The lowest concentrations of PM10 were recorded between 00.00 a.m. and 06.00 a.m., and the highest between 02.00 p.m. and 09.00 p.m. The fact that the measurements were conducted in the summer, the slight variability of PM10 concentrations during the day, and the location of the receptor between two national roads—i.e., Road No. 45, with a traffic density of approx. 8000 vehicles/day (approx. 3 km in a straight line to the northwest), and Road No. 46, with a traffic volume of approx. 9500 vehicles/day (approx. 6 km in a straight line to the southeast) (data from 2015 data from General Director for National Roads and Motorways https://www.gddkia.gov.pl/userfiles/articles/g/generalny-pomiar-ruchu-w-2015_15598//SYNTEZA/WYNIKI_GPR2015_DK.pdf access date: 28 April 2021), allow us to assume that the PM10 concentrations at the receptor were mainly determined by traffic emissions, and their peaks in the afternoon hours were caused by the increased traffic intensity related to movement to and from work (2nd shift). This is also indicated by the wind distribution of PM10 pollution (Figure 4), according to which the highest concentrations of PM10 were observed at the inflow of air masses from the north–northwest and the northeast, where the above routes run. PM10 concentrations above the average (>20 µg/m3) were also recorded, with air masses appearing from the southeast. This may also indicate the impact PM10 of emission sources present in the Opole agglomeration, located 15 km southeast of the receptor, on the PM10 concentration at the receptor. Although the measurements were carried out in the summer, the so-called low-stack emissions related to the combustion of solid fuels in individual home furnaces (e.g., to heat bathwater and satisfy heating needs) can be taken into account as an additional source of PM10 in the evenings, especially since in the analyzed measurement period there were days when the air temperature was below 15 °C.
The mean concentration of PM10 at the receptor did not differ much from the PM10 concentrations registered in the in the non-heating season eason in other locations in Poland, e.g., at two rural sites in Upper Silesia (2013; 16.14–27.89 µg/m3) [31], in the industrial district of the city of Sosnowiec (2017, 20 µg/m3) [32], in a health resort in Krynica Zdrój (2016, 15.2 µg/m3) [33], in small cities around the Kraków agglomeration (2017, 23.31 µg/m3) [34], and in urban areas of Wrocław and Poznań (2016, approx. 18 µg/m3 in both cities) [35]. The mean PM10 concentration in Kotórz Mały was comparable to the concentration of PM10 recorded in summer in agricultural areas of the Netherlands (2011, 21 µg/m3), and to the mean annual concentrations of PM10 in selected European cities (Vienna, Brussels, London; 2014, 23–25 µg/m3) [36]; however, it was low in relation to the values registered at various European locations, such as Istanbul, Turkey (2014, 58 µg/m3) [37], and Žilina, Slovakia (2017, 86 µg/m3) [38]. The relatively low concentration of PM10 at the receptor was probably influenced by the existence of a natural forest barrier (approx. 0.8 km in a straight line), the lack of local industries or enterprises that influence air quality (closest industrial activity approx. 13 km from the receptor), and the high average wind speed (7.1 m/s), which in the analyzed measurement period was more than twice as high as the average annual wind speed in Poland (2.6 m/s in summer; 3.8 m/s in winter). High wind speeds could stimulate the air mixing processes, causing the migration of pollutants from the receptor to other areas, but it should also be taken into account that they could favor the inflow of pollutants from neighboring areas, e.g., the Opole agglomeration, especially resulting from the activities of industrial plants operating in Opole, i.e., over 15 km from measurement devices (power and heating plants, food and construction industry plants).
In this study, the concentrations of gaseous PM precursors—i.e., nitrogen oxides (NOx), sulfur oxides (SO2), ozone (O3), and carbon monoxide (CO)—were also analyzed (Table 1). The average concentrations of NO, NO2, SO2, O3, and CO in the receptor take values were 1.0 µg/m3, 6.2 µg/m3, 3.4 µg/m3, 25.1 µg/m3, and 0.4 µg/m3, respectively, and these were lower than the concentrations recorded in different parts of Poland, e.g., in the central agglomeration of Silesia (summer 2017, NOx approx. 30 µg/m3) [39], in the Warsaw agglomeration (summer 2014, NO2 = 18.5 µg/m3, NOx = 22.5 µg/m3, SO2 = 4 µg/m3, O3 = 62.2 µg/m3) [40], and two cities in northern Poland (Tczew and Sopot) (warm season 2014; NO2 = 10.3 µg/m3 (Tczew) and 10.0 µg/m3 (Sopot); SO2 = 3.9 µg/m3 (Tczew) and 3.6 µg/m3 (Sopot); CO = 225 µg/m3 (Tczew) and 247 µg/m3 (Sopot)) [41]. The growing intensity of photochemical reactions caused by UV in the sunny months, the utilization of petrol cars in summer, and the lack of the need to heat most of the buildings, could have resulted in low concentrations of gaseous pollutants at the receptor [42]. The concentrations of the considered gaseous pollutants were also below the limit values set out in European law [30].
It is important to study the relationship between the concentrations of the gaseous substances and PM10, but this was not the subject of this study. Moreover, it would be necessary to collect data from a longer period. Herein, the studies on gaseous pollutants, as well as the knowledge of the average meteorological parameters during the research period, served to assess the aero-sanitary air conditions during the research period. These were typical for the summer period in Poland, and taking into account the air quality in other regions of southern Poland during the summer, they can be assessed as having been even better [40,43,44,45].

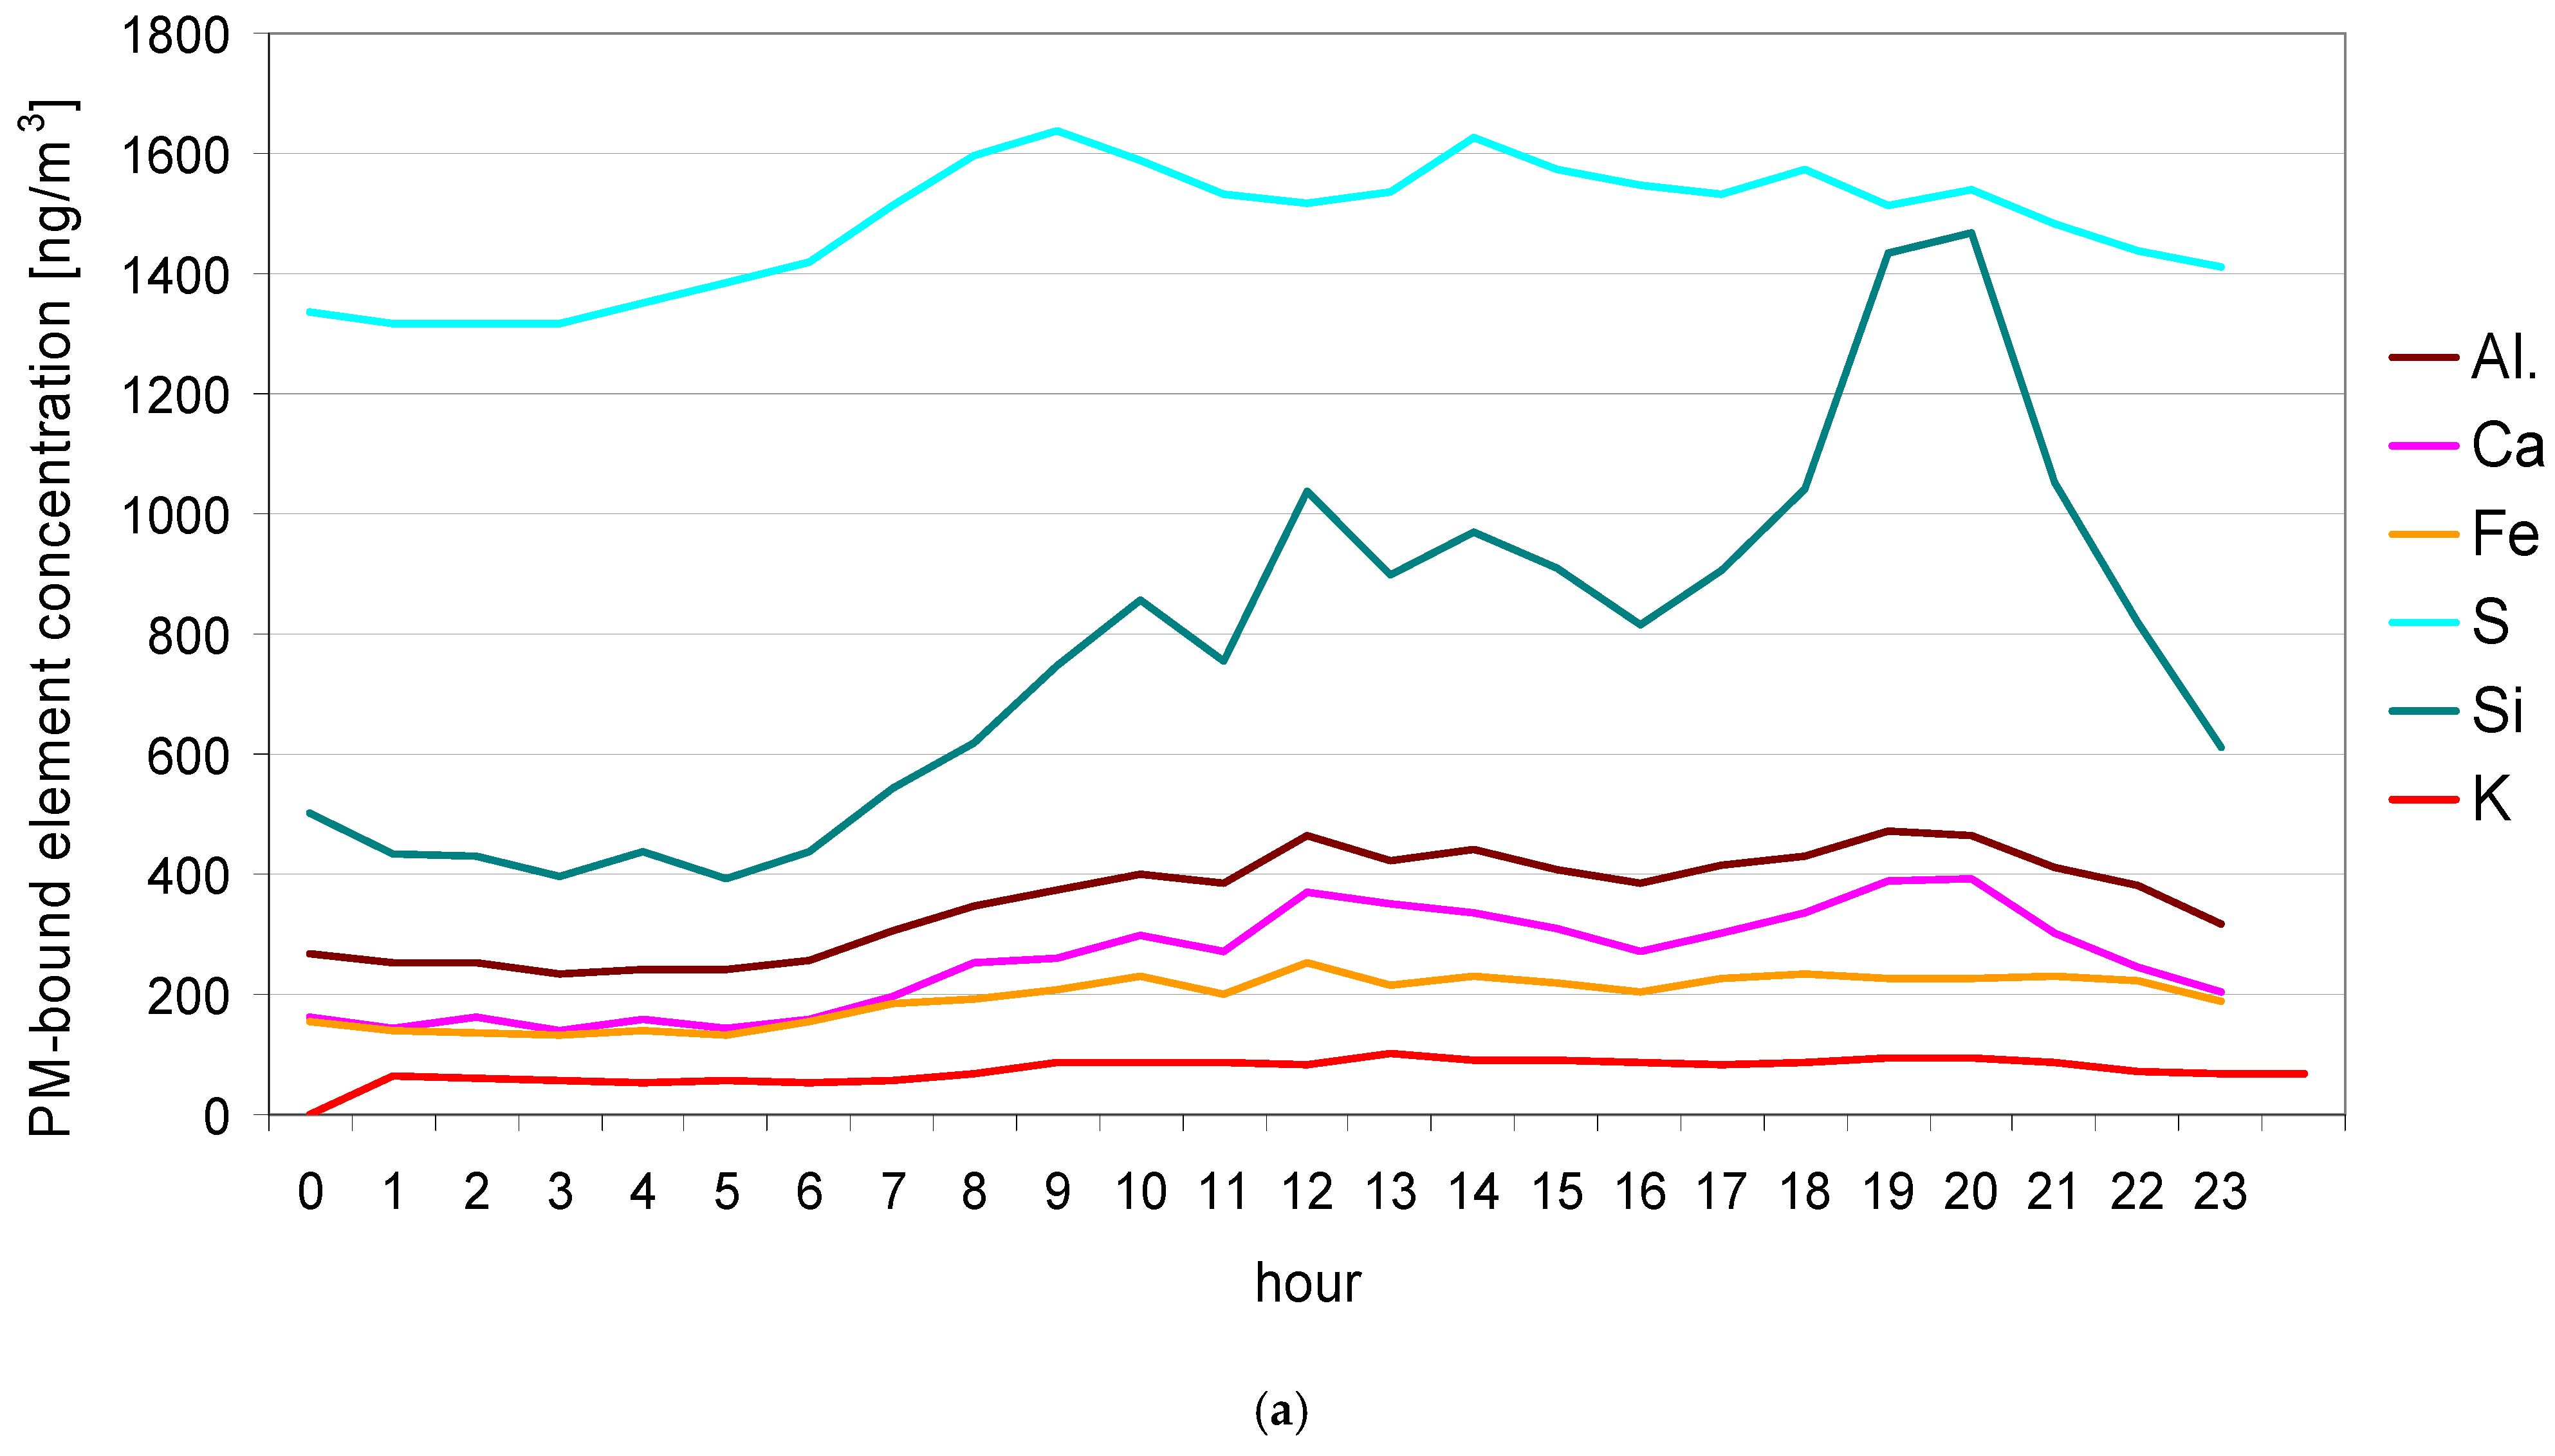
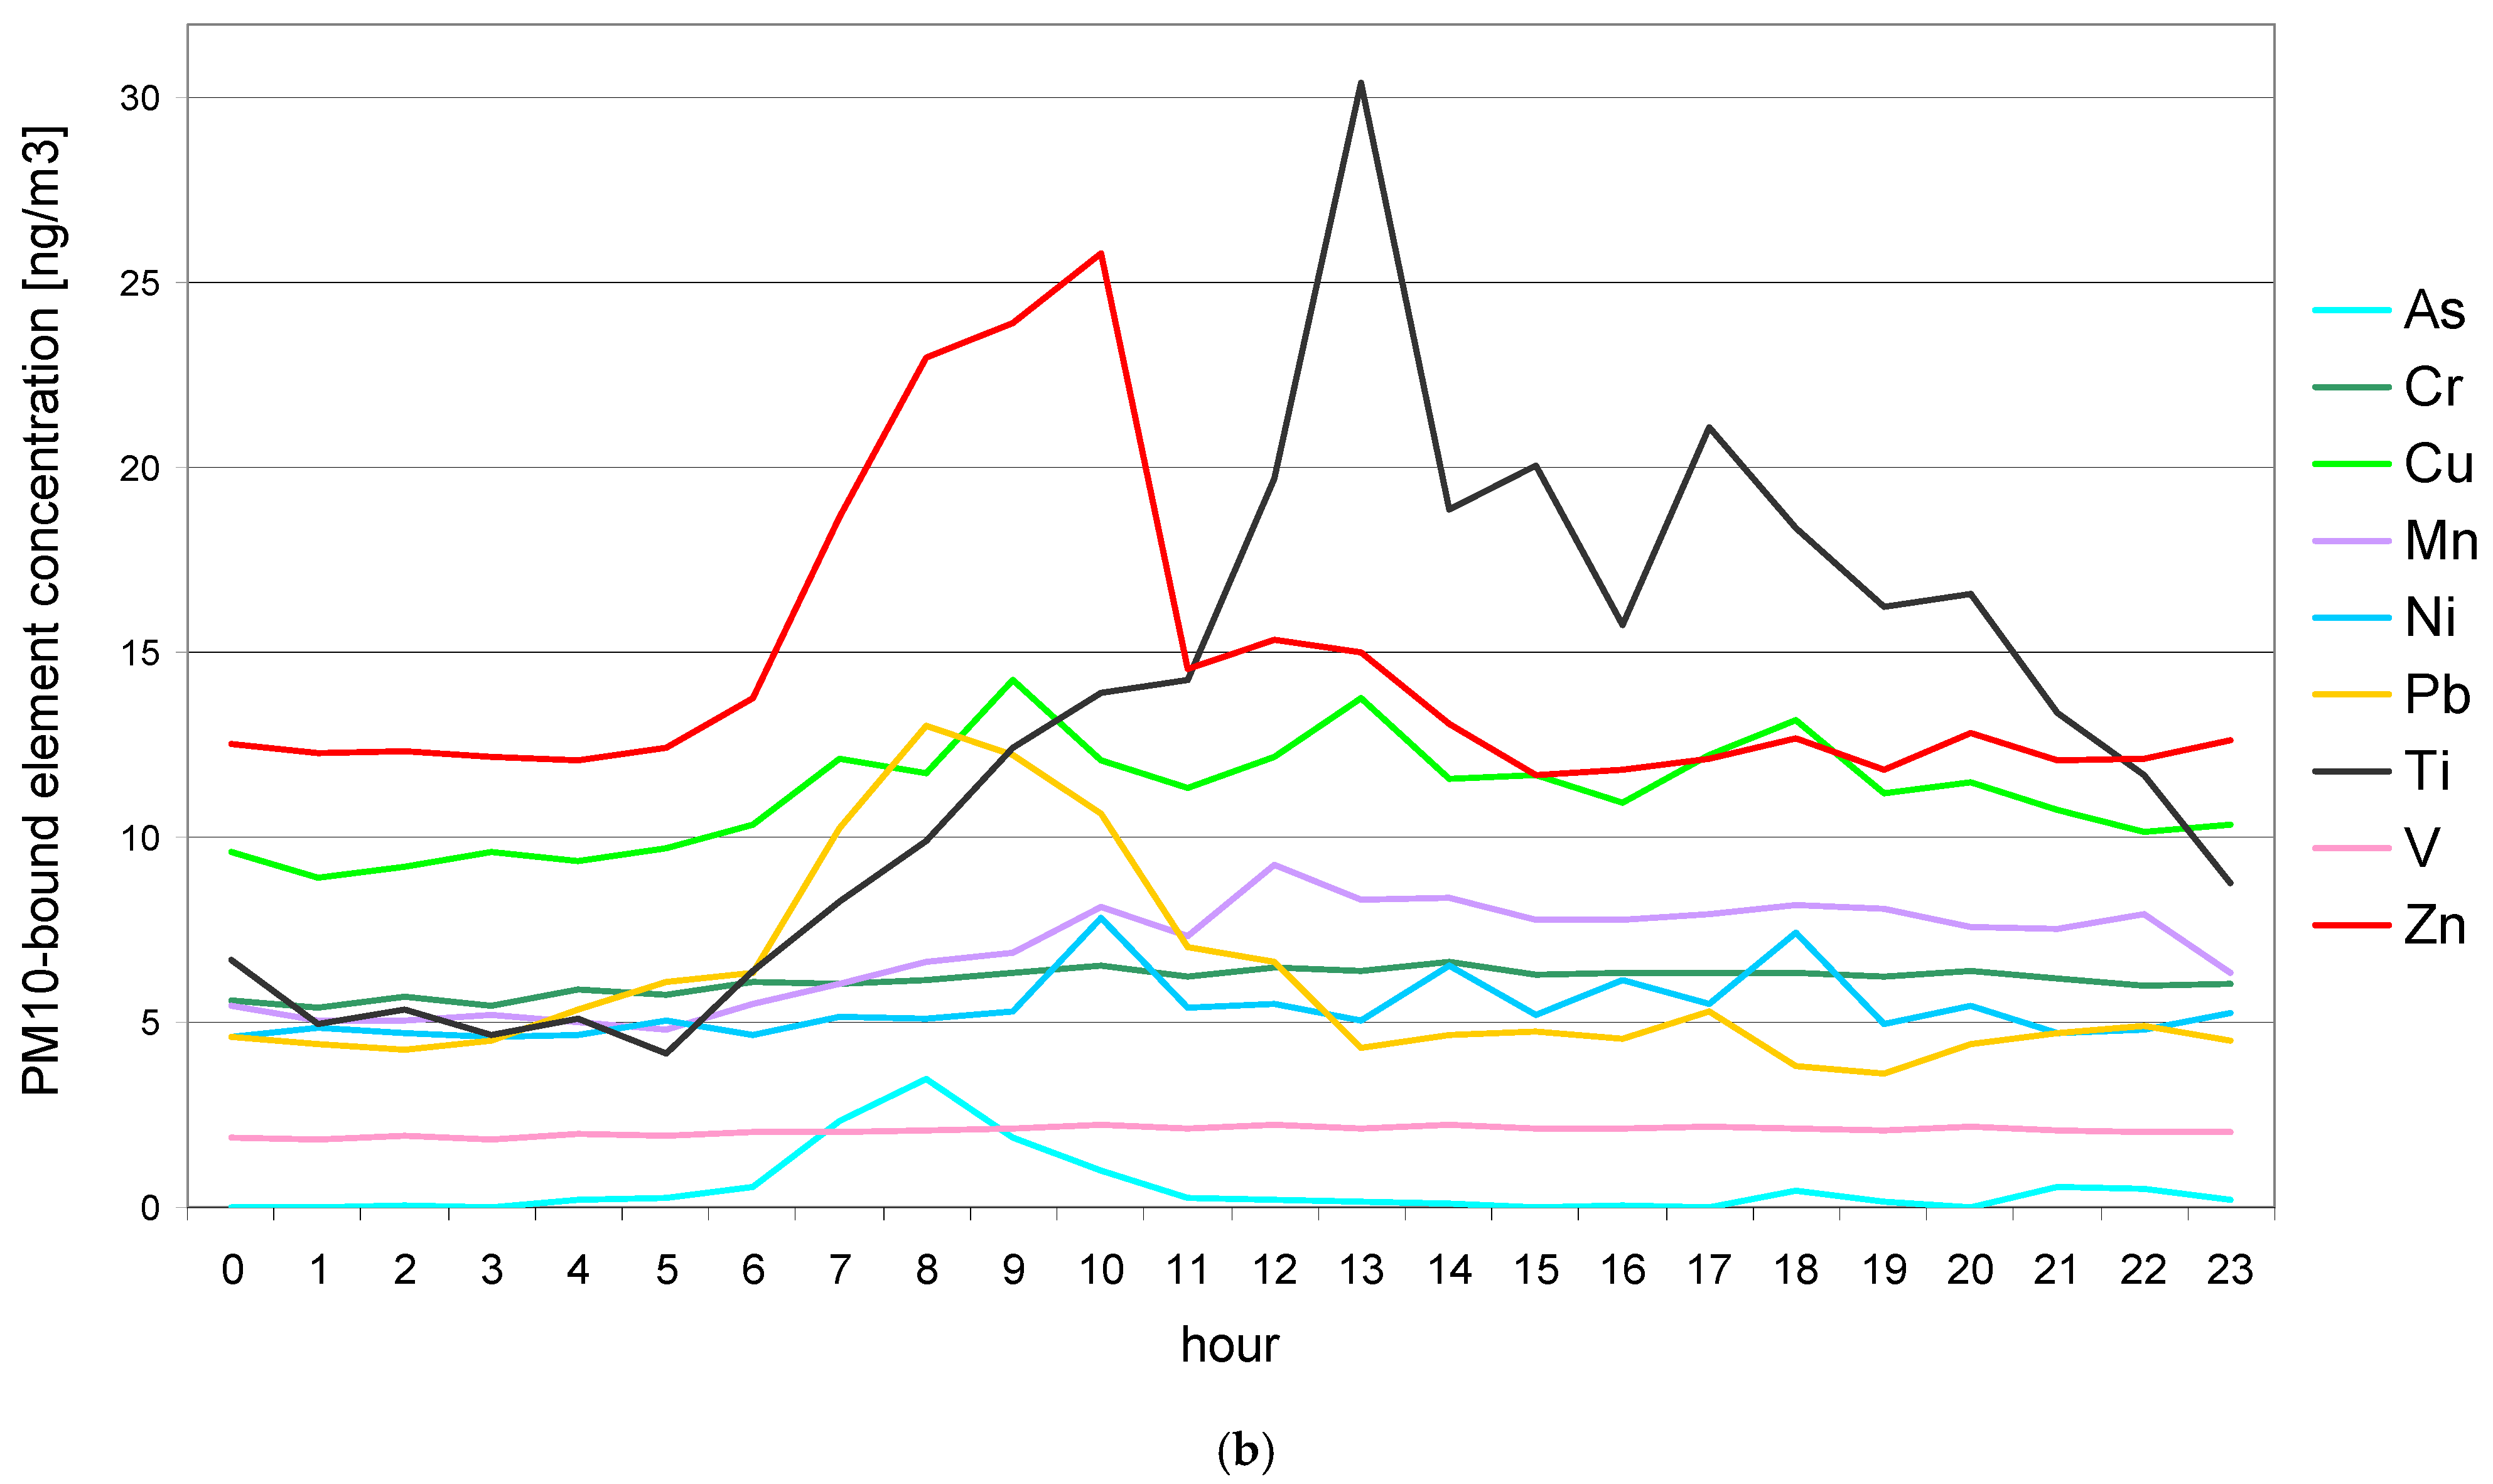
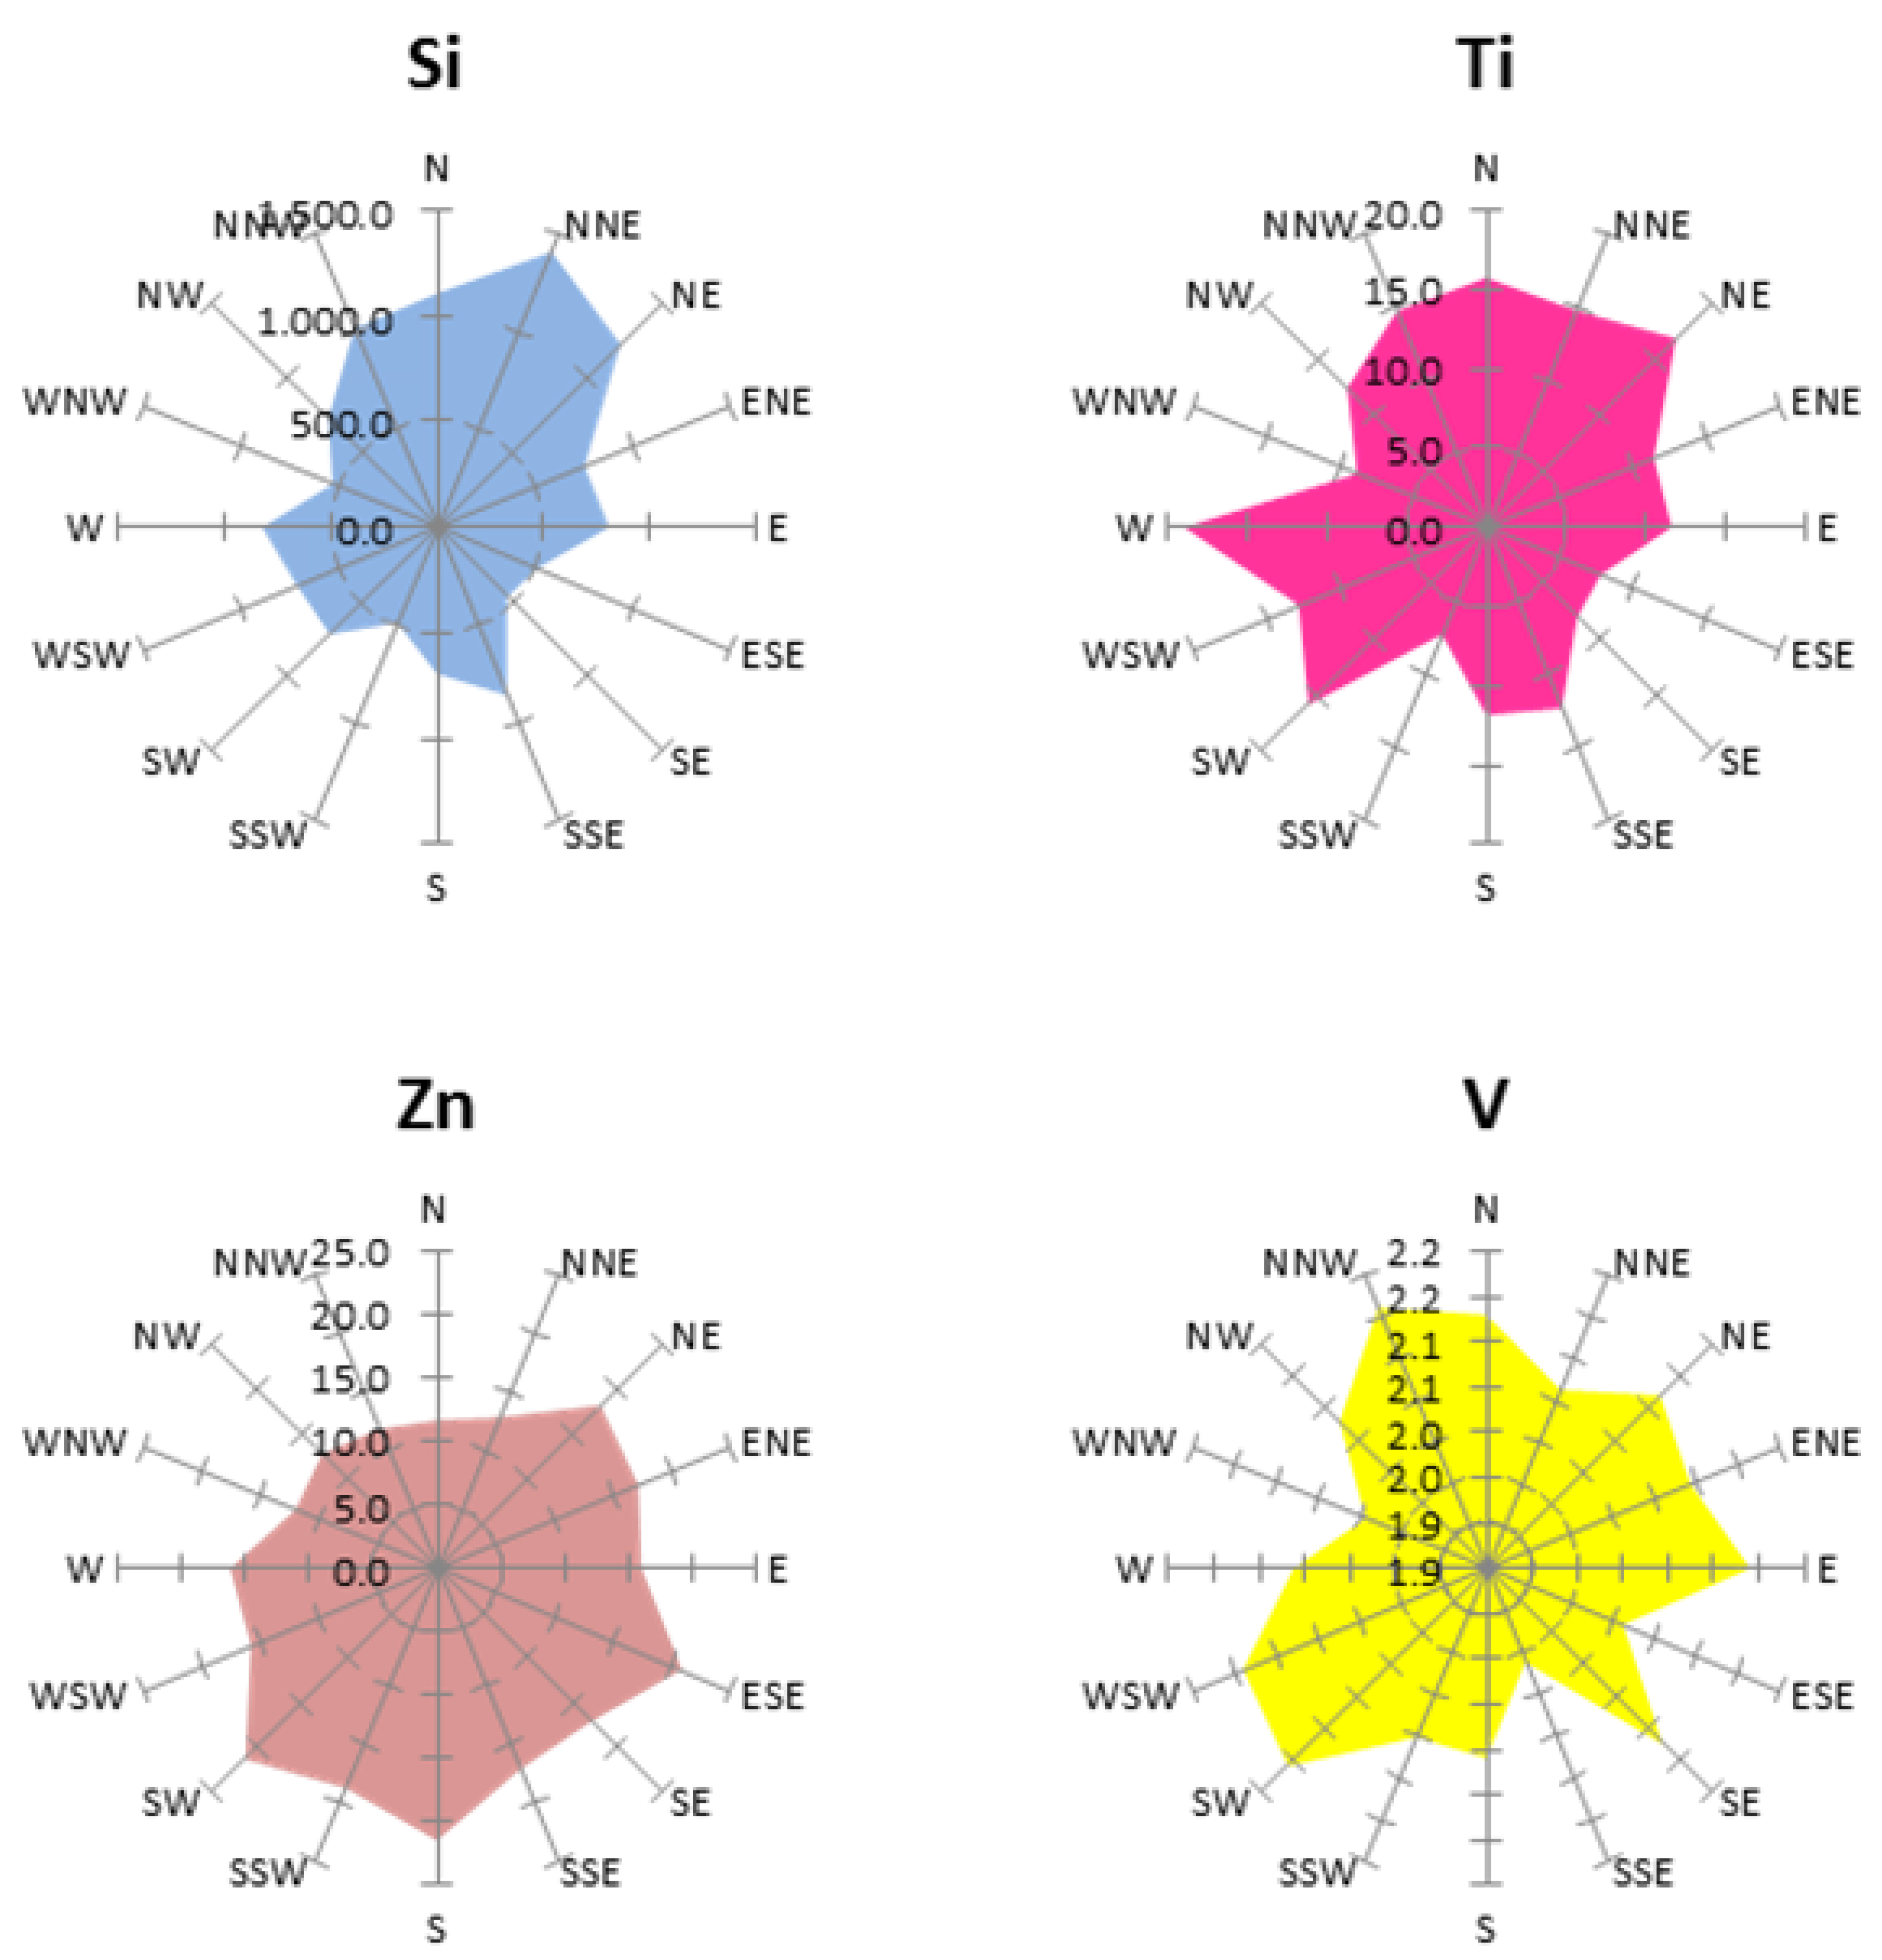
3.2. PM10-Bound Elements

The average concentrations of the selected PM10-bound elements fluctuated within wide limits, and took values ranging from 0.5 ng/m3 (As) to 1485.5 ng/m3 (S). The masses of 15 PM10-bound elements collectively accounted on average for 15% of the PM10 mass. S, Si, and Al were the most abundant among the determining elements. Their average mass percentages in the total PM10 mass were 7%, 4%, and 2%, respectively. On average, during the entire monthly measurement period, the elements related to the PM10 tested in the study could be arranged in the following order: As < V <Ni < Pb < Cr < Mn < Cu < Ti < Zn < K < Fe < Ca < Al < Si < S (Table 1). Most of these elements had fairly even concentrations, both daily and hourly (Table 1; Figure 3). Slight increases in the concentrations of most of the elements were observed between 12.00 p.m. and 02.00 p.m., and between 06.00 p.m. and 08.00 p.m. (Figure 3), except for Si, Zn, Ti, As, and Pb, for which the concentration jumps were higher compared to the other elements. For Zn and Ti, almost twofold increases in concentration were recorded during the hours of 06.00–10.00 a.m. and 11.00 a.m.–01.00 p.m., respectively; for Si the increase was recorded between 06.00 p.m. and 08.00 p.m., and for As and Pb at 08.00 a.m. In general, the trace elements, including the toxic ones—such as As, V, Ni, Pb, Cr, and Mn—were present in very low concentrations, not exceeding 10 ng/m3 (mean daily value); the average concentrations of As, Ni, and Pb in Kotórz Mały did not exceed the permissible values of annual concentrations recommended by the European Commission (6 ng/m3, 20 ng/m3, and 0.5 µg/m3, respectively) [30]. The concentrations of the majority of tested PM10-bound elements were much lower than those previously recorded in other regions of Poland (Table 2). The concentrations of PM10-bound Si, K, Al, Ti, Fe, Ca, and Mn were determined by natural sources. This is indicated by the EF values which, regardless of the time of day, did not exceed 10 for the whole period of study (Table 3). Si, K, Al, Ti, Fe, and Ca are typical crustal elements, therefore it can be assumed that they were derived from the resuspension of crustal and soil matter [22,24,25,46]. When analyzing the changes in EF values during the day, it should be noted that the EF values for Al, Fe, and Mn at 11.00 p.m.–08.00 a.m, and for Ti at 01.00 p.m, were higher than the EF values averaged over the entire measurement period. This may indicate the impact of an additional source of contamination in the considered hours. This will be explained in detail later in the manuscript using the PCA. The concentrations of the remaining PM10-bound elements—i.e., S, Cu, Pb, Ni, Zn, As, and Cr—were strongly influenced by anthropogenic sources (EFx > 10; Table 3). EF values for these elements changed during the day, with the highest values (higher than the average over the whole measurement period) recorded between 12.00 a.m and 11.00 a.m. This may indicate a strong impact of several anthropogenic sources during this time period, e.g., combustion of fuels by vehicles, abrasion of vehicle elements (wheels, brakes) and road surfaces, the influx of contaminated air masses from urbanized areas, and low-stack emissions [47,48,49,50]. An interesting case is that of V and As. The EFs for these elements indicate that at certain times of the day (V 07.00 p.m.–08.00 p.m.; As at 05.00 p.m.) their concentrations were strongly influenced by natural sources, and at others by anthropogenic sources. EFs greater than 10 for these elements in the rest of the day do not exclude the possibility that during these hours they also came from natural sources—e.g., soil resuspension—but that the impact of anthropogenic sources (such as road traffic or coal combustion) was more intensive [47,51,52].

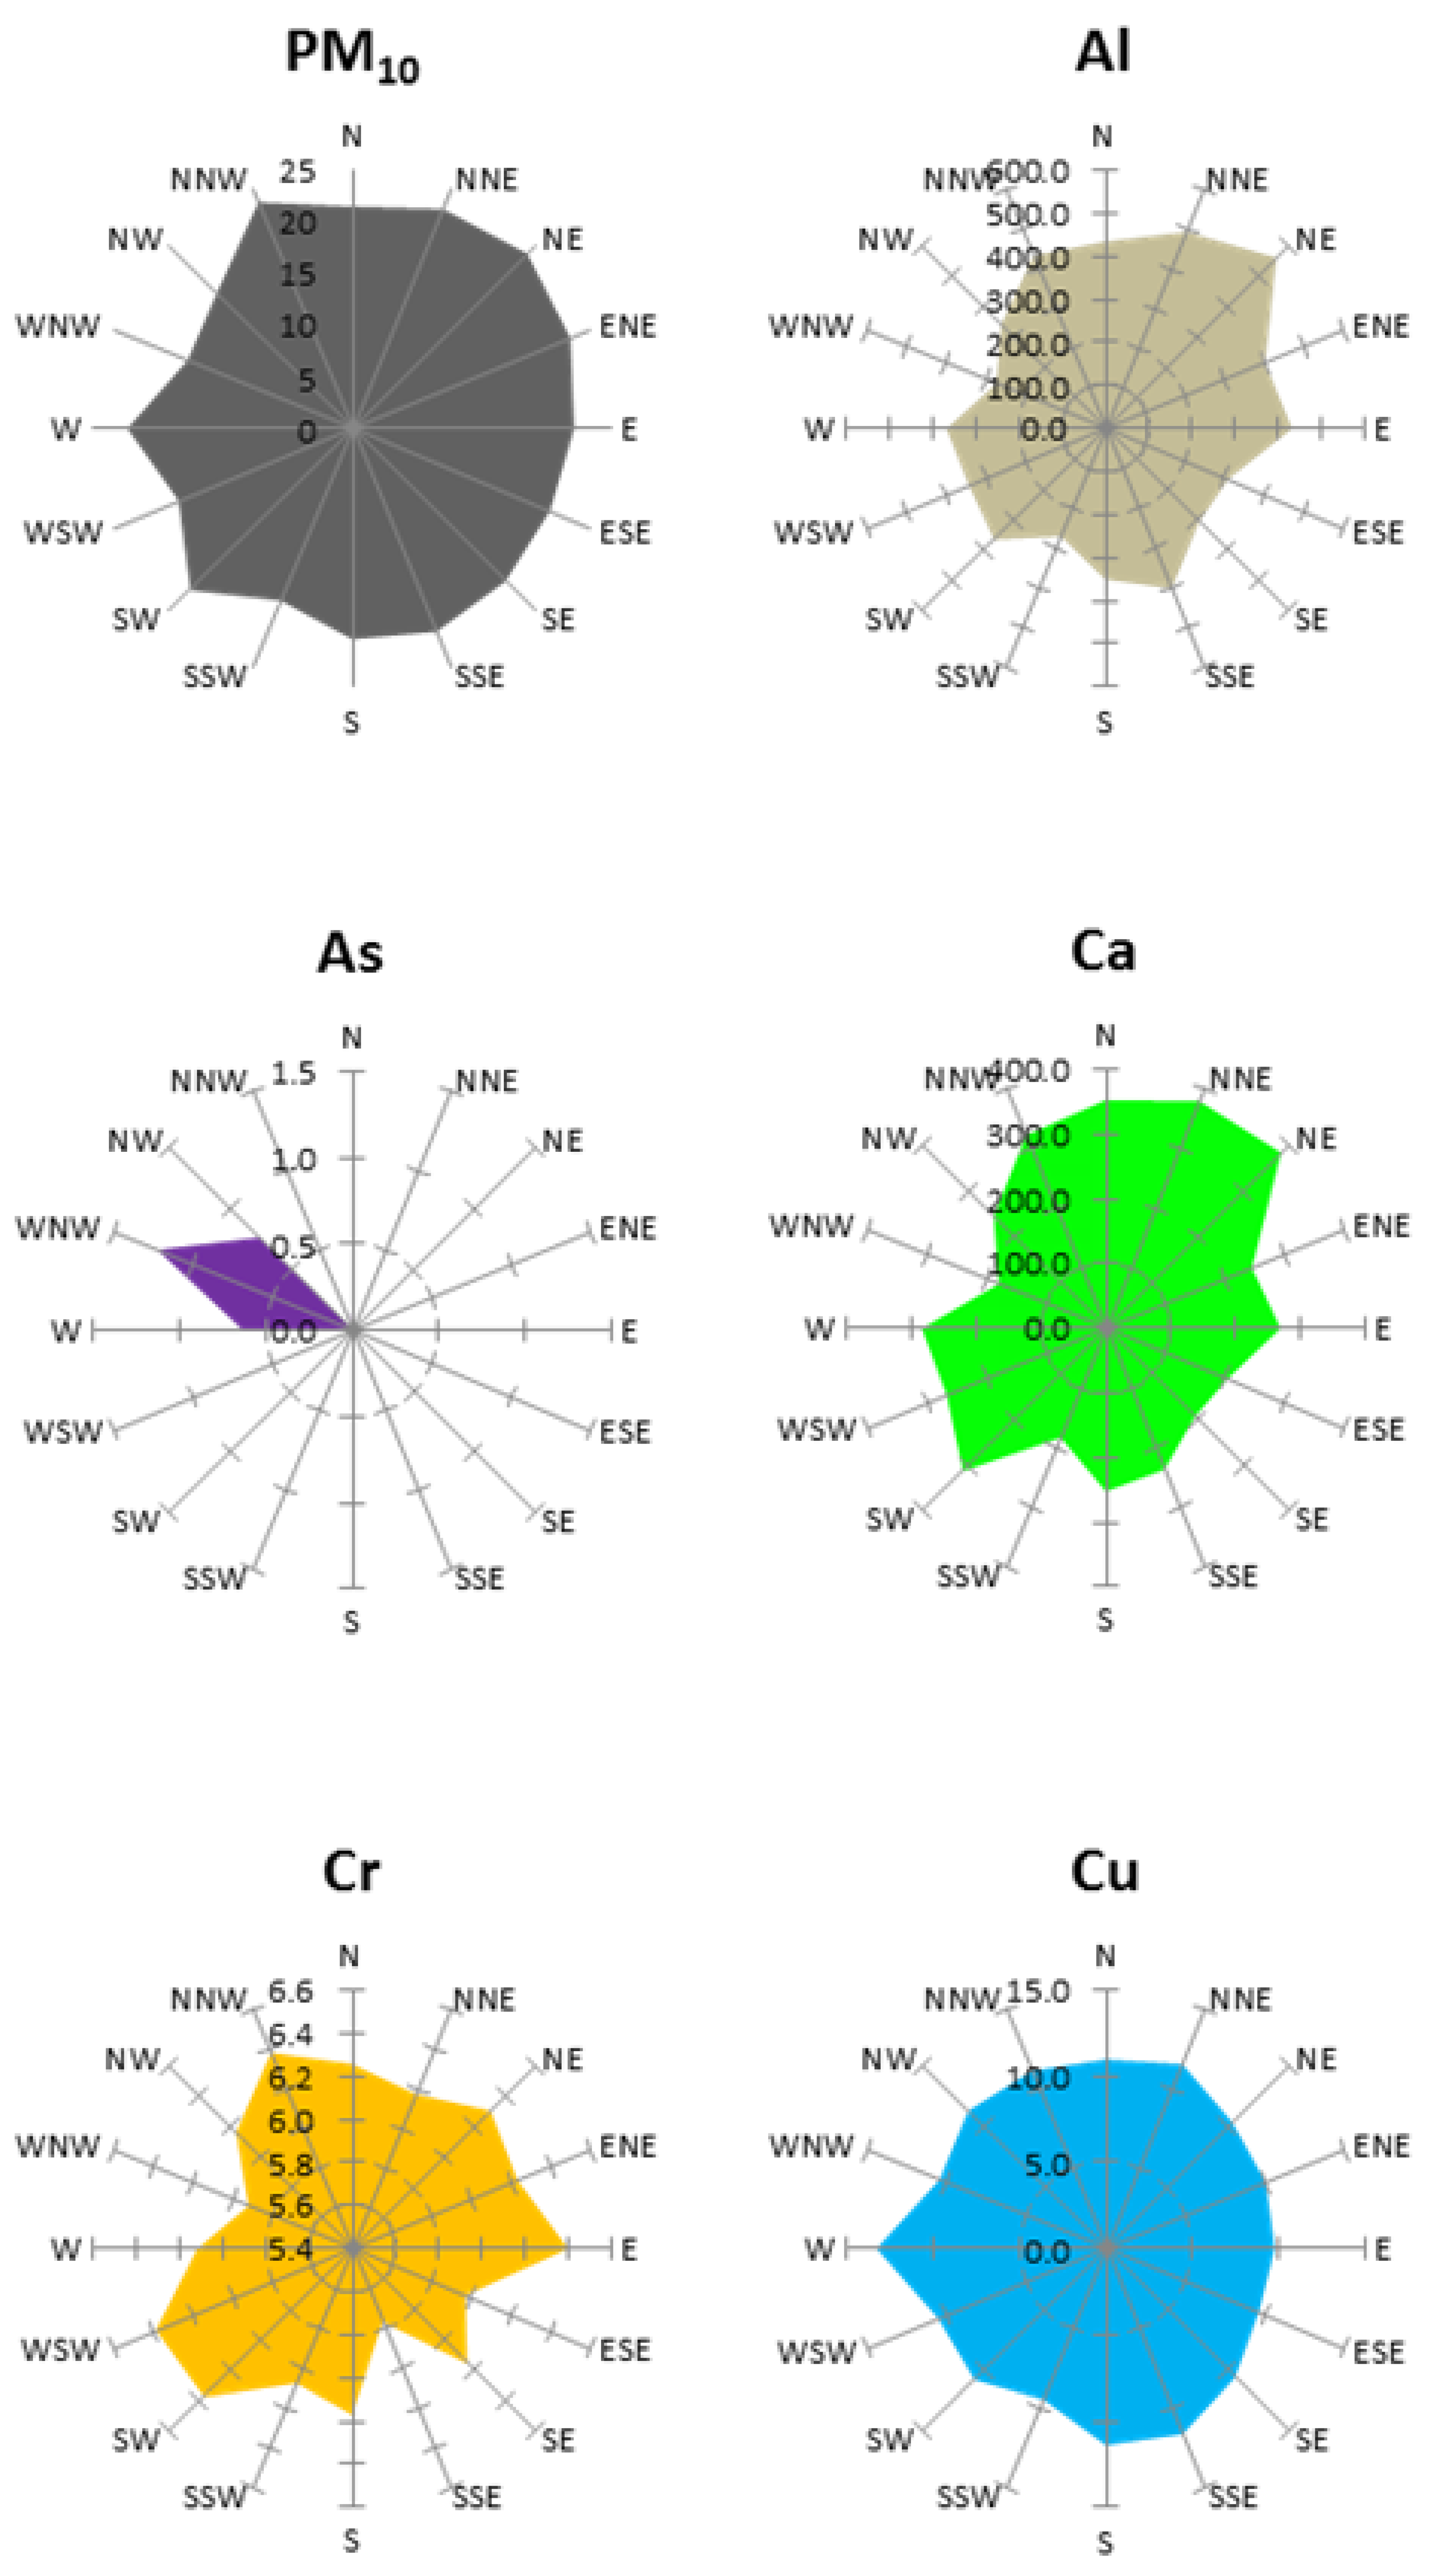
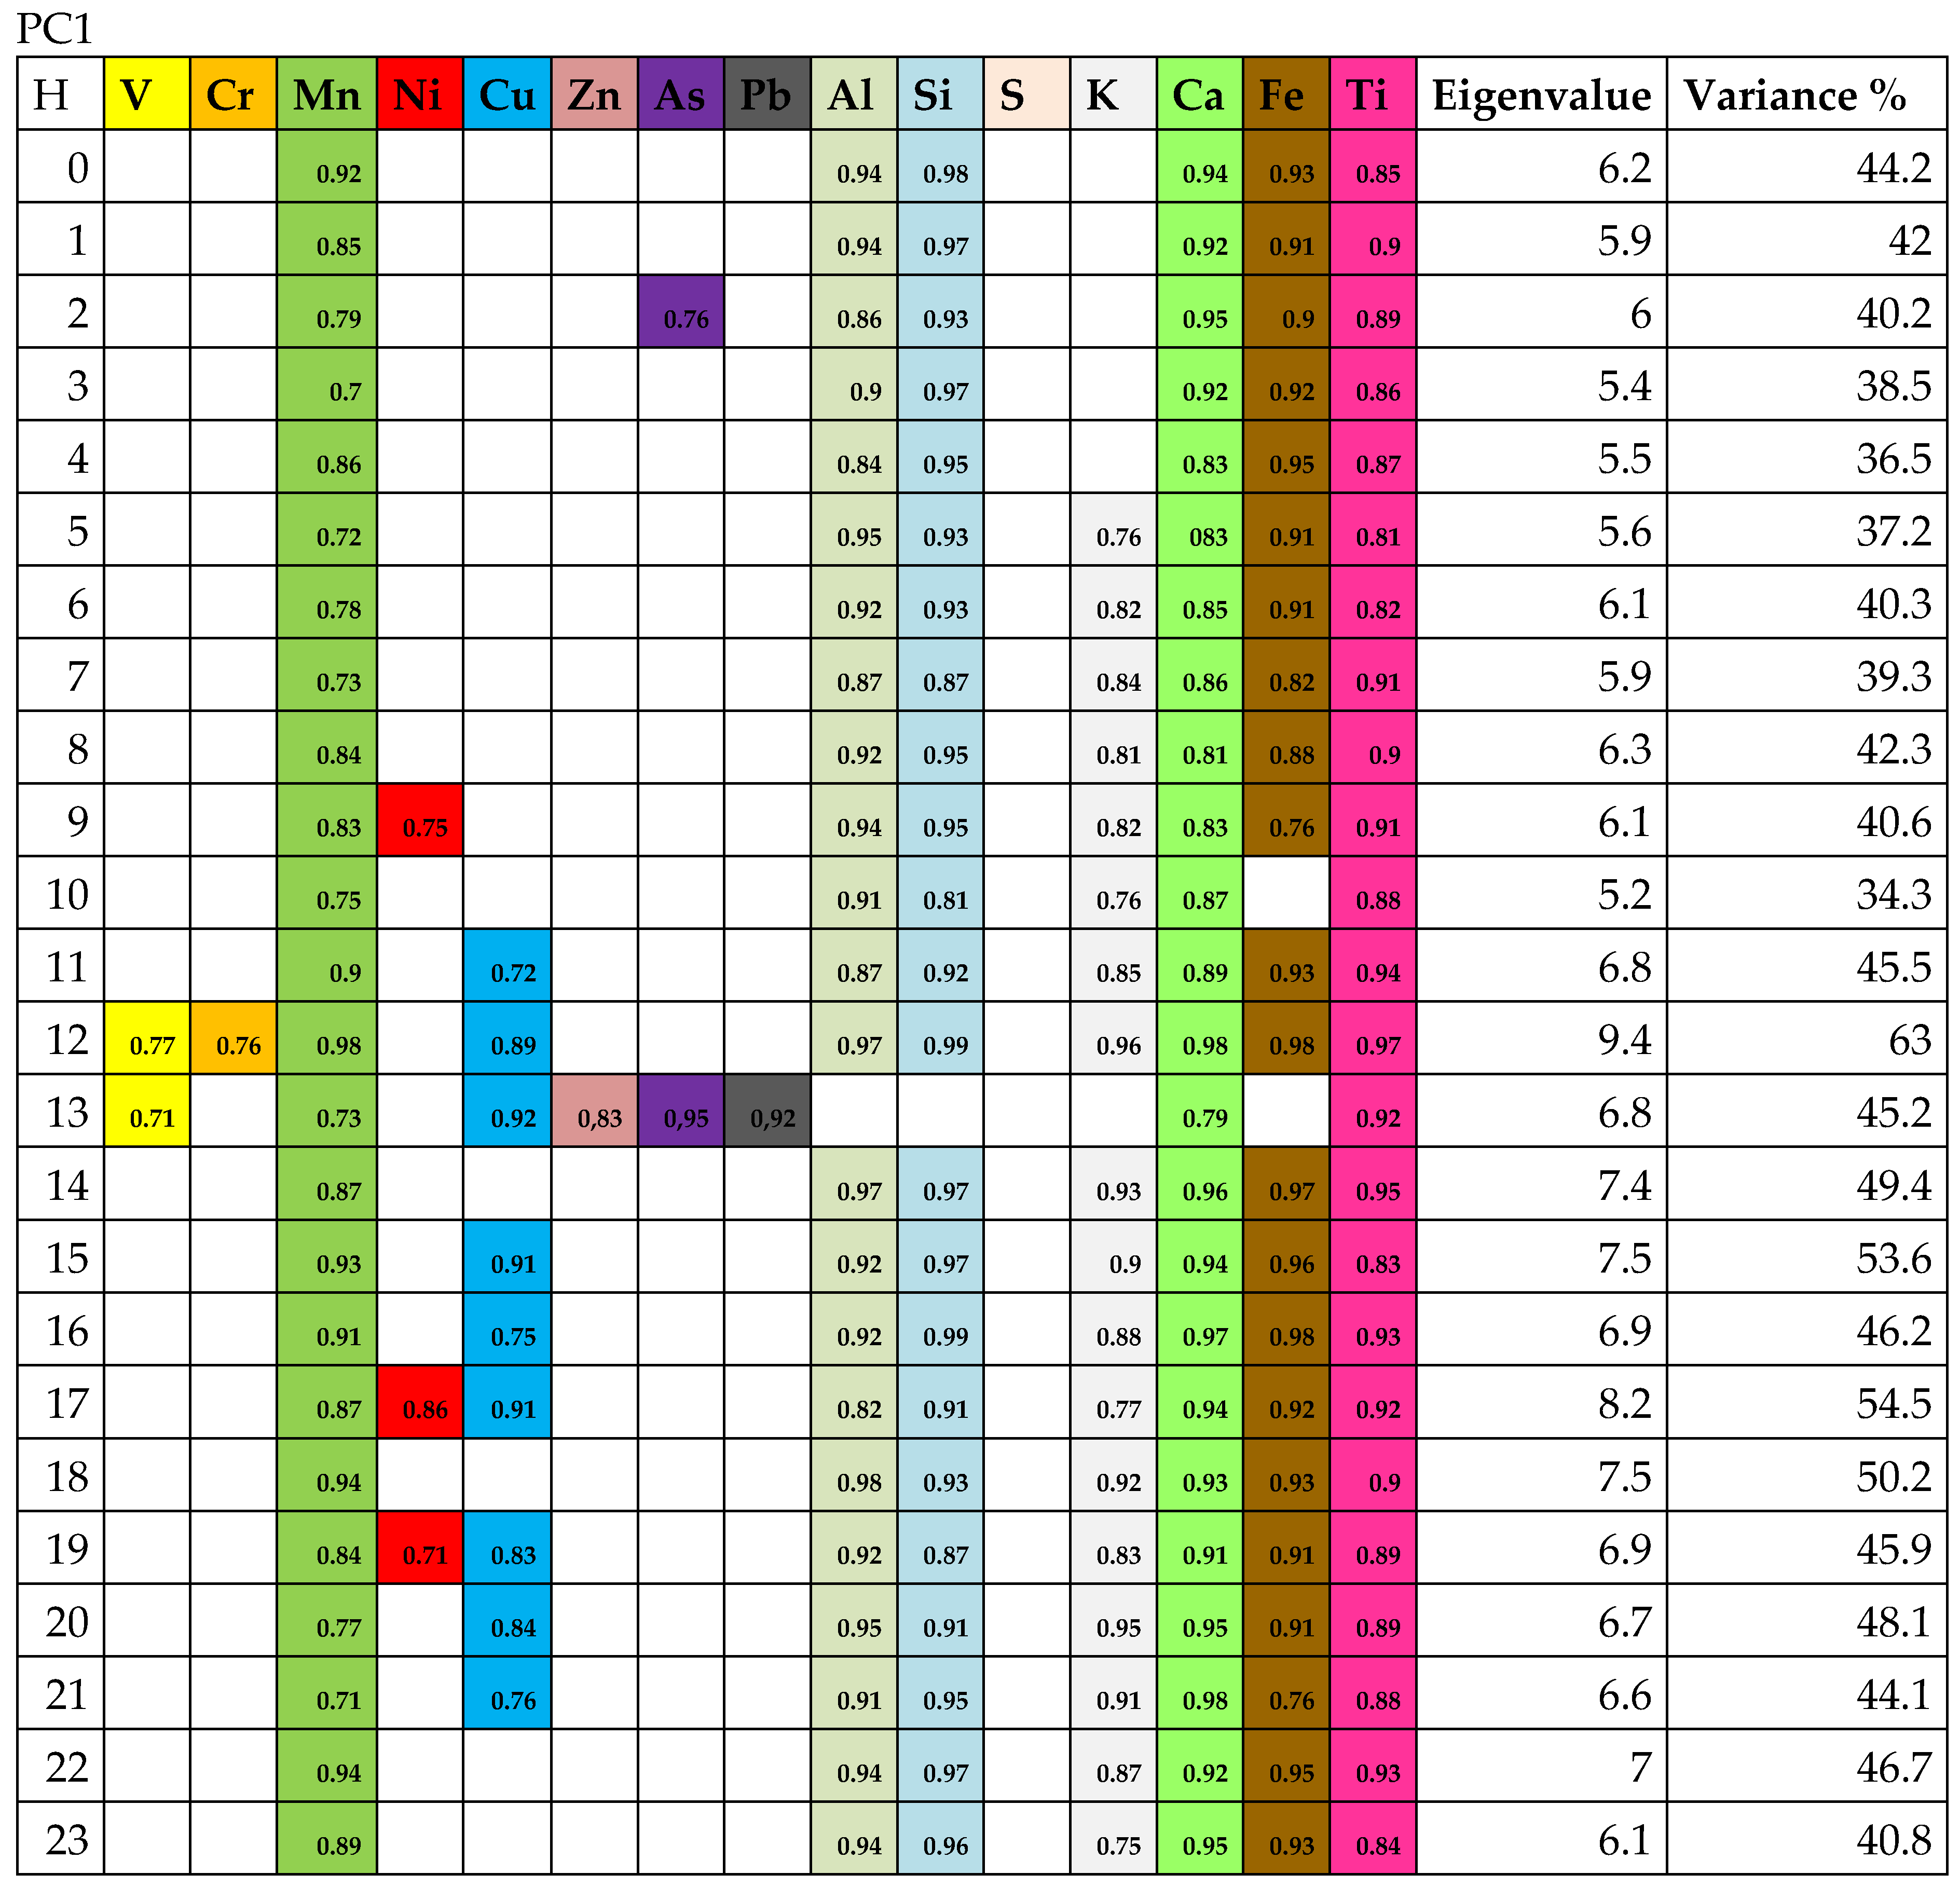
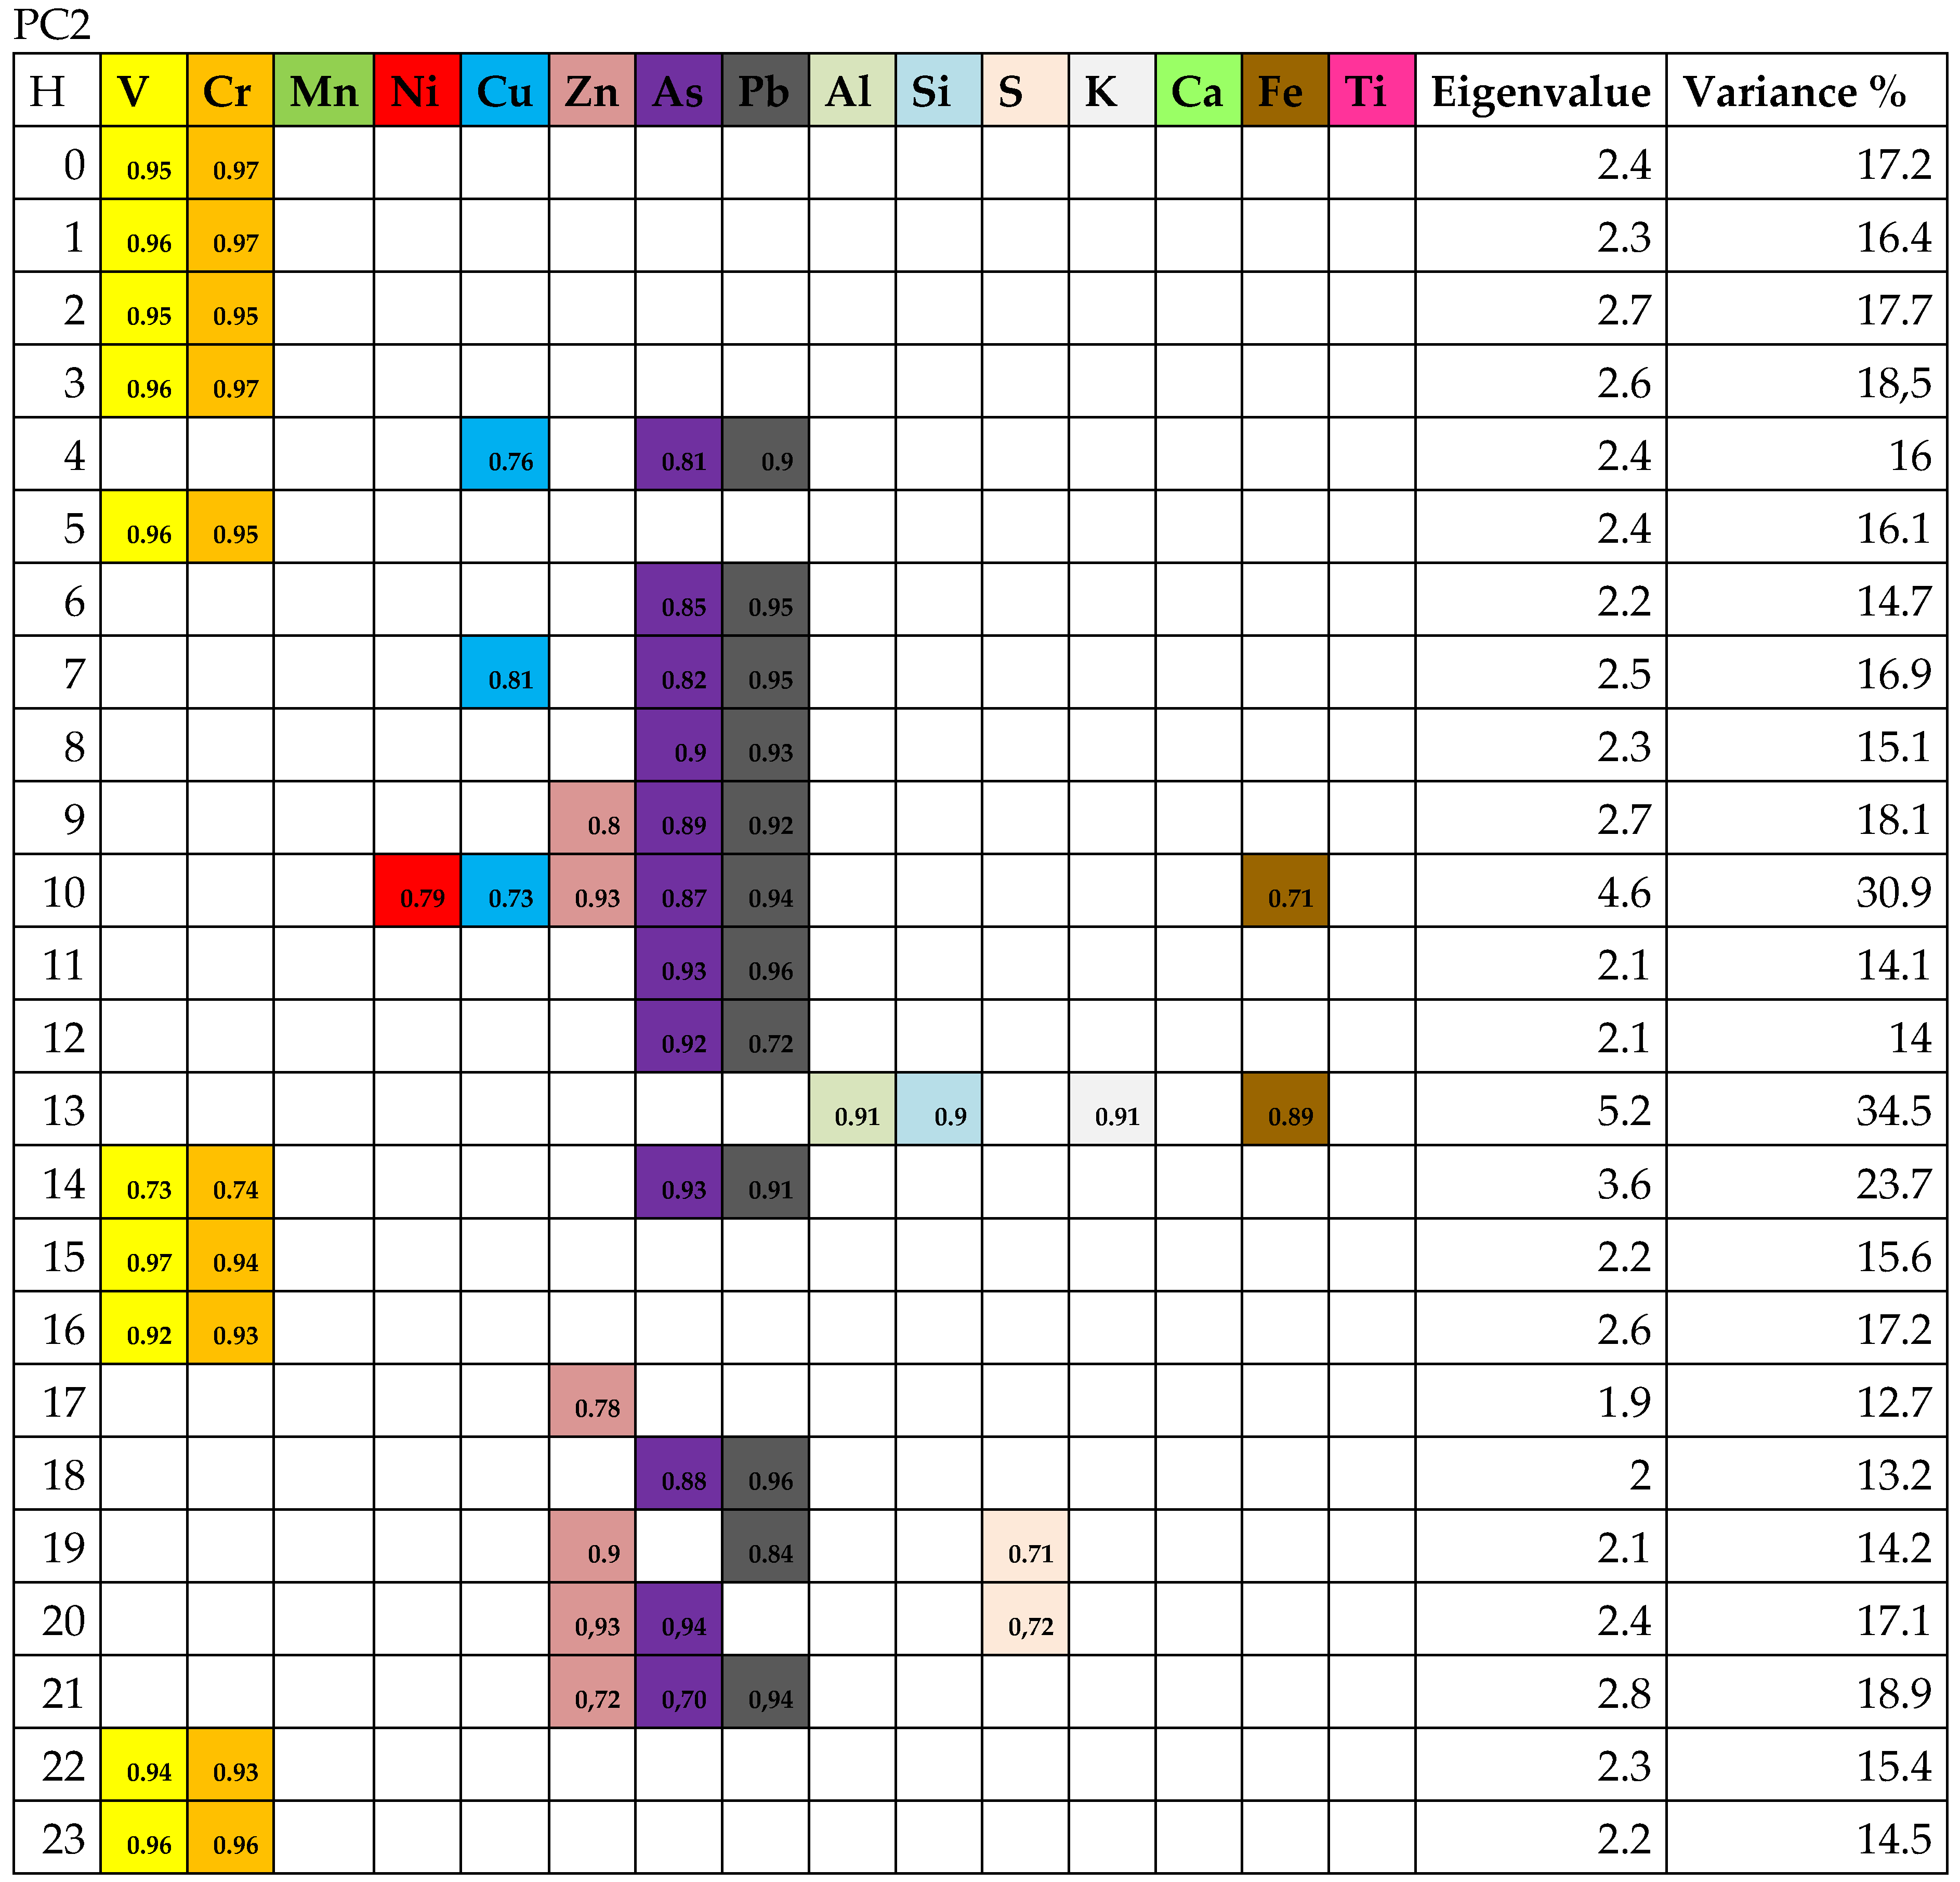
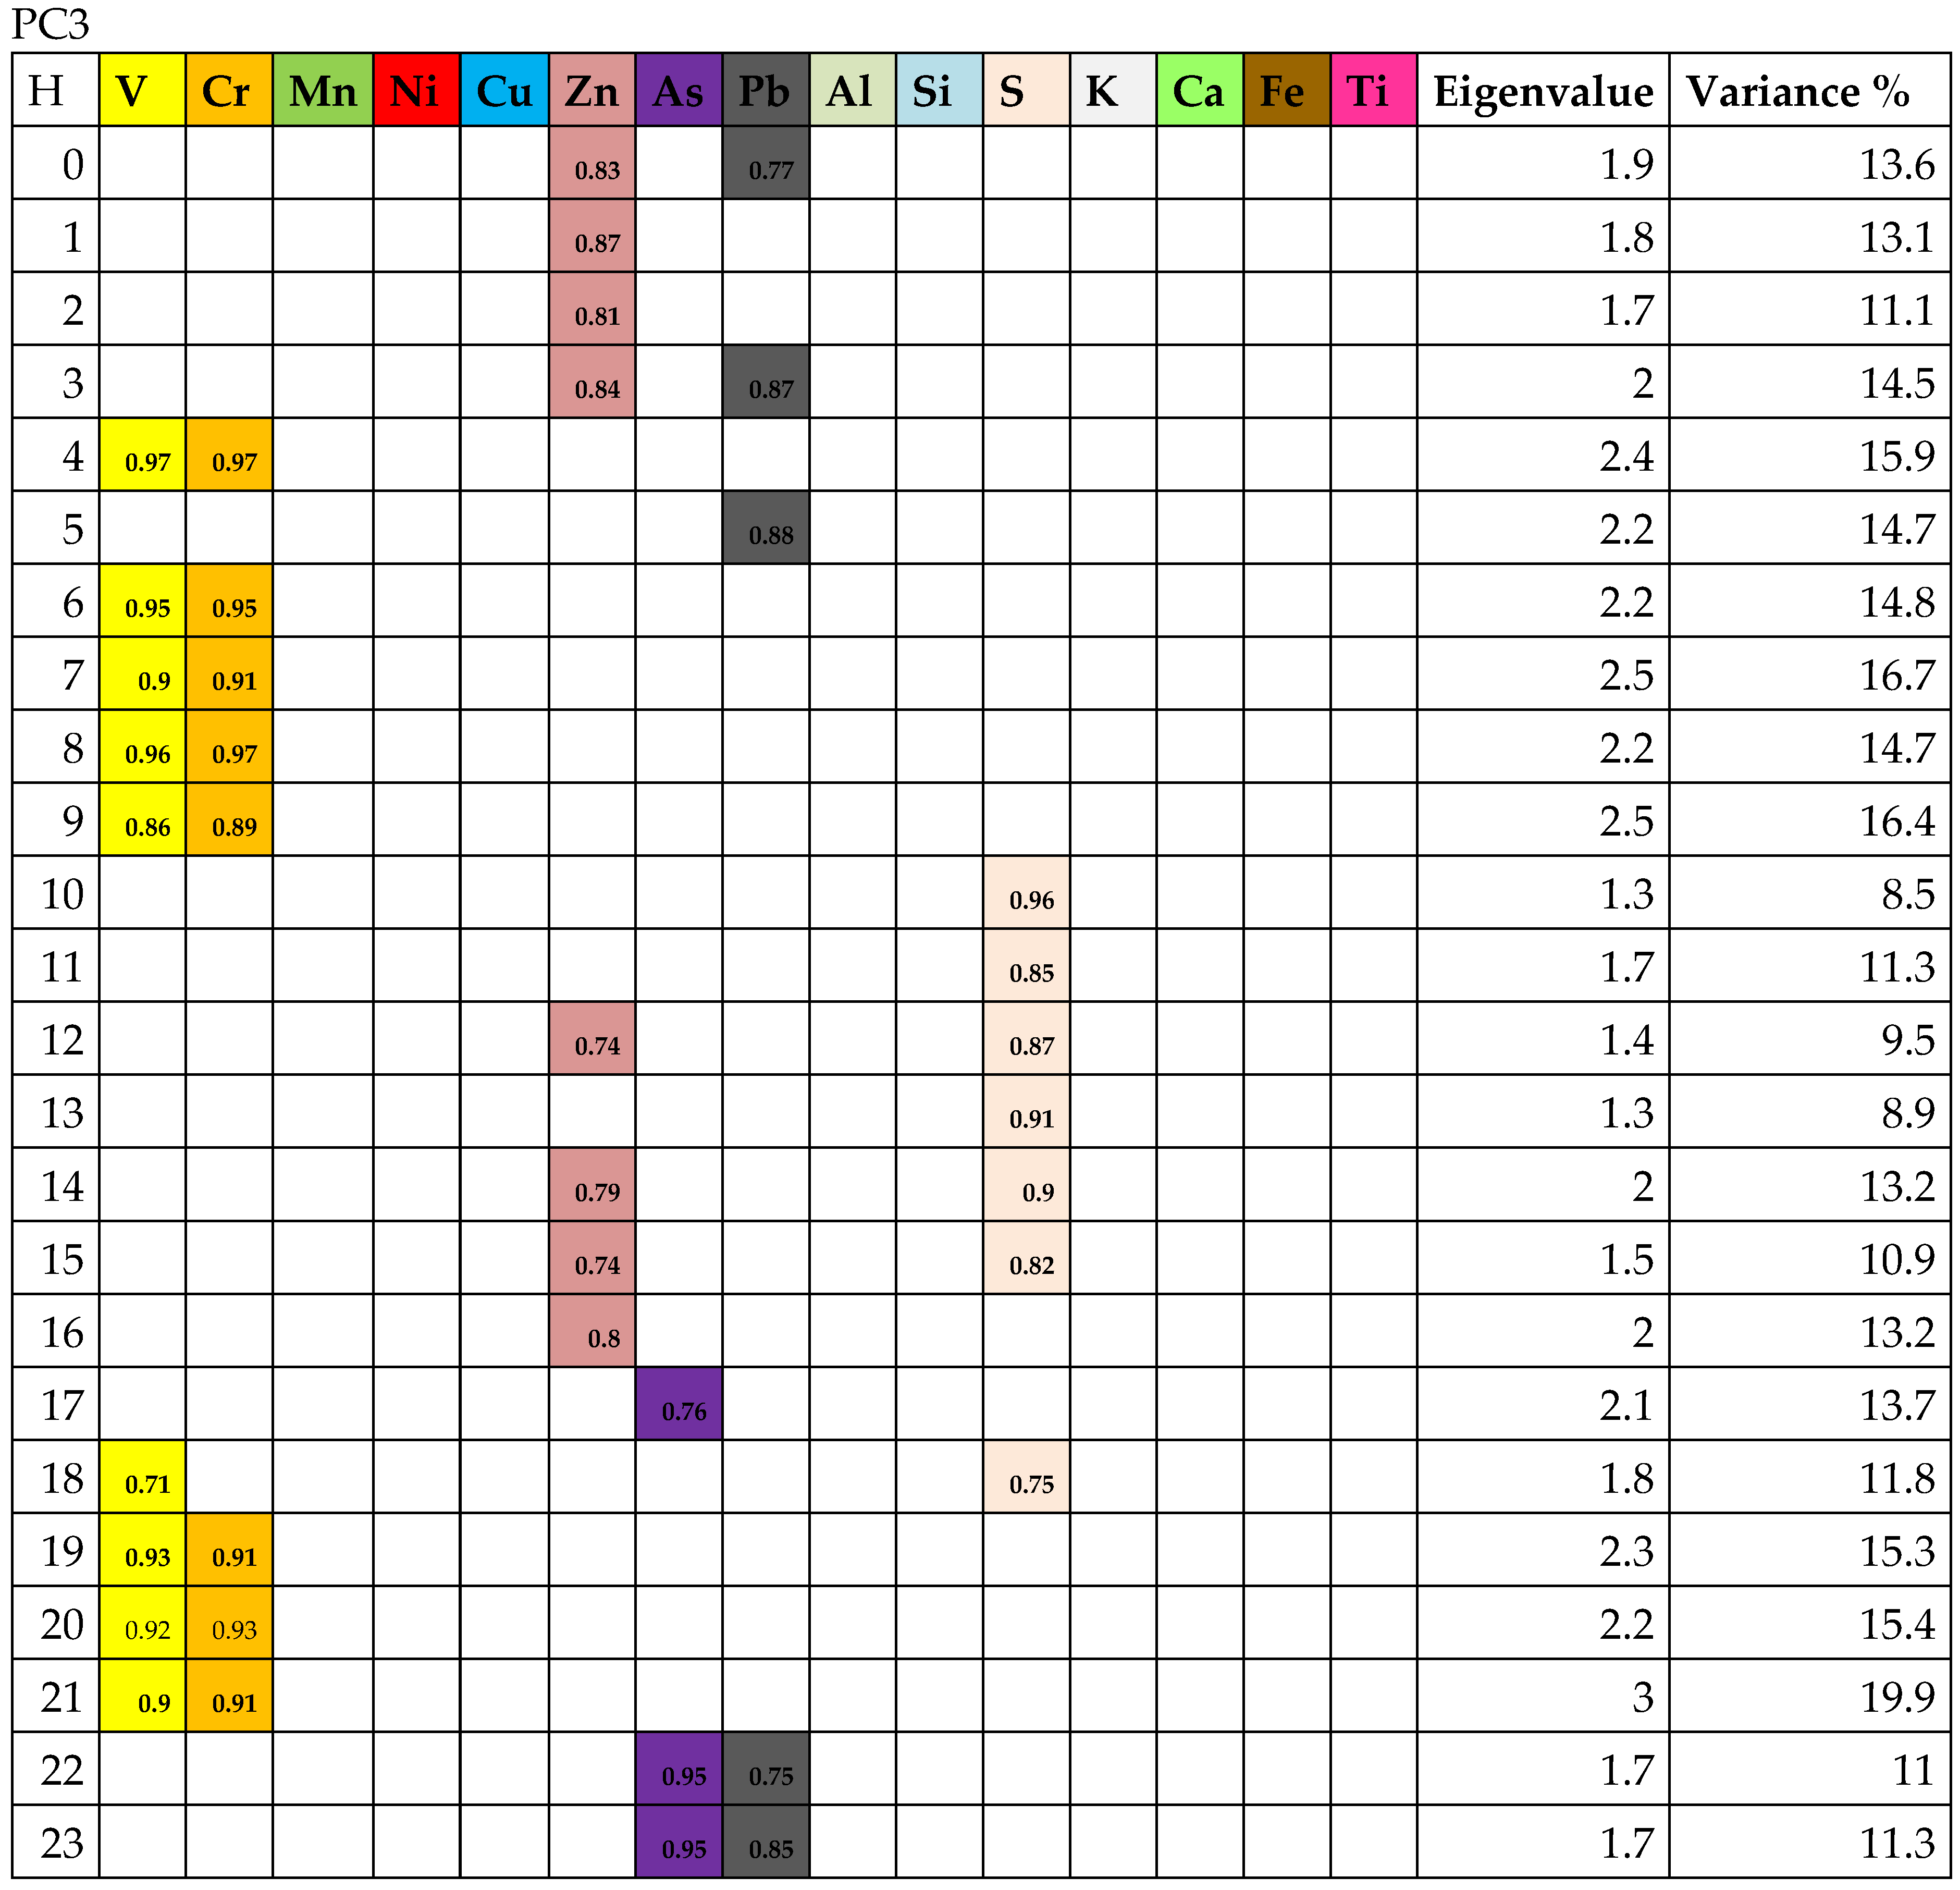
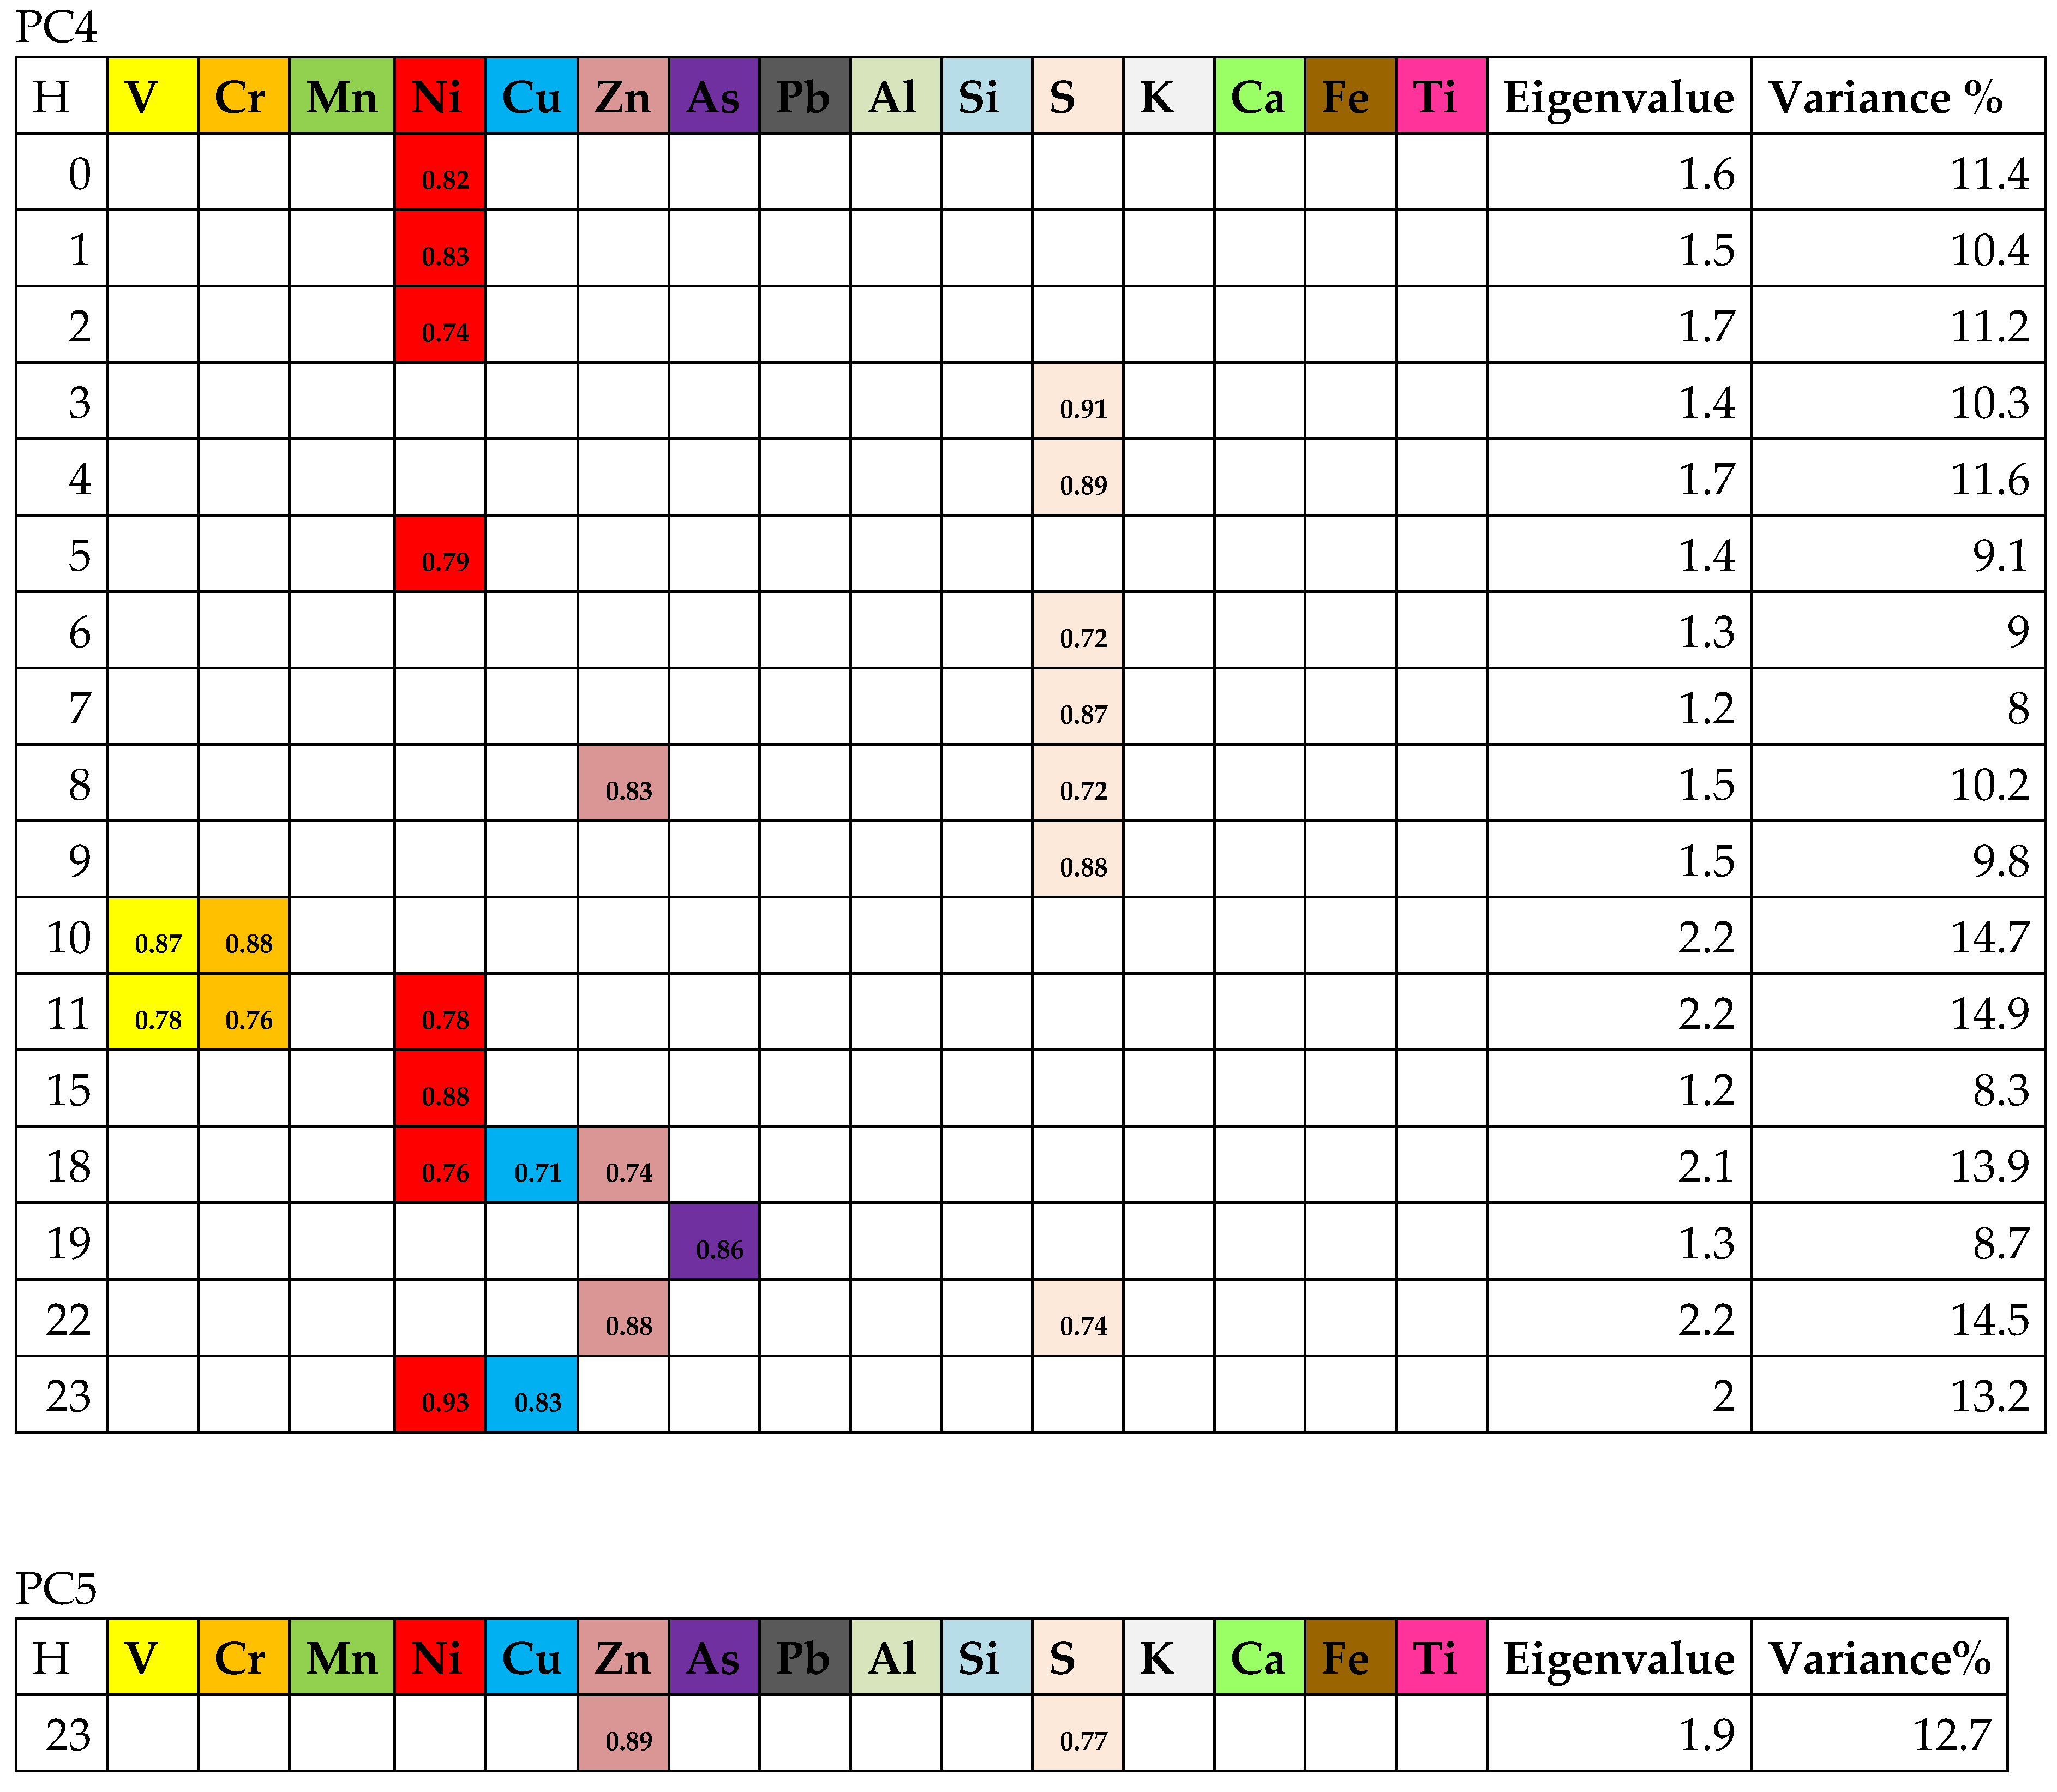
3.3. Source Apportionment of PM10

Principal component analysis (PCA) was employed in order to assess the correlations between different PM10-bound elements, and to identify the main sources of PM10 in Kotórz Mały. Fifteen variables (Al, As, Ca, Cr, Cu, Fe, K, Mn, Ni, Pb, S, Si, Ti, V, and Zn) were included in this analysis. This analysis was divided into individual hours of the day due to the different hourly trends observed in these constituents (Figure 5).
As a result of the PCA, five principal components (PC1–PC5) were identified with eigenvalues higher than 1.0 (according to the Kaiser criterion). Together they explain on average 97.4% of the cumulative variance in the dataset (Figure 5). The most important is the first principal component, which explains on average 42.7% of the variability; the second component explains 17.6% of the variability; the third 13.3%; the fourth 12.7%; and the fifth 11.1%. It should be noted that the above variances are not the same as the percentage source contributions to the PM10 concentrations at the sampling site. An additional analysis—i.e., principal component analysis (PCA), combined with multi-linear regression analysis (MLRA)—should be performed in order to determine the above contributions. In the case under study, the application of these analyses was difficult, because at certain times of the day the concentrations of PM10 were simultaneously influenced by several sources. However, to make the interpretation of the PCA results easier, the enrichment factors (EFs) for the PM10-bound elements (Table 3), the division of the studied element concentrations according to wind direction (Figure 4), and conclusions drawn by the authors of previous studies [24,29,58] were all taken into account.
Fourteen elements—i.e., V, Cr, Mn, Ni, Cu, Zn, As, Pb, Al, Si, K, Ca, Fe, and Ti—were strongly correlated (factor loadings ≥ 0.7) with PC1. The vast majority of these elements (Al, Ca, K, Mn, Fe, Si, and Ti) were of natural origin (EFs < 10, Table 3), and their highest concentrations were observed when there was an inflow of air masses from the north–northeast and the northeast (Figure 4). Crops, forest, and a lake are located in these directions at distances of 0.2 km, 1.3 km, and 2.9 km, respectively. The above premises and the conclusions of other researchers [19,38,59,60,61] indicate that the Al, Ca, K, Mn, Fe, Si, and Ti came from the resuspension of soil and the mechanical abrasion processes of crustal materials. Moreover, following the work of Gustafsson et al. [62] and Li et al. [63], it can be concluded that Al, Si, and K could also have been derived from the abrasion of the pavement. Research [22,64,65,66,67] shows that the remaining elements correlated with PC1—i.e., V, Cr, Ni, Cu, Zn, As, and Pb—were likely traffic-related pollutants deposited in soils, whose particles have been entrained by wind or field work. Therefore, it can be assumed that the PM10 identified in PC1 came from mineral matter. As shown by the hourly correlations of these elements with PC1, this source affected PM10 concentrations in the receptor throughout the day, with the more intensive interactions occurring at 12.00 a.m., 03.00 p.m., and 05.00 p.m.–06.00 p.m.
Elements such as V, Cr, Ni, Cu, Zn, As, Pb, Al, Si, S, K, and Fe were strongly correlated with PC2. The concentrations of Cr and V during the day were at a relatively constant level (Figure 3), and their slight increases were observed with the inflow of air from the north–northwest, southwest, west–southwest, and east (Figure 4). The highest mean concentrations of Pb were observed when there was an inflow of air masses from the southeast, south, southwest, and south–southeast; Zn from the southwest, south, and east–southeast; As from the west–northwest; Cu from the west; and Ni from the east–southeast (Figure 4). Within 3 km to the north–northwest, southwest, and west–southwest is National Road No. 45, and within 6 km to the south, south–southeast, and southeast is National Road No. 46; the Opole agglomeration is located to the southwest and west–southwest (10 km to the northern border of the city, 15 km to the center). Taking into account that the group of Pb, Cu, Zn, Cr, and Ni is mostly representative of vehicle exhausts and road dust [46,68,69,70], Cu and Zn are characteristic markers of brake lining wear, and Zn of tire wear [19,71], and that zinc compounds are also used as antioxidants and detergents to improve the quality of automotive grease, it can be assumed that the PM10 identified in PC2 originates from traffic emissions. This source had the most intense influence on the concentrations of PM10 at the receptor at 12.00 a.m., 03.00 p.m., and 05.00 p.m.–06.00 p.m. These are the times of the day when traffic is usually the heaviest, due to the movement of city inhabitants to work, schools, kindergartens, etc. During these hours, PC2 explains most—approx. 30%—of the variance in PM10 emissions.
Six elements were strongly correlated with PC3, i.e., S, V, Cr, Zn, As, and Pb (Figure 5). S is a characteristic PM component in areas where coal and fine coal are used for energy purposes [25,63]. It is also a characteristic element released during biomass, waste, and garbage burning in small-scale installations, i.e., domestic stoves and local boiler houses [25,72,73]. Moreover, the source of S may be secondary inorganic aerosols (sulphates), also released from the above-mentioned sources [74]. Zn and Pb associated with coarse dust, apart from traffic emissions, may come from biomass burning [25,60]. According to the research described in [64,75], another source of Cr and V is fossil fuel and fuel oil combustion. The highest concentrations of S were recorded between 10.00 a.m. and 06.00 p.m., with air inflow from the northeast and north–northeast (Figure 4). Zn and Pb concentrations between 10.00 p.m. and 03.00 a.m.—i.e., in the hours when these elements showed a strong correlation with PC3—also corresponded to the inflow of air masses from the northeast (Figure 4), where the neighboring village Turawa (about 1000 inhibitants) is located approximately 2.5 km from the receptor. Furthermore, the village of Kotórz Mały is divided into two zones: northern and southern. The northern part of the village is characterized by rural development, which predominantly uses obsolete individual heating systems (IHS), while the southern part is characterized by modern construction [26]. Fuel for IHS is mainly hard coal, in a proportion of share equal to 81%. All IHS are used during the cold season (from October until April). In the summer, local people use IHS for hot water supply and for preparing food. During the measurement campaign, in the neighborhood of the sampling point, 74 out of 85 individual point emitters (IPEs) were active (Figure 1). The activity of emission sources was indicated on the basis of the individual responses of IHS owners and the authors’ own observations. The emission of pollutants was periodical, and depended on the needs of users. The average daily time of IPE activity was 3 h. It can be noted that, even in the summer, a great number of old stoves are used, and almost 70% of the heating systems use fossil fuels. Of course, the quantity of burned fuel, and its relatively short daily time of use, were not hugely significant, but did influence the local air quality. The above observations allow us to conclude that the PM10 identified in PC3 came from low-stack emissions from sources located to the northeast of the receptor, and that these sources explain the largest amount of variation in the early morning hours (04.00 a.m.–07.00 a.m.). The effect of municipal emissions, which can be represented by PC3, in Kotórz Mały during this period was not large compared to the impact of natural sources (soil/mineral matter) and road traffic (exhaust and non-exhaust emission). This is to be expected, as the research was carried out in the summer period, when there is no strong low-stack emissions impact related to home heating [26]. Nevertheless, due to the strong correlation of PC3 with the characteristic elements, it can be noted that in households in suburban areas these types of emissions are still important, even during the summer period. Taking into account the variability of the importance of PC3 during the day, it can be suggested that it is also associated with the burning of various types of biomass waste and other organic materials and their derivatives, either when cleaning gardens and fields or during recreation activities (grilling, bonfires, etc.) [76,77,78,79].
PC4 explains a smaller amount of variance (12.7%) compared to PC1; its variances ranged from 8.0% (at 07.00 a.m.) to 14.9% (at 11.00 a.m.). PC4 was the most strongly correlated with V, Cr, Ni, Cu, Zn, As, and S. Concentrations recorded in hours corresponding to the correlations of individual elements with PC4 indicate the inflow of air masses mainly from the southeast, south–southeast, southwest, and west–southwest. Local sources, such as smaller economic activities, could also contribute to PC4—e.g., services in the field of vehicle mechanics (3 services) and metal surface varnishing (2 services) are located more than 1 km from the receptor. In addition, 12 km in a straight line from the receptor towards the southwest there is an open-cast mine of carbonate rocks called the Odra Quarry, while the Mala Panew ironworks in Ozimek is located 13.5 km in a straight line towards the southeast. These observations allow us to assume that PC4 reflects the industrial sources of the PM10 at the receptor. Additionally, this is supported by the strong correlations of PC4 with Ni—which is a component of metal products [80,81]—and with As, Cu, V, and Cr, which are related to the production of ceramics, cement, and metal smelting [81,82,83].
The last extracted principal component is PC5. Only two elements (Zn and S) were strongly correlated with PC5. The source identified in PC5 explains approx. 13% of the variance in PM10 emissions, and only at 11.00 p.m. At that time, the mean Zn and S concentrations were 12.5 ng/m3 and 1400 ng/m3, respectively. Such values of these two elements were recorded when there was an air inflow from the northwest. In the northern part of the village, as described above, there are mainly low-rise coal and biomass-heated buildings. In addition, in the same direction, at a distance of 2.3 km, lies the neighboring village of Węgry, with about 1000 inhabitants, also characterized by rural development. This allows us to assume that the PM10 identified in PC5 probably originated from fossil fuel and/or biomass combustion in local households [73]. Most probably, the hourly variability of the concentrations of the examined elements, for Zn and S as opposed to the other elements correlated with PC3, resulted in the isolation of an additional component of PC5. This component, however, similarly to PC3, is undoubtedly related to municipal emissions.

4. Conclusions

Regardless of the fact that in this study we used data from the summer period, it was shown that at a receptor in a typical rural area in the southern part of Poland, the impact of carbon emissions on the elemental composition of PM10 can be noticed almost every hour of the day. During the measurement period, especially at night and in the early morning hours, an evident influence of municipal emissions on the elemental composition of PM10 was observed. However, natural emissions (soil, sand) and exhaust and non-exhaust emissions from vehicle traffic had a stronger and more dominant influence on the elemental composition of PM10 during the research period. It is highly probable that if the analysis of the origins of PM10 during this measurement period was carried out on the basis of daily data on the elemental composition of the PM10, as is usually the case, the influence of other sources would not be noticed. Thus, it has been shown that using hourly concentrations of selected elements, it is possible to assess the origins of PM10 dust and the variability of the share of selected sources in shaping PM10 concentrations over the course of a day, even with the use of data from a relatively short measurement period.
As shown by the conducted PCA, the number of variances explained by particular main components varies by the hour, which suggests the variability of the impact of various sources of emissions during the day. Furthermore, the conducted research and observations allow us to conclude that the PCs are characterized by PM10 sources whose efficiency changed with not only the wind’s direction but also its speed, which determines the distances to which pollutants are transferred.

Supplementary Materials

The following are available online at https://www.mdpi.com/article/10.3390/en14092654/s1, Figure S1: An example of a filter for measurements, Figures S2 and S3: Measuring equipment PX-375 Horiba, Figure S4: Sampling site in Kotórz Mały, Figure S5: The examples of obtained results. The concentrations of individual elements and PM10.

Author Contributions

Conceptualization, W.R.-K. and T.M.; methodology, G.M., P.R.-K., K.B.; validation, T.M., P.R.-K. and G.M.; formal analysis, G.M.; investigation, T.M.; resources, K.B.; writing—original draft preparation, W.R.-K. and K.B.; writing—review and editing, J.R.; supervision, J.R., W.R.-K. All authors have read and agreed to the published version of the manuscript.

Funding

This research was carried out as a part of the “Implementation doctorate-edition II Faculty W-7 (03DW/0001/18)” project, financed by the National Centre for Research and Development. The funders had no role in the design of the study, in the collection, analyses, or interpretation of data; in the writing of the manuscript, or in the decision to publish the results.

Institutional Review Board Statement

Not applicable.

Informed Consent Statement

Not applicable.

Data Availability Statement

The data presented in this study are available on request from the corresponding author.

Acknowledgments

The authors acknowledge the companies HORIBA and MLU-recordum Environmental Monitoring Solutions GmbH for supplying the measurement equipment (PX-375 Horiba, Japan). We also acknowledge Tomasz Olszowski for valuable comments on the manuscript and study arrangements.

Conflicts of Interest

The authors declare no conflict of interest.

References

  1. Pant, P.; Harrison, R.M. Critical review of receptor modelling for particulate matter: A case study of India. Atmos. Environ. 2012, 49, 1–12. [Google Scholar] [CrossRef] [Green Version]
  2. Belis, C.; Karagulian, F.; Larsen, B.; Hopke, P. Critical review and meta-analysis of ambient particulate matter source apportionment using receptor models in Europe. Atmos. Environ. 2013, 69, 94–108. [Google Scholar] [CrossRef]
  3. Viana, M.; Kuhlbusch, T.; Querol, X.; Alastuey, A.; Harrison, R.; Hopke, P.; Winiwarter, W.; Vallius, M.; Szidat, S.; Prévôt, A.; et al. Source apportionment of particulate matter in Europe: A review of methods and results. J. Aerosol Sci. 2008, 39, 827–849. [Google Scholar] [CrossRef]
  4. Hopke, P.K. Receptor Modeling for Air Quality Management; Elsevier: Amsterdam, The Netherlands, 1991. [Google Scholar] [CrossRef]
  5. Hopke, P.K. Review of receptor modeling methods for source apportionment. J. Air Waste Manag. Assoc. 2016, 66, 237–259. [Google Scholar] [CrossRef] [PubMed]
  6. Thorpe, A.; Harrison, R.M. Sources and properties of non-exhaust particulate matter from road traffic: A review. Sci. Total. Environ. 2008, 400, 270–282. [Google Scholar] [CrossRef]
  7. Pernigotti, D.; Belis, C.A.; Spanò, L. SPECIEUROPE: The European data base for PM source profiles. Atmos. Pollut. Res. 2016, 7, 307–314. [Google Scholar] [CrossRef]
  8. Zhu, Y.; Huang, L.; Li, J.; Ying, Q.; Zhang, H.; Liu, X.; Liao, H.; Li, N.; Liu, Z.; Mao, Y.; et al. Sources of particulate matter in China: Insights from source apportionment studies published in 1987–2017. Environ. Int. 2018, 115, 343–357. [Google Scholar] [CrossRef]
  9. Bi, X.; Dai, Q.; Wu, J.; Zhang, Q.; Zhang, W.; Luo, R.; Cheng, Y.; Zhang, J.; Wang, L.; Yu, Z.; et al. Characteristics of the main primary source profiles of particulate matter across China from 1987 to 2017. Atmos. Chem. Phys. Discuss. 2019, 19, 3223–3243. [Google Scholar] [CrossRef] [Green Version]
  10. Ervens, B.; Turpin, B.J.; Weber, R.J. Secondary organic aerosol formation in cloud droplets and aqueous particles (aqSOA): A review of laboratory, field and model studies. Atmos. Chem. Phys. 2011, 11, 11069–11102. [Google Scholar] [CrossRef] [Green Version]
  11. Zhang, Y.; Seigneur, C.; Seinfeld, J.H.; Jacobson, M.; Clegg, S.L.; Binkowski, F.S. A comparative review of inorganic aerosol thermodynamic equilibrium modules: Similarities, differences, and their likely causes. Atmos. Environ. 2000, 34, 117–137. [Google Scholar] [CrossRef]
  12. Hallquist, M.; Wenger, J.C.; Baltensperger, U.; Rudich, Y.; Simpson, D.; Claeys, M.; Dommen, J.; Donahue, N.M.; George, C.; Goldstein, A.H.; et al. The formation, properties and impact of secondary organic aerosol: Current and emerging issues. Atmos. Chem. Phys. 2009, 9, 5155–5236. [Google Scholar] [CrossRef] [Green Version]
  13. Schaap, M.; Van Loon, M.; Brink, H.M.T.; Dentener, F.J.; Builtjes, P.J.H. Secondary inorganic aerosol simulations for Europe with special attention to nitrate. Atmos. Chem. Phys. Discuss. 2004, 4, 857–874. [Google Scholar] [CrossRef] [Green Version]
  14. Liang, S.Y.; Cui, J.L.; Bi, X.Y.; Luo, X.S.; Li, X. Deciphering source contributions of trace metal contamination in urban soil, road dust, and foliar dust of Guangzhou, southern China. Sci. Total Environ. 2019, 695, 133596. [Google Scholar] [CrossRef]
  15. Pachon, J.E.; Weber, R.J.; Zhang, X.; Mulholland, J.A.; Russell, A.G. Revising the use of potassium (K) in the source apportionment of PM2.5. Atmos. Pollut. Res. 2013, 4, 14–21. [Google Scholar] [CrossRef] [Green Version]
  16. Chow, J.C.; Lowenthal, D.H.; Chen, L.-W.A.; Wang, X.; Watson, J.G. Mass reconstruction methods for PM2.5: A review. Air Qual. Atmos. Health 2015, 8, 243–263. [Google Scholar] [CrossRef] [PubMed] [Green Version]
  17. Richter, P.; Griño, P.; Ahumada, I.; Giordano, A. Total element concentration and chemical fractionation in airborne particulate matter from Santiago, Chile. Atmos. Environ. 2007, 41, 6729–6738. [Google Scholar] [CrossRef]
  18. Lammel, G.; Röhrl, A.; Schreiber, H. Atmospheric lead and bromine in Germany. Environ. Sci. Pollut. Res. 2002, 9, 397–404. [Google Scholar] [CrossRef] [PubMed]
  19. Pant, P.; Harrison, R.M. Estimation of the contribution of road traffic emissions to particulate matter concentrations from field measurements: A review. Atmos. Environ. 2013, 77, 78–97. [Google Scholar] [CrossRef]
  20. Pervez, S.; Bano, S.; Watson, J.G.; Chow, J.C.; Matawle, J.L.; Shrivastava, A.; Tiwari, S.; Pervez, Y.F. Source Profiles for PM10-2.5 Resuspended Dust and Vehicle Exhaust Emissions in Central India. Aerosol Air Qual. Res. 2018, 18, 1660–1672. [Google Scholar] [CrossRef] [Green Version]
  21. Pokorná, P.; Hovorka, J.; Hopke, P.K. Elemental composition and source identification of very fine aerosol particles in a European air pollution hot-spot. Atmos. Pollut. Res. 2016, 7, 671–679. [Google Scholar] [CrossRef]
  22. Rogula-Kozłowska, W.; Błaszczak, B.; Szopa, S.; Klejnowski, K.; Sówka, I.; Zwoździak, A.; Jabłońska, M.; Mathews, B. PM2.5 in the central part of Upper Silesia, Poland: Concentrations, elemental composition, and mobility of components. Environ. Monit. Assess. 2012, 185, 581–601. [Google Scholar] [CrossRef] [PubMed]
  23. Rogula-Kozłowska, W.; Majewski, G.; Czechowski, P.O. The size distribution and origin of elements bound to ambient particles: A case study of a Polish urban area. Environ. Monit. Assess. 2015, 187, 240. [Google Scholar] [CrossRef] [PubMed] [Green Version]
  24. Rogula-Kozłowska, W.; Majewski, G.; Błaszczak, B.; Klejnowski, K.; Rogula-Kopiec, P. Origin-Oriented Elemental Profile of Fine Ambient Particulate Matter in Central European Suburban Conditions. Int. J. Environ. Res. Public Health 2016, 13, 715. [Google Scholar] [CrossRef] [PubMed] [Green Version]
  25. Majewski, G.; Rogula-Kozłowska, W. The elemental composition and origin of fine ambient particles in the largest Polish conurbation: First results from the short-term winter campaign. Theor. Appl. Clim. 2015, 125, 79–92. [Google Scholar] [CrossRef] [Green Version]
  26. Olszowski, T. Influence of Individual Household Heating on PM2.5 Concentration in a Rural Settlement. Atmosphere 2019, 10, 782. [Google Scholar] [CrossRef] [Green Version]
  27. Rogula-Kozłowska, W. Size-segregated urban particulate matter: Mass closure, chemical composition, and primary and secondary matter content. Air Qual. Atmos. Health 2016, 9, 533–550. [Google Scholar] [CrossRef] [Green Version]
  28. Rogula-Kozłowska, W.; Klejnowski, K.; Rogula-Kopiec, P.; Mathews, B.; Szopa, S. A Study on the Seasonal Mass Closure of Ambient Fine and Coarse Dusts in Zabrze, Poland. Bull. Environ. Contam. Toxicol. 2012, 88, 722–729. [Google Scholar] [CrossRef]
  29. Rogula-Kozłowska, W.; Klejnowski, K. Submicrometer Aerosol in Rural and Urban Backgrounds in Southern Poland: Primary and Secondary Components of PM1. Bull. Environ. Contam. Toxicol. 2012, 90, 103–109. [Google Scholar] [CrossRef]
  30. European Parliament. European Council Directive 2008/50/EC on ambient air quality and cleaner air for Europe. Off. J. Eur. Communities 2008. (OJ L 152, 11.6.2008, p. 1). Available online: http://extwprlegs1.fao.org/docs/pdf/eur80016.pdf (accessed on 29 April 2021).
  31. Zajusz-Zubek, E.; Mainka, A.; Korban, Z.; Pastuszka, J.S. Evaluation of highly mobile fraction of trace elements in PM10 collected in Upper Silesia (Poland): Preliminary results. Atmos. Pollut. Res. 2015, 6, 961–968. [Google Scholar] [CrossRef]
  32. Jabłońska, M.; Janeczek, J. Identification of industrial point sources of airborne dust particles in an urban environment by a combined mineralogical and meteorological analyses: A case study from the Upper Silesian conurbation, Poland. Atmos. Pollut. Res. 2019, 10, 980–988. [Google Scholar] [CrossRef]
  33. Klejnowski, K.; Janoszka, K.; Czaplicka, M. Characterization and Seasonal Variations of Organic and Elemental Carbon and Levoglucosan in PM10 in Krynica Zdroj, Poland. Atmosphere 2017, 8, 190. [Google Scholar] [CrossRef] [Green Version]
  34. Furman, P.; Styszko, K.; Skiba, A.; Zięba, D.; Zimnoch, M.; Kistler, M.; Kasper-Giebl, A.; Gilardoni, S. Seasonal Variability of PM10 Chemical Composition Including 1,3,5-triphenylbenzene, Marker of Plastic Combustion and Toxicity in Wadowice, South Poland. Aerosol Air Qual. Res. 2021, 21, 200223. [Google Scholar] [CrossRef]
  35. Sówka, I.; Chlebowska-Styś, A.; Pachurka, Ł.; Rogula-Kozłowska, W.; Mathews, B. Analysis of Particulate Matter Concentration Variability and Origin in Selected Urban Areas in Poland. Sustainability 2019, 11, 5735. [Google Scholar] [CrossRef] [Green Version]
  36. Chlebowska-Styś, A.; Sówka, I.; Kobus, D.; Pachurka, Ł. Analysis of concentrations trends and origins of PM 10 in selected European cities. In Proceedings of the E3S Web of Conferences, Les Ulis, France, 24 May 2017; Volume 17, p. 13. Available online: https://www.e3s-conferences.org/articles/e3sconf/abs/2017/05/e3sconf_eko2017_00013/e3sconf_eko2017_00013.html (accessed on 29 April 2021).
  37. Kindap, T.; Ünal, A.; Chen, S.-H.; Hu, Y.; Odman, M.; Karaca, M. Long-range aerosol transport from Europe to Istanbul, Turkey. Atmos. Environ. 2006, 40, 3536–3547. [Google Scholar] [CrossRef] [Green Version]
  38. Jandacka, D.; Durcanska, D. Differentiation of Particulate Matter Sources Based on the Chemical Composition of PM10 in Functional Urban Areas. Atmosphere 2019, 10, 583. [Google Scholar] [CrossRef] [Green Version]
  39. Kowalska, M.; Skrzypek, M.; Kowalski, M.; Cyrys, J. Effect of NOx and NO2 Concentration Increase in Ambient Air to Daily Bronchitis and Asthma Exacerbation, Silesian Voivodeship in Poland. Int. J. Environ. Res. Public Health 2020, 17, 754. [Google Scholar] [CrossRef] [PubMed] [Green Version]
  40. Majewski, G.; Rogula-Kozłowska, W.; Rozbicka, K.; Rogula-Kopiec, P.; Mathews, B.; Brandyk, A. Concentration, Chemical Composition and Origin of PM1: Results from the First Long-term Measurement Campaign in Warsaw (Poland). Aerosol Air Qual. Res. 2018, 18, 636–654. [Google Scholar] [CrossRef]
  41. Marć, M.; Bielawska, M.; Simeonov, V.; Namieśnik, J.; Zabiegała, B. The effect of anthropogenic activity on BTEX, NO2, SO2, and CO concentrations in urban air of the spa city of Sopot and medium-industrialized city of Tczew located in North Poland. Environ. Res. 2016, 147, 513–524. [Google Scholar] [CrossRef]
  42. Marć, M.; Zabiegała, B.; Simeonov, V.; Namieśnik, J. The Relationships Between BTEX, NOx, and O3Concentrations in Urban Air in Gdansk and Gdynia, Poland. CLEAN Soil Air Water 2014, 42, 1326–1336. [Google Scholar] [CrossRef]
  43. Rogula-Kozłowska, W.; Majewski, G.; Czechowski, P.O.; Rogula-Kopiec, P. Analysis of the data set from a two-year observation of the ambient water-soluble ions bound to four particulate matter fractions in an urban background site in Southern Poland. Environ. Prot. Eng. 2017, 43. [Google Scholar] [CrossRef]
  44. Samek, L. Overall human mortality and morbidity due to exposure to air pollution. Int. J. Occup. Med. Environ. Health 2016, 29, 417–426. [Google Scholar] [CrossRef]
  45. Błaszczyk, E.; Rogula-Kozłowska, W.; Klejnowski, K.; Kubiesa, P.; Fulara, I.; Mielżyńska-Švach, D. Indoor air quality in urban and rural kindergartens: Short-term studies in Silesia, Poland. Air Qual. Atmos. Health 2017, 10, 1207–1220. [Google Scholar] [CrossRef] [PubMed] [Green Version]
  46. Rodríguez, S.; Querol, X.; Alastuey, A.; Viana, M.-M.; Alarcón, M.; Mantilla, E.; Ruiz, C. Comparative PM10–PM2.5 source contribution study at rural, urban and industrial sites during PM episodes in Eastern Spain. Sci. Total Environ. 2004, 328, 95–113. [Google Scholar] [CrossRef]
  47. Juda-Rezler, K.; Reizer, M.; Maciejewska, K.; Błaszczak, B.; Klejnowski, K. Characterization of atmospheric PM2.5 sources at a Central European urban background site. Sci. Total Environ. 2020, 713, 136729. [Google Scholar] [CrossRef] [PubMed]
  48. Siudek, P. Seasonal variability of trace elements in fine particulate matter (PM2.5) in a coastal city of northern Poland – profile analysis and source identification. Environ. Sci. Process. Impacts 2020, 22, 2230–2243. [Google Scholar] [CrossRef]
  49. Wang, W.; Zhang, W.; Dong, S.; Yonemachi, S.; Lu, S.; Wang, Q. Characterization, Pollution Sources, and Health Risk of Ionic and Elemental Constituents in PM2.5 of Wuhan, Central China. Atmosphere 2020, 11, 760. [Google Scholar] [CrossRef]
  50. Dytłow, S.; Górka-Kostrubiec, B. Concentration of heavy metals in street dust: An implication of using different geochemical background data in estimating the level of heavy metal pollution. Environ. Geochem. Health 2021, 43, 521–535. [Google Scholar] [CrossRef]
  51. Cong, Z.; Kang, S.; Luo, C.; Li, Q.; Huang, J.; Gao, S.; Li, X. Trace elements and lead isotopic composition of PM10 in Lhasa, Tibet. Atmos. Environ. 2011, 45, 6210–6215. [Google Scholar] [CrossRef]
  52. Lim, J.-M.; Lee, J.-H.; Moon, J.-H.; Chung, Y.-S.; Kim, K.-H. Airborne PM10 and metals from multifarious sources in an industrial complex area. Atmos. Res. 2010, 96, 53–64. [Google Scholar] [CrossRef]
  53. Bralewska, K.; Rogula-Kozłowska, W. Health exposure of users of indoor sports centers related to the physico-chemical properties of particulate matter. Build. Environ. 2020, 180, 106935. [Google Scholar] [CrossRef]
  54. Turek-Fijak, A.; Brania, J.; Styszko, K.; Zięba, D.; Stęgowski, Z.; Samek, L. Chemical characterization of PM10 in two small towns located in South Poland. Nukleonika 2021, 66, 29–34. [Google Scholar] [CrossRef]
  55. Sówka, I.; Chlebowska-Styś, A.; Pachurka, Ł.; Rogula-Kozłowska, W. Seasonal variations of PM2.5 and PM10 concentrations and inhalation exposure from PM-bound metals (As, Cd, Ni): First studies in Poznań (Poland). Arch. Environ. Prot. 2018, 44, 86–95. [Google Scholar] [CrossRef]
  56. Mainka, A.; Zubek, E.Z.; Kaczmarek, K. PM10 composition in urban and rural nursery schools in Upper Silesia, Poland: A trace elements analysis. Int. J. Environ. Pollut. 2017, 61, 98. [Google Scholar] [CrossRef]
  57. Styszko, K.; Samek, L.; Szramowiat, K.; Korzeniewska, A.; Kubisty, K.; Rakoczy-Lelek, R.; Kistler, M.; Giebl, A.K. Oxidative potential of PM10 and PM2.5 collected at high air pollution site related to chemical composition: Krakow case study. Air Qual. Atmos. Health 2017, 10, 1123–1137. [Google Scholar] [CrossRef]
  58. Rogula-Kozłowska, W.; Klejnowski, K.; Rogula-Kopiec, P.; Ośródka, L.; Krajny, E.; Błaszczak, B.; Mathews, B. Spatial and seasonal variability of the mass concentration and chemical composition of PM2.5 in Poland. Air Qual. Atmos. Health 2014, 7, 41–58. [Google Scholar] [CrossRef] [Green Version]
  59. Wang, Z.-S.W.; Wu, T.; Shi, G.-L.; Fu, X.; Tian, Y.-Z.; Feng, Y.-C.; Wu, X.-F.; Wu, G.; Bai, Z.-P.; Zhang, W.-J. Potential Source Analysis for PM10 and PM2.5 in Autumn in a Northern City in China. Aerosol Air Qual. Res. 2012, 12, 39–48. [Google Scholar] [CrossRef] [Green Version]
  60. Pan, Y.; Wang, Y.; Sun, Y.; Tian, S.; Cheng, M. Size-resolved aerosol trace elements at a rural mountainous site in Northern China: Importance of regional transport. Sci. Total Environ. 2013, 461-462, 761–771. [Google Scholar] [CrossRef]
  61. Kim, M.-K.; Jo, W.-K. Elemental composition and source characterization of airborne PM10 at residences with relative proximities to metal-industrial complex. Int. Arch. Occup. Environ. Health 2006, 80, 40–50. [Google Scholar] [CrossRef]
  62. Gustafsson, M.; Blomqvist, G.; Gudmundsson, A.; Dahl, A.; Jonsson, P.; Swietlicki, E. Factors influencing PM10 emissions from road pavement wear. Atmos. Environ. 2009, 43, 4699–4702. [Google Scholar] [CrossRef]
  63. Li, J.-D.; Deng, Q.-H.; Lu, C.; Huang, B.-L. Chemical compositions and source apportionment of atmospheric PM10 in suburban area of Changsha, China. J. Central South Univ. Technol. 2010, 17, 509–515. [Google Scholar] [CrossRef]
  64. Sówka, I.; Zwoździak, A.; Trzepla-Nabaglo, K.; Skrȩtowicz, M.; Zwoździak, J. PM2.5 elemental composition and source apportionment in a residential area of wrocŁaw, POLAND. Environ. Prot. Eng. 2012, 38, 73–79. [Google Scholar]
  65. Samek, L.; Zwoździak, A.; Sówka, I. Chemical characterization and source identification of particulate matter PM10 in a rural and urban site in Poland. Environ. Prot. Eng. 2013, 39. [Google Scholar] [CrossRef]
  66. Kulshrestha, A.; Satsangi, P.G.; Masih, J.; Taneja, A. Metal concentration of PM2.5 and PM10 particles and seasonal variations in urban and rural environment of Agra, India. Sci. Total Environ. 2009, 407, 6196–6204. [Google Scholar] [CrossRef] [PubMed]
  67. Song, Y.; Xie, S.; Zhang, Y.; Zeng, L.; Salmon, L.G.; Zheng, M. Source apportionment of PM2.5 in Beijing using principal component analysis/absolute principal component scores and UNMIX. Sci. Total Environ. 2006, 372, 278–286. [Google Scholar] [CrossRef] [PubMed]
  68. Toscano, G.; Moret, I.; Gambaro, A.; Barbante, C.; Capodaglio, G. Distribution and seasonal variability of trace elements in atmospheric particulate in the Venice Lagoon. Chemosphere 2011, 85, 1518–1524. [Google Scholar] [CrossRef] [PubMed] [Green Version]
  69. Chakraborty, A.; Gupta, T. Chemical Characterization and Source Apportionment of Submicron (PM1) Aerosol in Kanpur Region, India. Aerosol Air Qual. Res. 2010, 10, 433–445. [Google Scholar] [CrossRef]
  70. Kuo, C.-Y.; Wang, J.-Y.; Liu, W.-T.; Lin, P.-Y.; Tsai, C.-T.; Cheng, M.-T. Evaluation of the vehicle contributions of metals to indoor environments. J. Expo. Sci. Environ. Epidemiol. 2012, 22, 489–495. [Google Scholar] [CrossRef]
  71. Sternbeck, J.; Sjödin, Å.; Andréasson, K. Metal emissions from road traffic and the influence of resuspension—results from two tunnel studies. Atmos. Environ. 2002, 36, 4735–4744. [Google Scholar] [CrossRef]
  72. Samek, L.; Gdowik, A.; Ogarek, J.; Furman, L. Elemental composition and rough source apportionment of fine particulate matter in air in Cracow, Poland. Environ. Prot. Eng. 2016, 42. [Google Scholar] [CrossRef]
  73. Khare, P.; Baruah, B. Elemental characterization and source identification of PM2.5 using multivariate analysis at the suburban site of North-East India. Atmos. Res. 2010, 98, 148–162. [Google Scholar] [CrossRef]
  74. Cesari, D.; Amato, F.; Pandolfi, M.; Alastuey, A.; Querol, X.; Contini, D. An inter-comparison of PM10 source apportionment using PCA and PMF receptor models in three European sites. Environ. Sci. Pollut. Res. 2016, 23, 15133–15148. [Google Scholar] [CrossRef] [PubMed]
  75. Rajšić, S.; Mijić, Z.; Tasić, M.; Radenković, M.; Joksić, J. Evaluation of the levels and sources of trace elements in urban particulate matter. Environ. Chem. Lett. 2008, 6, 95–100. [Google Scholar] [CrossRef]
  76. Badyda, A.; Krawczyk, P.; Bihałowicz, J.S.; Bralewska, K.; Rogula-Kozłowska, W.; Majewski, G.; Oberbek, P.; Marciniak, A.; Rogulski, M. Are BBQs Significantly Polluting Air in Poland? A Simple Comparison of Barbecues vs. Domestic Stoves and Boilers Emissions. Energies 2020, 13, 6245. [Google Scholar] [CrossRef]
  77. Yu, K.-P.; Chen, Y.-C.; Miao, Y.-J.; Siregar, S.; Tsai, Y.W.; Lee, W.-M.G. Effects of Oil Drops and the Charcoal’s Proximate Composition on the Air Pollution Emitted from Charcoal Barbecues. Aerosol Air Qual. Res. 2020, 20, 1480–1494. [Google Scholar] [CrossRef] [Green Version]
  78. Chen, C.; Luo, Z.; Yu, C.; Chunjiang, Y. Release and transformation mechanisms of trace elements during biomass combustion. J. Hazard. Mater. 2019, 380, 120857. [Google Scholar] [CrossRef] [PubMed]
  79. Iqbal, M.A.; Kim, K.-H. Sampling, pretreatment, and analysis of particulate matter and trace metals emitted through charcoal combustion in cooking activities. TrAC Trends Anal. Chem. 2016, 76, 52–59. [Google Scholar] [CrossRef]
  80. Zhou, S.; Yuan, Q.; Li, W.; Lu, Y.; Zhang, Y.; Wang, W. Trace metals in atmospheric fine particles in one industrial urban city: Spatial variations, sources, and health implications. J. Environ. Sci. 2014, 26, 205–213. [Google Scholar] [CrossRef]
  81. Fernández-Camacho, R.; Rodríguez, S.; De La Rosa, J.; De La Campa, A.S.; Alastuey, A.; Querol, X.; González-Castanedo, Y.; Garcia-Orellana, I.; Nava, S. Ultrafine particle and fine trace metal (As, Cd, Cu, Pb and Zn) pollution episodes induced by industrial emissions in Huelva, SW Spain. Atmos. Environ. 2012, 61, 507–517. [Google Scholar] [CrossRef] [Green Version]
  82. Viana, M.; Querol, X.; Alastuey, A.; Gil, J.; Menéndez, M. Identification of PM sources by principal component analysis (PCA) coupled with wind direction data. Chemosphere 2006, 65, 2411–2418. [Google Scholar] [CrossRef]
  83. Negral, L.; Moreno-Grau, S.; Moreno, J.; Querol, X.; Viana, M.M.; Alastuey, A. Natural and Anthropogenic Contributions to PM10 and PM2.5 in an Urban Area in the Western Mediterranean Coast. Water Air Soil Pollut. 2008, 192, 227–238. [Google Scholar] [CrossRef]
Figure 1. Location of the measuring point in Kotórz Mały.
Energies 14 02654 g001
Figure 2. The average hourly PM10 concentrations averaged for the entire measurement period (03–31.07.2019), as measured by the receptor.
Energies 14 02654 g002
Figure 3. The average hourly concentrations of (a) Al, Ca, Fe, S, Si and K, and (b) As, Cr, Cu, Mn, Ni, Pb, Ti, V and Zn, averaged for the entire measurement period (03–31.07.2019), as measured by the receptor.
Energies 14 02654 g003aEnergies 14 02654 g003b
Figure 4. Average concentrations of PM10 and PM10-bound elements related to wind direction during the measurement period.
Energies 14 02654 g004aEnergies 14 02654 g004bEnergies 14 02654 g004c
Figure 5. A summary of the results of the principal component analysis (PCA) performed on hourly data on the elemental composition of PM10. For each hour, 29 data were used, and the tables summarized only those elements that were always correlated with the variables PC1–PC5 (correlation coefficient r > 0.7).
Energies 14 02654 g005aEnergies 14 02654 g005bEnergies 14 02654 g005cEnergies 14 02654 g005d
Table 1. Descriptive statistics of a series of 24-h concentrations of PM10, PM10-bound elements, gaseous pollutants, and meteorological parameters, as measured by the receptor.
ParameterStatistics
NAverageMinimumMaximumStandard Deviation
PM10, µg/m32920.87.148.47.5
PM10-bound elements
Al, ng/m329357.276.4675.0154.9
As, ng/m3290.5<LLD4.51.0
Ca, ng/m329256.264.6517.5134.1
Cr, ng/m3296.15.27.30.5
Cu, ng/m32911.27.122.83.1
Fe, ng/m329195.263.9355.477.1
K, ng/m32976.75.4132.534.3
Mn, ng/m3296.93.012.72.5
Ni, ng/m3295.44.58.50.9
Pb, ng/m3296.11.414.93.9
S, ng/m3291485.5556.72352.4487.4
Si, ng/m329770.398.51722.8455.8
Ti, ng/m32912.80.354.811.7
V, ng/m3292.11.82.50.2
Gaseous pollutants
SO2, µg/m3293.41.84.90.9
NO, µg/m3291.00.52.80.5
NO2, µg/m3296.23.18.21.3
O3, µg/m32925.119.333.13.8
CO, µg/m3290.40.20.50.1
Meteorological parameters
Temperature max. °C2927.819.032.63.4
Temperature min. °C2914.810.518.62.2
Temperature average. °C2921.116.825.62.3
Humidity %2967.647.797.713.8
Wind speed m/s297.14.211.71.9
Atmospheric pressure, hPa291013.71008.21017.42.4
Precipitation, mm291.70.012.03.6
Table 2. The mean concentrations of PM10 and PM10-bound elements at various sites in Poland.
Sampling Site
(City, Type)
Measurement
Period
PM10
(µg/m3)
Concentration (ng/m3)
AsCaCrCuFeKMnNiPbTiVZn
Kotórz Mały, this studySummer 2018210.5256.26.111.2195.276.76.95.46.112.82.114.5
Warsaw, urban area [53]Summer 201740 228.952.516.2145.9 21.410.817.2
Wadowice, urban area [54]Winter 201717411.0590.04.027.0760.01400.027.04.2120.056.015.0360.0
Poznań, urban area [35]Summer 201717 2611.0 48.0
Wrocław, urban area [35]Summer 201617 1080.0 300.0
Poznań, urban area [55]2010–2016171.0 1.2
Upper Silesia, rural area [56]Spring 2014230.8 239.42.5217.3 12.36.220.4 72.7
Kraków, urban area [57]Winter 201530–95 580.010.123.6 160.022.53.245.773.53.9148.6
Table 3. The enrichment factors (EFs) for the PM10-bound elements, averaged for each hour of the day and the measurement period.
PeriodElement
AlAsCaCrCuFeKMnNiPbSSiTiVZn
02.10.03.397.3406.83.11.36.2150.3164.2849.01.01.321.6146.3
n12.30.03.4108.2437.13.21.56.7182.4181.3969.31.01.124.1165.6
22.324.23.9114.5454.33.11.46.8179.2176.1976.81.01.225.6167.3
32.30.03.6119.1515.53.31.47.5189.4203.71057.81.01.126.4179.2
42.264.23.7116.8454.33.21.46.6174.2217.7985.91.01.126.0161.2
52.492.03.7127.1526.03.41.47.1210.9278.51128.01.01.028.6185.1
62.3195.73.8120.2500.33.41.47.2174.0258.41029.01.01.426.8183.5
72.2655.83.797.0474.93.31.46.4155.0337.2889.01.01.521.4201.2
82.2855.54.286.3403.13.11.56.2134.6376.5821.51.01.619.1216.8
92.0382.23.673.7406.22.71.25.3115.4292.6699.01.01.616.4187.0
101.8179.03.665.9299.12.71.15.4148.9221.3590.01.01.614.7175.6
112.046.33.771.7318.62.61.25.6116.5166.7646.11.01.816.0112.8
121.826.93.754.4248.62.41.15.186.3114.0465.71.01.812.286.5
131.824.64.061.7326.52.41.15.492.085.9545.71.03.313.697.8
141.817.83.659.2253.52.31.05.0109.685.3534.21.01.913.278.5
151.80.03.560.0272.32.41.04.993.593.7550.31.02.113.374.8
161.911.73.467.5284.32.51.15.5123.3100.2603.21.01.914.984.8
171.83.33.460.7286.42.41.05.099.4104.7539.31.02.313.778.3
181.667.63.352.7268.72.20.94.5116.265.3480.51.01.711.871.0
191.316.52.837.7165.81.50.73.256.645.2335.91.01.18.348.1
201.20.02.737.8166.61.50.63.060.553.9334.21.01.18.451.0
211.579.73.050.9216.72.20.74.172.679.9448.11.01.211.466.9
221.891.13.163.3263.22.70.95.695.5107.3558.31.01.414.186.3
232.050.63.585.8359.73.11.26.0140.6131.5738.21.01.419.3120.7
3–31.07 (average)1.898.53.468.7308.62.51.15.2114.4141.4614.11.01.615.6109.9
Publisher’s Note: MDPI stays neutral with regard to jurisdictional claims in published maps and institutional affiliations.

