Article

The Use of Geothermal Energy to Heating Crops under Cover: A Case Study of Poland

by
Sławomir Kurpaska
1,*,
Mirosław Janowski
2,
Maciej Gliniak
1,*,
Anna Krakowiak-Bal
1 and
Urszula Ziemiańczyk
1
1
Department of Bioprocess Engineering, Power Engineering and Automation, University of Agriculture in Krakow, Mickiewicza Av. 21, 31-120 Krakow, Poland
2
Department of Fossil Fuels, AGH University of Science and Technology, Mickiewicza Av. 30, 30-059 Krakow, Poland
*
Authors to whom correspondence should be addressed.
Energies 2021, 14(9), 2618; https://doi.org/10.3390/en14092618
Submission received: 17 March 2021 / Revised: 24 April 2021 / Accepted: 26 April 2021 / Published: 3 May 2021
(This article belongs to the Special Issue Use of Geothermal Energy Sources)

Abstract

:
Among the many different applications of geothermal energy, its use for agricultural production purposes is noteworthy. The use of geothermal water in greenhouse cultivation is the most modern form of production; it enables the implementation of the production cycle throughout the year while reducing energy costs. In this paper, based on basic heat transfer relations, the heat demand of modern greenhouse constructions was determined. The monthly and year-round heat demand was determined for facilities with diversified heights of the side walls. Depending on the type of unit of greenhouse area analysed (1 ha), the calculated annual heat demand ranged from 11.05 to 12.46 TJ. Based on data on the geothermal energy potential in Poland, investment costs and payback periods were determined for the analysed locations. The locations of the facilities were selected based on traditions of plant cultivation in the greenhouse facilities and the availability of geothermal energy. The analysis showed that, under the adopted conditions, without additional co-financing, and in one of the considered locations, the investment will result in positive financial effects after 15 years. In the case of co-financing, at the level of currently existing values, all locations—irrespective of the assumed period of exploitation—showed satisfactory financial effects.

1. Introduction

Renewable energy sources account for about 28% of the world’s energy resources [1]. Each year, their share of global power demand increases due to the global decarbonisation of the energy sector of the world economy. Renewable energy is a commonly available energy resource, which, with the exception of geothermal energy, is strongly dependent on topographical and climatic conditions and seasons [2].

1.1. Use of Geothermal Energy

The essence of the exploitation of geothermal resources is the development of research and analysis of groundwater that shows the highest possible reservoir and operating temperatures, the highest flow under artesian conditions, and the lowest degree of mineralization (TDS). Hydrogeothermal conditions are the key factors determining the effective development of geothermal exploitation. Water intakes and the groundwater itself should have appropriate parameters—temperature, discharge, TDS, and chemical composition—which will ensure a wide range of practical uses in heating (including agriculture), balneotherapy, recreation, etc. In Poland, they are characterized by natural sedimentary and structural pools filled with geothermal waters with different temperatures in the reservoirs ranging from 20 to 80/90 °C—in some cases, even slightly above 100 °C. Low-temperature geothermal systems are also used for many other purposes, including greenhouses, fish farming, and soil heating.
Around 10 GW of geothermal energy is currently exploited worldwide. A total of 90% of the global geothermal energy use is located in eight countries—Iceland, Indonesia, Italy, Japan, Mexico, New Zealand, the Philippines, and the United States [3]. Calculations [4,5] indicate that doubling the exploitation of geothermal reservoirs could eliminate more than 1 billion tonnes of CO2 emissions by 2050 [6]. Projections until 2050 assume increases in the shares of geothermal energy to 3% (electricity) and 5% (heat) of the global energy consumption [7]. Achieving this level of supply will require the development of modern, low-cost energy generation technologies or the implementation of comprehensive energy solutions in the industrial or agricultural sector. The European Directive 2009/28/EC [8] covers low-enthalpy geothermal resources, which can be exploited through the direct use of geothermal waters or through systems based on heat exchanger systems in the form of heat pumps and boreholes. Underground heat exchange in geothermal reservoirs is more environmentally friendly when closed vertical wells are used [9], as they do not generate mass flow, but only thermal exchange. Underground heat exchange is influenced by the physical and structural properties of the ground, such as the thermal conductivity, geothermal gradient, and water content [10]. As low-carbon energy sources, shallow and deep geothermal systems are being explored as alternatives [11,12,13]. The results of research so far usually concern the extraction of geothermal energy as a heat source for steam generation, which is then used to generate electricity. This change in the approach to the exploitation of geothermal deposits has introduced a new system of exploitation of deposits based on the circulation of fluid in the rocks instead of using these resources in open systems, thus reducing the emission of toxic substances (mercury, boron, and arsenic) into the environment. This is now a sustainable pathway for exploiting mid-temperature deposits. The modern exploitation approach means that the fluid can be used directly for energy production. Fluid circulation in geothermal systems is divided into two main systems—open and closed. The open system involves pumping cold fluid into the geothermal reservoir via an injection well, then heating it as it flows through the porous structure of the reservoir and pumping it back to the surface in a production well. This system has major problems with flow control and energy stability. Closed systems operate on the principle of an open system, but with the elimination of direct fluid contact with the geothermal reservoir. The use of this system is usually based on a coaxial heat exchanger, which is the most economically efficient [14,15,16,17]. The application of this concept was proposed by Nalla et al. [14], Alimonti and Soldo [15,17], Gharibi et al. [18], Kujawa et al. [19], Cheng et al. [20,21], and Wight and Bennett [22]. The works cited above assumed the use of geothermal energy as an energy source in the organic Rankine cycle. Previous studies also indicated that, relative to energy generation, the increased outlet water temperature is directly dependent on the inlet water temperature, circulation rate, and heat transfer from the shell pipe to the annulus. Cheng et al. [20,21] explained that the use of a cluster of multiple wells in an abandoned oil field and the use of isobutane as the circulation fluid could be a commercial value proposition for optimizing the productivity of a geothermal reservoir, achieving over 80% efficiency of the equipment set used (pump, turbine, and generator). The tests carried out also showed a stable trend of the isobutane output temperature at the wellhead for 1000 consecutive days. Adinolfi et al. [22] and Li et al. [23] presented thermoactive piles as an efficient solution for minimizing greenhouse gas emissions and achieving economic advantages. Described technology has received little acceptance by the industry because of the impact on the serviceability of the systems in the long term. The outcomes showed that thermal-induced displacements, pore-water pressure variations, and axial loads are influenced by the mode of application of the thermal law and deserve to be considered in the geotechnical design. Mauro et al. [24] presented schemes for exploiting low-enthalpy geothermal energy to reduce street temperature fluctuations throughout the year and avoid ice formation during the winter season. The results that they present showed that such a system may be effectively used for street heating, and the proper design of both the system configuration and the thermal properties of the employed materials in relation to the specific site and, as a consequence, to the exterior temperature and the subsoil temperature is important. In presented study there is also important relation between thermal law, pore water pressure and axial loads.
Among the geothermal solutions, geothermal heat pump and ground-source heat pump systems play a dominant role. These are heating systems that transfer heat to or from the ground using electrically powered compression [25,26]. These systems can achieve high levels of efficiency with low energy consumption if the circulating fluid’s temperature is stable throughout the system. This is ensured by the availability of a stable ground temperature, high thermal conductivity of the ground, low thermal resistance of the ground exchanger, and a sufficient number of wells comprising the geothermal field [27,28]. As confirmed by some research works, the use of geothermal heat pumps is of increasing interest in agriculture, as they can be a sustainable solution for reducing both energy costs and CO2 emissions [29]. In the greenhouse sector, Sethi and Sharma [30] investigated a deep-flow heat exchanger system connected to an aquifer designed to use groundwater to heat and cool a greenhouse with a composite climate. A case study described by Anifantis et al. [31] in a real facility indicated the suitability of a low-enthalpy geothermal heat source for heating. The results proved that the use of the ground as a natural heat source was effective, efficient, and environmentally sustainable if also applied in agriculture. Furthermore, the reduction of construction costs could further facilitate the dissemination of geothermal technologies in agriculture, which could be achieved, for example, by considering simple geothermal systems that are easy to implement by farmers themselves [32]. Greenhouses are energy-intensive structures compared to residential buildings of the same area. This problem particularly affects crops that are sensitive to changes in environmental conditions. The implementation of geothermal energy sources can provide a reduction in energy demand of heating a facility. The use of geothermal energy to heat greenhouses is also related to the necessity of using buildings with adequate thermal insulation and construction, thus allowing the use of low-efficiency individual heat exchangers [33,34,35,36]. Such a system, as well as others, was analysed by Ansari et al. [37], who found that the output of the heating and cooling process was about 22.1 MW, and the energy and exergy efficiencies were 49.1% and 67.9%, respectively. Parikhani et al. [38] conducted a comprehensive evaluation of a geothermal system through energy and economic analyses and single- and multi-criteria optimization. Ebadollahi et al. [39] studied a geothermal system based on the organic Rankine cycle for cooling and heating. Wang et al. [40] described a geothermal energy system from the perspectives of energy, economic impact, and environmental impact. This review of the literature clearly shows the topicality of the issue of using geothermal energy resources from the perspective of meeting the energy needs of the analysed facilities. An interesting issue is the use of this energy for the heating needs of greenhouses located in a selected region of Poland.

1.2. The Current State of Geothermal Resources in Poland

Poland has very good geothermal conditions, even though it lies outside volcanic areas. More than 80% of the country is covered by two geothermal provinces: the Central European (Polish Lowlands) and the Carpathian ones. The geothermal conditions in Poland are relatively well recognised. The main geothermal resources are accumulated within four hydrogeothermal provinces (Figure 1) [41,42].
The Polish Lowland is the largest geothermal region in Poland, occupying ca. 80% of total area of the country. Geothermal resources are related mostly to Mesozoic formations; however, some geothermal waters also occur in deep Paleozoic formations. A regional analysis of the geothermal parameters in the Polish Lowland indicated that the most promising aquifers are the Lower Jurassic and the Lower Cretaceous ones.
Both of these reservoirs constitute the basis of the geothermal resources in Poland for a wide spectrum of uses, including heating (including greenhouses), balneotherapy, and recreation. The Lower Jurassic and Lower Cretaceous formations mainly comprise sandstone complexes with good reservoir parameters: porosity, permeability, and hydraulic conductivity. Good hydrogeological parameters determine the possibility of obtaining a considerably productive well—often even above 200 m3·h−1—which influences the construction of economically viable geothermal plants [44,45]. This is confirmed by the parameters of several geothermal heating plants currently operating in Poland that use geothermal waters from the Lower Jurassic (Pyrzyce, Stargard) or Lower Cretaceous aquifers (Uniejów, Mszczonów, Poddębice). Geothermal waters have not been used for the purpose of heating crops under covers (greenhouses) in Poland, except on an experimental scale in Podhale.
A regional analysis performed during the preparation of the geothermal atlas of the Carpathian foredeep [46] indicated that this area is characterized by moderate to low geothermal potential, revealing that the low water outflows of wells in almost all hydrogeothermal reservoirs are a basic issue in the whole area of the Carpathian foredeep. The exception is the Cenomanian reservoir, which occurs in the central part of the Carpathian foredeep (Brzesko, Bochnia), where one should expect high outflows over almost the entire area of its occurrence. Areas with well outflows with higher potential occur rarely in Middle and Upper Jurassic and Miocene reservoirs (mainly in the eastern part of the foredeep). Relatively good hydrogeological parameters were observed in clastic Carboniferous and carbonate Carboniferous and Devonian formations, which can locally provide large amounts of geothermal water. It should be emphasised that the prediction of the well output of these reservoirs is very difficult and unpredictable due to the fissures and the karst nature of these reservoirs.
The Sudetes region is mostly built of crystalline rocks that decrease in steps towards the NE. In this area, geothermal waters only occur in crystalline formations. Most of the studies performed so far have shown that the geothermal waters in the Polish part of the Sudetes are only fit for use for treatment purposes [47]. However, as proven by these studies, the whole Sudetes region is characterised by favourable geothermal conditions. An example of this is the area of Cieplice, where the occurrence of deep geothermal waters with a temperature of 86.7 °C (2002.5 m b.g.l.) has been reported. In the Sudetes, geothermal waters only occur in crystalline rocks, and their presence is either reported in direct outflows on the surface or abstracted at greater depths, sometimes under the cover of sedimentary rocks. The elevated areas and lines of deep discontinuities in the crystalline substratum are crucial for the creation of mineral and geothermal waters. It should be stated that the occurrence of geothermal waters in the Sudetes region is local, and due to the complex geological and tectonic conditions, it is difficult to determine.
The main geothermal energy resources in Poland are associated with the Lower Jurassic and Lower Cretaceous reservoirs that occur in the Polish Lowland. Within the Lower Jurassic aquifers, permeable rocks constitute 40–80% of the total thickness of the Liassic sequence. The temperature of the geothermal waters differs from that typical of subsurface waters, reaching 120 °C at depths below 3000 m (axial part of the Łódź Trough). The TDS of groundwater in the Lower Jurassic aquifers is closely related to the depth of occurrence, and it changes from a few to over 200 g·L−1; however, in the whole aquifer, values from 10 to 100 g·L−1 dominate. In most parts of the Lower Jurassic aquifer, discharges of over 100 m3∙h−1 can be expected.
The second aquifer in the Polish Lowlands with relevance on the regional scale and a significant extent is the Lower Cretaceous one. The total thickness of the Lower Cretaceous formation varies from several meters to over 400 m, with dominant values between 20 and 200 m. The geothermal water temperatures vary from 20 to over 90 °C. The highest temperatures recorded so far were in the NE of Konin town (NW of Poddębice). A regional analysis of hydrogeological datasets indicated that the potential discharges of the wells varied from less than 25 m3∙h−1 to over 100 m3∙h−1 [44,48].
Geothermal waters can be utilized for heat generation for houses, industrial buildings, greenhouses, and agriculture, as well as for the generation of warm water and for therapeutic and recreational purposes. The use of ecologically clean geothermal energy resources is real and economically justified in vast areas of Poland. The estimates of the geothermal resources in different parts of Poland confirm that the biggest geothermal potential is in the Polish Lowlands. Figure 1 shows the regions with the most prospective areas for geothermal energy use in Poland on a map of Poland’s tectonic units under the Cenozoic cover.
The most prospective geothermal region in Poland is the Polish Lowlands. The geothermal waters occur mainly in the Lower Cretaceous and Lower Jurassic reservoirs. The geothermal waters from those reservoirs are currently being exploited in five geothermal power plants: Pyrzyce, Stargard, Uniejów, Poddębice, and Mszczonów. They are also being used in several locations, including Sochaczew, Sieradz, Koło, Aleksandrów Łódzki, and Konstantynów Łódzki; other geothermal projects and drilling are being conducted for the exploitation of these waters. Poland is characterized by its low-temperature geothermal resources, so their direct use is the most significant way to utilize them. As the most popular way to use geothermal waters is in district heating systems, there are six geothermal district heating plants that have been operating since the end of 2017 (opened between 1993 and 2015). The oldest geothermal district heating system has been in operation since 1993 and is located in the Podhale Region in the south of Poland. The other five installations are located in the Polish Lowlands (central and north-western parts of Poland). These GeoDH systems are located in Mszczonów, Uniejów, Poddębice, Pyrzyce, and Stargard (Table 1).
Furthermore, 10 geothermal health resorts (SPAs) exist in Poland. The oldest, Cieplice Śląskie SPA, dates back to 13th century. It is located in the Sudetic geothermal region (SW of Poland). The youngest one was established in Uniejów in 2012. In recent decades (2006–2016), 14 new geothermal SPAs were constructed. In the area of the Polish greenhouse market, geothermal heating and its economics are new and innovative.

1.3. Economic Analysis of Investment Profitability

Determining the profitability of geothermal installations is extremely important, especially because of the high investment costs. These are caused by the need to drill boreholes, which significantly increases the cost of producing geothermal energy, even though the process is not very costly at the exploitation stage. It was observed from the market conditions that the cost of geothermal energy production is gradually decreasing. In 2005, it was about 50–150 EUR·MWh−1. In 2010, it fell to 40–100 EUR·MWh−1, and in 2020, the cost was 40–80 EUR·MWh−1. This is good news for Poland, which has great geothermal potential, although extraction has been unprofitable so far due to the great depth of most deposits. Additionally, as indicated by [50], the use of geothermal energy in Europe is expected to grow rapidly over the next decades. The main purpose of the use of geothermal energy in agriculture is to provide heat for greenhouses in horticulture.
A financial analysis of a project is carried out in order to assess the consolidated profitability of the project; assess the profitability of the project for its proponents and the main stakeholders; verify the financial sustainability of the project, which is the main condition of the feasibility for projects of any type; and identify cash flows, which can be helpful in calculating the socioeconomic costs and benefits [51,52,53].
There are several methods that can be used to appreciate the economic ramifications of an investment. However, for capital-intensive and multi-variable scenarios, a comparison of the individual net present value (NPV) and internal rate of return (IRR) could provide an understanding of the corresponding payback processes [54]. The economic significance and the reliability of a metric depend on its compatibility with the NPV [55].
In the literature, there are no research results that confirm the economic viability of building geothermal intakes for year-round cultivation under covers (in greenhouses). Therefore, this area seems to be interesting to analyse, and the authors identified that it constitutes a gap in which research can be undertaken. Hence, the aim of this paper is to analyse the energy and economic efficiency of covering the heating needs of greenhouse objects by using geothermal boreholes under the conditions in Poland. Three locations for the geothermal boreholes were selected for an analysis based on two factors: existing energy resources and traditions of greenhouse production. The following research questions were defined in this context:
(1)
Can the heating needs of a greenhouse be completely covered by geothermal energy from a single borehole?
(2)
What is the cost ratio between heating a greenhouse with geothermal sources and heating from the grid (entirely or partly from fossil fuels)?
(3)
Can geothermal energy be an alternative solution for greenhouses? Under which conditions?

2. Materials and Methods

2.1. Heat Cnsumption of a Greenhouse Facility

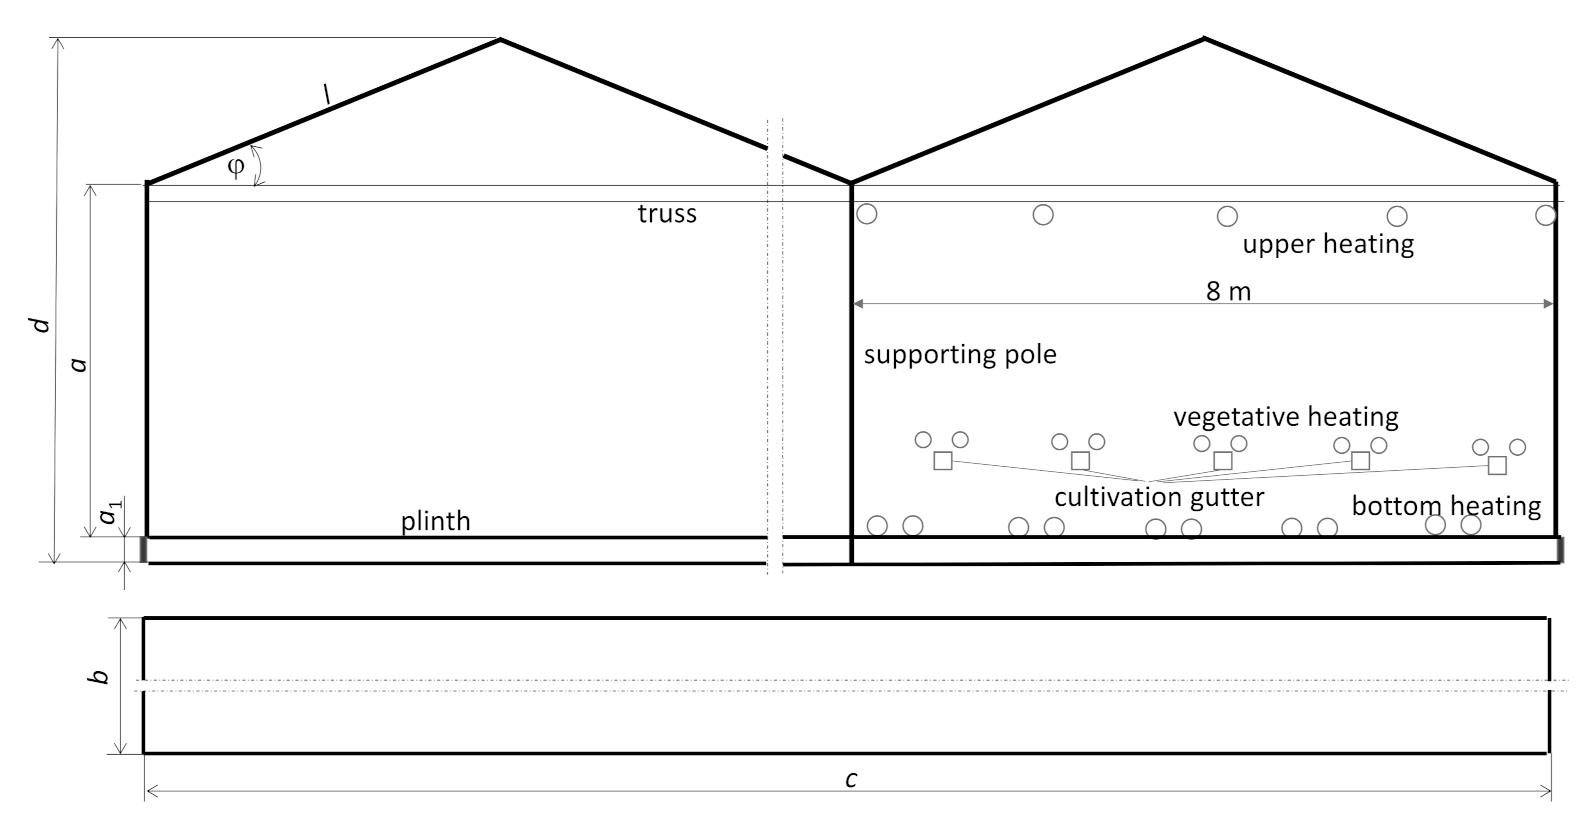
The analysis was carried out for a Venlo-type interlocking greenhouse with an area of 1 ha, which is covered with horticultural glass with a thickness of δg = 4 mm and with the following basic parameters: 8 m width of the cultivation aisle, 12 aisles, and a roof inclination angle of φ = 23°. The greenhouse is placed on the foundation. Figure 2 shows the scheme of the greenhouse under consideration.
The calculations of the heat demand can be carried out by designing a heating system based on the minimum ambient temperature (standard PN-EN ISO 52016-1) or based on basic heat transfer relationships. As the problem under consideration concerns a production greenhouse, the demand was calculated based on the second method. Table 2 presents the basic quantities adopted for the analysis.
The energy balance equation for a production facility combines the heat loss gains; under steady-state conditions, it can be written as [56]:
m a i r · c p , a i r d T i n T o u t d τ = q R a d q c o n q v e n
where mair is the mass of the air in the facility in kg; cp,air is the specific heat of moist air in J∙kg−1∙K−1; Tin is the temperature inside the greenhouse in °C; Tout is the temperature outside the facility in °C; τ is the time in s; qRad is the heat from solar radiation conversion in W; qcon is the heat loss stream through convection in W; qven is the heat loss stream through ventilation in W.
The heat flux (qRad) penetrating into a greenhouse due to radiation depends on the transparency coefficient of the partition (Lτ), the heat transfer surface (Ag), the solar radiation intensity (Rout), and the efficiency of the conversion process (η), which determines the amount of radiant energy converted into sensible heat. This is described by the relationship [57]:
q R a d = A g · L τ · η · R o u t
These calculations are based on the solar irradiance (W∙m−2), L = 0.9, and the efficiency of 0.9.
The heat gain and loss calculations were performed assuming that the air velocity inside the greenhouse does not exceed 0.5 m∙s−1 [58] and, therefore, natural convection occurs. The mean wind speed values (v) for the analysed region (for all months) were obtained from [59]. The range of the average velocity, depending on the month analysed, was between 2.6 (August) and 4.4 (January). Knowing the dimensions of the walls, the characteristic linear dimensions of the gable wall were calculated as the arithmetic mean of the side wall’s height (a) and the greenhouse height (d) with the formula:
l w , g = a + a 1 + d 2
The roof length (l) was taken as the characteristic linear dimension for the roof slope, i.e.,:
l w , r = l
In turn, the height of the side walls (a) was taken as the characteristic linear dimension, i.e.,:
l w , s = a
For the ground surface, the diagonal dimension (lg) of the surface was taken as the linear characteristic, where (b) was its length and (c) was the width of the ground:
l g = b 2 + c 2
To characterise the heat transfer process, it is necessary to determine the Reynolds number (Re) for the air parameters outside the greenhouse. In the calculations, the average monthly values of the temperature and, consequently, the kinematic viscosity of the air (ν), as well as the Re number, were calculated with the formula:
R e = v · l w ν
The Re number was calculated independently for the side walls, the roof, and the gable walls. Then, for the side walls, lw = lw,g; for the roof, lw = lw,r; for the walls, lw = lw,s. An averaged kinematic viscosity value was used in the calculations. The calculated ranges of Re values (for the average wind speed) are shown in Table 3.
The Re values illustrate the turbulent air movement outside the greenhouse. Hence, for further calculations, a correlation equation of the following form was used [60]:
N u o u t = 0.644 · R e 0.5 · P r 0.33
Inside the greenhouse, given the assumptions of the air velocity, the correlation equation for calculating the convective heat transfer coefficient for the vertical walls was calculated from [61]:
N u i n , g = C · G r i n · P r i n n
In order to find the values of the parameters C and n, the product of the numbers (Grin∙Prin) was calculated. Under the test conditions, the temperature of the inner surface of the glass was taken as equal to [62]:
t g _ i n = 0.6 · t o u t + 0.4 · t i n
After considering the ambient temperature and assuming the required temperatures of the cultivated plants (tin = 14 °C for the night period and tin = 20 °C for the day period), in the examined range of independent variables, the value of the product of the numbers (Grin∙Prin) was in the range of 4 × 10⁵ to 5.7 × 10⁵. The calculations included the year-round values of the air parameters inside the greenhouse as a consequence of the forcing conditions in the analysed facilities. It follows that there is a transient movement in the greenhouse; therefore, finally, Equation (8) takes the form:
N u i n , g = 0.54 · G r i n · P r i n 0.25
In turn, for a roof, the correlation equation takes the form:
N u i n , r = 0.54 · G r i n · P r i n · c o s φ 0.25
For the ground surface, assuming laminar flow, the Nusselt number was calculated from the formula:
N u i n , g = 0.135 · G r i n · P r i n 0.33
The characteristic dimension (occurring in Grashof’s Fourier transform) was taken to be lg. Finally, the convective heat transfer coefficient for the surfaces under consideration was calculated from the standard relationship:
h = N u · λ l
The characteristic dimensions lw,g, lw,r, and lg were assumed in the calculations. The coefficient of thermal conductivity of air (λ) was used for the averaged values of the ambient temperature and that inside the greenhouse.
Equations (15)–(18) resulted directly from the standard dependencies for calculating thermal problems [61]. Finally, the equivalent thermal resistance of the partition (calculated separately for the glass and the plinth) was calculated from the following formulas:
For   the   glass :   U g = 1 h i n + δ g λ g + 1 h o u t 1
For   the   plinth :   U p = 1 h i n + δ c λ c + δ s λ s + δ p λ p + 1 h o u t 1
Hence, the heat flux exchanged between the interior of the greenhouse and the surroundings can be described as:
q c o n = U g · A g + U p · A p · T i n T o u t
For the ground surface, it can be described as:
h i n , g = N u i n , g · λ i n l g
The heat loss rate to the ground in a greenhouse depends on the ground temperature (Tg, °C), the internal temperature (Tin, °C), the greenhouse surface area (Ag = b∙c, m2), the thermal conductivity of the ground (λg, W∙m−1 K−1), and the equivalent ground thickness (δg, m). The flux is described by the equation:
q g = A g · T i n T g 1 0.7 · h i n , g + δ g λ g
The calculation assumes that the soil in the greenhouse is concrete, the temperature (Tg) is the ambient temperature (Tout), and the layer thickness is δg = 2 m.
The ventilation heat flux (qven), considering the thermal resistance of the air flow, is described by the relation [63]:
q v e n = A g R L T i n T o u t
where Ag is the total surface area of the glass in m2, while the resistance RL = 0.5 m2∙K−1∙W−1.
The second issue to be determined is the estimation of the temperature of the water injected into the greenhouse. Schematically, the considered heating system is illustrated in Figure 3 with a marked heat exchange.
Starting from the elementary equation of the conservation of energy, this can be written as:
q i n = q l o s s + q o u t
where the heat flux at the duct entry (qIN) is described by:
q I N = V · π · d 2 4 · ρ · c w · T 1
q l o s s = U p · T 1 + T 2 2 T o u t · π · d o u t · l
q o u t = V · π · d 2 4 · ρ · c w · T 2
After ordering and transformation, the temperature at the end of the tube is given by the formula:
T 2 = V · d 2 · ρ · c w · T 1 2 · d o u t · l · U p · T o u t V · d 2 · ρ · c w + 2 · d o u t · l · U p
The heat transfer coefficient through the geothermal water supply line to the greenhouse (Up) was calculated from Equations (16) and (17), where the convective heat transfer coefficient (on the flowing-water side hin_p), having previously determined the Re and Pr numbers, was calculated with a correlation equation of the form:
N u = 0.023 · R e 0.8 · P r 0.33
while the convective penetration coefficient (hout_p) was calculated with the relation [43]:
h i n _ p = 4.0 v 0.7 d 0.3
The calculations assumed pre-insulated pipes manufactured on the basis of the following standards: PN-EN 10217:2004 and PN-EN253. It was assumed that the water velocity should be between 1.5 and 2.0 m∙s−1, and the conductivity coefficient of the insulation layer should be λis = 0.035 W∙m−1∙K−1.

2.2. Geothermal Heat Supply

The potential geothermal water resources in a given location can be expressed by the amount the geothermal power that it is possible to install on the site. This comprises the basic synthetic hydrogeological parameters, such as the well discharge and water temperature. The calculation of the power output (in W) was carried out with the following formula:
P = L F · Q · ϱ w   · T T i n j
where LF is the mean annual load factor of an intake, which is unitless; Q is the rated discharge of geothermal water in m3∙s−1; ρw is the density of geothermal water in kg∙m−3; cw is the specific heat of geothermal water in J∙kg−1∙°C−1; T is the temperature of the geothermal water produced in °C; Tinj is the temperature of the wastewater (i.e., geothermal water after heat recovery, which is injected back into the reservoir) in °C.
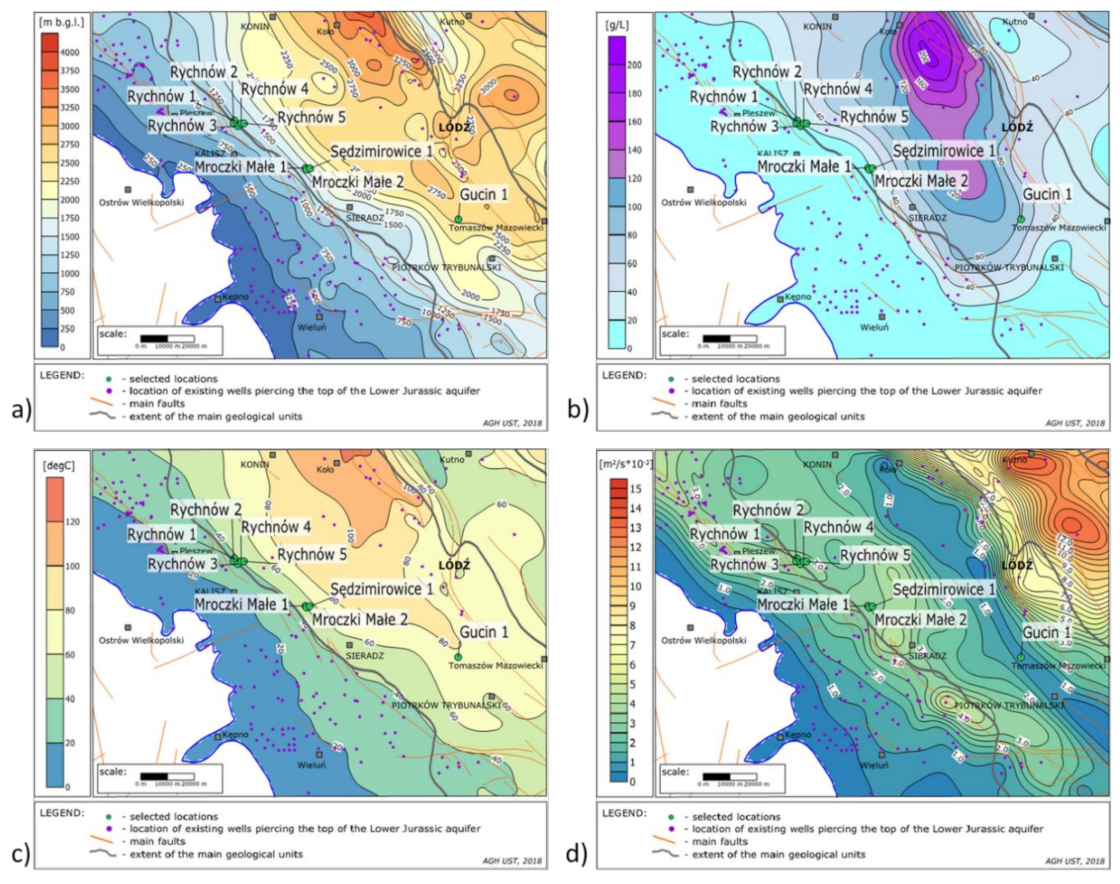
A map of the water reservoirs that are useful for geothermal installations within the Lower Cretaceous aquifer is shown in Figure 4. In the prevailing areas of the Lower Jurassic aquifer, the thermal power of the hypothetical geothermal installation (geothermal doublet) may exceed 2.5 MW. The highest values of the thermal power of the doublets (30–60 MW) are expected in the NE parts of the Mogilno-Łódź Trough, which is in the vicinity of Mogilno and east of Konin. Relatively high thermal power values can be presumed in the Warsaw Trough (south of Płock) and in the Szczecin Trough (Szczecin neighbourhood). Thermal power values below 10 MW occur in the marginal parts of the Warsaw and the Mogilno-Łódź Troughs, in the southern part of the Szczecin Trough, and in the Kujawy Block. The lowest values (<2.5 MW) were reported in the marginal parts of the Lower Jurassic aquifer. For the selected locations, the mineralization of the geothermal waters is relatively low. As shown in Figure 4b, it is about 20–40 g·L−1; only the location of Gucin shows a higher mineralization. The estimation of the cost of the system includes filters and their replacements. The temperature and enthalpy of the geothermal waters in Poland are too low to consider for economically profitable power generation (Figure 4c).
Figure 1 and Figure 4 are relevant to agricultural production with respect to production in greenhouses heated by geothermal heat. They present the geothermal provinces of Poland and the geothermal parameters of the rock masses in the area selected for the analysis.

2.3. Economic Analysis for Covering the Cooperative Demand for Geothermal Energy and the Traditional Heat Carriers

Time-sensitive economic evaluation indicators were used in the analysis: the NPV and IRR. The analysed solution was also an attempt to maximise the use of renewable energy and minimise the use of fossil fuels. In order to carry out the calculations, the following issues were analysed:
(a)
The heat consumption by the greenhouse facility;
(b)
The supply of heat from the geothermal intake;
(c)
The economic analysis of the coverage of the heating needs of greenhouse facilities by the geothermal intake.
The following assumptions were made for the economic analysis:
-
An average annual heat price increase of 1.5% (based on the average inflation rate in the last 5 years in Poland 1.31%);
-
A discount rate of 4%;
-
Possible co-financing of the investment at the level of 52.67% (according with the principles of project implementation in the Operational Program Infrastructure and Environment 2014–2020 in Poland);
-
A long-term perspective of the analysis—maximum 25 years; according to the EC Regulation for the energy sector: A reference period of 15–25 years should be adopted;
-
In the operating costs, renovations occurring once every 15 years were considered with a value of 10% of the investment costs.
The discount rate is adopted in accordance with the Guidelines of the Polish Minister of Investments and Development regarding the preparation of investment projects. In the financial analysis for investments planned for co-financing from EU funds, a financial discount rate should be 4% (for the analysis conducted at constant prices) [64,65].
In Poland, promotional activities are carried out for various types of renewable energy sources. In 2019, additional programs related to Renewable Energy Sources were launched in Poland, financed by the National Fund for Environmental Protection and Water Management: Energia Plus—with a pool of funds of 4000 million PLN, intended for projects aimed at reducing the negative impact of enterprises on the environment, in including, among others for the development of renewable energy sources: District Heating—a pilot project, with a pool of funds of 500 million PLN, intended for projects aimed at reducing the negative impact of heating companies on the environment, including for the development of renewable energy sources, Agroenergia—with a pool of funds of PLN 200 million, the purpose of which is comprehensive support related to the reduction of the negative environmental impact of agricultural activities, including through the development of renewable energy sources, Polska Geotermia Plus—with a pool of funds of PLN 600 million, the program of which is to increase the use of geothermal resources in Poland. The intensification of the support system for renewable energy sources in 2019 will contribute to the achievement of the target for the share of energy from renewable sources at the level of 15%. Financing institutions carry out complementary promotional activities and activities supporting the use of funds.
Time-sensitive evaluation indicators were used: the net present value (NPV) and internal rate of return (IRR). These are the primary methods used to evaluate the economic impacts of projects [66,67]
The NPV, which determines the difference between the discounted cash flows and the initial expenditure, was determined according to the relationship:
N P V = t = 1 n C F t 1 + r t I 0
where CFt represents the net cash flows in period t; r is the discount rate; I0 is the initial investment; t indicates consecutive periods of investment exploitation.
In the analysis of the financial flows, the costs were primarily considered, which could be avoided by implementing the analysed investment, i.e., heating the greenhouse with geothermal energy instead of heat from the grid. The financial resources saved constitute the profit of this solution. In the calculation of the investment profitability using the net present value method, all projects for which a positive NPV value was determined were considered profitable, which means that the profitability rate of a given project was higher than the limiting rate, i.e., the discount rate r; therefore, the project is economically viable. Projects for which the NPV is negative are economically unviable, while projects with an NPV of zero are treated as acceptable because their profitability is equal to the cap rate [68].
The size of the IRR, i.e., the discount rate for which the value of discounted flows is equal to the value of the investment, was determined according to the formula:
t = 1 n C F t 1 + I R R t I 0 = 0
For any investment project where IRR > r, the NPV is greater than zero and the difference between IRR and the discount rate r determines the financial security margin of the project.

2.4. Research Objects

The locations of greenhouse facilities were identified and selected by the University of Agriculture in Krakow. These locations were verified in terms of their geothermal potential at the AGH University of Science and Technology. The result of the research was the selection of the best geothermal objects. The following locations were considered prescient: Oszczeklin, Rychnów, Mroczki Małe, Sędzimirowice, and Gucin. Rychnów, MroczkiMałe, Śędzimirowice, and Gucin were selected for further analysis, as they are located in the Polish Lowlands [69,70]. Table 4 contains the following data: name, voivodship, poviat, well discharge, base depth (m b.g.l.), well discharge (m3∙h−1), J1-TDS (g∙L−1), J1-temperature (°C), thermal capacity (MW), and heat production in TJ∙a−1 and in MWh∙a−1 for a load coefficient of 1. In the analysis, only the Lower Jurassic J1 level was considered because the Lower Cretaceous K1 level was only prospective in the Gucin location. Although the temperature and thermal power are low at this location, it is necessary to verify the economic justification for the exploitation of this level during drilling [71].
The three final locations selected are presented in the tables below. Table 5 presents the location data, and Table 5 shows the geothermal data. For the final analysis the best locations were taken, which were: Sędzimirowice 1, Gucin 1, and Rychnów 5.
Detailed information regarding selected locations is presented in Figure 4. The data are depicted in the form of the geothermal aquifer’s base depth, temperature, mineralisation, and transmissivity maps. Two locations, Sędzimirowice 1 and Rychnów 5, are located on the border of an area with good geothermal parameters. However, the Gucin location has a reservoir at a lower depth, which allows a higher temperature of the geothermal water to be obtained; however, the drilling costs will be much higher.
Mineralisation is a parameter determining the usefulness of geothermal water for use in heating installations. Two locations, Sędzimirowice 1 and Rychnów 5, are located relatively shallow depths. Their geothermal water has low mineralisation. The Gucin location has a reservoir at a lower depth; therefore, the mineralisation of geothermal water is about three times higher. This is related to the more restrictive requirements for materials for the exchanger and equipment. In addition, there are more difficult conditions for injecting geothermal water into the rock mass. This results in higher costs.
The temperature is directly dependent on the greatest extent of the depth of the reservoir, which is why the water temperature in the location of Rychnów 5 is the lowest. For the deeper reservoir of Sędzimirowice, the temperature is higher, and for the deepest reservoir of Gucin, the temperature reaches the highest value. Transmissivity is the rate at which water is transmitted through a unit width of an aquifer under a unit hydraulic gradient. It is expressed as the product of the average hydraulic conductivity and the thickness of the saturated portion of an aquifer. Transmissivity is used to calculate the yield of a borehole, determine the safe yield of an aquifer system, and predict groundwater movement. Transmissivity (T) is directly proportional to horizontal hydraulic conductivity (K) and thickness (m), and is expressed as T = K m (m2·s−1). Lithologically, the Lower Jurassic aquifers are fine to equigranular sands and sandstones of variable thickness, interbedded with semi-permeable or impermeable claystones, sandy claystones, mudstones, and sandy mudstones. Permeable rocks constitute 40–80% of the total thickness of the sequence. Despite the horizontal variations with high vertical variability and numerous facies changes of the reservoir beds, it may be suggested that the underground waters saturating the permeable Lower Jurassic strata form a continuous aquifer. The local discontinuities that are known from some structural units are caused mostly by fault–block tectonics [43].
The thickness of the Lower Jurassic sediments is highly variable, which is a combined effect of the morphology of the pre-Mesozoic basement and of the lithological changes. The thickness of the aquifer is defined as the sum of the thicknesses of the permeable rocks in the profile, which are assumed to form a hydraulically connected aquifer. Analysis of both the archival and the authors’ data enables two groups of Lower Jurassic rocks to be distinguished, each of them showing different hydrogeological properties. The first group comprises practically impermeable rocks, where the open porosity coefficient does not exceed 0.1, the specific yield varies from 0.02 to 0.06, and the hydraulic conductivity ranges from 10−7 to 10−11 m∙s−1. The second group (fine- and medium-grained sandstones) can be regarded as water-bearing. The effective porosity changes from 0.15 to 0.33, the specific yield varies from 0.08 to 0.22, the hydraulic conductivity ranges from 10−5 to 10−7 m∙s−1, and the higher transmissivity is upscaled by the thickness of the water-bearing layers.
The cumulative thicknesses of the groundwater horizons in the selected locations were characterized with the average values over the entire extent of the aquifers, ranging from ca. 50 m in Gucin to over 100 m in the Rychnów–Mroczki–Sędzimirowice areas. Generally speaking, the thicknesses of water-bearing layers are much higher in the axial zone of the Mogilno-Łódź Trough (Rychnów–Mroczki–Sędzimirowice), which significantly affects the main hydrogeological parameters, including the hydraulic conductivity and transmissivity, which finally determine the discharge of the wells [43].
Geothermal waters with a TDS class over 10 g∙dm−3 are dominated by the Cl-Na hydrochemical type. The locations with specific energy capacities are able to provide energy to heat the specified areas. Assuming that the locations of the greenhouse facilities are in the direct vicinity of geothermal intakes and assuming a 3% heat loss, it was found that investments in particular locations would cover the energy demand of the following greenhouse areas [69]:
-
Gucin—4 or 6 m high greenhouse—6.66 or 5.91 ha;
-
Mroczki Małe—greenhouse with a height of 4 or 6 m—4.81 or 4.27 ha;
-
Rychnów—greenhouse with a height of 4 or 6m—1.50 or 1.33 ha.

3. Results

3.1. Heat Consumption of the Greenhouse Facility

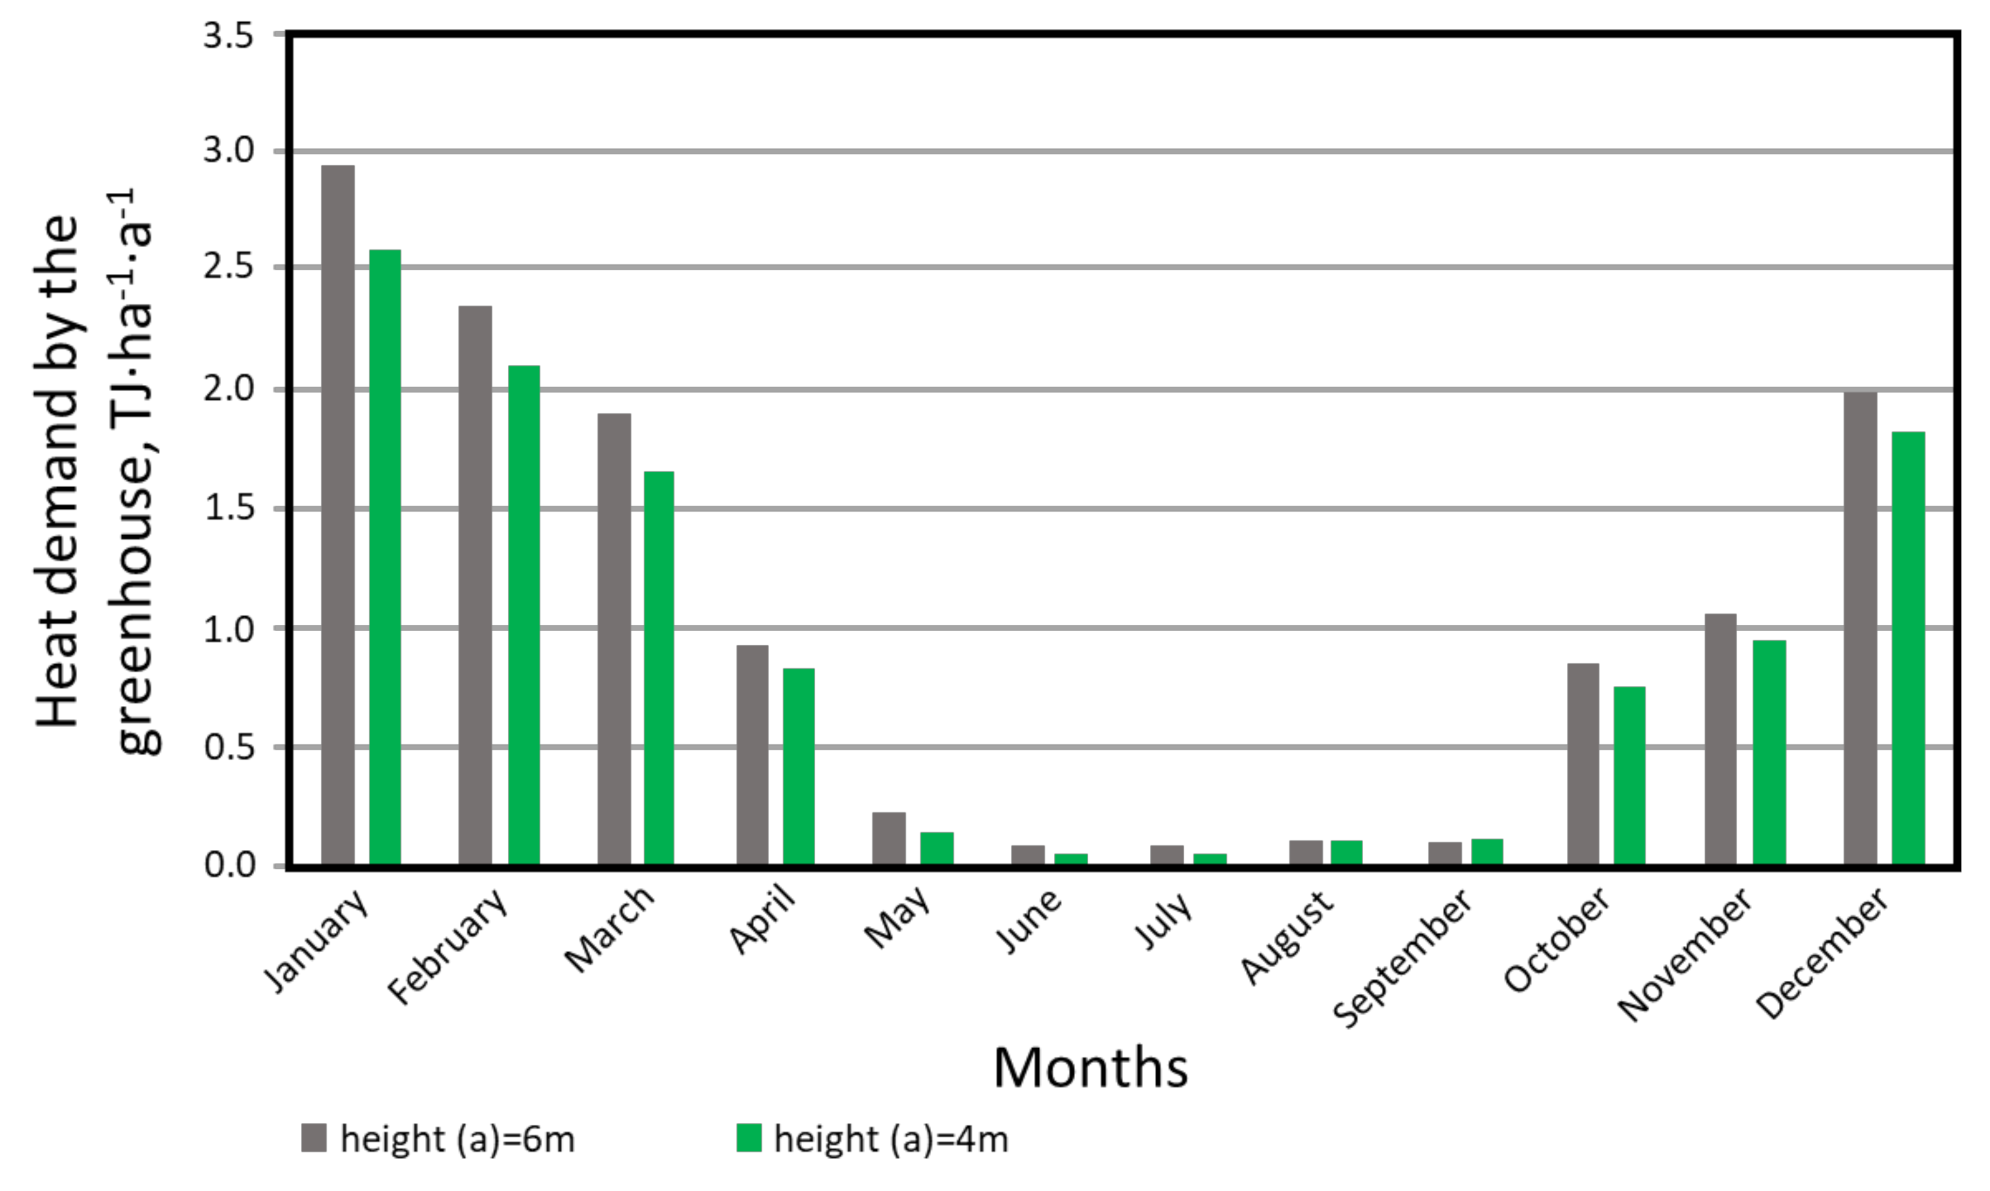
Based on publicly available multi-year average temperature values (obtained for the city of Kalisz), the heat demand in the growing season was calculated. It was assumed that the production process starts in mid-December and lasts until mid-November [69]. During the cultivation season, it was assumed that the temperature inside the facility would be 12 °C (night) and 20 °C (day). In the period from mid-December to the end of January (the period after planting the seedlings), the night temperature was assumed to be 14 °C. In the calculations, it was assumed that the temperature during the crop liquidation period from mid-November to mid-December would be 4 °C (night) and 10 °C (8:00 to 16:00). The calculations of the annual heat demand are graphically presented in Figure 5.
As can be seen, the maximum heat demand is in the month of January, and for 1 ha of greenhouses, it amounts to 2.54 TJ (4 m high) and 2.95 TJ (6 m high). In total, the annual heat demand for the greenhouses under consideration is 11.05 TJ (4 m high greenhouse) or 12.46 TJ of heat (for 6 m high greenhouse).
In addition, the reductions in the heating water temperature were determined for each of the analysed cases depending on the distance from the exchanger station (geothermal intake). The calculations were made for pre-insulated pipes according to the specifications of the manufacturers of the products based on the PN-EN 10217:2004 and PN-EN253 standards. The calculations of the final water temperature as a function of the distance between the exchanger station and the object are presented in Table 6.

3.2. Geothermal Heat Supply

Finally, three locations were selected: Gucin, MroczkiMałe/Sędzimirowice, and Rychnów. Their main characteristics are given in Table 7.
The overall economics of a geothermal power project are strongly influenced by the power output per well and how much can be reinjected, which are also considered when evaluating the drilling effectiveness [71].
A cost analysis was carried out on the basis of price lists for equipment and work that are used to estimate investments in Poland and on the basis of price inquiries with companies that produce equipment for geothermal energy production, as well as the National Fund for Environmental Protection and Water Management guidelines [64] (Table 8).
The average market prices of goods and services in the necessary amounts were adopted to estimate the costs. The prices were adopted on the basis of catalogues of products and equipment, price lists, consultations, and guidelines for the estimation of the costs of installation work. The sizes of the investment elements were adapted to the assumed capacity, flow, temperature, water mineralisation, and well depth. Prices may differ from those that were assumed due to differences in equipment suppliers and contractors. To perform the calculations, we chose plate-type heat exchangers, the best and most expensive versions of which are equipped with titanium plates (Table 3, Table 5 and Table 7). If we used exchangers with stainless steel plates (AISI 316L steel, signed in the EU as X2CrNiMo17-12-2/1.4404), the price of the heat exchangers would drop by three times, as shown in Table 3, Table 5 and Table 7. Steels of this group are used in elements for working in seawater environments, for installations in the chemical, paper, and food industries, in architectural elements, and for many other applications.
It was assumed that the wells were vertical and the distance between them was about 1 km in a straight line. To calculate the geothermal pipeline, it was assumed that its length would be 1.5 times the distance between wells.
At the beginning, it is necessary to consider the cost of the “geological work project”, which nets about 445,000 EUR for location 1. The next step is the analysis of the cost of drilling the wells, which is presented in Table 9. At this stage, it was assumed that the production and injection wells had the same geological and reservoir parameters.
The next component of the investment costs included the expenditures to be incurred in the construction of terrestrial infrastructure, including the costs of the production well equipment, the costs of the injection well equipment, the costs of the exchanger plant, and the costs of the geothermal pipeline. For these locations, the investment costs of the terrestrial infrastructure might differ from those that must be borne due to the equipment, technology used, and contractors of the work.
Similarly, in the Gucin location 2, the net costs of developing a “geological work project” were about 445,000 EUR net. At this stage of the analysis of the costs of drilling the wells, it was assumed that the production and injection wells had the same geological and reservoir parameters and the same depth. The analysis of the cost of drilling the wells is presented in Table 10.
The next component of the investment costs includes expenditures to be incurred in the construction of terrestrial infrastructure, including the costs of the production well equipment, the costs of the injection well equipment, the costs of the exchanger plant, and the costs of the geothermal pipeline. For the MroczkiMałe/Sędzimirowice location, the investment costs of the terrestrial infrastructure are shown in Table 5. The costs may differ from those that must be borne due to the equipment, technology used, and the contractors of the work [64].
In this location, the net costs of developing a “geological work project” are also about 445,000 EUR net. At this stage of the analysis of costs of drilling the wells, it was assumed that the production and injection wells had the same geological and reservoir parameters and the same depth. The analysis of the cost of drilling the wells is presented in Table 11.
Based on the current data, the net costs of the well equipment, the construction of a titanium heat exchanger, and the geothermal pipeline for the Gucin location are 1,834,069 EUR, for the MroczkiMałe/Sędzimirowice location, they are EUR 1,937,156, and for Rychnów, they are EUR 1,897,119.
This study assumes the following:
-
The calculated costs of drilling work are representative of the actual costs;
-
The costs of installation and construction work should be increased by 10% for unplanned expenses;
-
Annual operating costs are around 4% of the investment costs.
In Table 12, the operation and investment costs are presented.

3.3. Economic Investment Indicators

As mentioned, an analysis of the economic efficiency for the consumer in the process of heating the greenhouse facility using the geothermal intake was carried out. The costs of heating the facility with heat from the grid and heat from the geothermal intake were compared.
Based on current market conditions, the cost of 1 GJ of heat from the grid was set at 17 EUR, while that from the geothermal intake was set at 6 EUR. The avoided costs of heating the greenhouse are related to the implementation of the geothermal investment, and they represent savings for the consumer. The difference in the annual costs of heating a greenhouse with heat from the grid and with geothermal energy is significant and was treated as a return on investment, which is impossible to achieve without the investment in question.
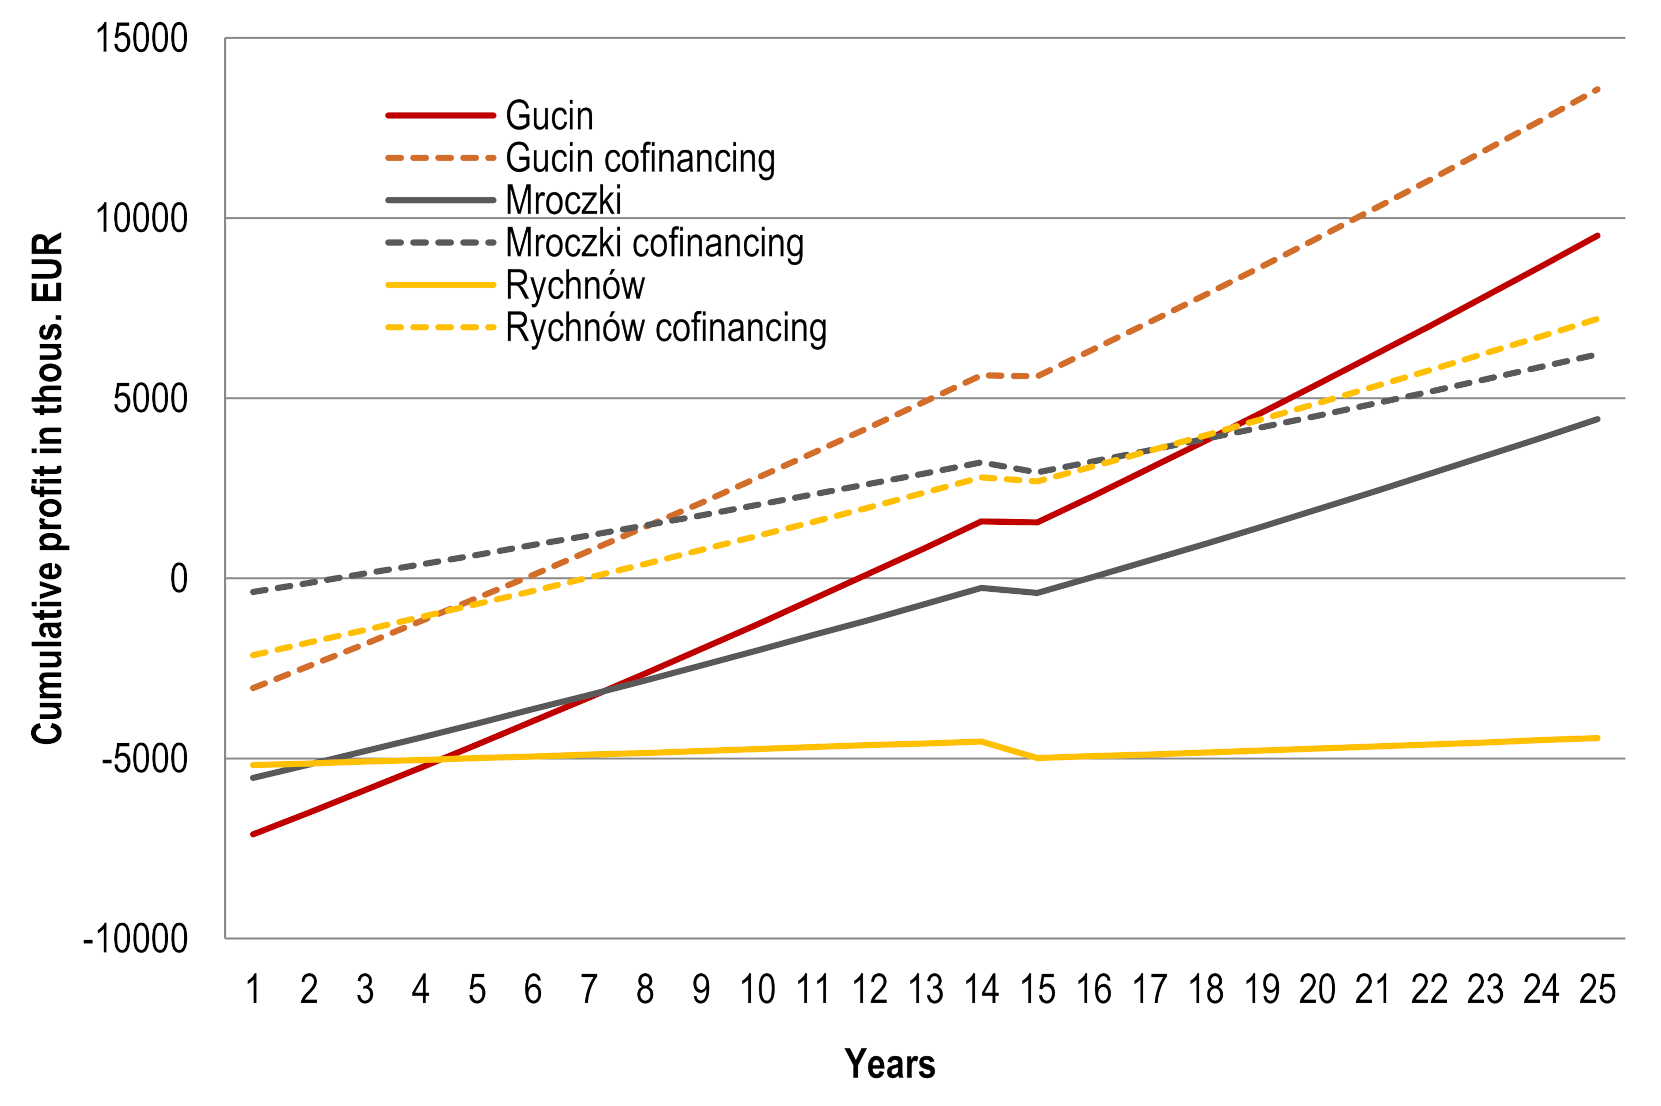
Figure 6 shows the cumulative profit over a 25 year period for the individual locations and variants that include the co-financing of investment costs. Profit was calculated as the difference between savings in geothermal heating costs and investment costs.
The NPV and IRR values were calculated for three periods: 15, 20, and 25 years. In addition, the variant with project co-financing (52.7%—supporting the production and distribution of energy from renewable sources) was considered. Detailed calculations are given in Table 13.
The results of this analysis clearly indicate the profitability of the geothermal investment implemented with external funding, regardless of the locations considered. Positive NPV values were also determined in this variant for the different analysis periods. After 15 years, the geothermal investment in the greenhouse facilities is profitable. The IRR value in these variants is also higher than the assumed 4% discount rate. On the other hand, the realization of the investment without co-financing is profitable only in certain locations and analysis periods. In Gucin, the investment is profitable in the 20 and 25 year periods, and after 25 years, the NPV is 2784.42 thous. EUR. In Mroczki, on the other hand, the investment is only viable in the 25-year analysis period. The investment in the Rychnów site is not economically viable without external financial support. It should be emphasised that the possibility of reducing investment and/or operating costs will also significantly influence the higher profitability of the undertaking. The non-measurable benefits related to the implementation of the analysed investment should also, e.g., reduction of the negative impact on the environment through a reduction of greenhouse gas emissions and a reduction of fossil fuel consumption (due to the reduction of heat consumption from the network).
The direct positive socioeconomic effects of the project include:
(a)
The use of geothermal sources to heat greenhouse facilities for production purposes;
(b)
The replacement of the primary energy consumption, which was estimated to be about 11.05 TJ·year−1 for a 4 m high greenhouse (or 12.46 TJ·year−1 for a 6 m high greenhouse);
(c)
Avoidance of greenhouse gas emissions,
(d)
An increase in the share of Renewable Energy Sources in the energy balance.
The use of geothermal water for cultivation/heating in greenhouses allows the production cycle to take place throughout the year while reducing energy costs. There are no research results that confirm the economic viability of building geothermal intakes for year-round cultivation in greenhouses. Despite the lack of research in the area indicated in the available literature, similar areas of interest have been identified in the following works.
The results of research in the area of southern and eastern Serbia showed the economic results of using geothermal water in modern greenhouses for flower and vegetable production. The main objective of the research was to identify the economic results with respect to the specificities of flower and vegetable production in modern greenhouses and to determine the gross refund margin (gross financial result) in the production of cut flowers (i.e., roses, gerbera, and calla) and vegetables (e.g., tomato, cucumber, and pepper) on the basis of the analysis. Based on the variable costs, it was found that the best results can be expected for roses (cut flower production line) and tomatoes (vegetable production line) [72]. The agricultural applications of geothermal energy were the focus of attention in the early stages of direct geothermal energy use in Europe, e.g., in Hungary, Macedonia, Bulgaria, and Serbia. Nowadays the focus seems to be on district heating systems, integrated systems, large balneological/tourist resorts, etc. However, the potential of geothermal energy for agriculture is worth exploiting. Interesting analyses in this area were presented in [73], which analysed the problems related to the development of agricultural applications of geothermal energy in different regions of Europe and ways to promote this sector. The analysis showed that agricultural uses of geothermal energy do not interfere with modern trends in direct geothermal development in Europe. On the contrary, they can improve the economic aspects of any district heating system or integrated system, offering excellent opportunities for cascading geothermal water and combinations of users with different daily/nightly and seasonal heat demands.

4. Conclusions

This work, which considers Polish conditions related to available geothermal energy sources, investment conditions (both geothermal energy sources and greenhouses), and current prices, confirmed the following claims. The methodology used to calculate the energy demand of a greenhouse and the economic efficiency of the investment is universal and applicable to similar analyses. The calculations are made from the perspective of the user/owner of the greenhouse, who needs a certain amount of energy to heat the greenhouse for the whole year’s production. Owing to the use of geothermal energy, this user/owner avoids the high costs of energy services from the grid, which represent a profit to be understood as the value from the investment, which is impossible to achieve without the analysed investment. The use of this approach in research is innovative, representing an original approach and value for potential users/investors.
A limitation of the work results from the fact that the undertaken research is strictly connected with the location; for each location, separate analyses that consider the specificities of geothermal deposits, which are also connected with investment and exploitation costs, should be carried out. The individual conditions of geothermal intakes largely determine the final effectiveness of a project. This analysis considered the currently valid prices of thermal energy in Poland. These conditions will be different for different countries, as they result from specific market conditions and government regulations in a given country. The overall economics of a geothermal power project are strongly influenced by the power output per well and how much can be reinjected, which are also considered when evaluating the drilling effectiveness. The distance of a greenhouse facility from the boreholes must always be considered in the analysis, as it influences the amount of heat loss. The heat losses will increase in direct proportion to the distance of the intake from the greenhouse facility. In this study, the location of the greenhouse was assumed to be in the immediate vicinity of the intake.
Verification tests will be conducted in a facility powered by geothermal energy. Another field of activity that will have an economic impact involves the modification of equipment and technologies for drilling (differing in costs) and an analysis of the combination of the considered system with the energy resulting from the conversion of solar radiation with photovoltaic panels.

Author Contributions

Conceptualization, S.K., M.J., M.G., A.K.-B., and U.Z.; methodology, S.K., M.J., M.G., A.K.-B., and U.Z.; software, S.K., M.J., M.G., A.K.-B., and U.Z.; validation, S.K., M.J., M.G., A.K.-B., and U.Z.; for-mal analysis, S.K., M.J., M.G., A.K.-B., and U.Z.; investigation, S.K., M.J., M.G., A.K.-B., and U.Z.; resources, S.K., M.J., M.G., A.K.-B., and U.Z.; data curation, S.K., M.J., M.G., A.K.-B., and U.Z.; writing—original draft preparation, S.K., M.J., M.G., A.K.-B., and U.Z.; writing—review and editing, S.K., M.J., M.G., A.K.-B., and U.Z.; visualization, S.K., M.J., M.G., A.K.-B., and U.Z.; supervision, S.K., M.J., M.G., A.K.-B., and U.Z.; project administration, S.K., M.J., M.G., A.K.-B., and U.Z.; funding acquisition, S.K., M.J., M.G., A.K.-B., and U.Z. All authors have read and agreed to the published version of the manuscript.

Funding

This research received no external funding.

Institutional Review Board Statement

Not applicable.

Informed Consent Statement

Not applicable.

Acknowledgments

This work was supported by the Ministry of Science and Higher Education of the Republic of Poland.

Conflicts of Interest

The authors declare no conflict of interest. The funders had no role in the design of the study; in the collection, analyses, or interpretation of data; in the writing of the manuscript, or in the decision to publish the results.

References

  1. Adib, R.; Murdock, H.; Appavou, F.; Brown, A.; Epp, B.; Leidreiter, A.; Lins, C.; Murdock, H.; Musolino, E.; Petrichenko, K. Renewables 2015 Global Status Report; REN21 Secretariat: Paris, France, 2015. [Google Scholar]
  2. Gupta, H.K.; Roy, S. Geothermal Energy: An Alternative Resource for the 21st Century; Elsevier Science: Hyderabad, India, 2006; p. 292. [Google Scholar]
  3. Huttrer, G.W. Geothermal Power Generation in the World 2015-2020 Update Report; World Geothermal Congress; International Geothermal Association: Reykjavik, Iceland, 2020; p. 17. [Google Scholar]
  4. Nelson, A. 2017 Outlook: Geothermal is Trending Upwards. Renew. Energy World 2017, 3. Available online: www.renewableenergyworld.com/baseload/2017-outlook-geothermal-is-trending-upwards/#gref (accessed on 20 February 2021).
  5. Hou, J.; Cao, M.; Liu, P. Development and utilization of geothermal energy in China: Current practices and future strategies. Renew. Energy 2018, 125, 401–412. [Google Scholar] [CrossRef]
  6. Bertani, R. Long-term projections of geothermal-electric development in the world. In Proceedings of the 2009 Geothermal Exposition & Congress, Offenburg, Germany, 25–29 April 2009; pp. 5–6. [Google Scholar]
  7. Edenhofer, O.; Pichs-Madruga, R.; Sokona, Y.; Seyboth, K.; Kadner, S.; Zwickel, T.; Eickemeier, P.; Hansen, G.; Schlömer, S.; von Stechow, C. Renewable Energy Sources and Climate Change Mitigation: Special Report of the Intergovernmental Panel on Climate Change; Cambridge University Press: New York, NY, USA, 2011; p. 1075. [Google Scholar]
  8. Directive 2009/28/EC of the European Parliament and of the Council, of 23 April 2009, on the promotion of the use of energy from renewable sources and amending and subsequently repealing Directives 2001/77/EC and 2003/30/EC. Available online: eur-lex.europa.eu/legal-content/EN/ALL/?uri=CELEX%3A32009L0028 (accessed on 20 February 2021).
  9. Benli, H. A performance comparison between a horizontal source and a vertical source heat pump systems for a greenhouse heating in the mild climate Elazig, Turkey. Appl. Therm. Eng. 2013, 50, 197–206. [Google Scholar] [CrossRef]
  10. Florides, G.A.; Pouloupatis, P.D.; Kalogirou, S.; Messaritis, V.; Panayides, I.; Zomeni, Z.; Partasides, G.; Lizides, A.; Sophocleous, E.; Koutsoumpas, K. The geothermal characteristics of the ground and the potential of using ground coupled heat pumps in Cyprus. Energy 2011, 36, 5027–5036. [Google Scholar] [CrossRef]
  11. Bayer, P.; Rybach, L.; Blum, P.; Brauchler, R. Review on life cycle environmental effects of geothermal power generation. Renew. Sustain. Energy Rev. 2013, 26, 446–463. [Google Scholar] [CrossRef]
  12. Casasso, A.; Sethi, R.; Pot, G. A quantitative method for the assessment and mapping of the shallow geothermal potential. Energy 2016, 106, 765–773. [Google Scholar] [CrossRef]
  13. Liu, X.; Falcone, G.; Alimonti, C. A systematic study of harnessing low-temperature geothermal energy from oil and gas reservoirs. Energy 2018, 142, 346–355. [Google Scholar] [CrossRef] [Green Version]
  14. Nalla, G.; Shook, G.M.; Mines, G.L.; Bloomfield, K.K. Parametric sensitivity study of operating and design variables in wellbore heat exchangers. Geothermics 2005, 34, 330–346. [Google Scholar] [CrossRef] [Green Version]
  15. Alimonti, C.; Soldo, E.; Bocchetti, D.; Berardi, D. The wellbore heat exchangers: A technical review. Renew. Energy 2018, 123, 353–381. [Google Scholar] [CrossRef]
  16. Immanuel, L.G.; Almas, G.S.F.U.; Dimas, T.M. Experimental design of wellbore heat exchanger in binary optimization for Low-Medium enthalpy to utilize non-self-discharge wells in Indonesia. In Proceedings of the 43rd Workshop on Geothermal Reservoir Engineering, Stanford, CA, USA, 12–14 February 2018. SGP-TR-213. [Google Scholar]
  17. Alimonti, C.; Soldo, E. Study of geothermal power generation from a very deep oil well with a wellbore heat exchanger. Renew. Energy 2016, 86, 292–301. [Google Scholar] [CrossRef]
  18. Gharibi, S.; Mortezazadeh, E.; Bodi, S.J.H.A.; Vatani, A. Feasibility study of geothermal heat extraction from abandoned oil wells using a U-tube heat exchanger. Energy 2018, 153, 554–567. [Google Scholar] [CrossRef]
  19. Kujawa, T.; Nowak, W.; Stachel, A. Utilization of existing deep geological wells for acquisitions of geothermal energy. Energy 2006, 31, 644–650. [Google Scholar] [CrossRef]
  20. Cheng, W.L.; Li, T.T.; Nian, Y.L.; Wang, C.L. Studies on geothermal power generation using abandoned wells. Energy 2013, 59, 248–254. [Google Scholar] [CrossRef]
  21. Cheng, W.L.; Li, T.T.; Nian, Y.L.; Xie, K. Evaluation of working fluids for geothermal power generation from abandoned oil wells. Appl. Energy 2014, 118, 238–245. [Google Scholar] [CrossRef]
  22. Adinolfi, M.; Maiorano, R.M.S.; Mauro, A.; Massarotti, N.; Aversa, S. On the influence of thermal cycles on the yearly performance of an energy pile. Geomech. Energy Environ. 2018, 16, 32–44. [Google Scholar] [CrossRef]
  23. Mauro, A.; Grossman, J.C. Street-heat: Controlling road temperature via low enthalpy geothermal energy. Appl. Therm. Eng. 2017, 110, 1653–1658. [Google Scholar] [CrossRef]
  24. Li, Q.; Yin, Y.; Kong, L.; Qiao, L. Enhancing heat transfer in the heat exchange medium of energy piles. J. Build. Eng. 2021, 40, 102375. [Google Scholar] [CrossRef]
  25. Wight, N.M.; Bennett, N.S. Geothermal energy from abandoned oil and gas wells using water in combination with a closed wellbore. Appl. Therm. Eng. 2015, 89, 908–915. [Google Scholar] [CrossRef]
  26. Sanner, B.; Karytsas, C.; Mendrinos, D.; Rybach, L. Current status of ground source heat pumps and underground thermal energy storage in Europe. Geothermics 2003, 32, 579–588. [Google Scholar] [CrossRef]
  27. Bayer, P.; Saner, D.; Bolay, S.; Rybach, L.; Blum, P. Greenhouse gas emission savings of ground source heat pump systems in Europe: A review. Renew. Sustain. Energy Rev. 2011, 16, 1256–1267. [Google Scholar] [CrossRef]
  28. Chiavetta, C.; Tinti, F.; Bonoli, A. Comparative life cycle assessment of renewable energy systems for heating and cooling. Procedia Eng. 2011, 21, 591–597. [Google Scholar] [CrossRef] [Green Version]
  29. Bayer, P.; de Paly, M.; Beck, M. Strategic optimization of borehole heat exchanger field for seasonal geothermal heating and cooling. Appl. Energy 2014, 136, 445–453. [Google Scholar] [CrossRef]
  30. Sethi, V.P.; Sharma, S.K. Greenhouse heating and cooling using aquifer water. Energy 2007, 32, 1414–1421. [Google Scholar] [CrossRef]
  31. Anifantis, A.S.; Pascuzzi, S.; Scarascia-Mugnozza, G. Geothermal source heat pump performance for a greenhouse heating system: An experimental study. J. Agric. Eng. 2016, 47, 164–170. [Google Scholar] [CrossRef] [Green Version]
  32. Tinti, F.; Barbaresi, A.; Torreggiani, D.; Brunelli, D.; Ferrari, M.; Verdecchia, A.; Bedeschi, E.; Tassinari, P.; Bruno, R. Evaluation of efficiency of hybrid geothermal basket/air heat pump on a case study winery based on experimental data. Energy Build. 2017, 151, 365–380. [Google Scholar] [CrossRef]
  33. Capozza, A.; de Carli, M.; Zarrella, A. Design of borehole heat exchangers for ground-source heat pumps: A literature review, methodology comparison and analysis on the penalty temperature. Energy Build. 2012, 55, 369–379. [Google Scholar] [CrossRef]
  34. Choab, N.; Allouhi, A.; El Maakoul, A.; Kousksou, T.; Saadeddine, S.; Jamil, A. Review on greenhouse microclimate and application: Design parameters, thermal modelling and simulation, climate controlling technologies. Sol. Energy 2019, 191, 109–137. [Google Scholar] [CrossRef]
  35. Fabrizio, E. Energy reduction measures in agricultural greenhouses heating: Envelope, systems and solar energy collection. Energy Build. 2012, 53, 57–63. [Google Scholar] [CrossRef]
  36. Djevic, M.; Dimitrijevic, A. Energy consumption for different greenhouse constructions. Energy 2009, 34, 1325–1331. [Google Scholar] [CrossRef]
  37. Ansari, S.A.; Kazim, M.; Khaliq, M.A.; Ratlamwala, T.A.H. Thermal analysis of multigeneration system using geothermal energy as its main power source. Int. J. Hydrog. Energy 2020, 46, 4724–4738. [Google Scholar] [CrossRef]
  38. Parikhani, T.; Gholizadeh, T.; Ghaebi, H.; Sattari Sadat, S.M.; Sarabi, M. Exergoeconomic optimization of a novel multigeneration system driven by geothermal heat source and liquefied natural gas cold energy recovery. J. Clean. Prod. 2019, 209, 550–571. [Google Scholar] [CrossRef]
  39. Ebadollahi, M.; Rostamzadeh, H.; Pedram, M.Z.; Ghaebi, H.; Amidpour, M. Proposal and assessment of a new geothermal-based multigeneration system for cooling, heating, power, and hydrogen production, using LNG cold energy recovery. Renew. Energy 2019, 135, 66–87. [Google Scholar] [CrossRef]
  40. Wang, W.; Wang, J.; Lu, Z.; Wang, S. Exergoeconomic and exergoenvironmental analysis of a combined heating and power system driven by geothermal source. Energy Convers. Manag. 2020, 211, 112765. [Google Scholar] [CrossRef]
  41. Janowski, M.; Hajto, M.; Kurpaska, S.; Latała, H.; Gliniak, M.; Herbuś, H. Geothermal energy potential for Polish greenhouse sector. Geol. Explor. Technol. Geotherm. Energy Sustain. Dev. 2018, 1, 207–209. [Google Scholar]
  42. Żelaźniewicz, A.; Aleksandrowski, P.; Buła, Z.; Karnkowski, P.; Konon, A.; Oszczypko, N.; Ślączka, A.; Żaba, J.; Żytko, K. Tectonic Subdivision of Poland; Komitet Nauk Geologicznych PAN: Wrocław, Poland, 2011; pp. 20–24. [Google Scholar]
  43. Hajto, M.; Janowski, M. Geothermal Potential for the Greenhouse Sector in Poland: Phase 3—Final Report. Stage 5, Checking Geothermal Potential of 3 Locations (More in-Depth Analysis); Wageningen University & Research; AGH University of Science and Technology; Agricultural University in Krakow; Blue Fifty B.V.; Certhon Build B.V.: Krakow, Poland, 2018; p. 14. [Google Scholar]
  44. Górecki, W.; Hajto, M. Atlas of Geothermal Resources of Mesozoic Formations in the Polish Lowlands; AGH University of Science and Technology: Kraków, Poland, 2006. [Google Scholar]
  45. Górecki, W.; Hajto, M.; Strzetelski, W.; Szczepański, A. Dolnokredowy oraz dolnojurajski zbiornik wód geotermalnych na Niżu Polskim. Przegląd Geol. 2010, 58, 589–593. [Google Scholar]
  46. Górecki, W.; Sowiżdżał, A. (Eds.) Geothermal Atlas of the Carpathian Foredeep; AGH University of Science and Technology: Kraków, Poland, 2012. [Google Scholar]
  47. Dowgiałło, J. The Sudetic geothermal region of Poland-new findings and further prospects. In Proceedings of the World Geothermal Congress, Kyushu-Tohoku, Japan, 10 June 2000; pp. 1–6. [Google Scholar]
  48. Hajto, M. Geothermal resources and possibilities of its utilization in Poland. In Złoża Kopalin—Aktualne Problemy Prac Poszukiwawczych, Badawczych i Dokumentacyjnych. IV Ogólnopolska Konferencja Naukowa, Warsaw, Poland, 15–17 March 2013; Pańczyk, M., Ed.; MNiSW: Warsaw, Poland; pp. 29–30.
  49. Kepińska, B. Przegląd stanu wykorzystania energii geotermalnej w Polsce w latach 2013–2015. Geol. Explor. Technol. Geotherm. Energy Sustain. Dev. 2016, 1, 19–36. [Google Scholar]
  50. Longa, F.D.; Nogueira, L.P.; Limberger, J.; van Wees, J.D.; van der Zwaan, B. Scenarios for geothermal energy deployment in Europe. Energy 2020, 206, 118060. [Google Scholar] [CrossRef]
  51. Grabowski, Ł.; Gliniak, M.; Polek, D.; Gruca, M. Cost-assessment Analysis of Local Vehicle Scrapping Facility. IOP Conf. Ser. Earth Environ. Sci. 2017, 95, 022007. [Google Scholar] [CrossRef]
  52. Waląg, P.; Gliniak, M. The Dualism of Deindustrialisation and Innovation. In Proceedings of the 36th International Business Information Management Association (IBIMA), Granada, Spain, 4–5 November 2020; IBIMA: King of Prussia, PA, USA, 2020. ISBN 978-0-9998551-5-7. [Google Scholar]
  53. Gliniak, M. Building Life Cycle Analysis as A Tool Supporting Environmental Decision-Making Processes. In Proceedings of the 36th International Business Information Management Association (IBIMA), Granada, Spain, 4–5 November 2020; IBIMA: King of Prussia, PA, USA, 2020. ISBN 978-0-9998551-5-7. [Google Scholar]
  54. Ghoreishi-Madiseh, S.A.; Kuyuk, A.F. A techno-economic model for application of geothermal heat pump systems. Energy Procedia 2017, 142, 2611–2616. [Google Scholar] [CrossRef]
  55. Marchioni, A.; Magni, C.A. Investment decisions and sensitivity analysis: NPV-consistency of rates of return. Eur. J. Oper. Res. 2018, 268, 361–372. [Google Scholar] [CrossRef] [Green Version]
  56. Seginer, I. Alternative design formulae for the ventilation rate of greenhouses. J. Agric. Eng. Res. 1997, 68, 355–365. [Google Scholar] [CrossRef]
  57. Roy, J.C.; Boulard, T.; Kittas, C.; Wang, S. Convective and ventilation transfers in greenhouse, Part I. Biosyst. Eng. 2002, 83, 1–20. [Google Scholar] [CrossRef] [Green Version]
  58. Pakari, A.; Ghani, S. Airflow assessment in a naturally ventilated greenhouse equipped with wind towers: Numerical simulation and wind tunnel experiments. Energy Build. 2019, 199, 1–11. [Google Scholar] [CrossRef]
  59. Data for energy calculations of buildings. Polish Minister of Investments and Development. 2018. Available online: https://archiwum.miir.gov.pl (accessed on 7 January 2021). (In Polish)
  60. Bejan, A. Convection Heat Transfer; John Wiley & Sons, Inc.: Hoboken, NJ, USA, 2013. [Google Scholar]
  61. Wiśniewki, S.; Wiśniewski, T.S. Heat Exchange; Wydawnictwo Naukowo-Techniczne: Warsaw, Poland, 2010. [Google Scholar]
  62. Kurpaska, S. Energy effects during using the glass with different properties in a heated greenhouse. Tech. Sci. 2014, 17, 351–360. [Google Scholar]
  63. Nemś, A.; Nemś, M.; Świder, K. Analysis of the Possibilities of Using a Heat Pump for Greenhouse Heating in Polish Climatic Conditions—A Case Study. Sustainability 2018, 10, 3483. [Google Scholar] [CrossRef]
  64. Janowski, M.; Hajto, M. Geothermal Potential for the Greenhouse Sector in Poland: Phase 3—Prepare Final Report. Stage 6, Determine Geothermal Heat Concept; Wageningen University & Research; AGH University of Science and Technology; Agricultural University in Krakow; Blue Fifty B.V.; Certhon Build B.V.: Krakow, Poland, 2018; p. 17. [Google Scholar]
  65. Guidelines on issues related to the preparation of investment projects, including income-generating and hybrid projects for 2014–2020 MIiR/2014-2020/7(3). Polish Minister of Investments and Development. 2019. Available online: https://www.funduszeeuropejskie.gov.pl (accessed on 18 February 2021). (In Polish)
  66. Alyamani, R.; Long, S.; Nurunnabi, M. Exploring the Relationship between Sustainable Projects and Institutional Isomorphisms: A Project Typology. Sustainability 2020, 12, 3668. [Google Scholar] [CrossRef]
  67. Moynihan, G.P.; Triantafillu, D. Energy savings for a manufacturing facility using building simulation modeling: A case study. Eng. Manag. J. 2012, 24, 73–84. [Google Scholar] [CrossRef]
  68. Abdelhady, S. Performance and cost evaluation of solar dish power plant: Sensitivity analysis of levelized cost of electricity (LCOE) and net present value (NPV). Renew. Energy 2021, 168, 332–342. [Google Scholar] [CrossRef]
  69. Gliniak, M.; Kurpaska, S.; Tabor, J.; Karbowniczak, A. Geothermal Potential for the Greenhouse Sector in Poland: Phase 3—Map Main Greenhouses. Stage 2; Wageningen University & Research; AGH University of Science and Technology; Agricultural University in Krakow; Blue Fifty B.V.; Certhon Build B.V: Krakow, Poland, 2018; p. 49. [Google Scholar]
  70. Jarzyna, J.A.; Baudzis, S.; Janowski, M.; Puskarczyk, E. Geothermal Resources Recognition and Characterization on the Basis of Well Logging and Petrophysical Laboratory Data, Polish Case Studies. Energies 2021, 14, 850. [Google Scholar] [CrossRef]
  71. Janowski, M.; Hajto, M. Geothermal Potential for the Greenhouse Sector in Poland: Phase 1—Mapping & Screening. Stage 1, Map General Geothermal Potential (Comprehensive Analysis); Wageningen University & Research; AGH University of Science and Technology; Agricultural University in Krakow; Blue Fifty B.V.; Certhon Build B.V.: Krakow, Poland, 2018; p. 17. [Google Scholar]
  72. Subić, J.; Nastić, L.; Bekić, B. Economic Effects of Using Geothermal Waters in the Production of Flowers and Vegetables in Glasshouses. Procedia Econ. Financ. 2015, 22, 131–140. [Google Scholar] [CrossRef] [Green Version]
  73. Popovski, K.; PopovskaVasilevska, S. Prospects and problems for geothermal use in agriculture in Europe. Geothermics 2003, 32, 545–555. [Google Scholar] [CrossRef]
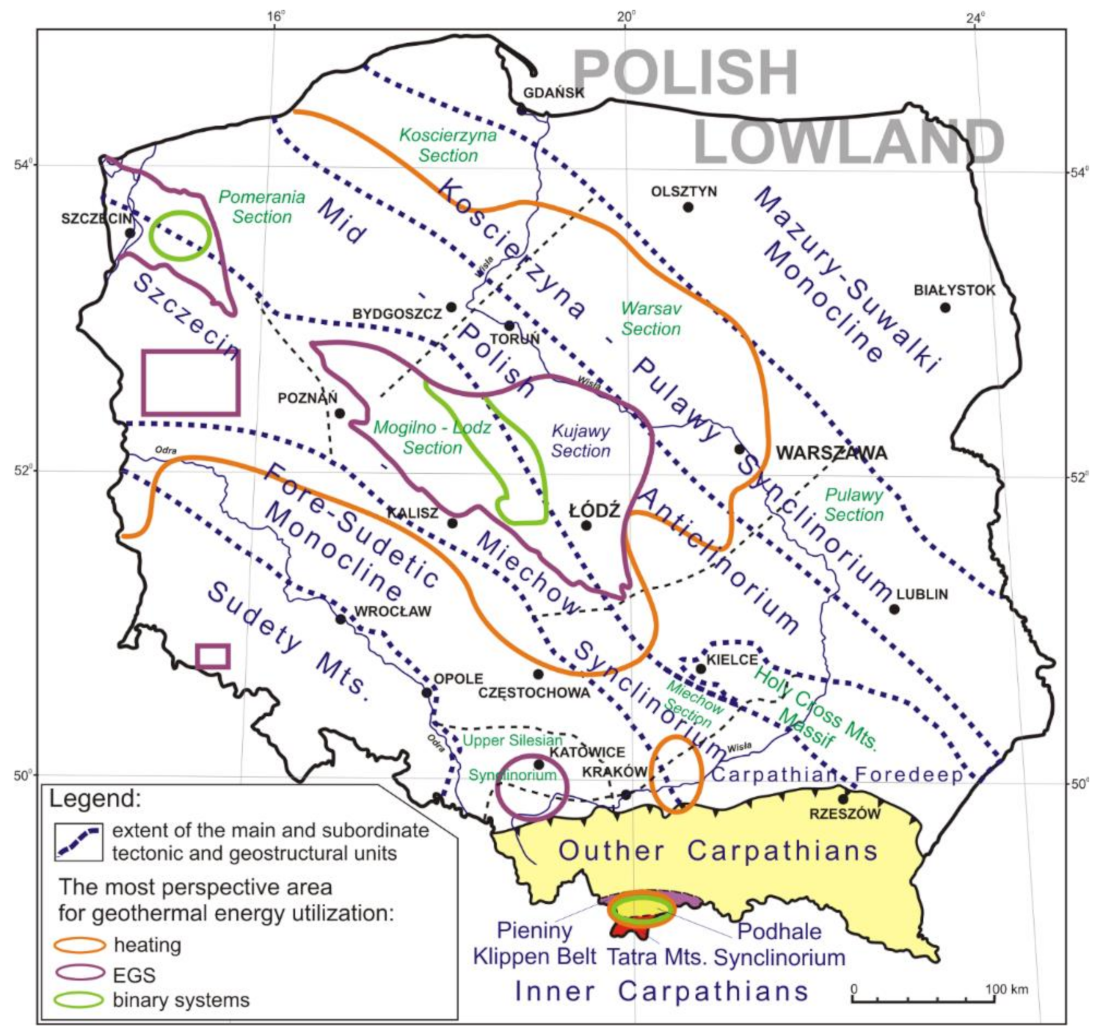
Figure 1. Tectonic units of Poland under the Cenozoic cover with the most prospective areas for geothermal energy use in Poland [43]. Reproduced from [42], modified by Hajto.
Energies 14 02618 g001
Figure 2. Scheme of the greenhouse under consideration.
Energies 14 02618 g002
Figure 3. Scheme of a greenhouse heating system powered by a geothermal source and a peaking boiler.
Energies 14 02618 g003
Figure 4. Location of the prospective areas on the background of: (a) the base-depth map of the Lower Jurassic geothermal aquifer, (b) the water mineralization map of the Lower Jurassic geothermal aquifer, (c) the temperature distribution at the top of the Lower Jurassic geothermal aquifer, and (d) the transmissivity of the Lower Jurassic geothermal aquifer [43].
Energies 14 02618 g004
Figure 5. Heat demand of a greenhouse with a wall height of 6 or 4 m.
Energies 14 02618 g005
Figure 6. Cumulative profit in a 25 years period for the three analysed locations.
Energies 14 02618 g006
Table 1. Geothermal district heating (GeoDH) plants in Poland, 2020 [49].
LocationSinceOutflow Water Temperature
(°C)
Cumulative Water Flow Rate
(m3∙h−1)
Mineralization
(g·L−1)
Geoth. Capacity
Installed (MWth)
Total Capacity Installed (MWth)2015
Geo-Heat Sales
(TJ)
Podhale199382-869602.2540.782.6393.0
Mszczonów200042600.53.78.315.8
Poddębice2013682520.410.010.015.0
Uniejów2006681206.63.27.419.2
Pyrzyce1994613601126.022.054.6
Stargard20128318011512.612.6168.0
Total76.2142.9-
Table 2. Characteristic parameters of the analysed greenhouse.
ParameterAbbreviation, UnitValue
Dimensions of the objectsb, m104
c, m96
Roofl, m4.32
Ad, m210,800
g, W∙m−1∙K−10.65
Wallsa, m4 (6)
d, m5.64 (7.64)
Ar, m2914 (1313)
Plintha1, m0.4
Total length; tl, m394
Concrete
Styrofoam
Plaster
Thickness; c, m0.2
Thickness; s, m0.15
Thickness; p, m0.02
Thermal conductivityc, W∙m−1∙K−10.9
s, W∙m−1∙K−10.035
p, W∙m−1∙K−10.9
Table 3. Reynolds number values for the greenhouses under consideration and the averaged wind speeds; Re × 106.
Greenhouse HeightMonth
Jan.Feb.MarchAprilMayJuneJulyAug.Sept.Oct.Nov.Dec.
a = 4 mRew,g1.71.41.61.31.21.11.21.01.11.31.41.6
Rew,r1.41.21.41.411.00.91.00.80.91.11.21.3
Rew,s1.41.21.41.11.10.91.00.91.01.11.21.3
a = 6 mRew,g2.42.02.31.91.71.51.71.41.61.81.92.2
Rew,r1.41.21.41.411.00.91.00.80.91.11.21.3
Rew,s2.11.82.01.71.51.41.51.31.41.61.71.9
Table 4. Geothermal and energetic data of the selected locations.
NameVoivodshipPoviatBase Depth
(m b.g.l.)
Well DisCharge
(m3∙h−1)
J1-TDS
(g∙L−1)
J1-Temp (°C)Thermal Capacity
(MW)(TJ∙a−1)(MWh∙a−1)
Mr-1lodzkiesieradzki164423318515.06159.544,308
Mr-2lodzkiesieradzki163123219515.04158.844,118
Se-1lodzkiesieradzki173124523556.44203.056,398
Gu-1lodzkielaski255912076786.31198.955,247
Ry-1wielkopolskiekaliski123518719371.0733.79358
Ry-2wielkopolskiekaliski118818016350.6219.55405
Ry-3wielkopolskiekaliski121018317360.8426.47326
Ry-4wielkopolskiekaliski128219420391.5548.913,592
Ry-5wielkopolskiekaliski132220022412.0664.918,015
Table 5. Locations of the selected greenhouse facilities.
Short NameTotal Area [ha]Number of ObjectsName
Mr-18.584Mroczki Małe 1
Mr-2Mroczki Małe 2
Se-112.211Sędzimirowice 1
Gu-1 1Gucin 1
Ry-129.816Rychnów 1
Ry-2Rychnów 2
Ry-3Rychnów 3
Ry-4Rychnów 4
Ry-5Rychnów 5
Table 6. Geothermal water temperature in a greenhouse depending on the distance from the intake.
LocationTemp. at Duct Inlet (°C)Outlet Water Temperature as a Function of Distance
(°C)
L = 100 mL = 500 mL = 1000 m
Gucin7877.173.569.1
Mroczki5150.448.746.4
Rychnów4140.438.335.5
Table 7. Main characteristics of the selected location.
ParameterUnitLocation 1
Gucin
Location 2
MroczkiMałe/Sędzimirowice
Location 3
Rychnów
Depth of drilling wellsm256016441323
Flow of geothermal waterm3∙h−1120233194
Temperature of geothermal water mineralisation°C785141
Mineralisation of geothermal waterg∙dm−3761922
Table 8. National Fund for Environmental Protection and Water Management guidelines for geothermal drilling work [64].
No.Type of WorkUnitUnit Costs-Net (Max EUR)
1 Execution of a well500m629
1000m966
2000m1011
3000m1011
4000m1124
5000m1214
>5000m1326
2Preparatory works (including, among others: assembly of the device, technological roads, access roads, squares, discharge pipelines)lump sum471,910
3Hydrogeological studycpl.80,899
4Geophysical studycpl.112,360
5Laboratory testscpl.35,955
6Geological supervisionlump sum62,921
7Disassembly of drilling equipment, land reclamation, mobilisation, demobilisation, waste utilisationlump sum128,090
8Preparation of hydrogeological documentationpcs40,449
Table 9. Net costs of drilling work for the Gucin location [64].
No.Type of WorkUnitUnit Costs-Netto (Max EUR)Costs-Netto (Max EUR)
1. Drilling of a well500m629314,607
1000m966483,146
2000m10111,011,236
2560m1011566,292
m 2,375,281
2.Preparatory works (including, among others: assembly of the device, technological roads, access roads, squares, discharge pipelines)lump sum 471,910
3.Hydrogeological studycpl. 80,899
4.Geophysical studycpl. 112,360
5.Laboratory testscpl. 35,955
6.Geological supervisionlump sum 62,921
7.Disassembly of drilling equipment, land reclamation, mobilisation, demobilisation, waste utilisationlump sum 128,090
8.Preparation of hydrogeological documentationpcs 40,449
SUM 3,307,865
Table 10. Net costs of drilling work for the MroczkiMałe/Sędzimirowice locations [64].
No.Type of WorkUnitUnit Costs-Netto
(Max EUR)
Costs-Netto
(Max EUR)
1 Drilling of a well500m629314,607
1000m966483,146
1644m1011651,236
m 1,448,989
2Preparatory works (including, among others: assembly of the device, technological roads, access roads, squares, discharge pipelines)lump sum 471,910
3Hydrogeological studycpl. 80,899
4Geophysical studycpl. 112,360
5Laboratory testscpl. 35,955
6Geological supervisionlump sum 62,921
7Disassembly of drilling equipment, land reclamation, mobilisation, demobilisation, waste utilisationlump sum 128,090
8Preparation of hydrogeological documentationpcs 40,449
SUM 2,381,573
Table 11. Net costs of drilling work for the Rychnów location [64].
No.Type of WorkUnitUnit Costs-netto (Max EUR)Costs-netto
(Max EUR)
1 500m629314,607
Drilling of a well1000m966483,146
1323m1011326,629
m 1,124,382
2Preparatory works (including, among others: assembly of the device, technological roads, access roads, squares, discharge pipelines)lump sum 471,910
3Hydrogeological studycpl. 80,899
4Geophysical studycpl. 112,360
5Laboratory testscpl. 35,955
6Geological supervisionlump sum 62,921
7Disassembly of drilling equipment, land reclamation, mobilisation, demobilisation, waste utilisationlump sum 128,090
8Preparation of hydrogeological documentationpcs 40,449
SUM 2,056,966
Table 12. Investment and operation costs (in thousand EUR).
SpecificationTitanium Heat ExchangerStainless Steel Heat Exchanger
GucinMroczkiMałeRychnówGucinMroczkiMałeRychnów
Cost of drilling work6615.74763.14113.96615.74763.14113.9
Cost of installation and construction work1093.51143.51117.8923.9987.2961.5
Investment costs7709.25906.75231.87539.65750.45075.4
Operation costs308.3236.2209.2301.5230203
Table 13. NPV and IRR values (in thousand EUR).
ParametersGucinGucin *Mroczki MałeMroczki Małe *RychnówRychnów *
NPV252784.426844.89390.613559.18−4714.613426.07
IRR250.070.170.050.41-0.14
NPV201108.185168.65−626.072868.49−4831.422477.23
IRR200.060.170.030.41-0.13
NPV15−784.923275.55−1774.292088.45−4963.341405.63
IRR150.020.15-0.010.41-0.11
* variant with co-financing.
Publisher’s Note: MDPI stays neutral with regard to jurisdictional claims in published maps and institutional affiliations.