1. Introduction
Many industrial processes use an apparatus with structured packing. Open-cell metal foams can play the role of the packing. Metal foam is a special cellular material in which the metal takes the form of a spatial skeleton, formed by thin ligaments. The ligaments form the outer outline of adjacent hollow cells. The cell size can be up to an order of magnitude larger than the transverse skeleton ligament size, giving foams a very high porosity, typically over 90%. High porosity coupled with a lack of closed cells allows relatively free flow of fluids through the foams. Due to small pressure drop after flowing through foams, their large specific surface area and the high thermal conductivity of the skeleton, the foams are increasingly being considered as an alternative to other structured packings. In many cases, the use of foams allows achieving beneficial energy effects in the form of reduced energy consumption for pumping fluids or increased heat and mass transport intensity. As a consequence, the efficiency of apparatuses is increased. The benefits of using foams in the construction of process equipment have also been noted in processes involving two-phase gas–liquid mixtures. What has been mostly studied so far, were boiling processes in channels completely or partially filled with metal foams. Works in this area have been carried out for several years. The authors of [
1,
2] have shown that the presence of foam on the boiling surface reduces the vapour bubbles nucleation temperature and shifts the boiling crisis towards much higher heat flux densities. Hu et al. [
3] report that the heat transfer coefficient recorded when during flow of boiling refrigerant through the channels of refrigeration evaporators filled with foam is 1.5 to 4 times higher than for boiling in evaporators without foam. In similar refrigerant boiling studies conducted by Bamorovat Abadi et al. [
4] and Li et al. [
5], the heat penetration rate increased by 3.2 and 2.5–3 times, respectively.
Diani et al. [
6] and Zhu et al. [
7] emphasise that the application of foam to the boiling surface is most beneficial when the process is carried out at a flow with low mass flux of the fluid and high vapour quality. According to Wang et al. [
8], the increase in heat transfer intensity is due to induced flow disturbances in the boundary layer, more intensive mixing of vapour and liquid and increased effective thermal conductivity. Kouidri and Madani [
2] also noted the great importance of thermal conductivity. These authors have shown that when boiling in a channel filled with highly conductive copper foam, heat transport increases by 130 to 300%, with an average increase in pressure drop by 42%. Foams made of materials with lower thermal conductivity (NiFeAlCr alloy and Inconel) placed in the channel caused a deterioration in heat transport compared to boiling in an empty channel.
The apparatus energy efficiency largely depends on the energy required to pump the fluids. According to Lali [
9], for this energy, there is a small flow through metallic foams. In his study, it did not exceed 1 W/m
3, for foams with pore packing densities of 30 and 45 PPI o. Jamal-Abdad et al. [
10] estimate that the thermal efficiency of solar collectors after filling their evaporators with copper foam increases by up to 45% compared to collectors without foam. When studying condensation in a tube with an annular copper foam insert, Shi et al. [
11] recorded 30% higher energy efficiency than in a tube with microribs. On the contrary, in a study of subcooled flow boiling in a duct filled with copper foam [
12], the authors recorded a 22% increase in the energy efficiency of the process.
As assessed by Hu et al. [
13], the pressure drop in boiling R410A refrigerant increases with increasing mass flux and when vapor quality increases. Similar observations were made by Ji and Xu [
14]. They recorded linear changes in pressure drop as a function of vapour mass fraction and higher pressure drop values for foams with higher pore packing density. Zalucky et al. [
15] have shown that pressure drop for gas–liquid flow through a packed bed of metal foam is several times lower than for flow through a spherical packed bed of the same specific surface.
Studies of gas–liquid co-current flow through metal foams in processes other than boiling or condensation are mainly related to the use of foams in catalytic reactors fuel cells and packed columns. An overview of the topics and test conditions for gas–liquid flows other than liquid–vapour flow is given in
Table 1.
Chen et al. [
16] used nickel foam as a catalyst carrier in a micro-reactor. They found that the process of nitrobenzene hydrogenation in this reactor s more efficient than in a conventional reactor in which the catalyst is applied to the inner walls. The authors of [
16] found that mass transport increased multiple times due to the very large foam surface area and flow disturbances around the foam skeleton. Bao et al. Based on the results of a numerical analysis of gas and liquid flow through a PEMFC membrane fuel cell, [
17] found that the presence of foam in the flow field results in a more uniform distribution of gas to the electrodes than in cells with conventional parallel channels. However, the foam causes a greater hold-up of liquid droplets that become trapped in its cells, so it is necessary to use hydrophobic foams to prevent clogging. Li et al. [
18] pointed to similar issues when studying air–water flow through a T-junction channel filled with metal foam. The authors of [
18] found that water is retained in one of the tee arms and that this retention effect is enhanced when the pore packing density of the foam is increased. Water retention can cause a change in flow pattern, from annular to slug.
As well as in the case of the flow in the empty channels [
19] the flow through the metal foam was studied using neural network [
20,
21]. The papers devoted inter alia hydrodynamics phenomena, but pressure drop was not their subject.
Table 1.
Overview of studies on gas and liquid flow through channels filled with metal foams. Papers not dealing with boiling or condensation.
Table 1.
Overview of studies on gas and liquid flow through channels filled with metal foams. Papers not dealing with boiling or condensation.
| Reference | Research Contents | Fluids | Foam Pore Density/Porosity | Scope of the Study |
|---|
| Bao et al. [17] | Numerical simulation of gas–liquid flow in a fuel cell | air, water | 10 PPI/0.94
40 PPI/0.97 | velocity and pressure field, water droplets hold-up |
| Chen et al. [22] | horizontal co-current flow through microreactor | hydrogen, aqueous ethanol | 35 PPI/0.90
75 PPI/0.89
110 PPI/0.90 | nitrobenzene conversion and phase distribution |
| Li et al. [18] | flow in a mini-T-junction | air, deionized water | 10 PPI/–
20 PPI/– | phase split, |
Tourvieille
et al. [23] | horizontal co-current flow through microreactor | hydrogen, ethanol, methanol | 35 PPI/0.90
45 PPI/0.89
55 PPI/0.90 | mass transfer and pressure drop |
Wan et al.
et al. [24] | horizontal co-current flow through a fuel cell | air, water | 110 PPI/0.95 | flow field and temperature distribution |
Zalucky
et al. [15] | gas–liquid downflow in solid foam packed trickle bed reactors | Air, water | 20 PPI/0.87
30 PPI/0.89
45 PPI/0.85 | flow patterns, liquid holdup and axial pressure drop |
1.1. Mathematical Description of Pressure Drop in Gas–Liquid Flow
Despite a growing number of papers devoted to the use of metal foams in the construction of process equipment being found in the literature, mathematical descriptions of phenomena accompanying gas–liquid flows through foams are very limited. This also applies to the description of pressure drop.
Table 2 summarises the approach of various researchers to modelling pressure drop in gas–liquid flow in channels and equipment filled with open-cell metal foams.
According to Gao et al. [
25], the frictional pressure drop in boiling refrigerant in a duct filled with foam can be calculated in the same way as for an empty duct, using the Faning friction factor, but the number they defined empirically is only valid for the foam used in their study.
Gerbaux et al. [
26] propose determining pressure drop in gas–liquid flow using the Darcy-Forchheimer-Brinkman equation, which is applicable to single-phase flow through porous media. For two-phase flow, the authors of [
26] introduced correction factors for the permeability and inertial coefficient of the foam into this equation.
Kouiduri and Madani [
2] argue that methods used to calculate pressure drop in gas–liquid flow in hollow channels should not be applied to flow through metallic foams. The attempt at using the Lockhart-Martinelli method, the Bankoff method and the Friedel method in their original forms described by these researchers shows too large discrepancies in the calculated and measured pressure drop values. According to the authors of [
13,
14], the Lockhart-Martinelli method can be used to calculate pressure drop in boiling refrigerants flowing through solid foams, but only after making suitable adaptations.
Table 2.
Mathematical description of the pressure drop in two-phase gas–liquid flow through metal foams presented in the literature. (Correlations describing pressure drop in gas–liquid and single-phase flow are presented in Table 6).
Table 2.
Mathematical description of the pressure drop in two-phase gas–liquid flow through metal foams presented in the literature. (Correlations describing pressure drop in gas–liquid and single-phase flow are presented in Table 6).
| Reference | Two-Phase Model | Single-Phase Pressure Drop | Applicability and Limitations |
|---|
| Bamorovat Abadi et al. [27] | Homogeneous flow in empty channel with the Chisholm’s two-phase friction multiplier | Friction factor for homogeneous flow according to the Blasius and Hagen–Poiseuillw correlation | Flow boiling of refrigerant in a mini-channel
Mass flux:
400–700 kg/(m2·s),
Vapor quality: 0.1–0.7
Heat flux:
20–40 kW/m2, |
| Gao et al. [25] | Homogeneous flow | A correlation between the Faning factor and the Reynolds number fitted to experimental data | Flow boiling of refrigerant in a mini-channel
Valid for the foam used in the study [25] |
| Hu et al. [13] | Separated flow,
Lockhart-Martinelli model with Chisholm’s formula
C = f(g2f, dp, x, ω) | Ergun equation
Geometry model of foam by Inayat [28] | Flow boiling of the refrigerant-oil mixture
Mass flux:
30–90 kg/(m2·s),
Vapor quality: 0.2–0.8
Oil concentration:
0–5% |
| Ji and Xu [14] | Separated flow,
Lockhart-Martinelli model with Chisholm’s formula
C = f(g2f, dp, x) | An experimental correlation considering the effects of change vapor qualities, mass fluxes and pore diameters.
Faning factor correlation fitted to experimental data | Boiling flow in a rectangular channel. Laminar flow. |
| Shi et al. [11] | Separated flow,
Lockhart-Martinelli model with Chisholm’s formula
C = f(gg, dc, x) | Ergun equation
Geometry model of foam by Inayat [28] | Flow condensation in horizontal tubes filled with annular metal foam |
Tourvieille
et al. [23] | Separated flow,
Lockhart-Martinelli model with Chisholm’s formula. | The sum of the pressure drop of liquid in empty channel and channel with the foam.
The pressure drop of liquid in a channel filled according to Darcy’s law | Gas-liquid flow in microreactor
Taylor flow
vsl < 0. 25 m/s |
| Weise et al. [29] | Combining the homogeneous model for two-phase pressure drop in empty channel and the single-phase model flow in porous media | Forchheimer equation without Darcy term.
Forchheimer coefficients known from single-phase experiments | Flow boiling
Mass flux:
>25 kg/(m2·s),
Vapor quality < 0.5
Forchheimer number Fo < 10
Incompressible vapor phase—MaV < 0.1 |
Hu et al. [
13] indicate that pressure drop in the fluid flow should be determined using the Ergun’s equation, which is appropriate for flow through granular beds. The foam specific surface area, porosity and pore diameter should be given as parameters characterising the bed. Shi et al. [
11] propose the same solution for calculating pressure drop at condensation, however, the authors empirically determined their constants for the calculation model, as their research concerned a duct only partially filled with foam.
A similar solution was developed by Ji and Xu [
14]. In their proposal, pressure drop for fluid flow is determined based on the pressure drop number for flow through metal foams.
One of the most recent methods for calculating pressure drop in gas–liquid flow through metal foams was presented by Weise et al. [
29]. The authors propose to use the homogeneous flow model in hollow tubes in combination with the Forchheimer equation, which describes the pressure drop in single-phase flow through porous media. Weise et al. have shown that the Darcy term can be neglected in the Forchheimer equation for typical boiling. The influence of the channel wall is also negligible if the characteristic length scale of the channel exceeds the characteristic microscopic length scale of the foam by more than five times. The authors of [
29] assure that the computational model proposed by the allows the determination of pressure drop with an error of less than 30% if the value of the Forchheimer coefficient for the foam has been experimentally determined. When the Forchheimer coefficient needs to be predicted, the accuracy of the model decreases and depends on the accuracy of the models describing the value of the Forchheimer coefficient. Then, the knowledge of the geometrical foam parameters such as specific surface area, porosity, fibre diameter and pore diameter, becomes necessary.
1.2. Research Rationale and Objectives
The literature review suggests that studies of pressure drop in gas–liquid flow through channels filled with metal foams mostly concern the flow of boiling agents in evaporators of refrigerating appliances and solar collectors. These works resulted, among other things, in the development of correlations used for the prediction of pressure drop in such flows. However, these correlations do not apply to two-phase flows other than boiling. The results of statistical verification of these correlations based on the measurement results described in this paper, presented in
Section 4, confirm this.
Co-current gas–liquid flow through channels filled with metal foams with gases different from liquid vapour has so far been studied only in channels of small diameters, in microreactors and fuel cells (leaving aside flows in packed columns which are diametrically different processes). Mass transport and the quantities characterising the mass exchange processes were the most frequent subject of investigations. Studies on flow hydrodynamics are less frequent and they usually concern the liquid hold-up on the foam or the determination of the velocity field. In a few cases, the authors discussed pressure changes, but a method for predicting pressure drop in two-phase flow was proposed only by Tourvieille et al. [
23]. The authors of the [
23] paper conducted their study only in the laminar regime at very low flow velocities.
The literature is missing data on the influence of flow patterns in foam-filled channels on pressure drop (apart from flow boiling).
In cases other than refrigerant boiling, the scarcity of information on gas–liquid flows through open-cell metal foams, including the lack of methods for predicting pressure drop, severely hinders the design and optimisation of apparatuses filled with metal foams. Therefore, we engaged in our research, including experimental studies, aimed at understanding the hydrodynamics of gas–liquid flow through channels filled with metal foams, with particular emphasis on the factors determining pressure drop in two-phase flow, including flow conditions, fluid properties and foam structure.
In contrast to the authors of earlier work, we engaged in investigating flow in conventional channels (circular with a diameter of 20 mm) in not only laminar but also turbulent regime. We found that pressure drop was related to flow patterns.
The necessity to develop a new model for predicting the value of pressure drop in gas–liquid flow through the open-cell metal foam, which would correctly describe this value for various flow patterns and could be applied in flow conditions where literature models are not applicable, was deemed a useful objective of the works we engaged in.
2. Materials and Methods
The direct aim of the experimental research was to measure pressure drop in single-phase and two-phase gas–liquid flow through channels filled with metal foams of open structure. For two-phase flow, we also identified flow patterns to determine their influence on pressure drop values. Single-phase flow through open cell foams is relatively well understood [
30,
31,
32], however, it was considered that the results of single-phase flow research would help interpret the more complex two-phase flow. It is not always possible to rely solely on literature information. The authors of individual papers often describe the foams used in their research in an insufficiently precise manner, for example, using only one quantity to characterise their geometrical structure. A uniform methodology for determining geometric foam parameters has still not been developed. The ways of defining the Reynolds number and, consequently, the criteria for assessing flow regime also differ, which makes it difficult to analyse and compare the research results presented in the literature and to make the necessary generalisations.
Air, demineralised water and Velol-9Q oil were used as fluids. Studies of gas–liquid flow through metal foams reported in the literature have mostly been conducted using refrigerants or air and water. The use of oil introduced more diversity in the physical properties of the fluids and thus allowed to determine their influence on hydrodynamic phenomena. Velol-9Q oil is significantly more viscous than that of water, eight times at 20 °C, but this viscosity is still low enough to carry out tests over a wide range of fluid velocity changes. Oil properties are shown in
Table 3 (the properties of air and water are generally known and available). The two-phase flow was analysed for the air–water and air–oil flows.
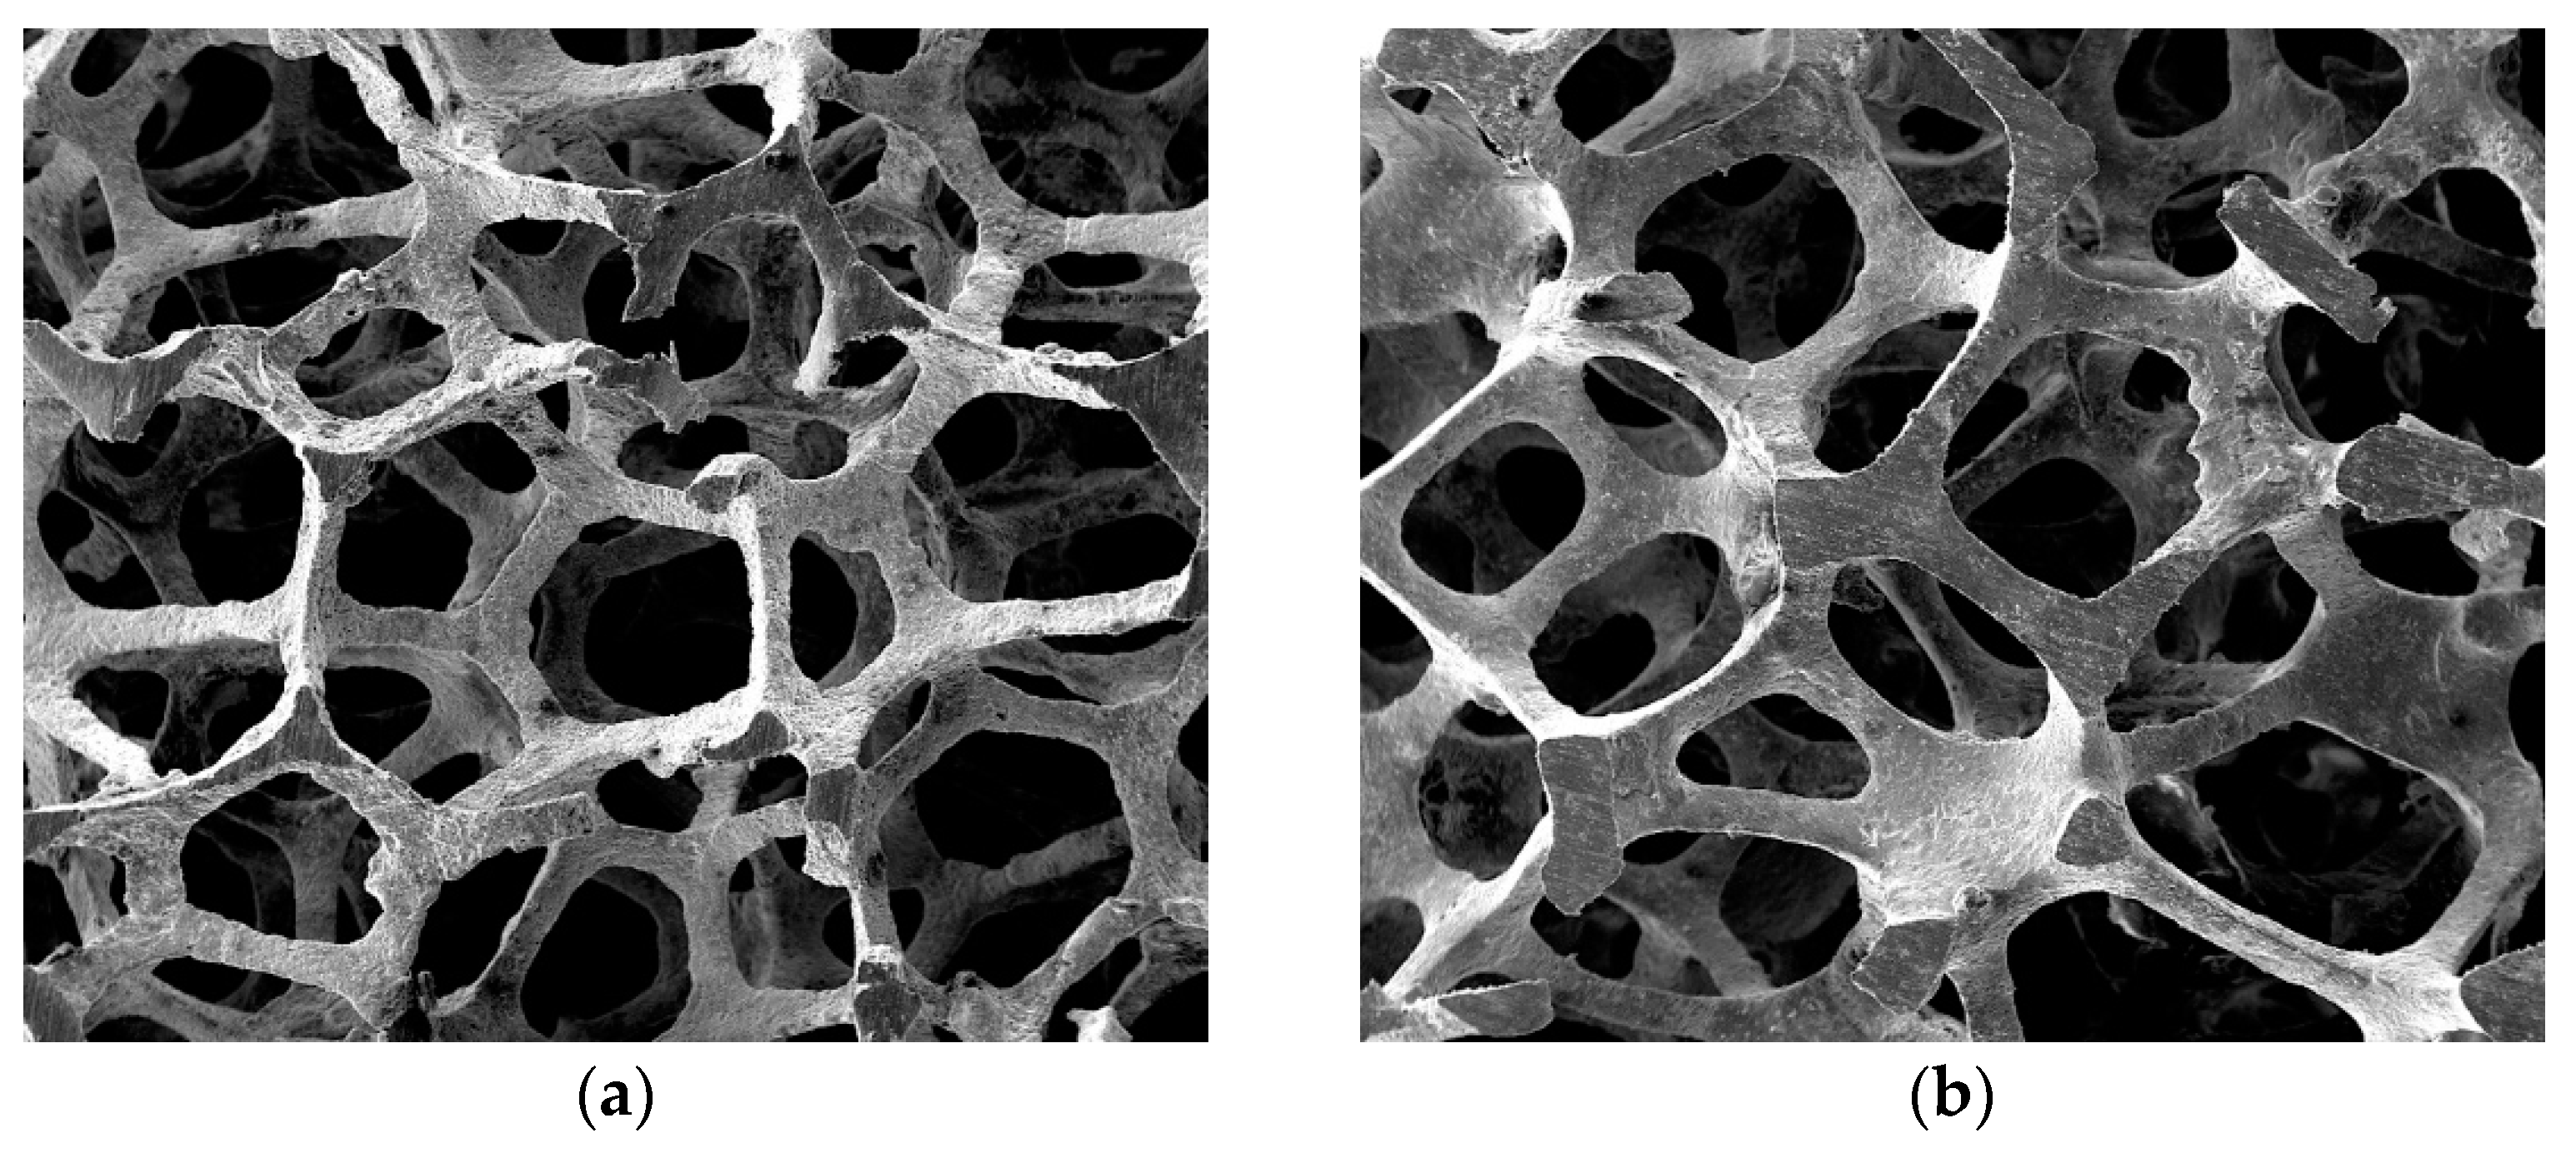
Three aluminium open-cell foams with different pore densities of 20, 30 and 40 PPI were used in the study. Foams with lower pore density, e.g., 5 or 10 PPI, are characterised by a relatively small specific surface area, usually smaller than other packings used in heat or mass transfer processes. Foams with too high pore density induce extensive pressure drop, which outweighs the benefits associated with their use in process equipment. The foams exhibited similar porosity
ϕ and cell skeleton shape. They differed in cell size. Some foam parameters needed to be similar to unambiguously assess the influence of fluid properties on flow hydrodynamics. The foam parameters and geometrical structure are presented in
Table 4.
Foam porosity
ϕ was determined based on the equation
where
Vmf is the volume of the foam sample in the form of a cylinder with a diameter of 20 mm and height of 450 mm, and
Vs is the volume of the foam skeleton, which was determined by immersing the sample in a calibrated liquid measuring vessel.
Vs was taken as the increase in liquid volume. For each of the foams, three samples were used to obtain measurements and the arithmetic mean of the results obtained was taken as the porosity.
Microscopic skeleton images were used to determine the size of cells and pores in the studied foams. The photographs were taken using an Inspekt F scanning microscope with 15× magnification. Foam images were analysed in Met-Ilo and Iris software.
Cell size
dc and pore size
dp were determined, as suggested by the authors of [
33], as diameters of circles with the same circumferences as the cell and pore circumferences. The perimeter of the pore was traced along the edge of the skeleton. The length of the line running in the centre of the skeletal ligament forming a single cell was taken as cell perimeter (
Figure 1).
More than 50 microscopic images were taken for each foam, allowing measurements of 104 cells of the 20 PPI foam, 159 cells of the 30 PPI foam and 185 cells of the 40PPI foam. The average sizes for each foam were taken as the cell diameter and pore.
2.1. Test Stand
The research was carried out using an experimental system, whose diagram is shown in
Figure 2. A horizontal channel with an internal diameter of 20 mm and length of 2690 mm is the main element of this installation. The channel is filled with aluminium foam in the form of 30 mm long cylindrical inserts. An independent channel has been prepared for each foam. The channel is made of the aluminium pipe because the same system was used for heat transfer tests (their results are not discussed in this work). The 500 mm long end section of the channel has been made of colourless transparent Plexiglas, which allows observation of the gas–liquid flow patterns.
The pressure drop was measured in the middle of the channel as the difference in pressure between two points located 1000 mm apart. The first pressure measurement point was located at a distance of 1100 mm from the beginning of the channel. This distance was considered sufficient to get the flow fully stabilised. According to the authors of the [
34,
35] in single-phase flow through metal foams, the flow gets stabilised after a passage of 3–6 times the diameter of the foam cell. Information on the stabilization length for two-phase flow is missing from the literature. Authors of [
6,
13,
14] conducted studies of gas–liquid flow through metal foams in channels with total length not exceeding fifty times the diameter.
A set of five piezoresistive differential pressure sensors (Aplisens PR-28 and PR-50G) with a total measuring range of 0–150,000 Pa was used in the research. An additional piezoresistive sensor was used to measure the overpressure in the channel (relative to ambient pressure).
The air for testing was supplied from a pneumatic system [
36]. Before air was introduced into the channel, its pressure was reduced to the desired level. The air flow rate was measured using two Kobold DMS mass flowmeters. Water was pumped using a multistage centrifugal pump and oil with a gear pump. Water flux was measured using two Kobold DPM turbine flowmeters. A Kobold KZA gear-wheel flowmeter was used to measure the oil flow rate. The air, water and oil flow rates were regulated using precision throttle valves.
The signals from all pressure and flow sensors were recorded using a computer data logging system developed in the DasyLab environment [
37]. The characteristics of the measuring equipment are presented in
Appendix A.
2.2. Research Methods
For all three foams, tests were carried out under the same flow conditions which were intended to determine the effect of foam structure on pressure drop and flow patterns. The fluid superficial velocity
vf, calculated with respect to the total channel cross-section, excluding foam and the second fluid (in two-phase flow), was adopted as the main quantity describing the flow conditions,
where:
Qf—flow rate
dk—channel diameter.
The flow rates were set up to obtain flows in laminar and turbulent regimes and a wide range of changes in the void fraction in the gas–liquid flow. All basic flow patterns were expected to occur. It was supposed to enable the determination of their influence on pressure drop. The range of changes in the flow rate for specific phases was determined based on the results of previous research conducted by the author of this paper with te use different metal foam [
38]. Test conditions are presented in
Table 5. The value of
εf was determined according to the relation,
The flow characteristics were calculated for the average temperature and pressure measured in the channel. The temperature of the fluids during the tests was 22–24 °C.
Gas–liquid flow tests were carried out in series with a constant liquid flow rate and a gradually increasing air flow rate. Five values of water and oil flows were assumed. The air flow rate was increased in 19 steps. Once the flow rate stabilised, pressure drop was measured for 180 s. In this way, for each foam, the two-phase pressure drop was measured for 95 different conditions for both air–water flow and air–oil flow. Single-phase flow pressure drop measurements of each fluid were carried out in two series. In the first, the fluid flow rate was gradually increased and in the second, the fluid flow rate was decreased. Measurements were carried out for 33 different oil flow settings and over forty air and water flow settings.
Simultaneously with gas–liquid pressure drop measurements, we also observed flow patterns. The patterns were identified based on visual observations and the analysis of fluctuations in the measured pressure drop. An advanced algorithm was used in the analysis to classify flow patterns based on the fractal parameters of the differential pressure sensor signal. This methodology for identifying flow patterns was described in [
39]. Four basic flow patterns were distinguished during the study: stratified, plug, slug and churn flow.
4. Modelling Pressure Drop
In the search for a method of predicting pressure drop in gas–liquid flow in channels filled with metal foams, first checked was the possibility of using models describing pressure drop in boiling liquid in evaporators filled with metal foam. For this purpose, the methods proposed by the authors of papers [
11,
13,
14,
23,
25,
27,
29] were selected. The model developed by Tourvieille et al. [
23] for flow through mini-channels filled with foam was also taken into account.
Table 6 summarises the correlations included in the analysed computational models.
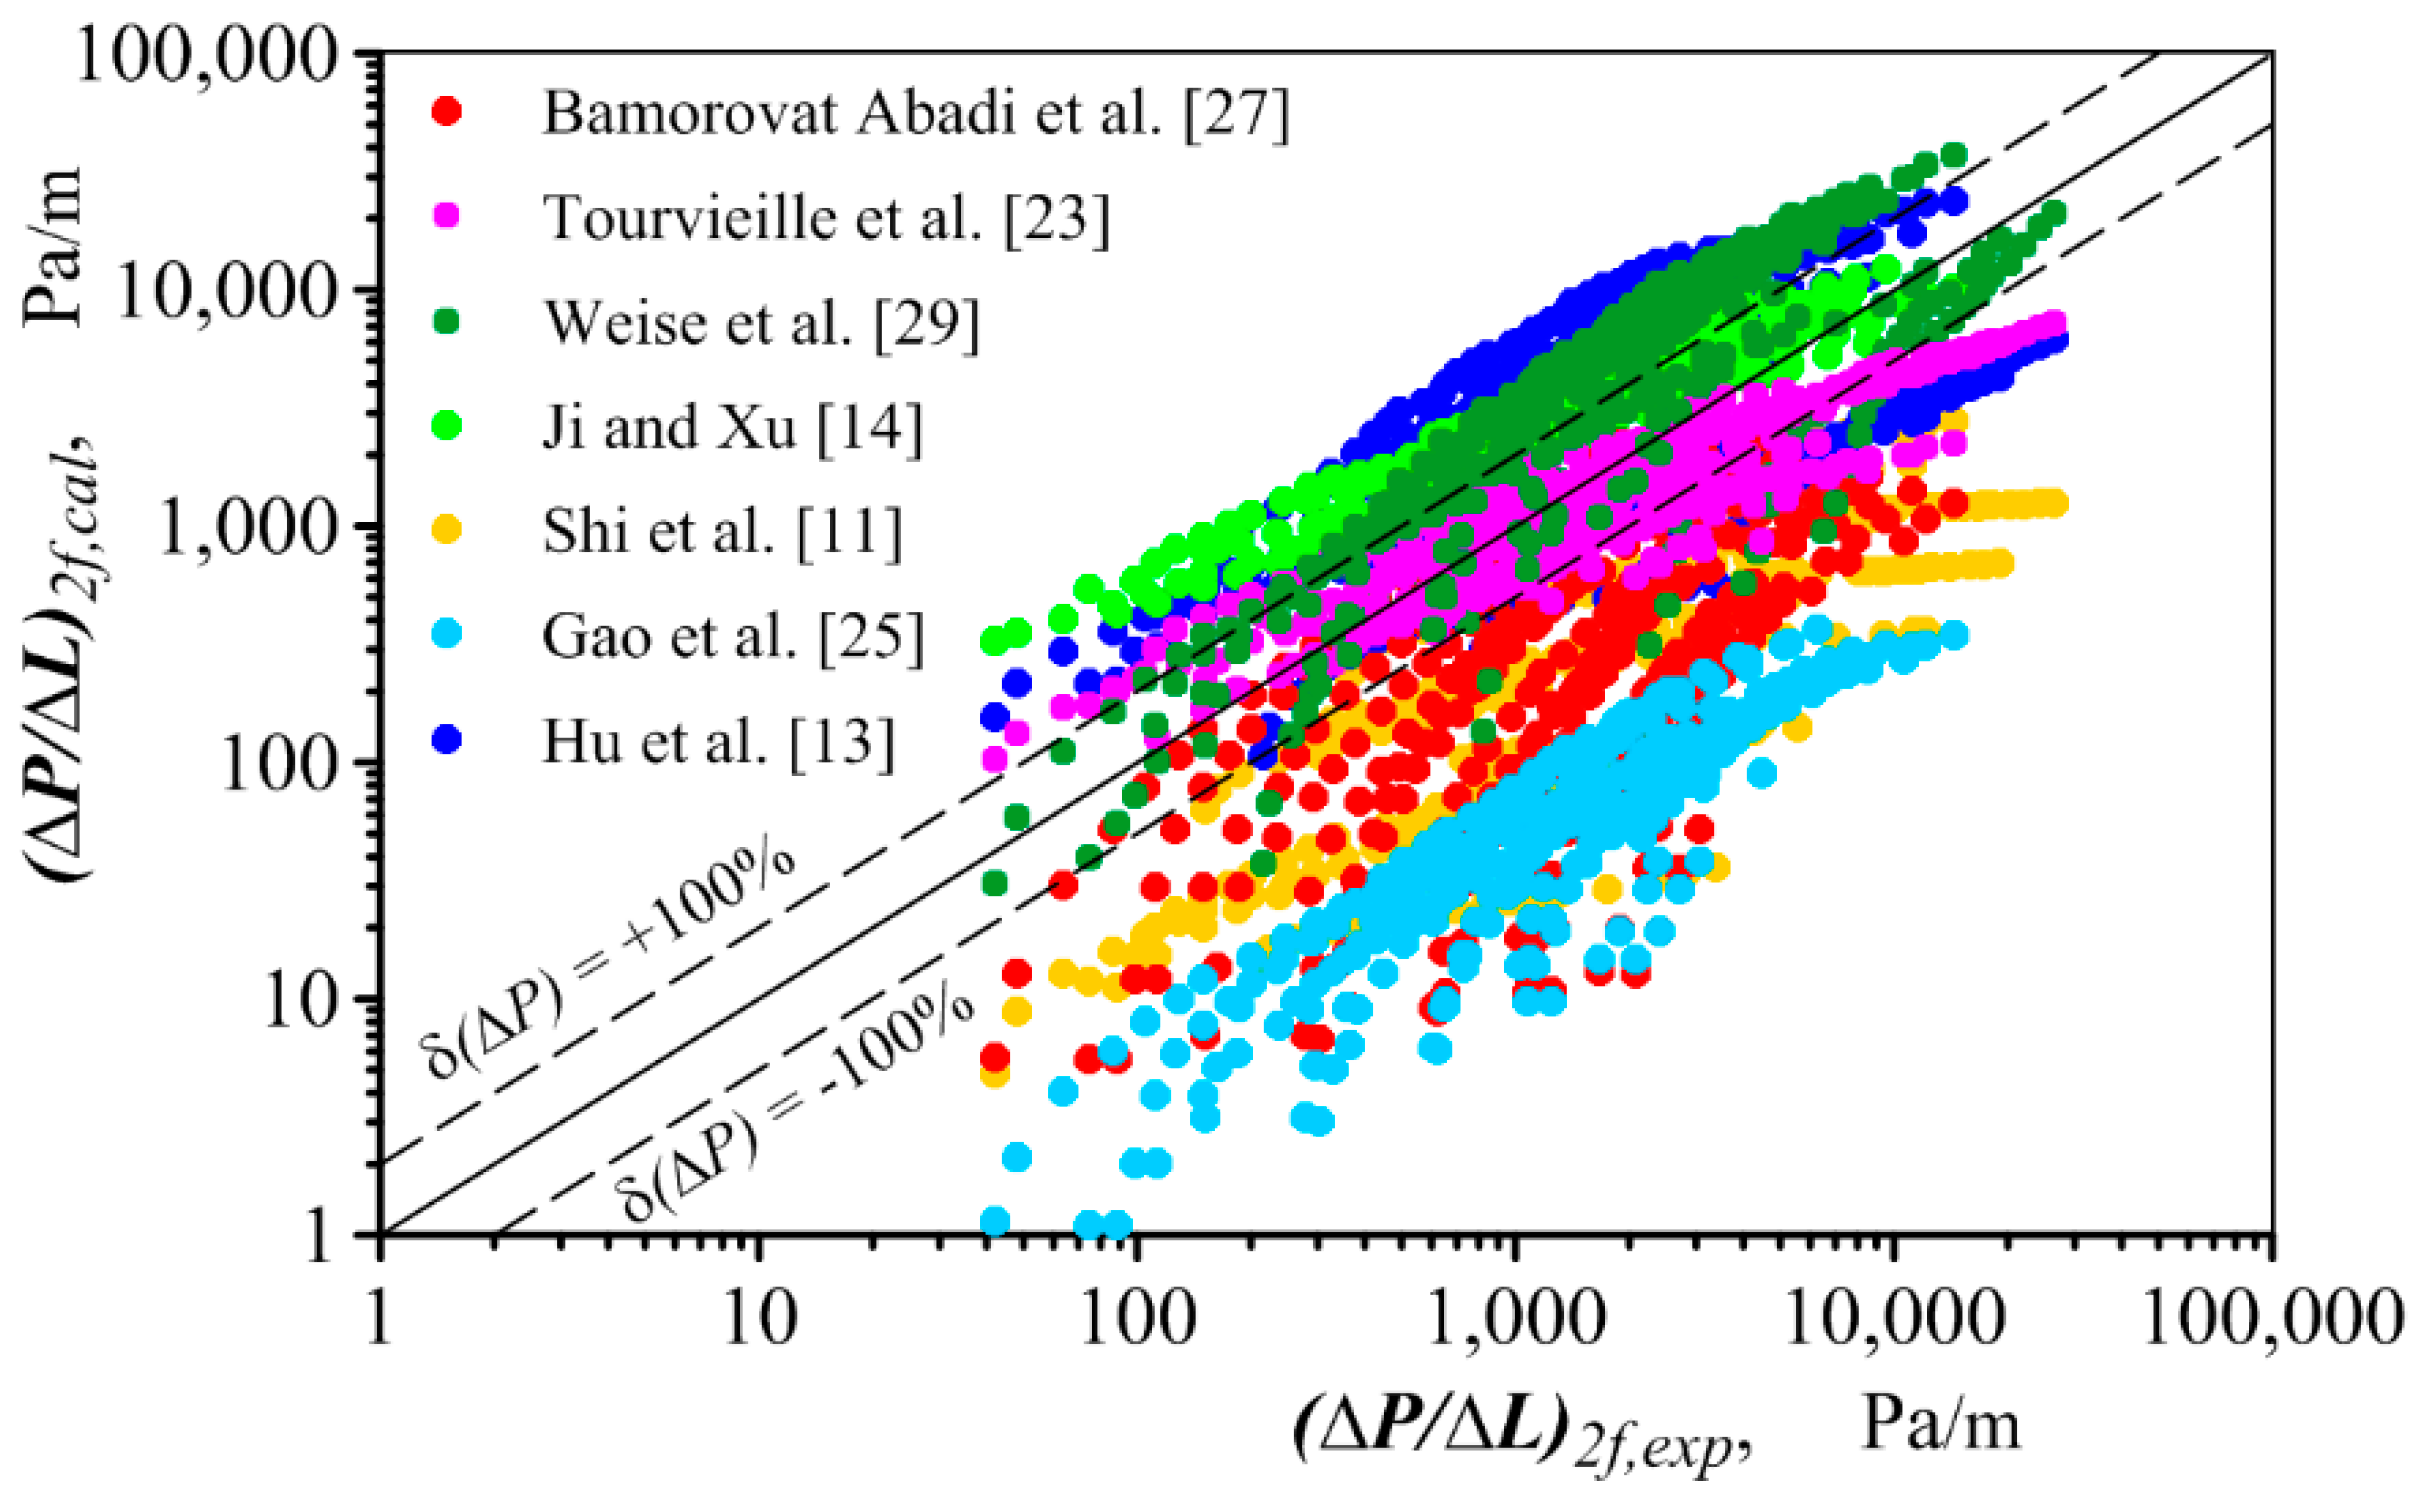
Figure 11 compares the measured pressure drops in air–water and air–oil flows with the corresponding values calculated using the correlations in
Table 6.
The calculated pressure drops differ very significantly from the measured pressure drops. For the model developed by Hu et al. [
13] the mean calculation error (ratio of the difference between the calculated and measured pressure drop to the measured value) is more than 193% and for the Ji and Xu method, it exceeds 210% (
Table 6). For other models, the errors are smaller but still too large to be considered satisfactory.
The intended use of the analysed models should certainly be cited among the reasons for such large discrepancies. Except for the model of Tourvieille et al. [
23], all these models were developed to predict pressure drop in boiling refrigerants, a process in which pressure drop is largely determined by factors not present in gas–liquid flow without a change of state of aggregation. For example, Ji and Xu [
14] found that the pressure drop during boiling is higher than in gas–liquid flow without boiling, and they pointed to vapour bubbles blocking foam cells adjacent to the channel wall during nucleation as the cause. Similar observations were made by Gao et al. [
25]. Furthermore, the authors of [
14] showed that pressure drop in a boiling mixture depends on heat flux. The influence of heat flux on the hydrodynamics of flow through metal foams was also reported by Li et al. [
5]. The models describing pressure drop in boiling liquid were developed based on tests conducted at much higher mass flux than the pressure drop measurements reported in this paper (
g2f < 64 kg·m
−2·s
−1), which may also be the cause of significant calculation errors. Boiling in flow is usually investigated at mass fluxes of tens to hundreds of kg·m
−2·s
−1.
The best results were obtained with the model by Tourvieille et al. [
23], which is the only one developed based on gas–liquid flow tests without boiling or condensation. For the model of Tourvieille et al., the average calculation error is less than 45%. Please note, however, that despite the statistically good fit between calculated and measured pressure drops, for some data points the calculated values are up to 3 times higher (for small mass flux) or lower (for large mass flux) than the measured values. Furthermore, as illustrated in
Figure 12, the calculated pressure drop is boosted by increasing gas velocity to a lesser extent than the measured resistance.
Tourvieille et al. [
23] developed their flow resistance model based on tests conducted for laminar flow with liquid velocities not exceeding 0.025 m/s and gas velocities up to 0.06 m/s. The studies described in this paper were carried out for phase velocities greatly exceeding these values, which may be the reason for the different nature of the pressure drop changes, especially at high gas velocities.
Since the analysed pressure drop models include no one that correctly reflects the value and nature of pressure drop changes in gas–liquid flow through metal foams, a decision was made to develop a new model to predict this value.
The performed observations of the flow patterns show that the foam does not disperse the fluids in the channel. In all two-phase flow cases, gas and liquid were clearly separated. Therefore, we assumed that the pressure drop in two-phase flow through foam-filled channels could be calculated using a separated flow model, based on a pressure drop in a single-phase flow of liquid and gas.
Fluid pressure drop (Δ
P/Δ
L)
l could be determined using the Darcy-Weisbach equation,
Relatively high pressure drops in the flow through metal foams, of the order of tens of thousands Pa/m, can cause significant changes in gas density. Among others, Azzi et al. [
46] and Dhiman et al. [
47] pointed to this issue. To take into account the influence of the gas compressibility on the value of pressure drops in the gas flow, we propose to calculate this quantity based on the pressure changes along the flow path (
P1 and
P2), using the equation
where:
mg—gas mass flow rate,
A—area cross-sectional of the channel,
Rg—specific gas constant,
Tg—temperature absolute.
The pressure drop in flow through metal foams is determined by phenomena occurring at the level of individual cells and skeletal fibres. Therefore, we assumed that in calculating pressure drop, an equivalent diameter Equation (5), which captures the structural parameters of the foam, should play the role of the hydraulic diameter.
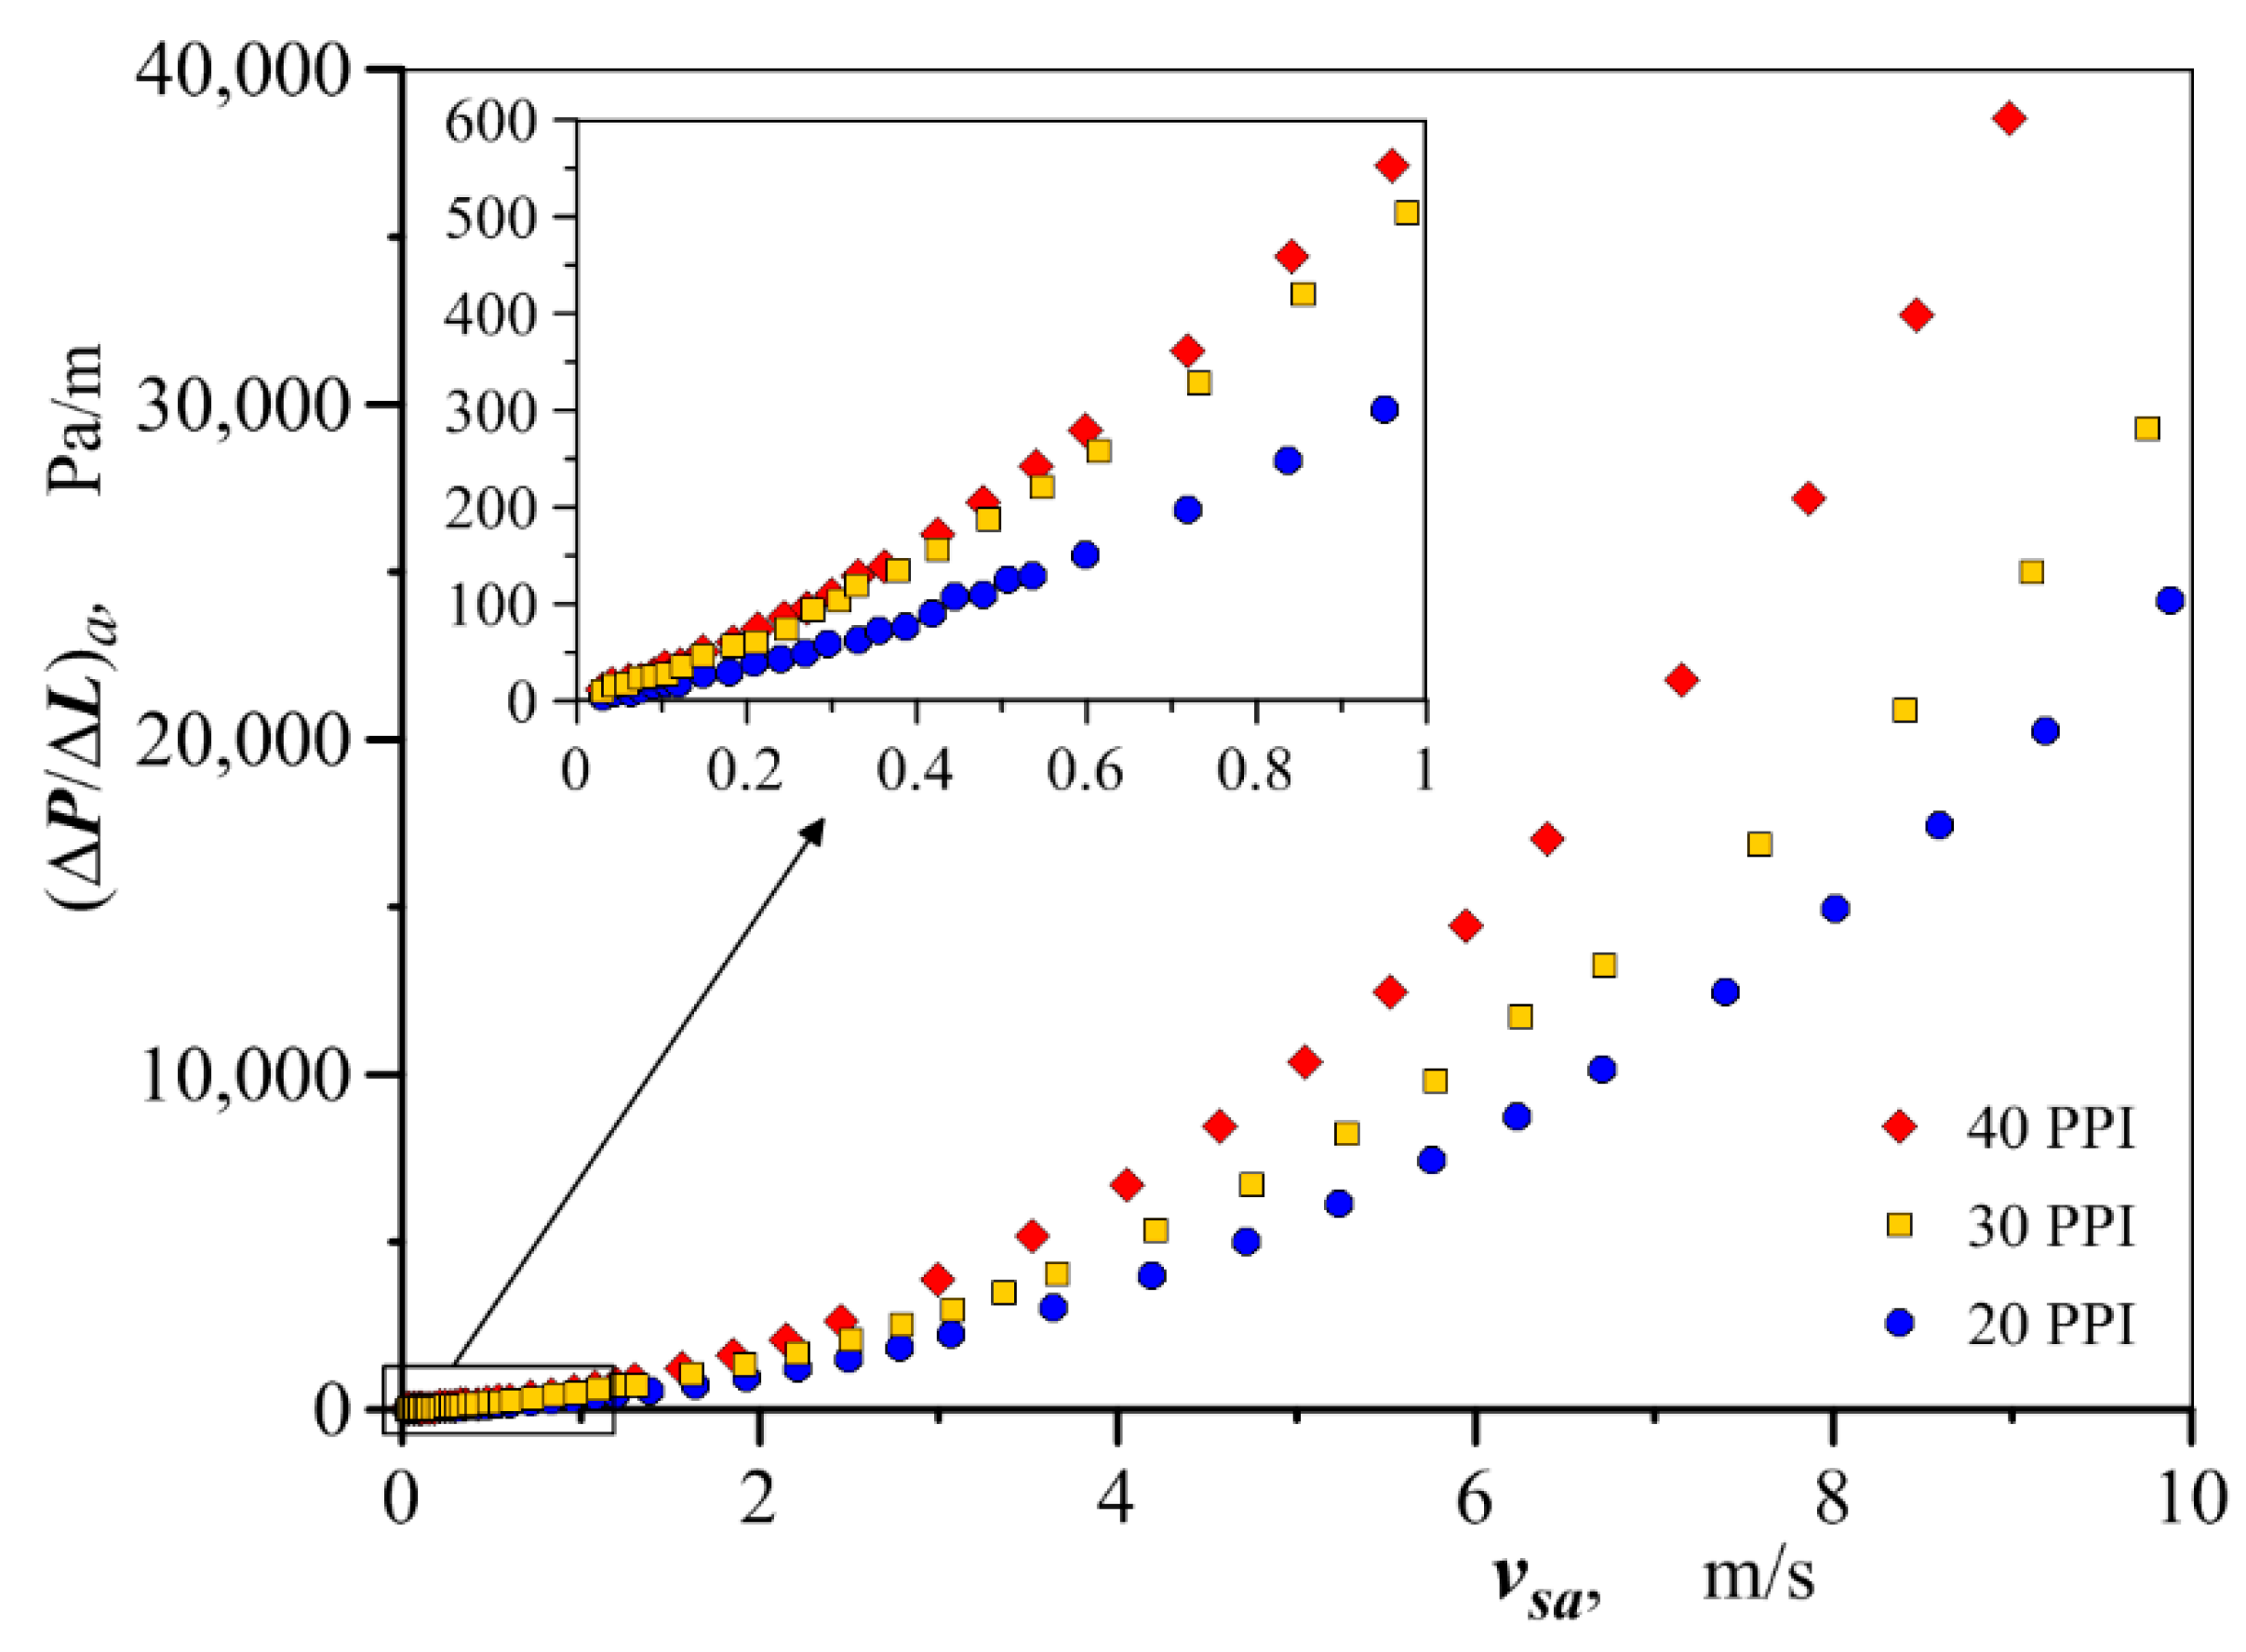
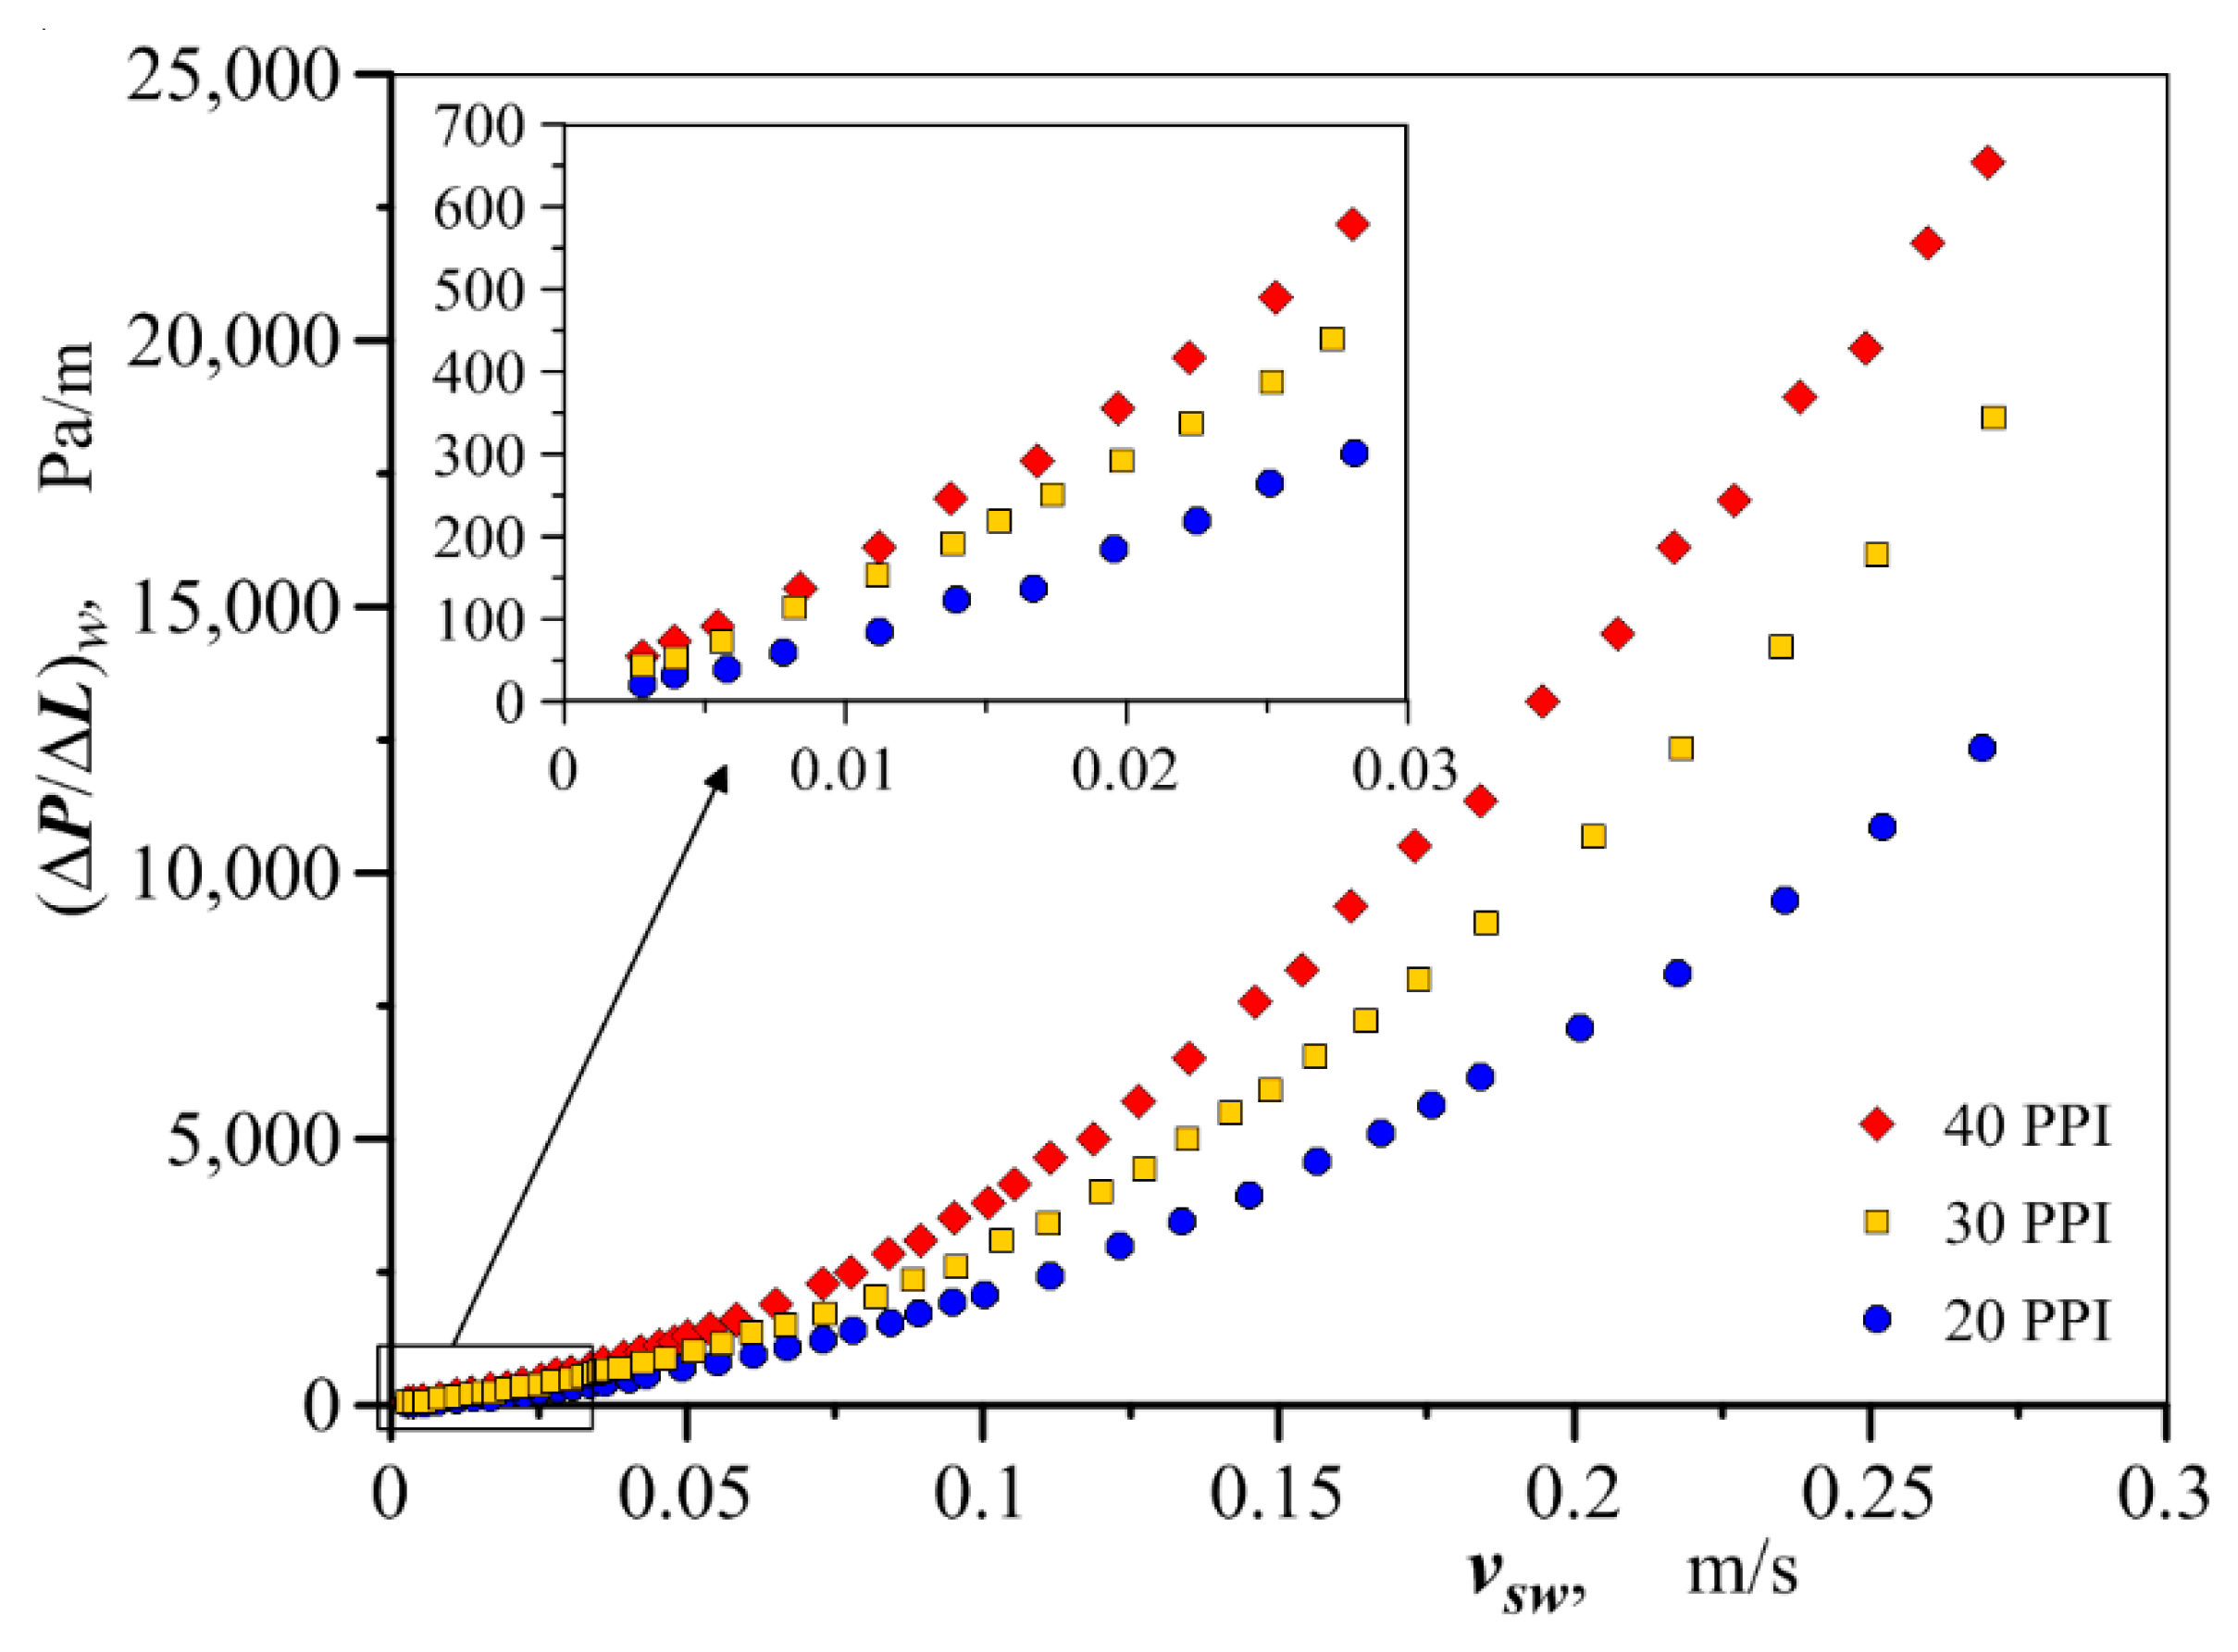
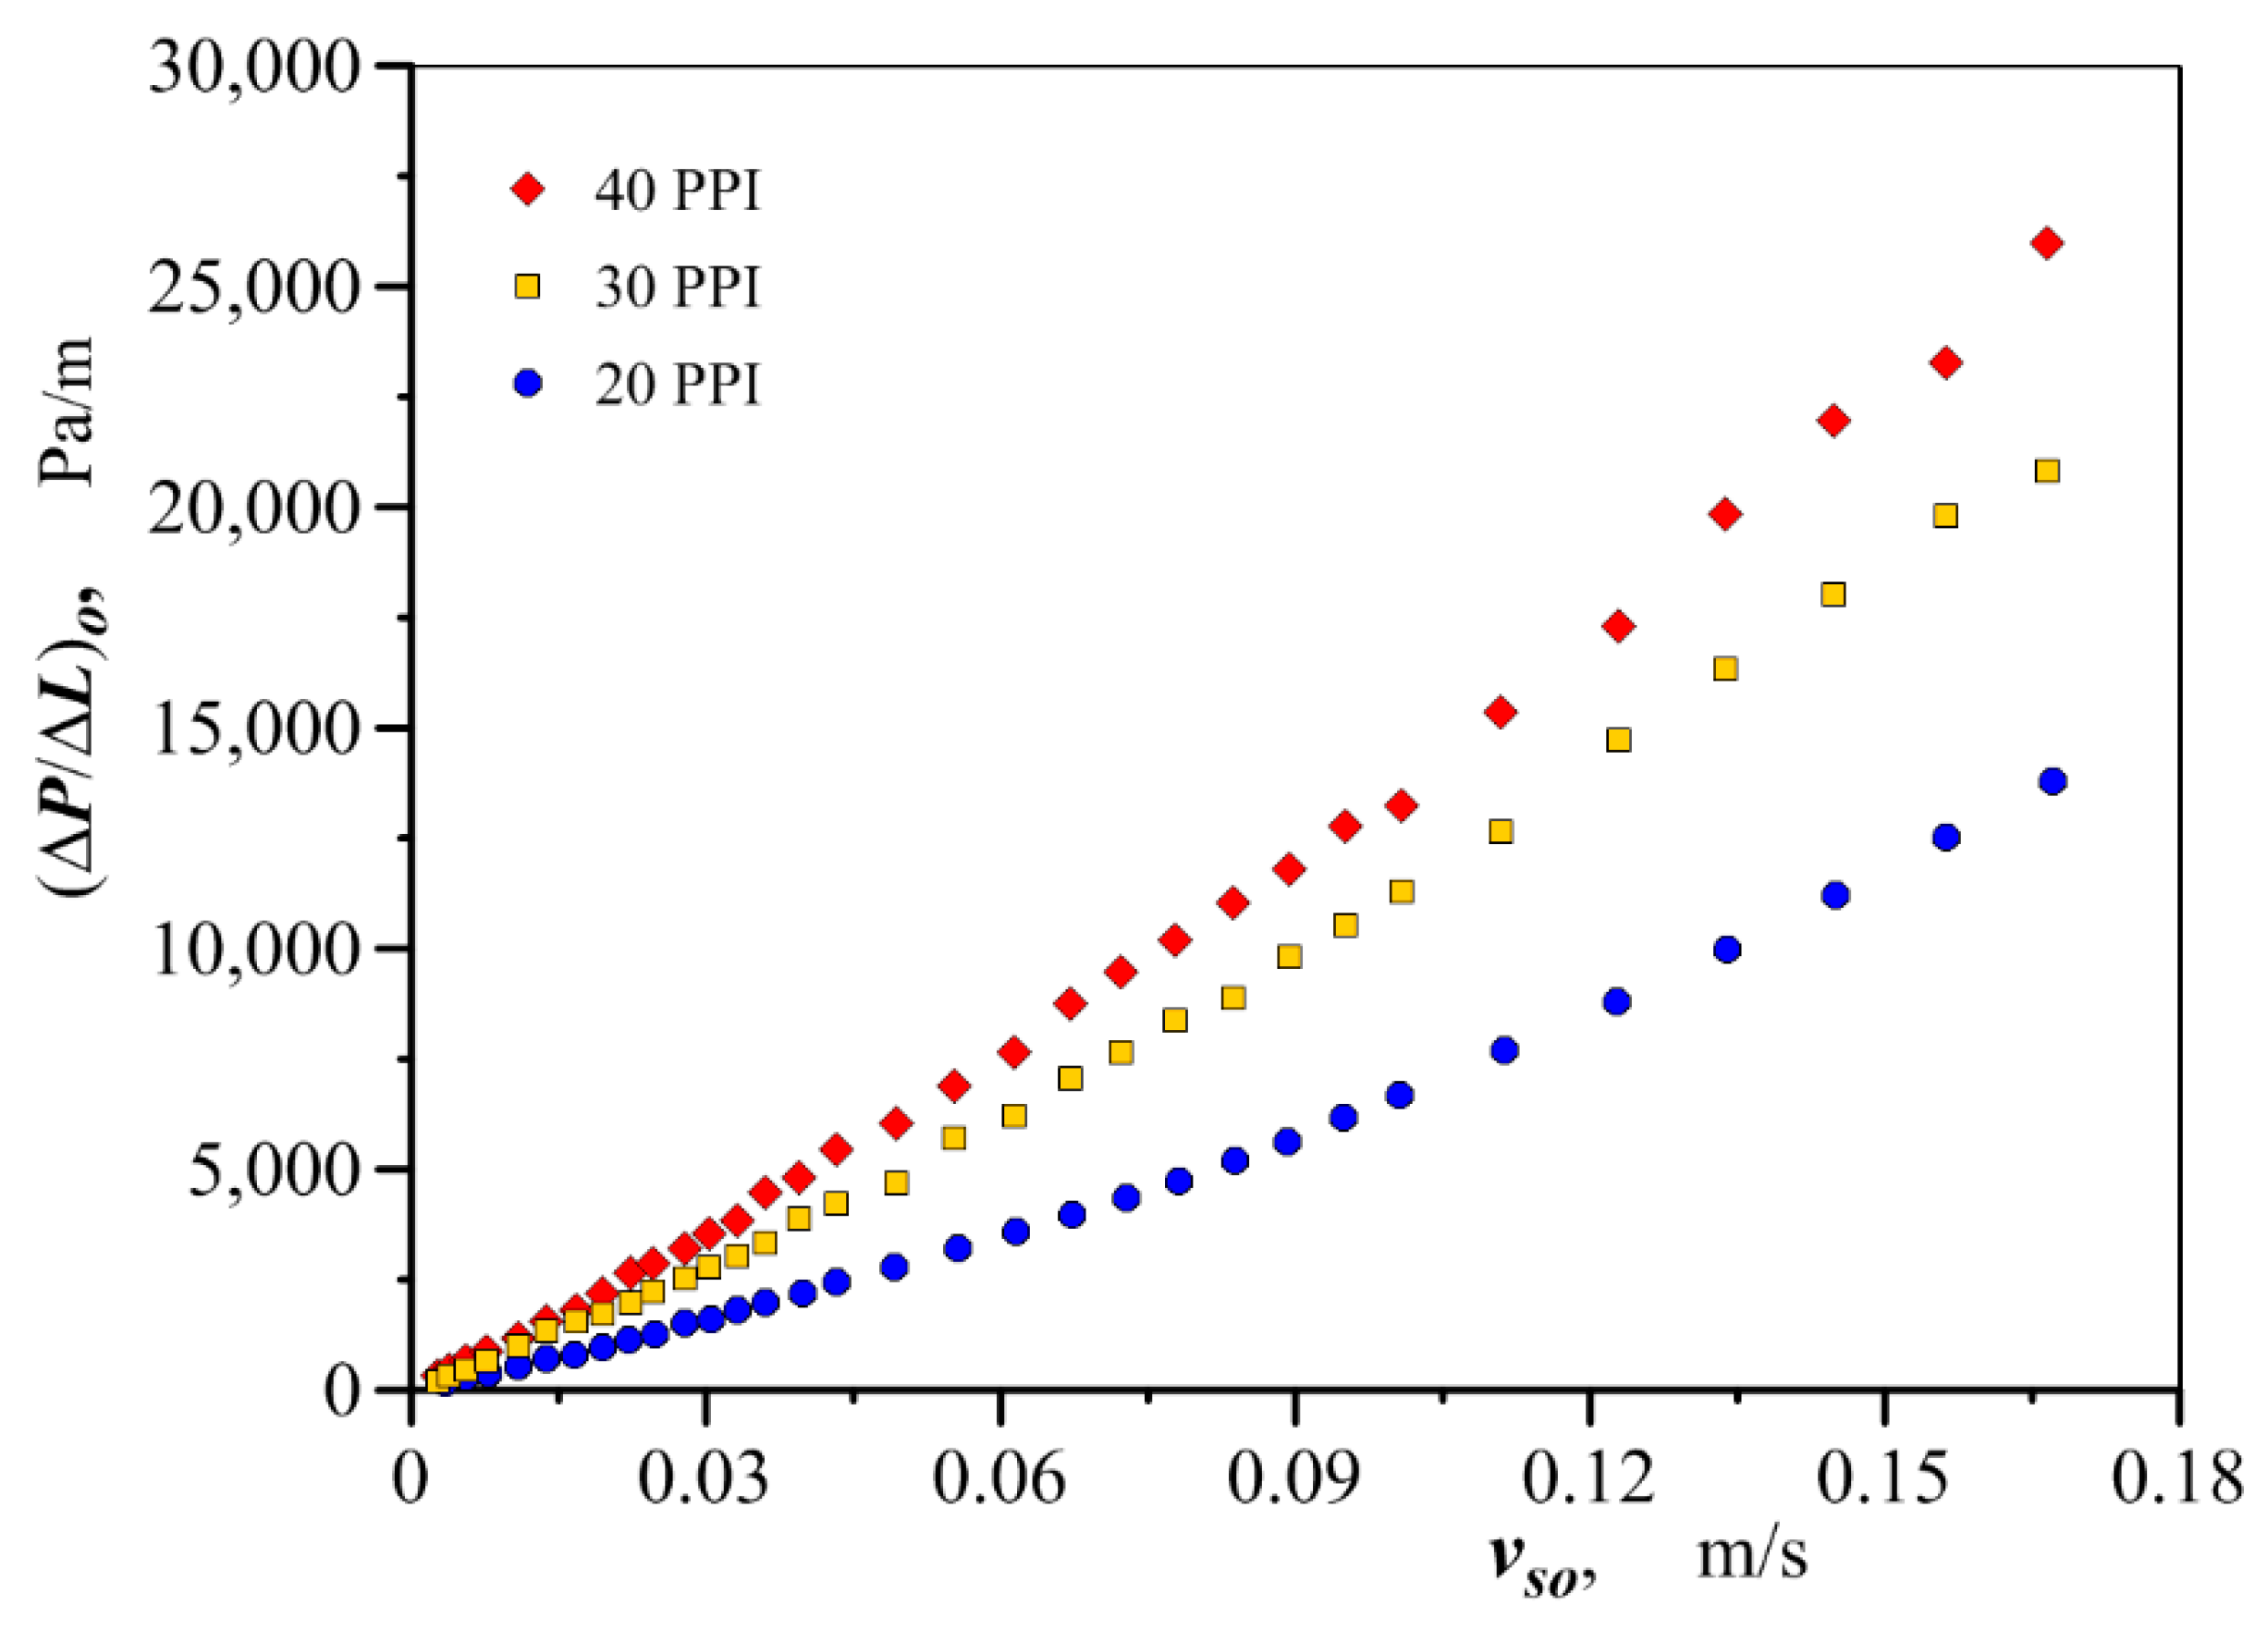
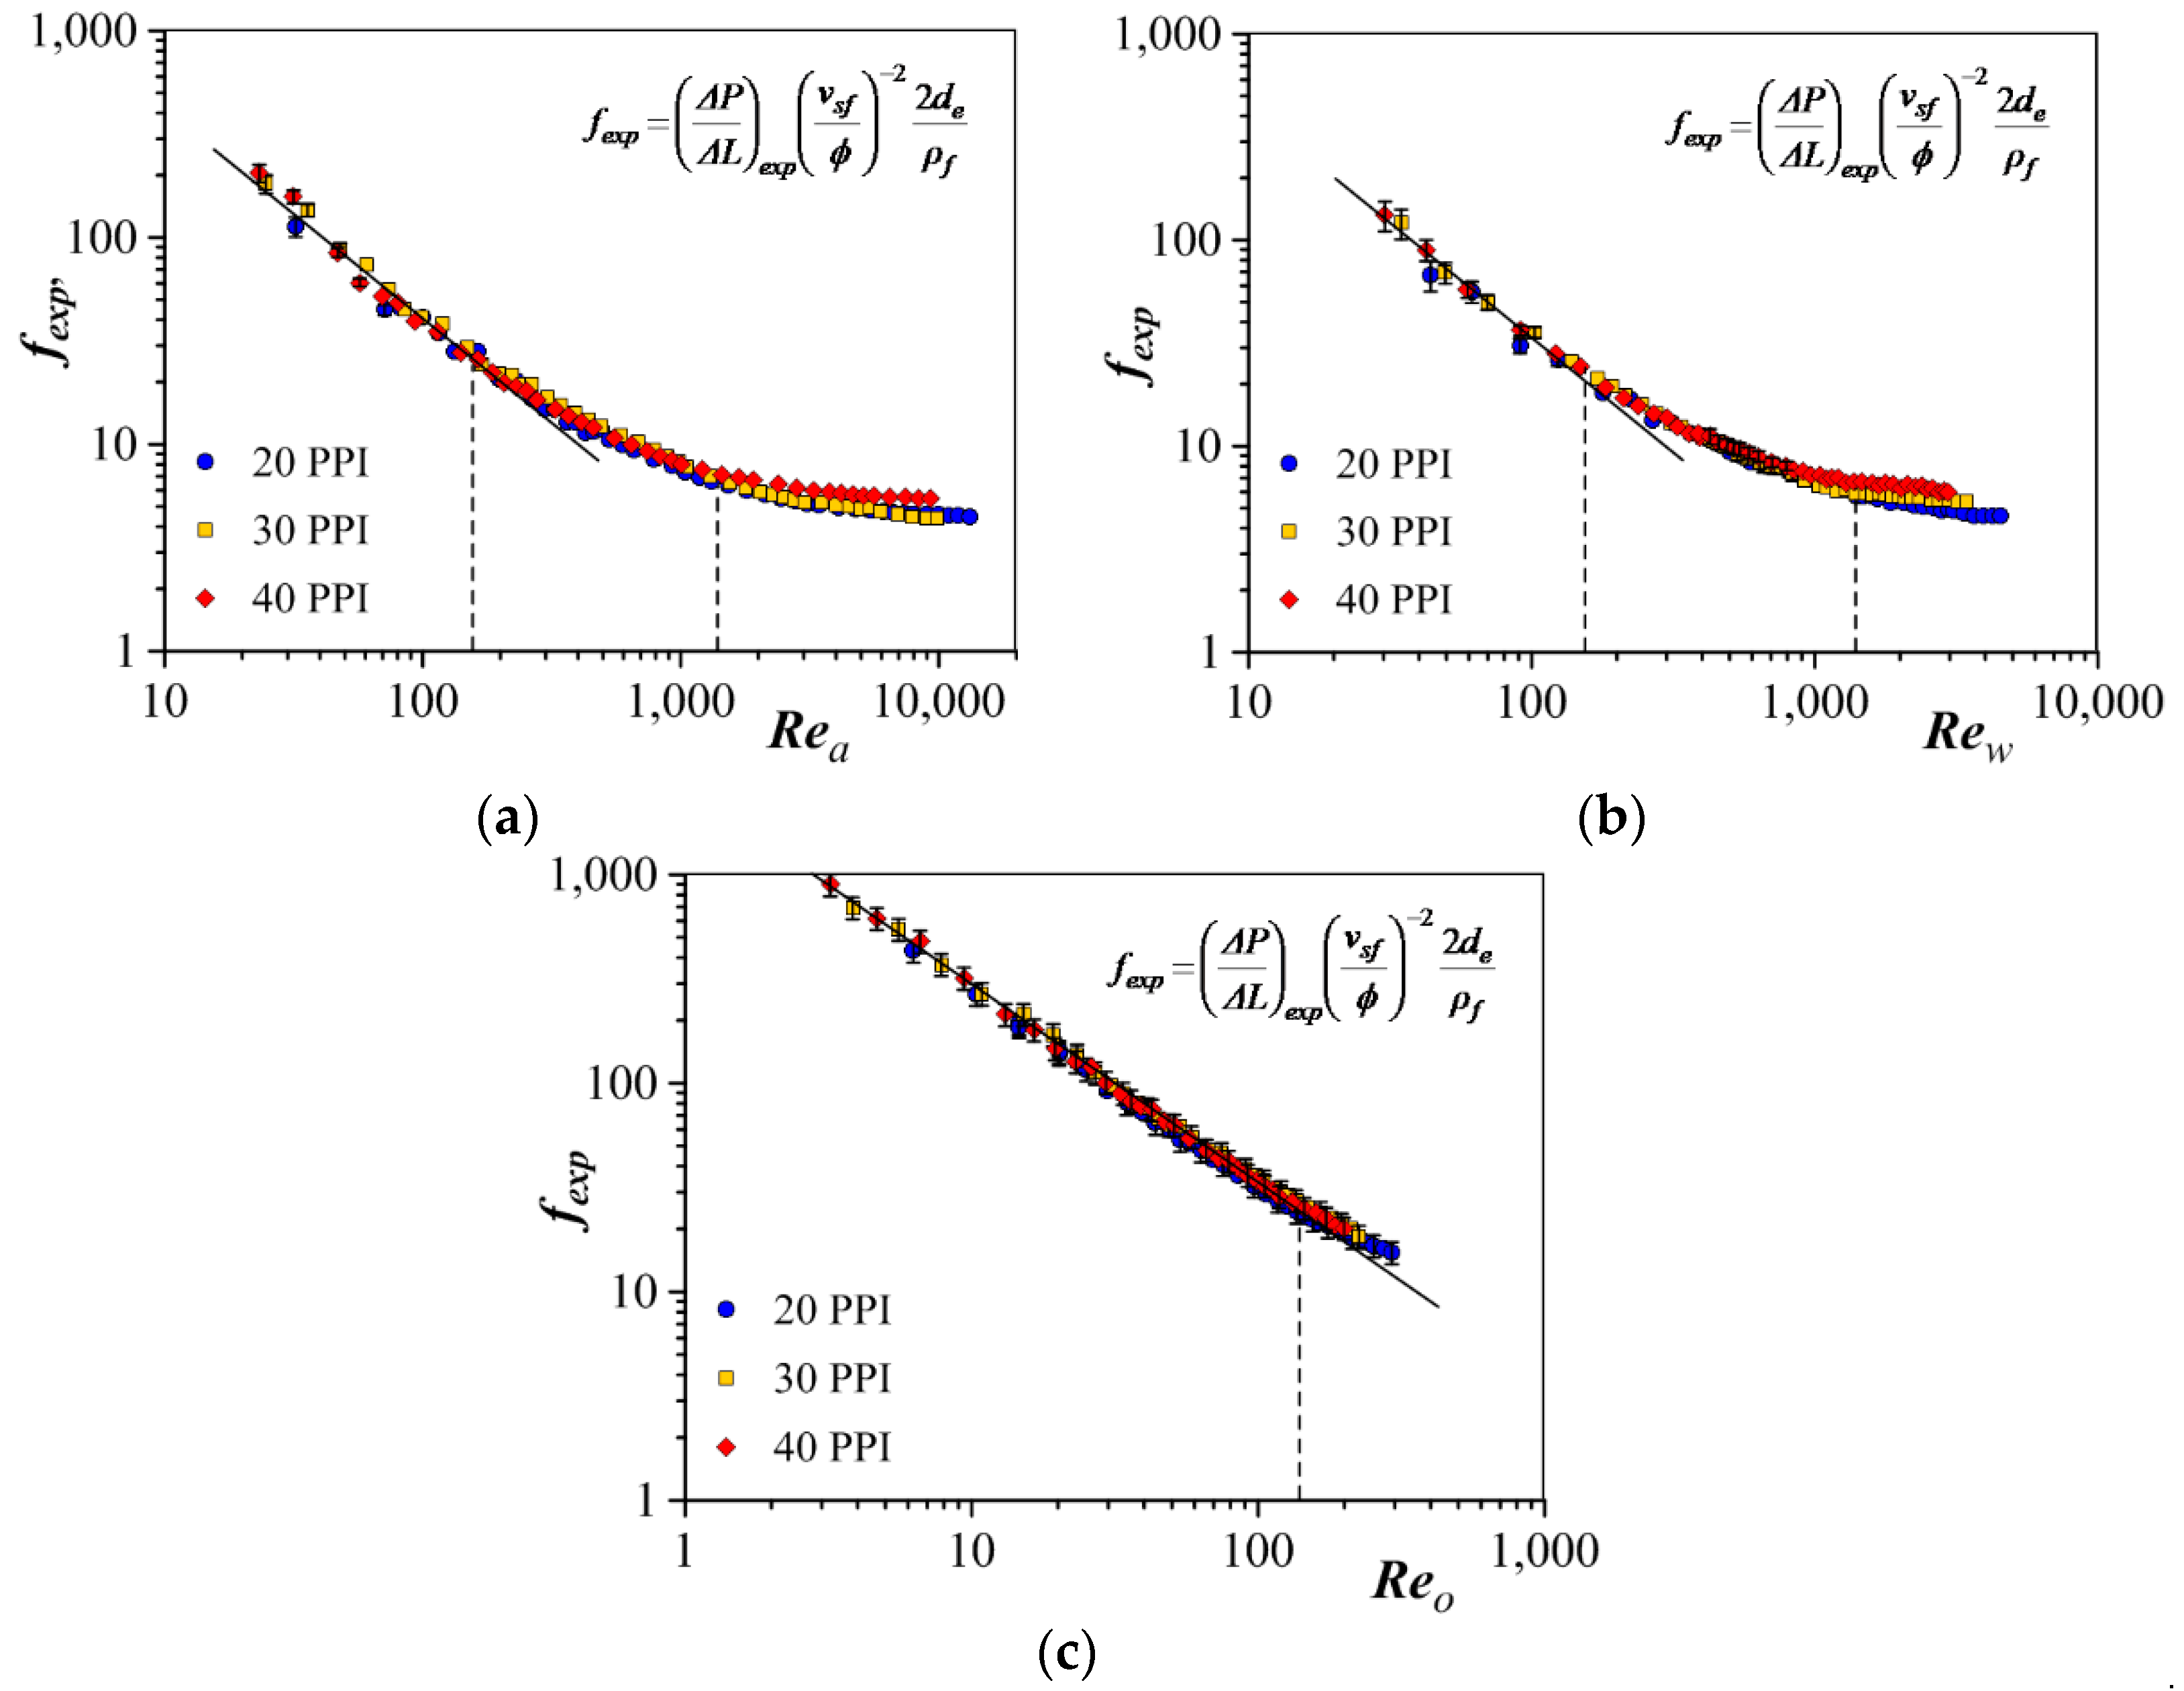
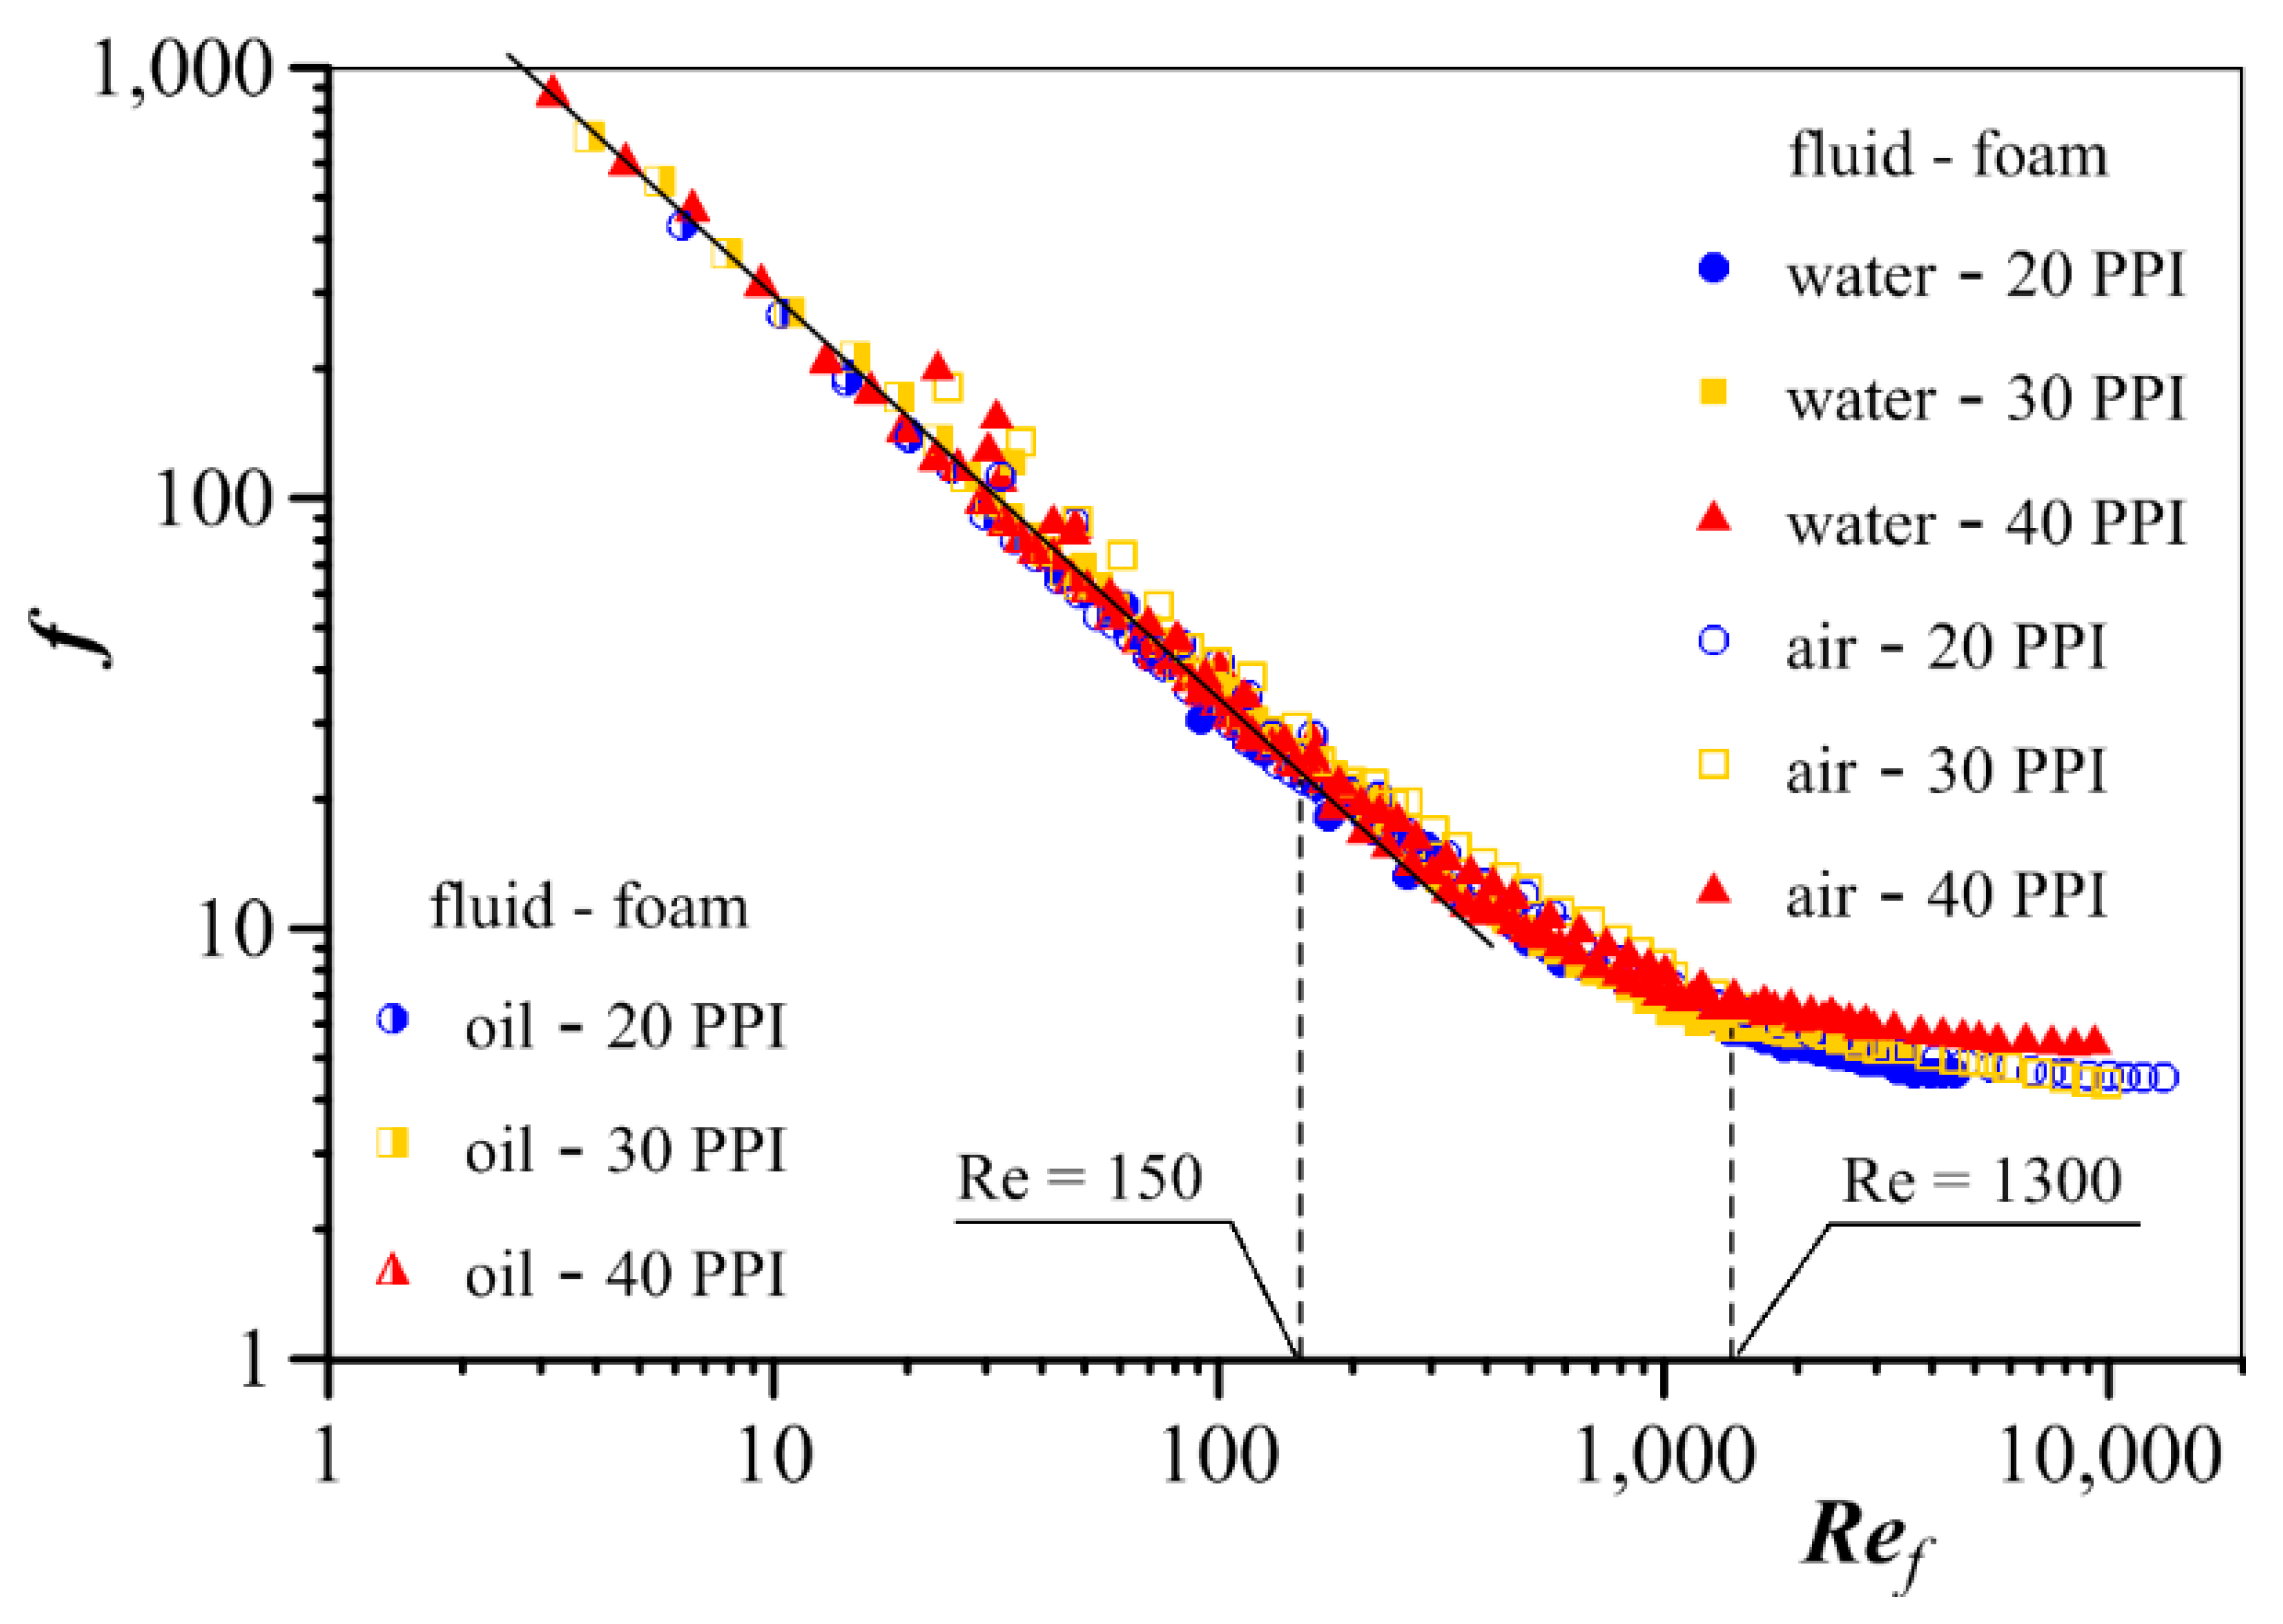
The friction factor, which appears in Equations (7) and (8), must be defined appropriately for flow through metal foams.
Figure 13 collects the friction factor values for all flow cases. The way the Reynolds number and equivalent diameter are defined (Equations (5) and (6)) ensures that for the same flow conditions the friction factor has a similar value regardless of the type of fluid and foam through which it flows. This makes it possible to describe the friction factor with a relation common to all fluids and foams.
Separate formulas describing the friction factor were adopted for the different flow regimes:
Equations (9) and (10) are typical for flow through porous media. In the Froud regime, the influence of foam morphology on the flow hydrodynamics becomes evident; therefore, Equation (11) includes a term that accounts for the geometrical parameters of foam—ϕ, dp and dc.
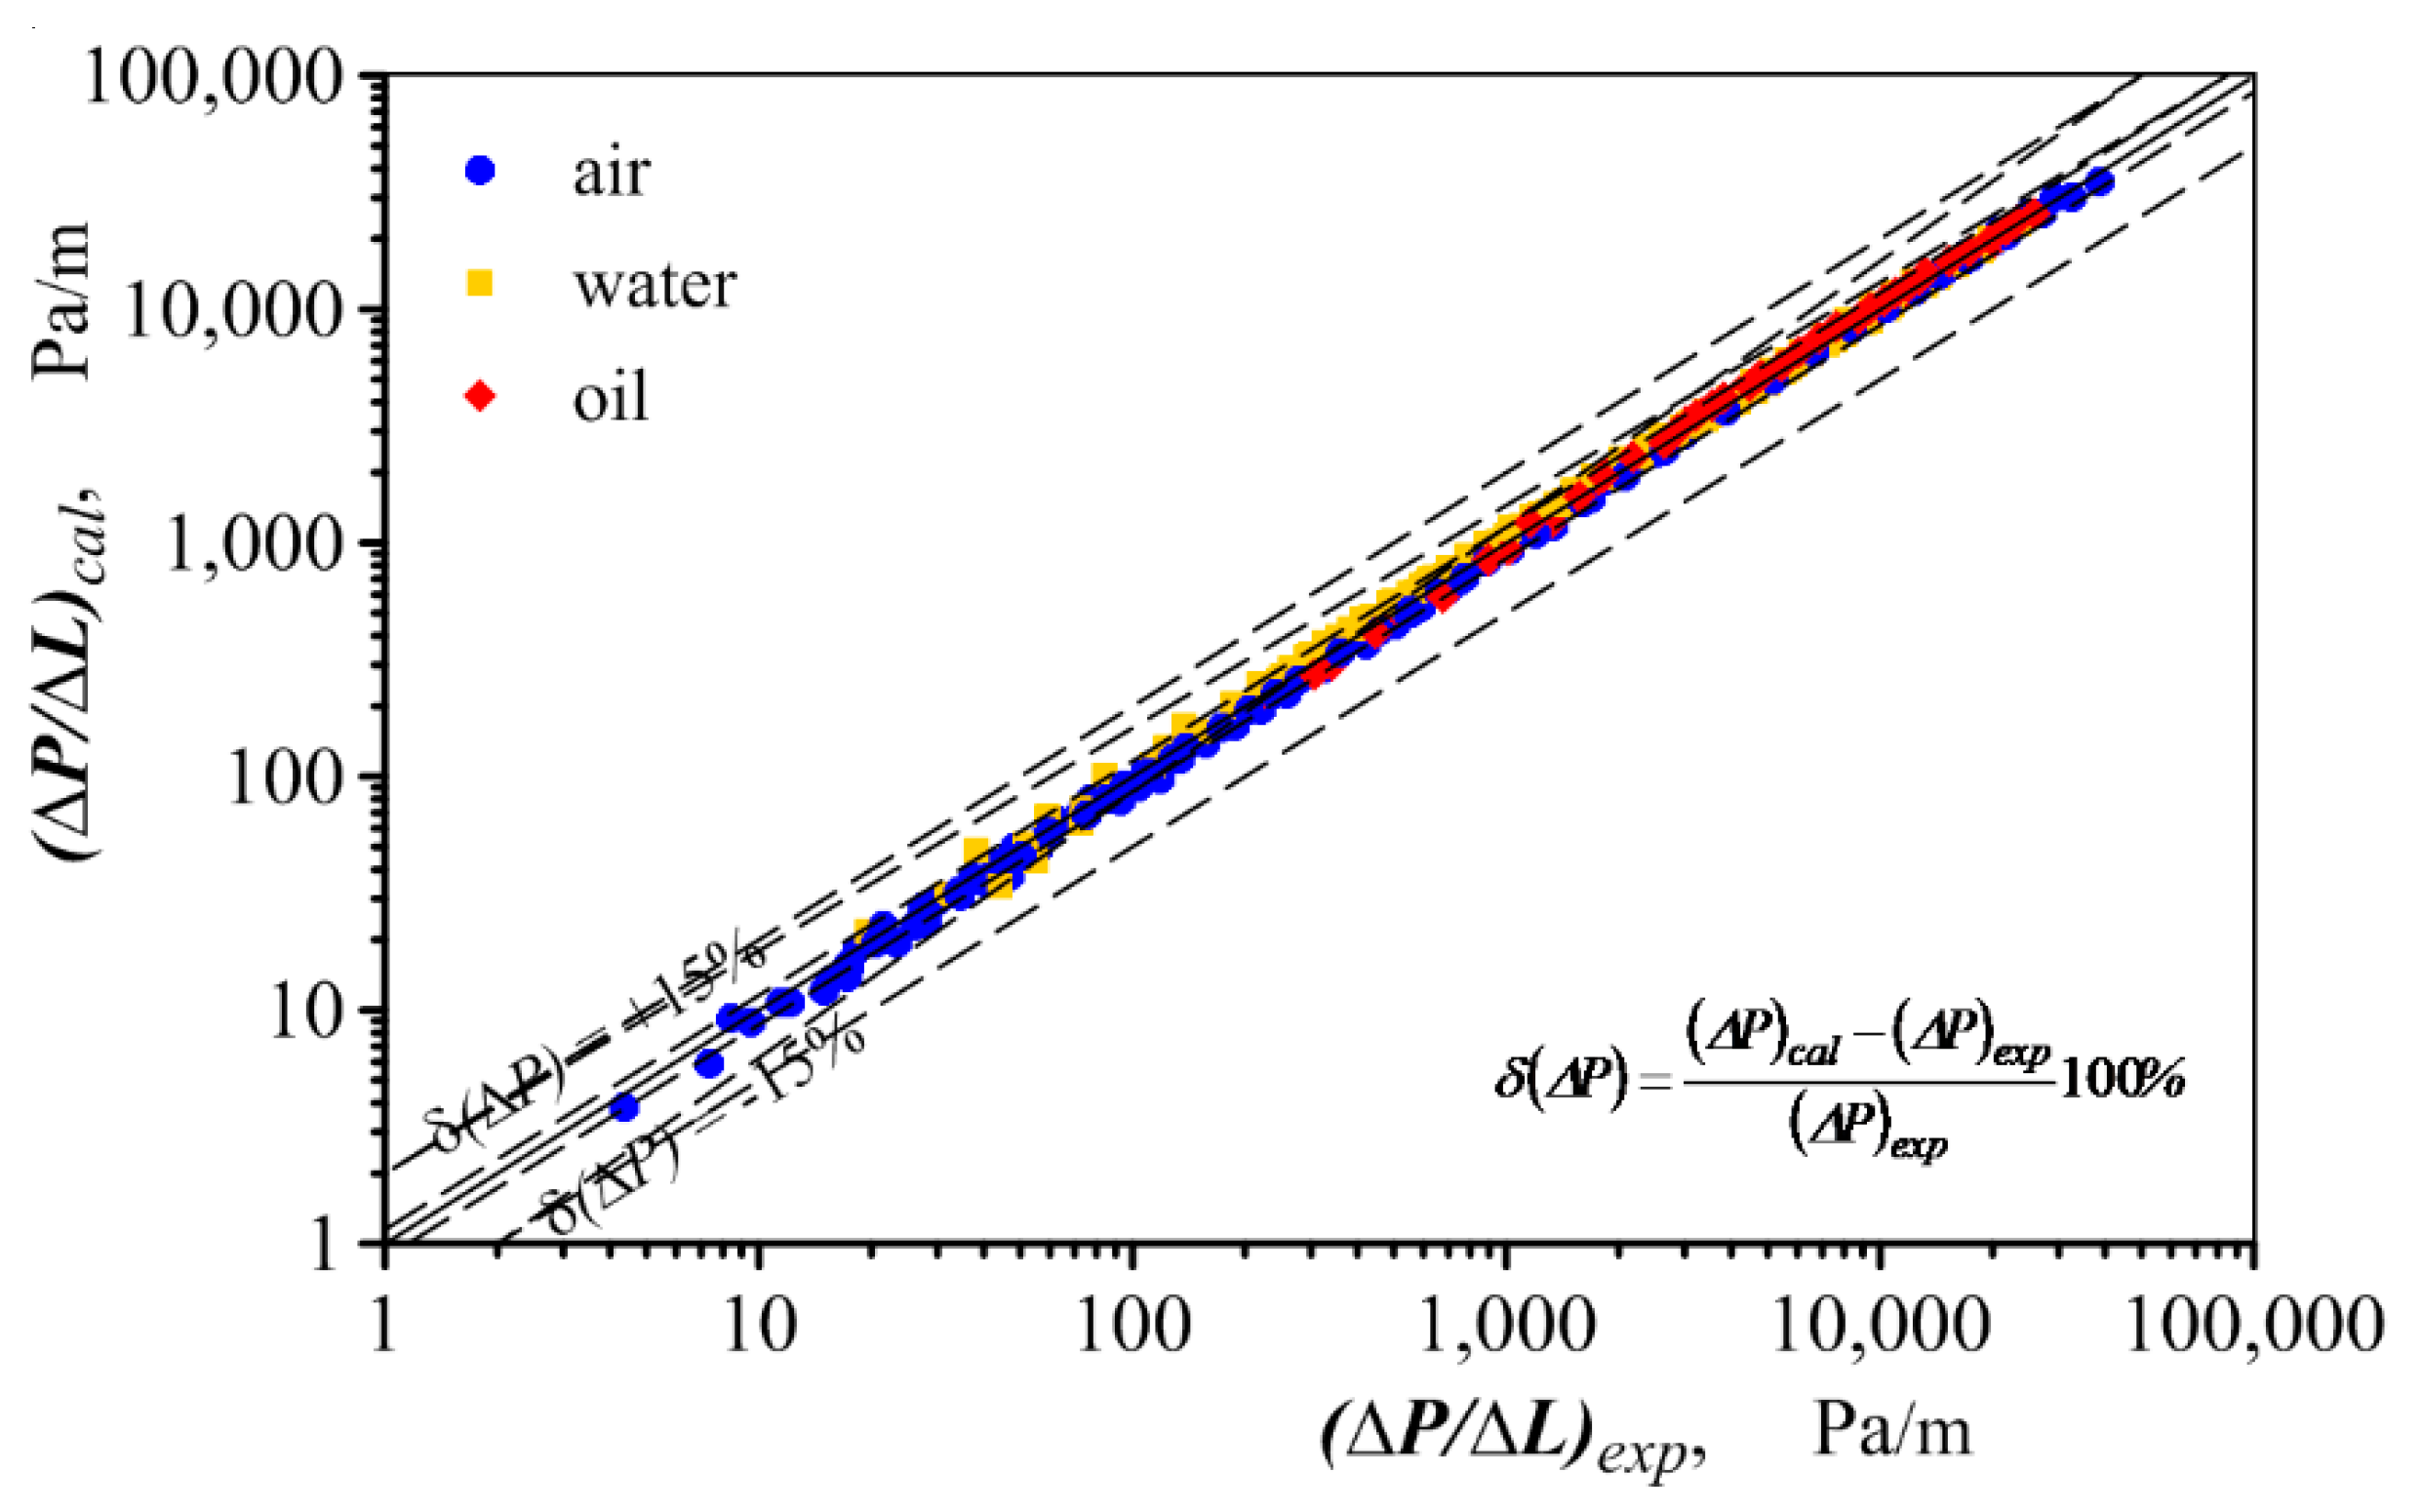
The average error in pressure drop in single-phase flow calculated using the set of Equations (7)–(11) is 9.3%, and 95% of the calculation results have an error smaller than ±15% (
Figure 14).
Measurement results indicate that the pressure drop in gas–liquid flow is usually higher than the sum of pressure drop in single-phase gas and liquid flowing at the same velocities as in two-phase flow. Therefore, we assumed that pressure drop in gas–liquid flow can be described by the relation,
in which the parameter
ΦΔP is a measure of pressure drop amplification in double-phase flow compare to the sum of pressure drops in gas and liquid single-phase flows.
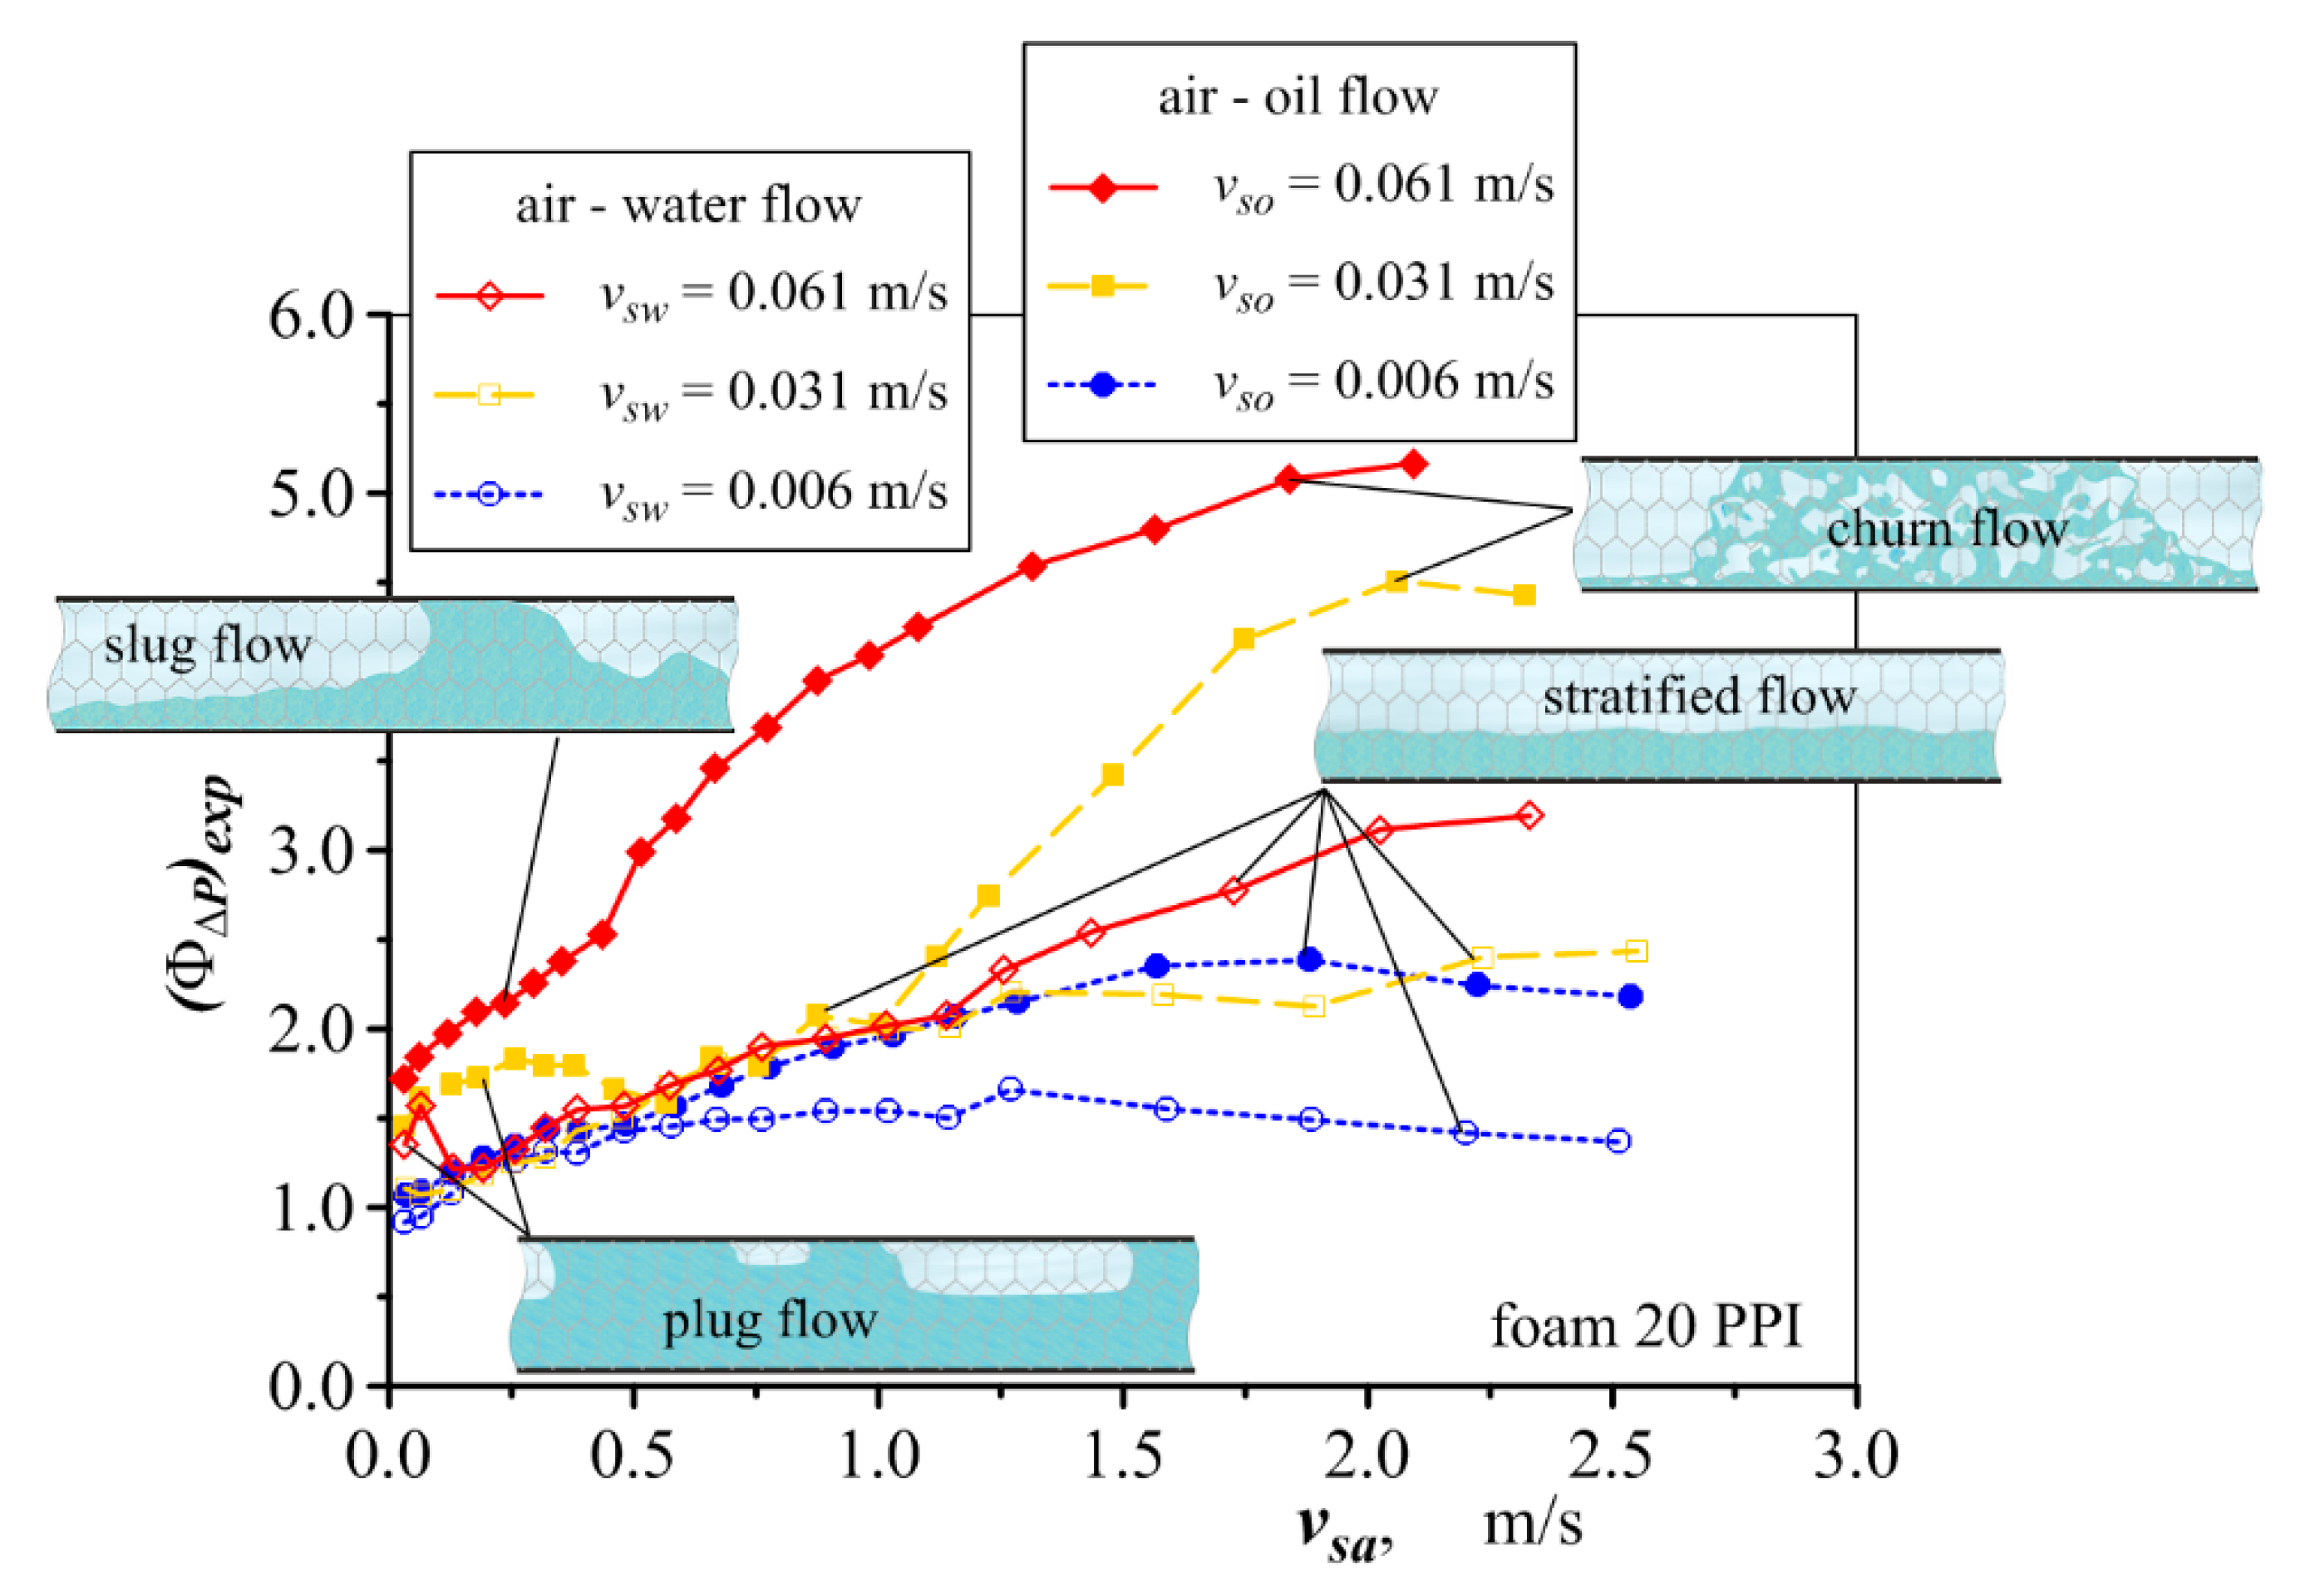
Initially, the pressure drop amplification factor ΦΔP was determined based on measured pressure drops in single-phase and two-phase flows. The data obtained indicate that the value of the pressure drop amplification factor depends on several factors. One of these includes fluid velocity. In two-phase flow, an increase in velocity causes a more intensive interaction between liquid and gas, which results in a greater dispersion of energy than in single-phase flow (for the same increase in velocity).
For this reason, the increase in pressure drop in single-phase gas–liquid flows does not correspond to a change in pressure drop in gas–liquid flow, and the pressure amplification factor takes a value greater than 1 (
Figure 15). The friction factor only takes the value smaller than 1 in the few cases where there is a reduction in pressure drop in two-phase flow, associated with changes in flow patterns.
Figure 15 only presents selected representative data to ensure the legibility of the graph. The pressure drop amplification factor value for air–oil flow is higher than for air–water flow. This proves that the fluid properties must be taken into account in the mathematical description of the amplification factor.
The analysis of correlation calculations and the significance test of various factors indicate that the amplification factor can be described by the equation,
The influence of the velocity and physical properties of the fluids on the amplification factor has been captured by Reynolds numbers. The importance of fluid viscosity and density is so great that it was necessary to introduce an additional term in Equation (13) to capture these properties.
The exponent
n at the
Reg number is a measure of the fluid-gas interaction, and was described using quantities characterising fluid flow—the friction factor
fl and the Darcy number
Dal,
where:
fl is determined in line with Equation (9), (10) or (11).
The Darcy number is described by the equation,
in which
K is the foam permeability.
The
Ygl parameter is described with the equation,
where: (Δ
P/Δ
L)
gl expresses pressure drop in gas flowing with a velocity equal to liquid velocity.
As mentioned earlier, the pressure drop in stratified flow is significantly lower than that of plug, slug and churn flows, which manifests itself in the discontinuity of the pressure drop curve when stratified flow changes into another type of flow (or vice versa). Therefore, the values of constants and exponents in Equations (13) and (14) were determined separately for stratified and other flows. For stratified flow:
for plug. slug and churn flows.
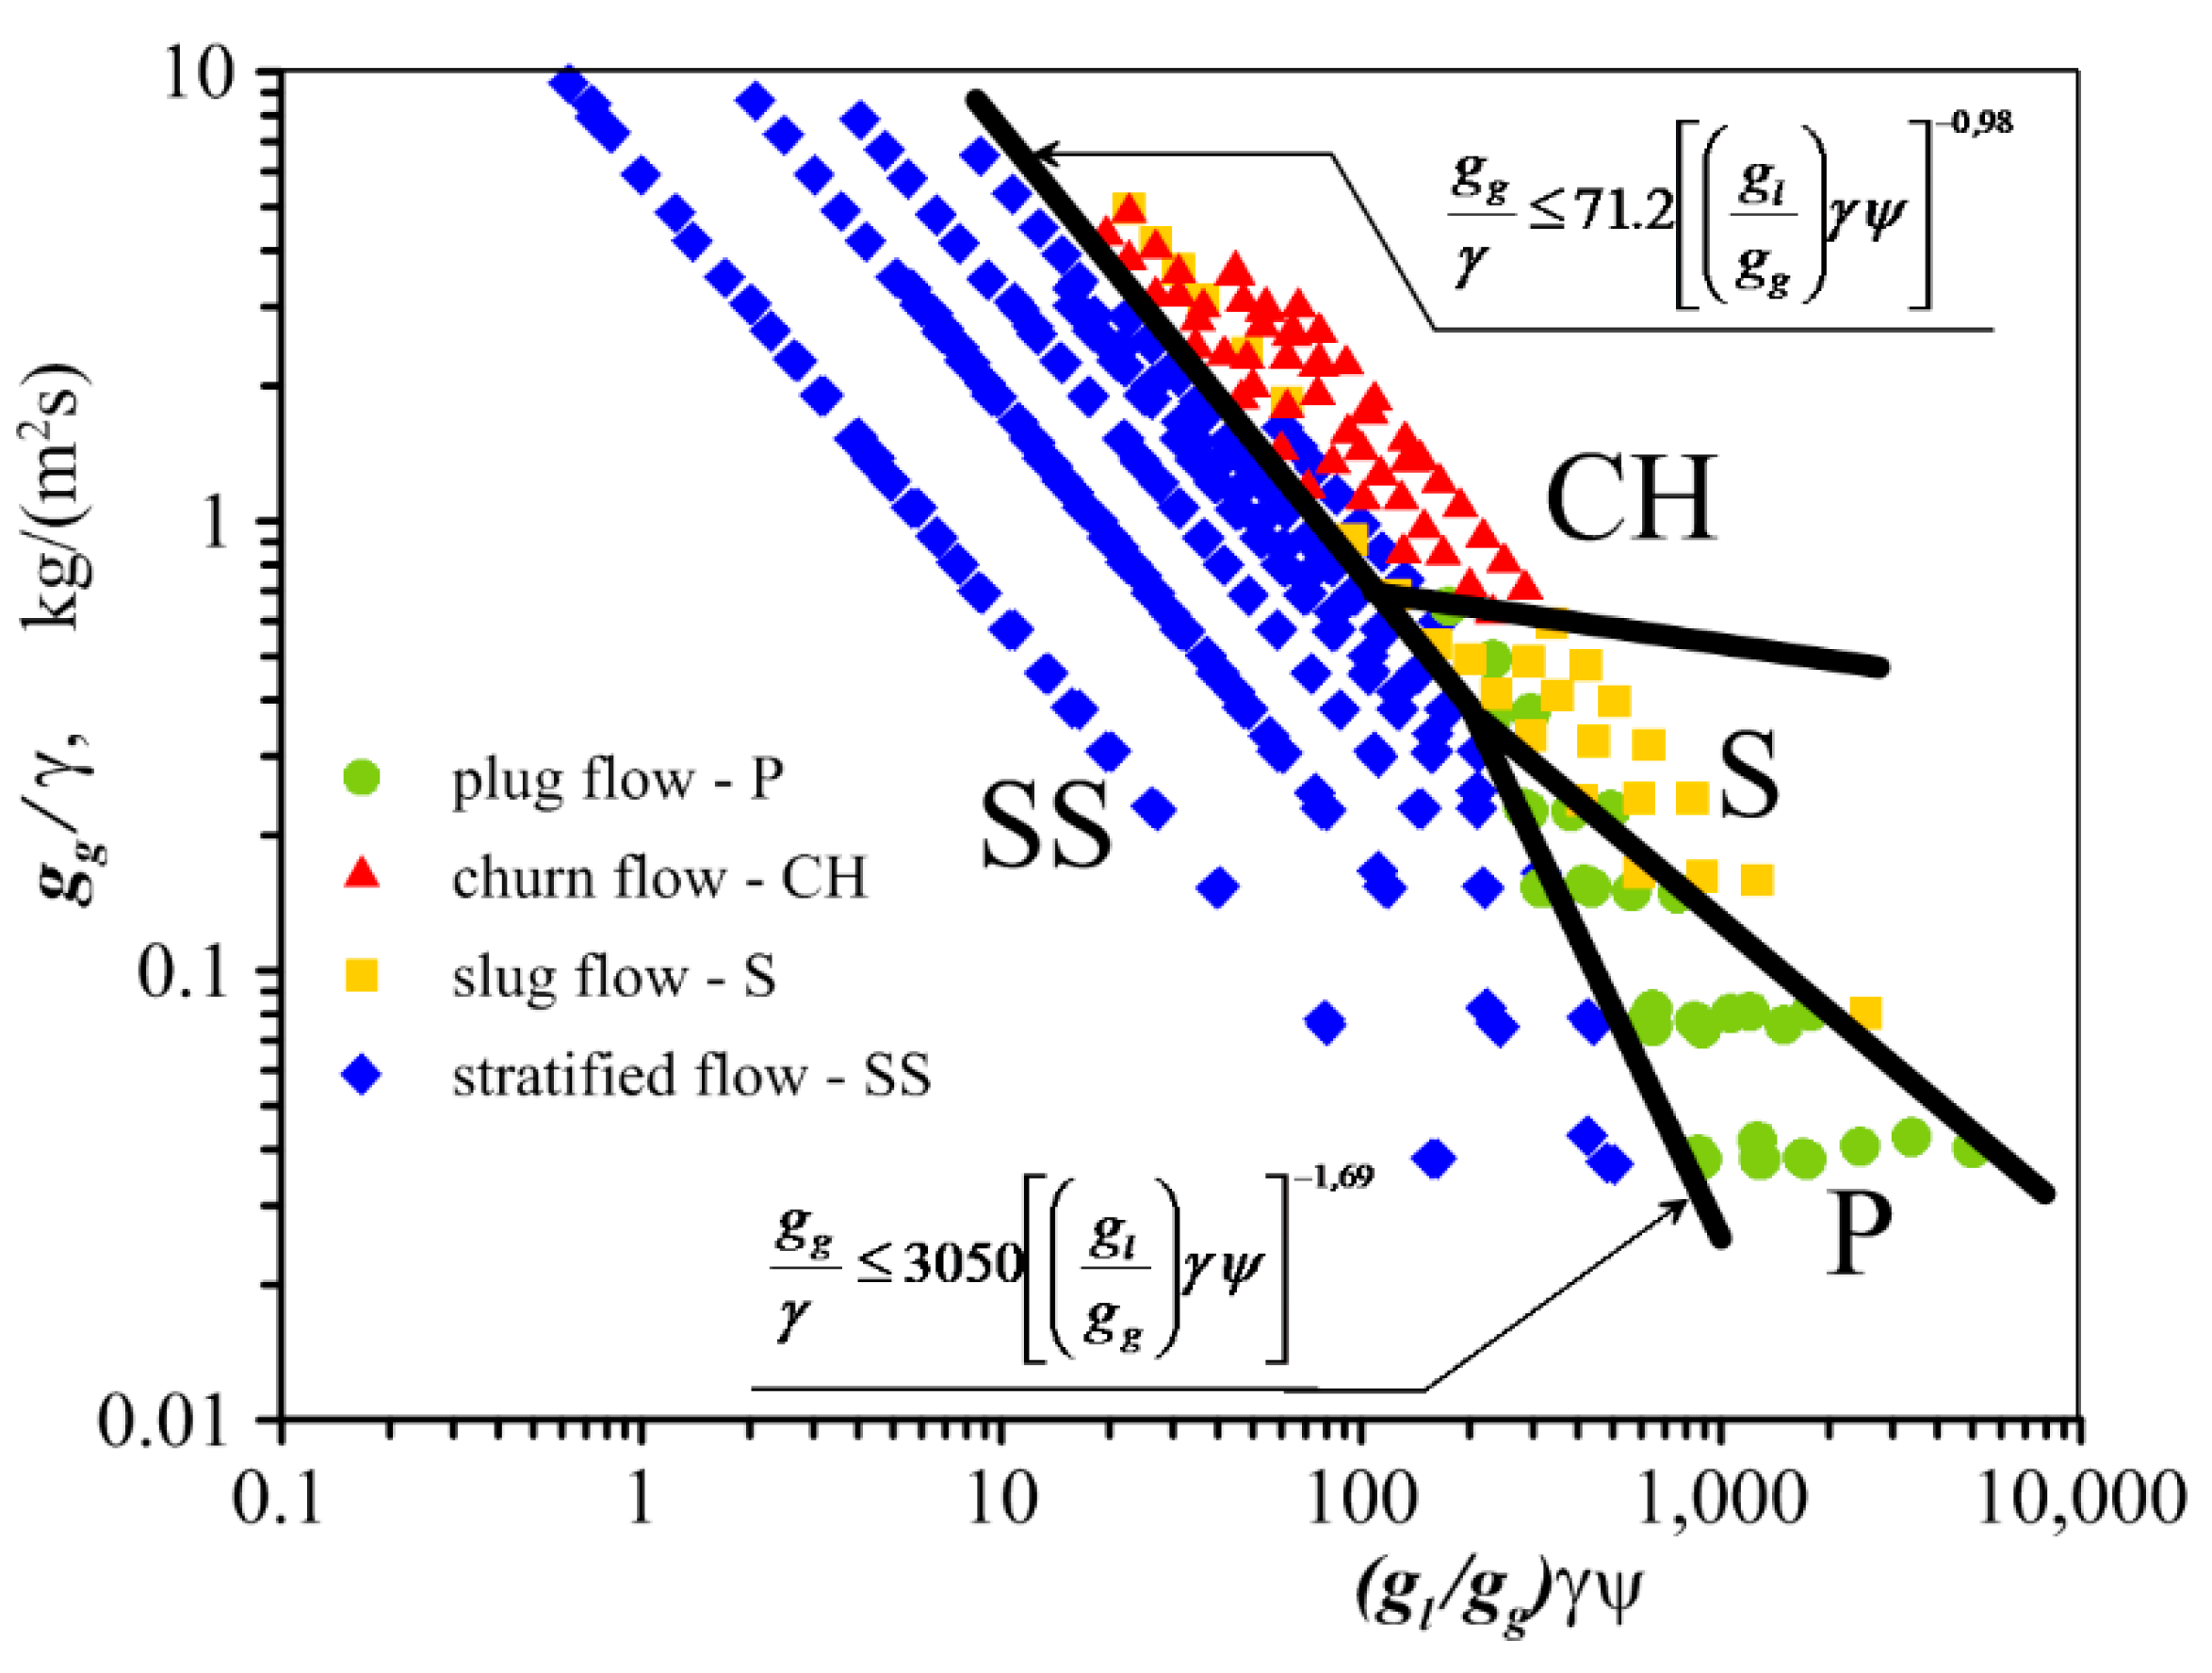
The type of flow pattern can be determined using the flow map shown in
Figure 16 that we developed in [
48].
According to this map, stratified flow occurs when the following conditions are met:
where: g—mass flux
Dimensionless parameters
γ and
ψ describe equations,
where:
σ—surface tension.
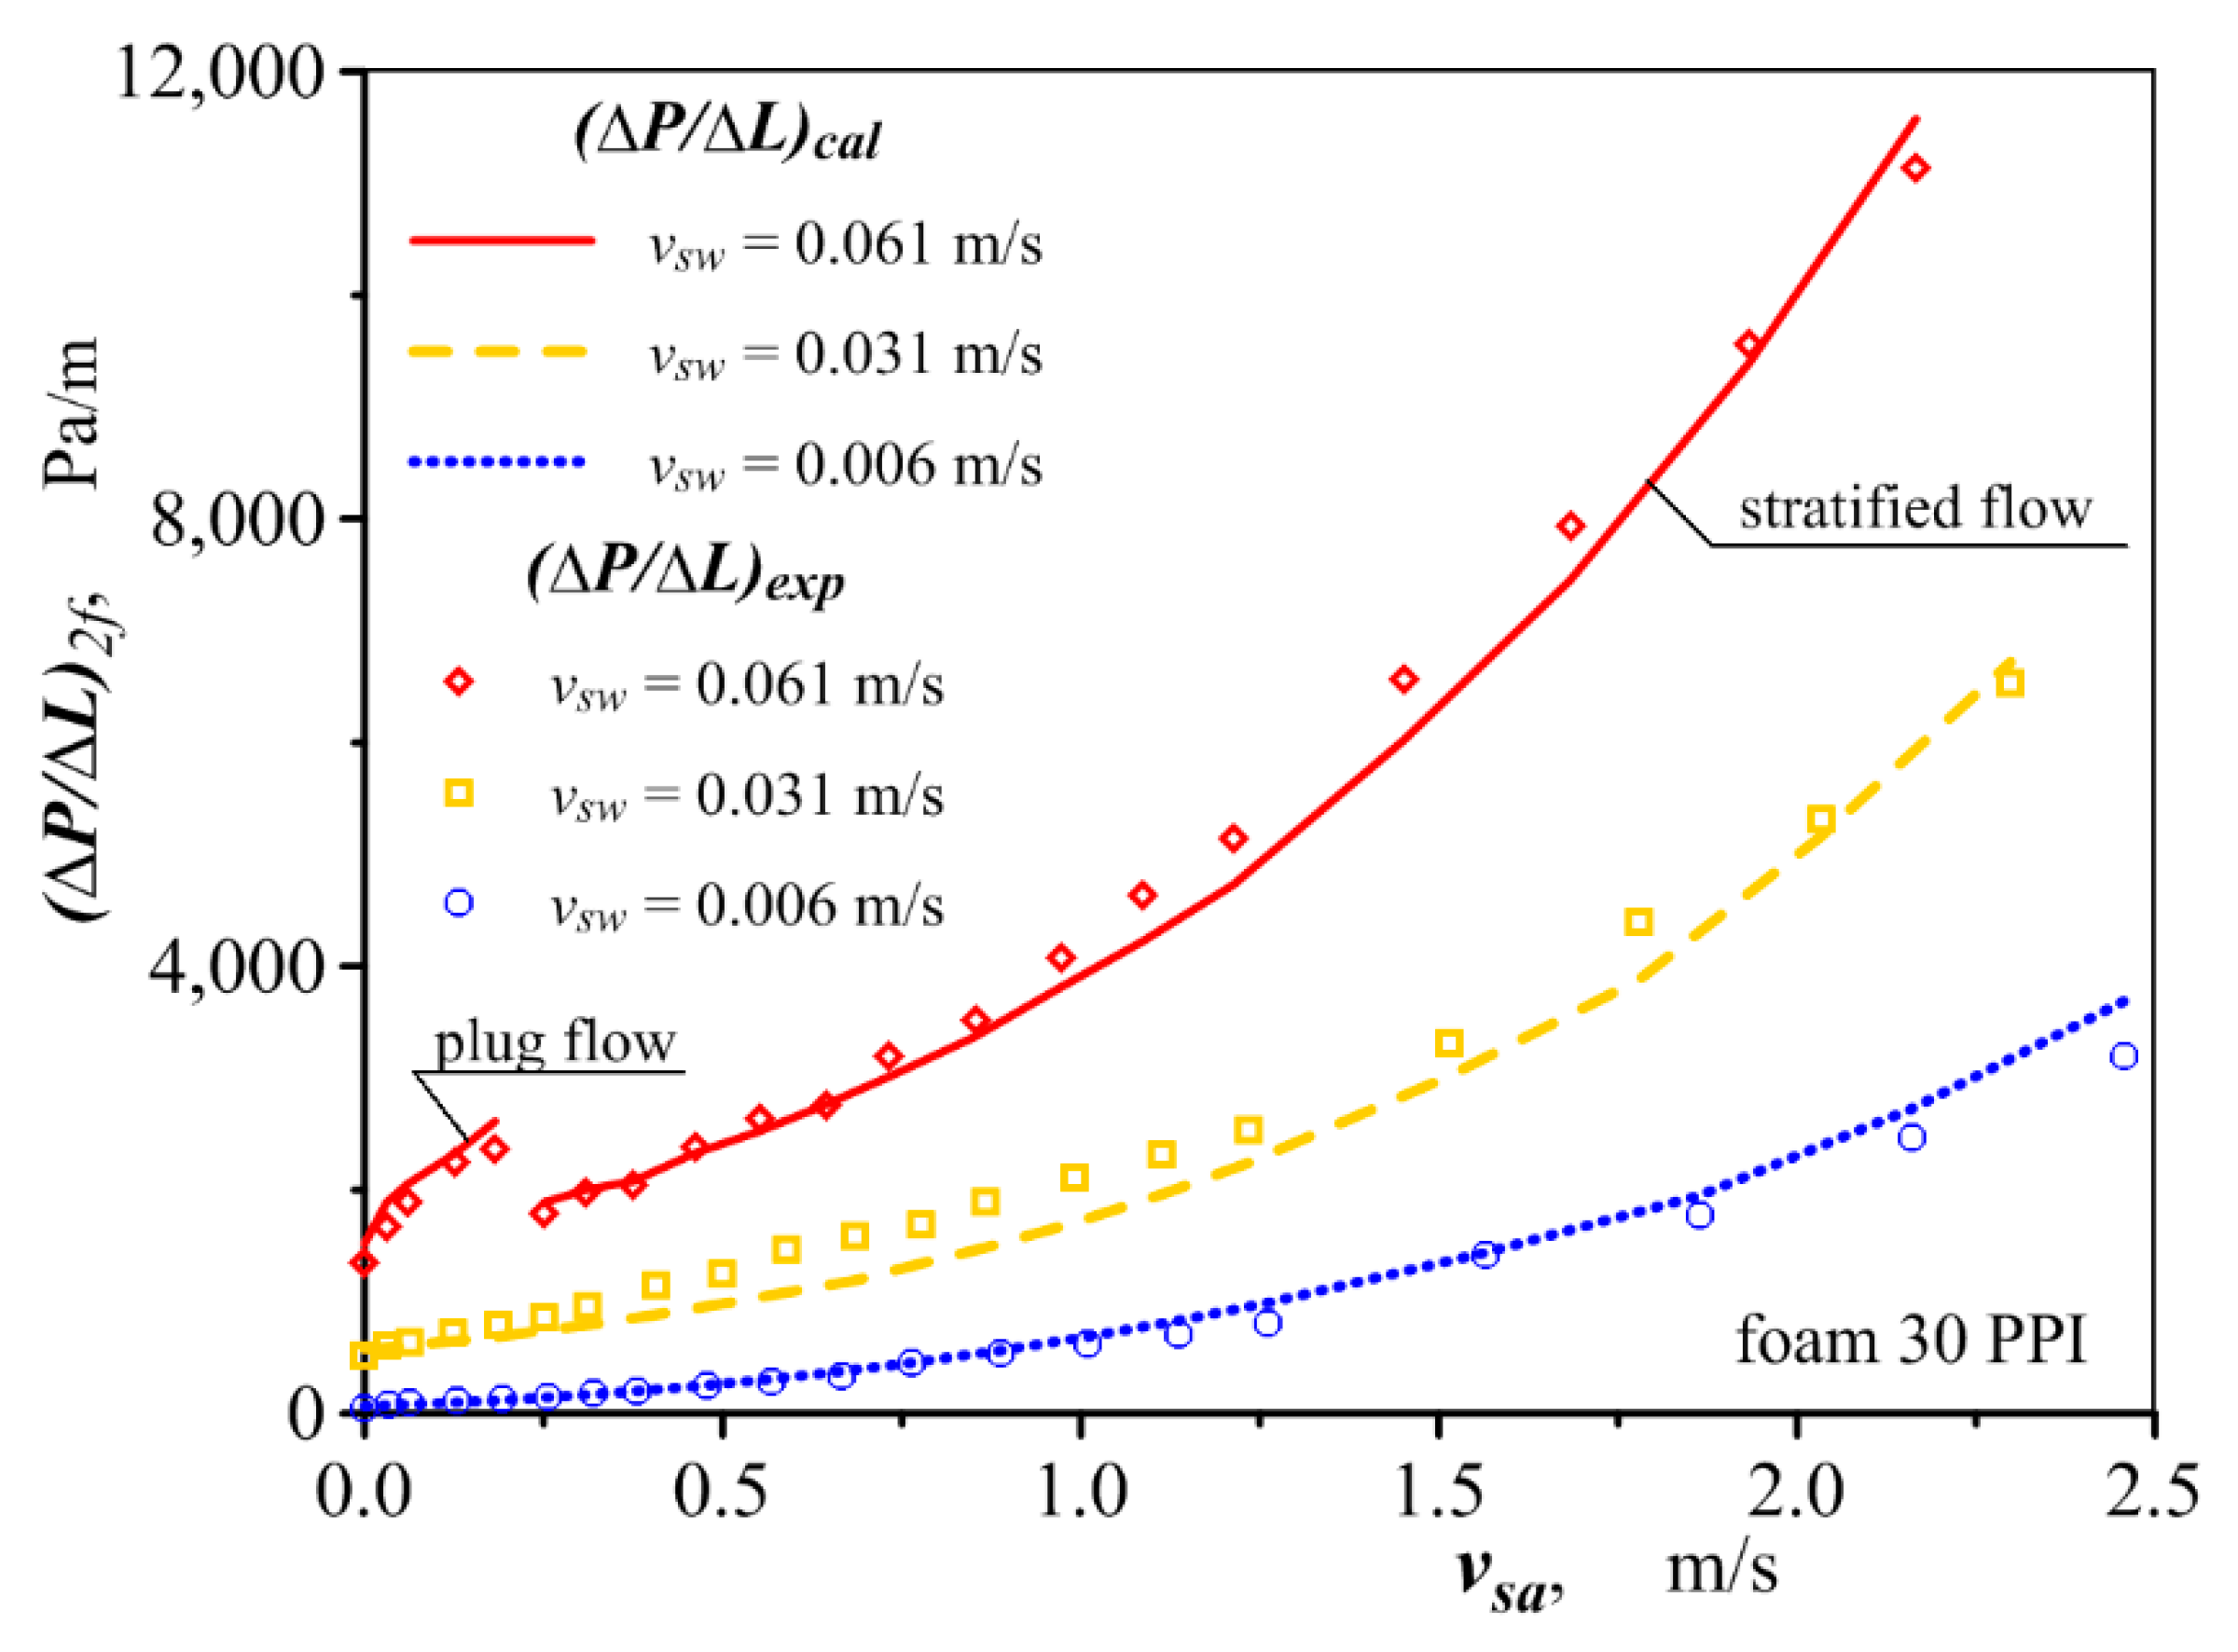
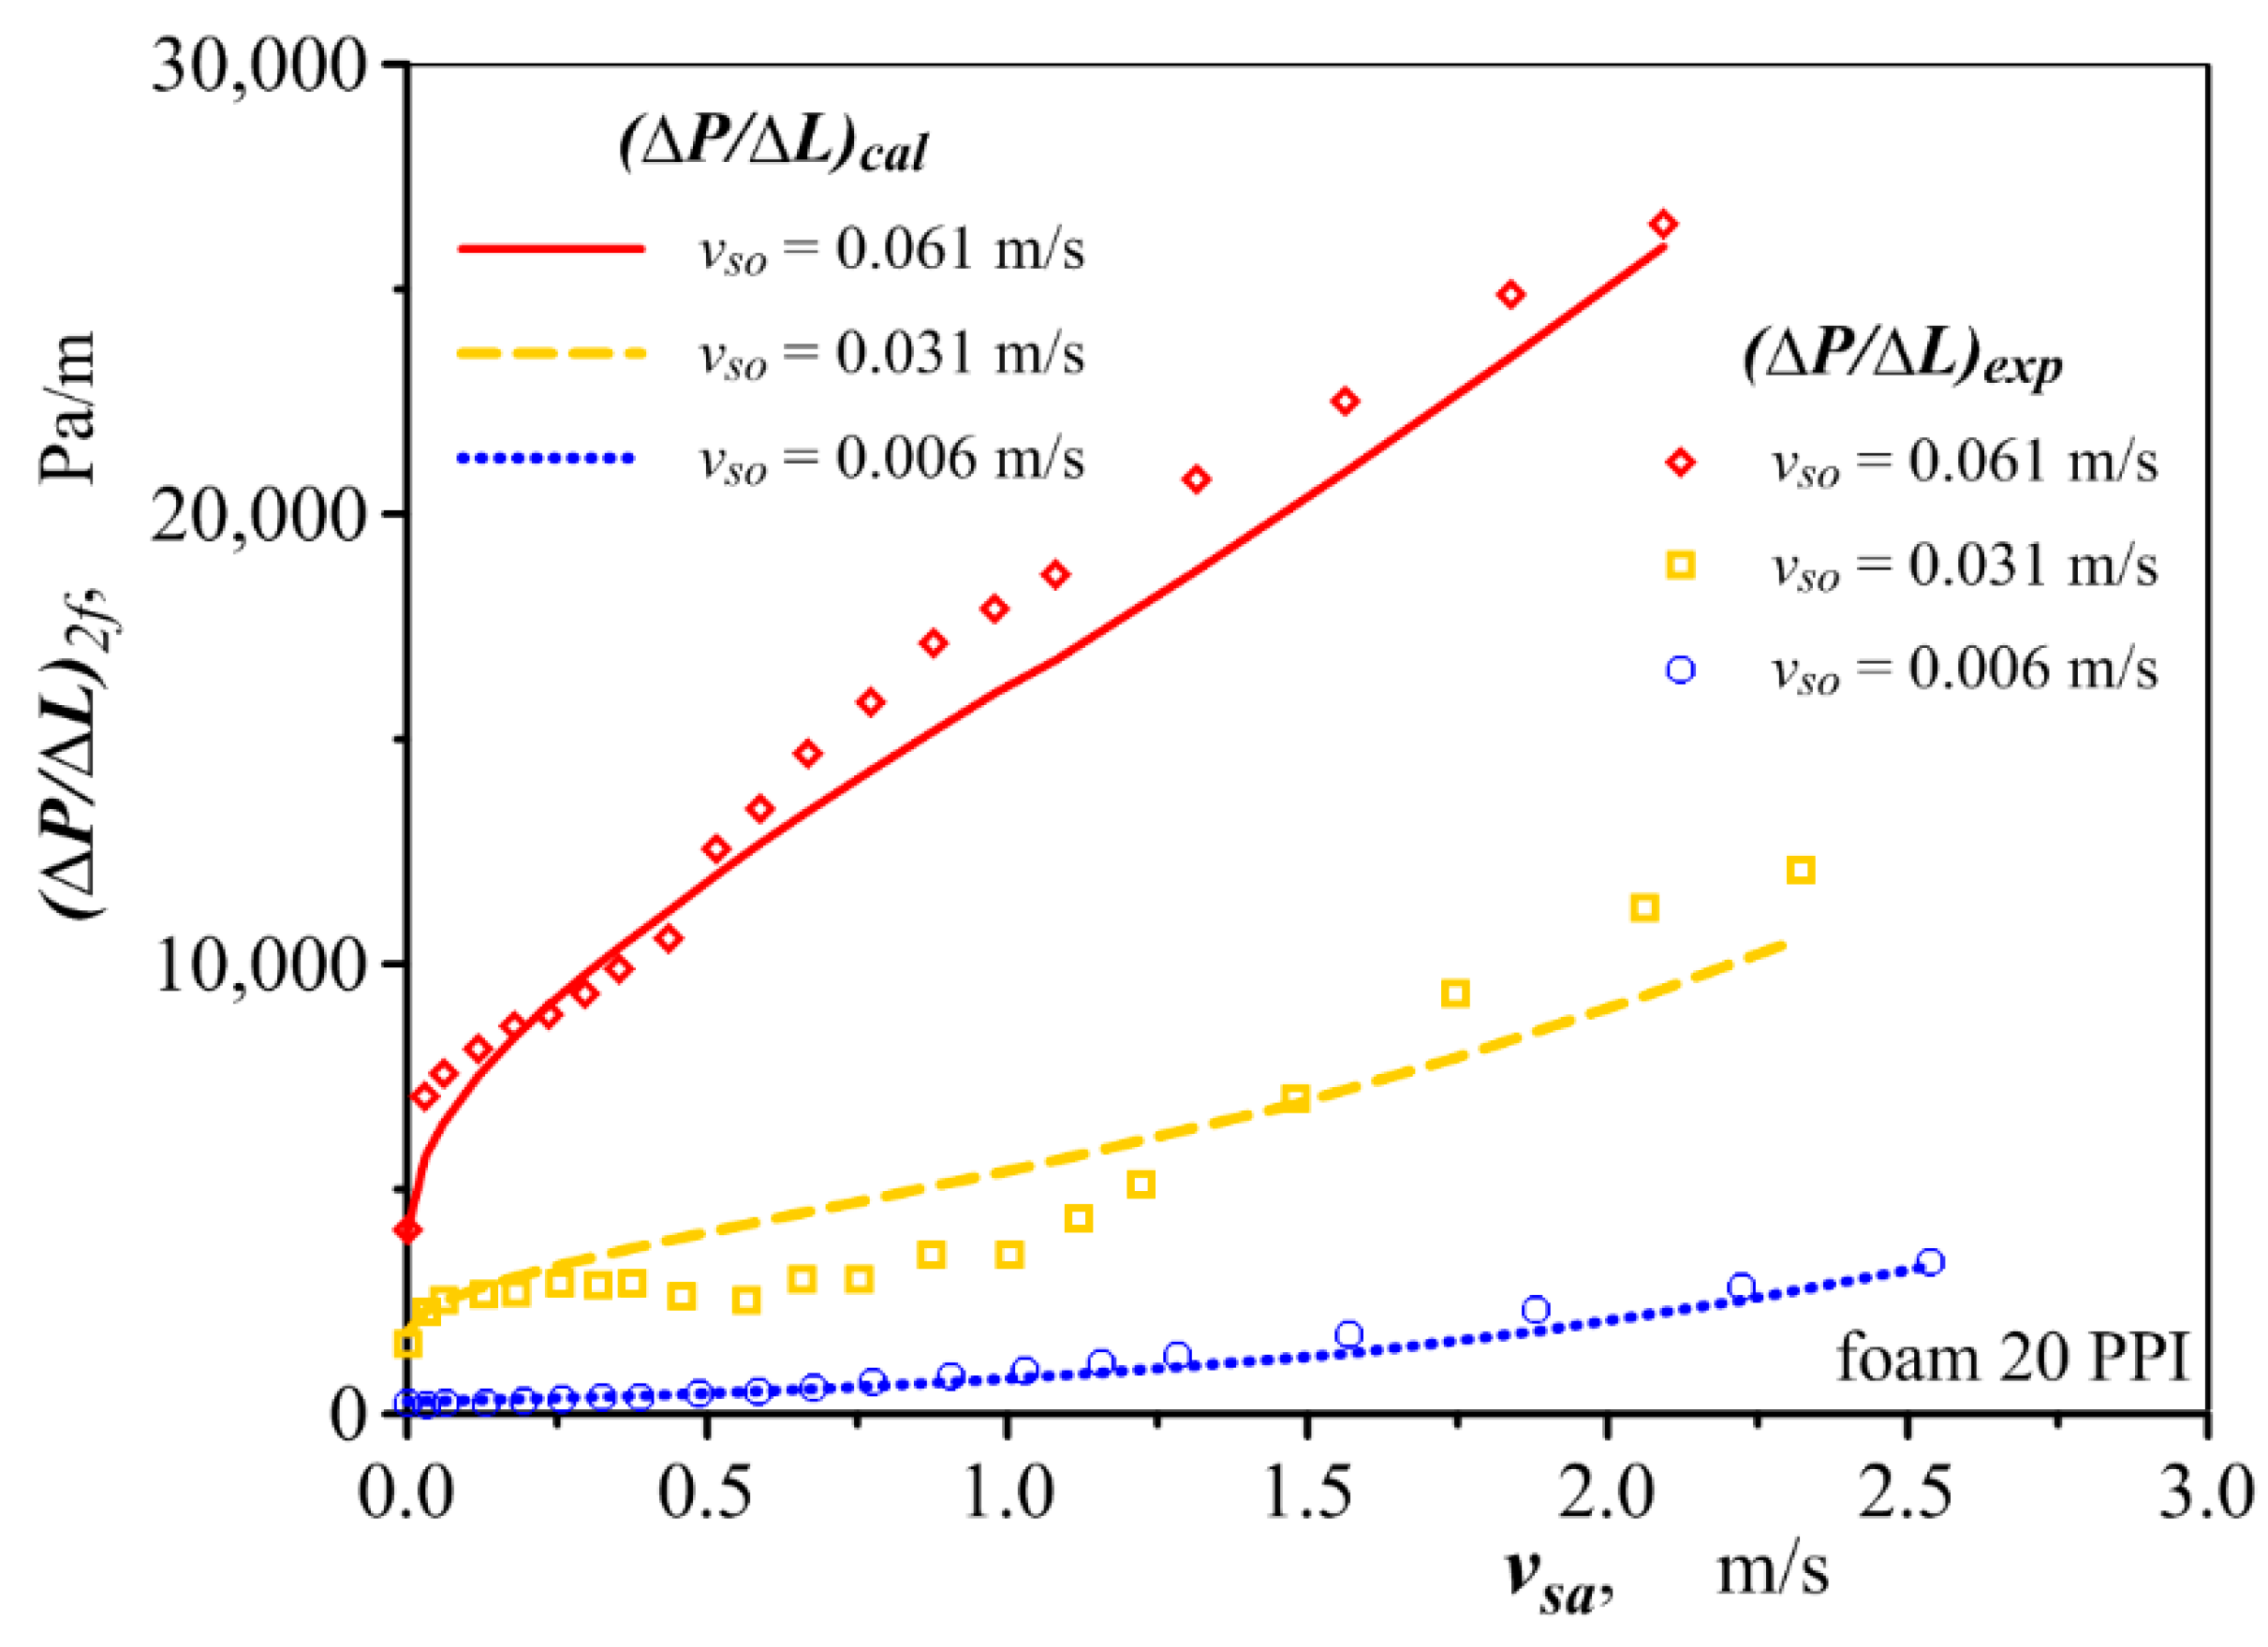
The results obtained based on Equation (12) and the complementary relationships reflect well the value and course of change in pressure drop in two-phase flow, as illustrated in
Figure 17 and
Figure 18, for selected air–water and air–oil flow conditions.
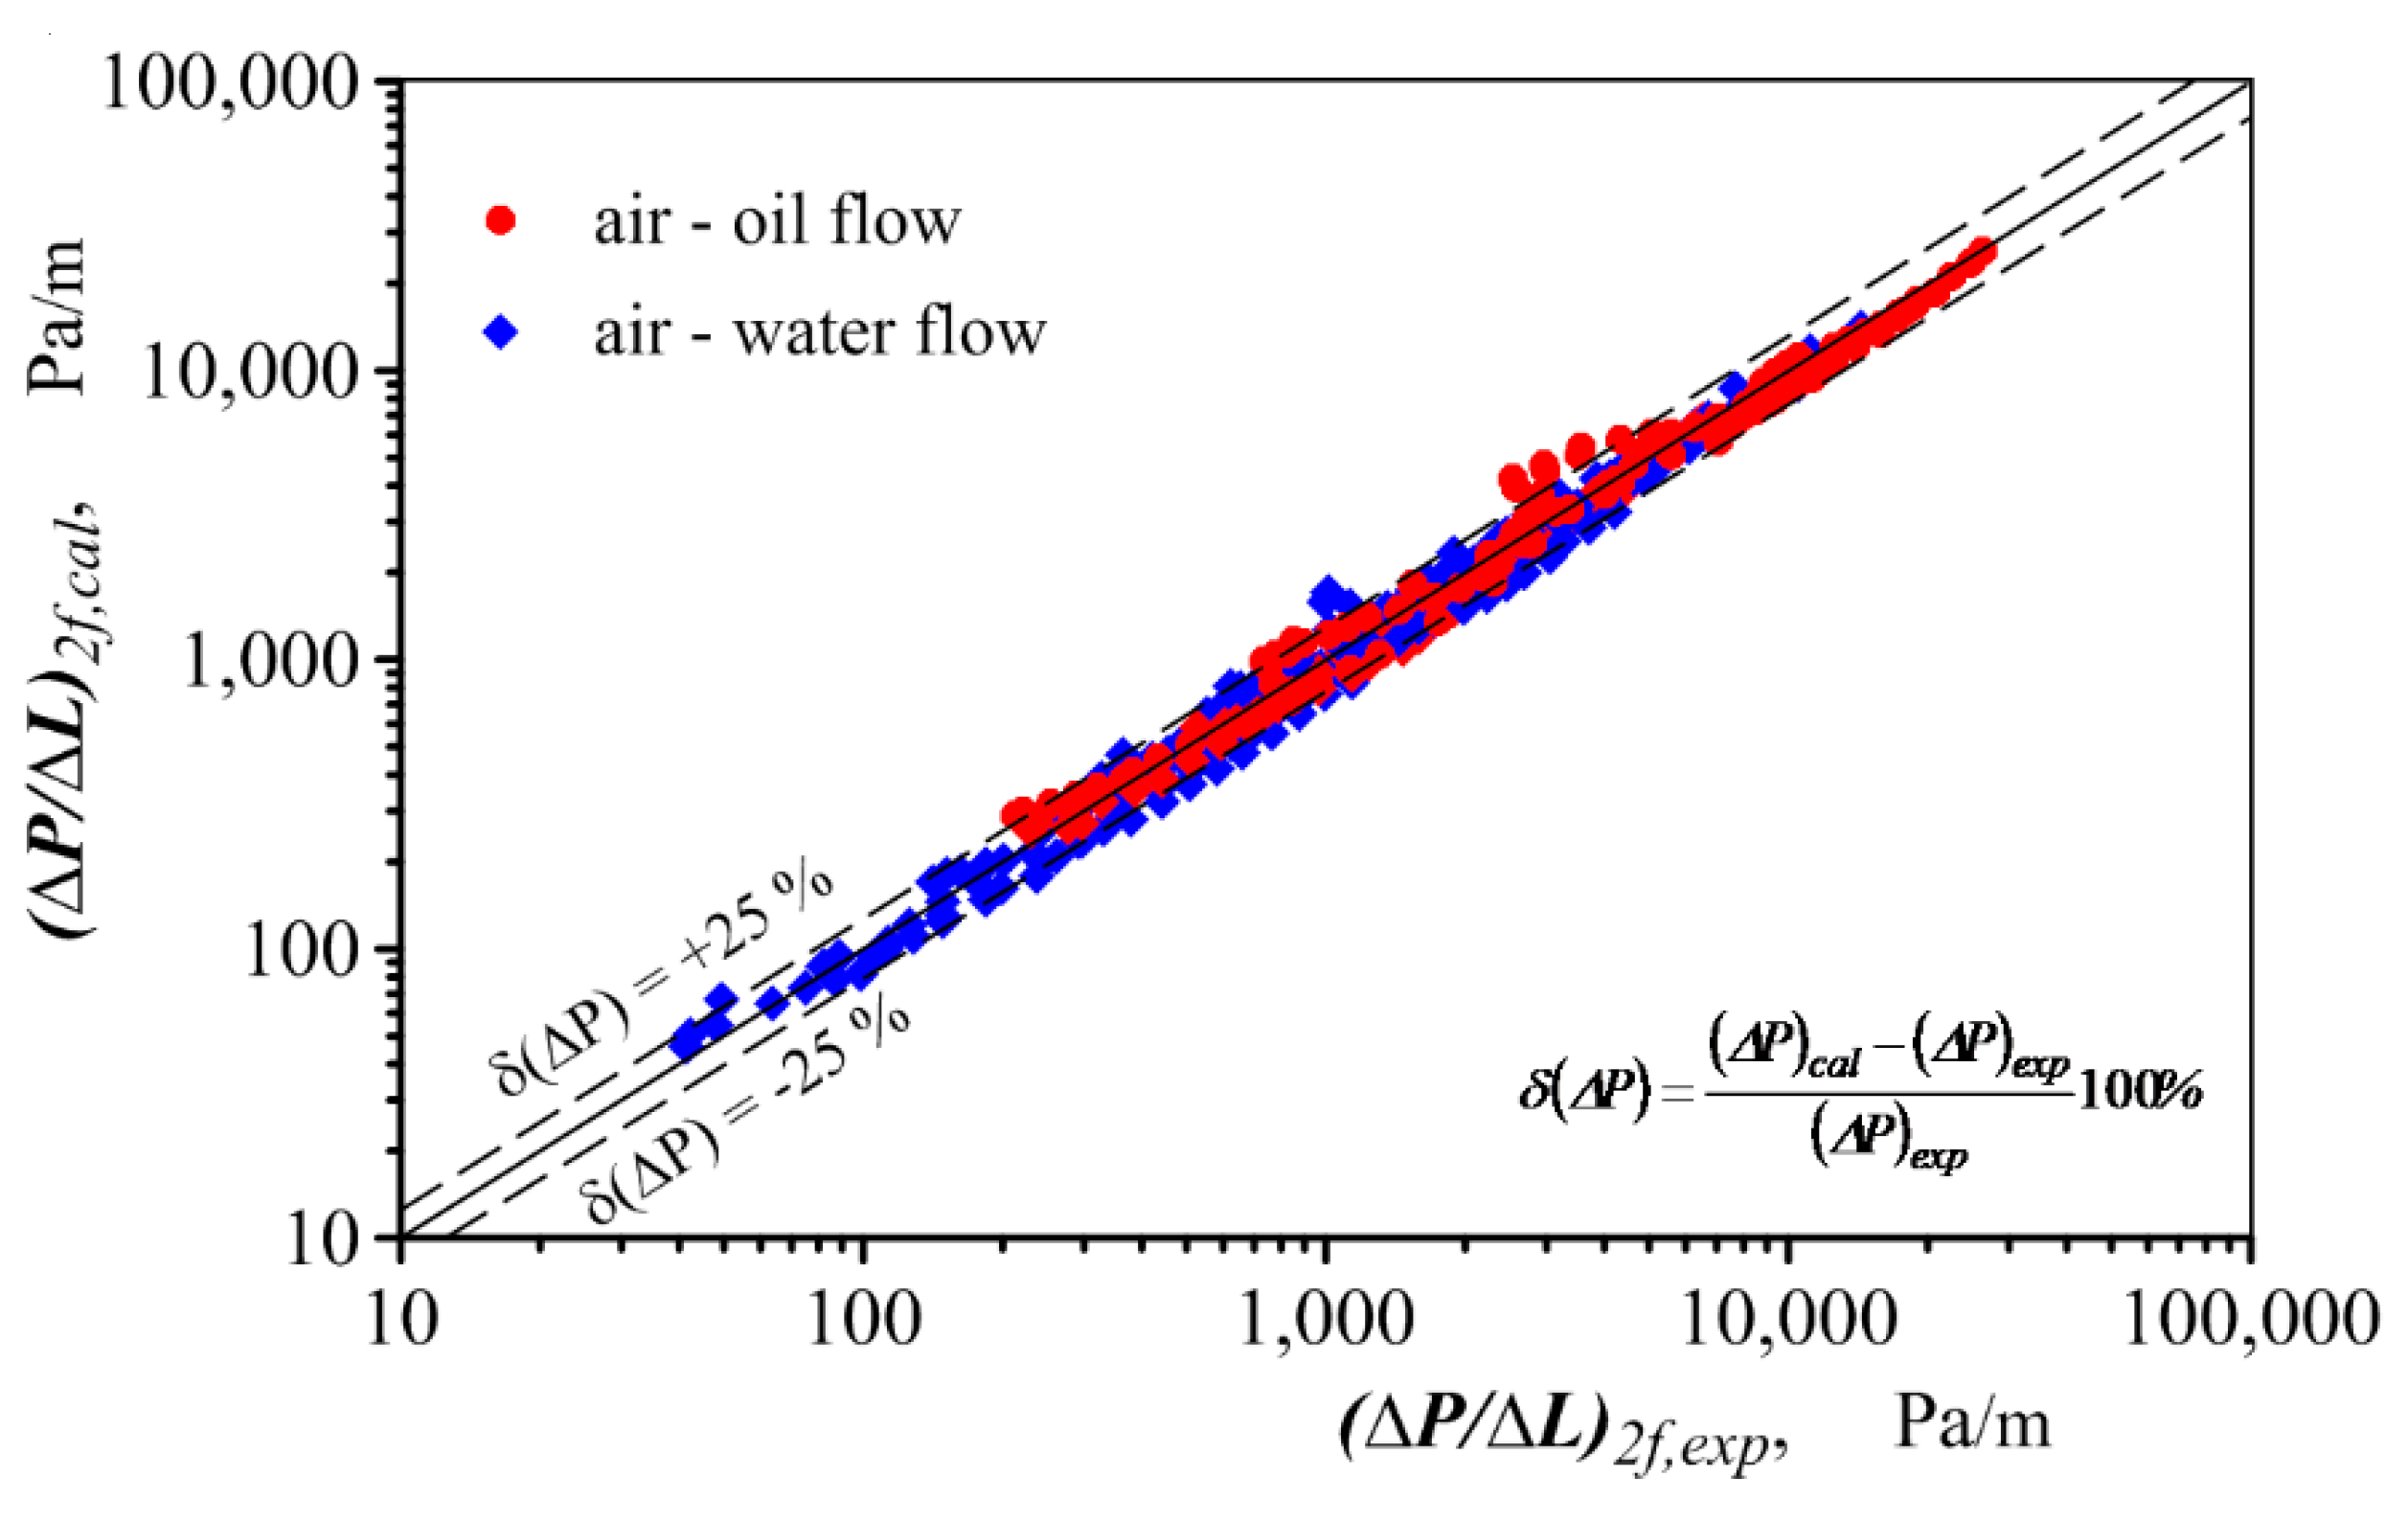
Figure 19 presents a comparison of all measured and calculated pressure drops. The statistical analysis shows that 82% of calculation results for pressure drop in two-phase flow have an error of less than ±25%.
The developed computational model ensures that pressure drop in two-phase flow coincides with the pressure drop in single-phase flow when a gas or liquid disappears in the flow. When the flux of one of the fluids approaches zero the Reynolds number approaches zero and, consequently ΦΔP approaches 1.
5. Conclusions
The experimental investigations described in this paper were carried out with three fluids and three foams of different geometrical structure. The measurements were carried out across a relatively wide range of fluid velocity changes. A total of 936 results of pressure drop measurements were obtained for various hydrodynamic conditions in one-phase and two-phase flow (570 for gas–liquid flow). The analysis of our results and information from the literature allows us to formulate the conclusions presented below.
Metal foams have a very high porosity and completely open cells, which causes laminarization of the flow to a lesser extent than other porous materials. In addition to laminar flow, we can distinguish Forchheimer transition flow, which is characterised by a low degree of turbulence, and Froud transition flow. Froud flow bears the characteristics of turbulent flow.
The hydrodynamic similarity for flows through foams with different geometrical structure can be determined by the Reynolds number (Equation (6)), in which the role of the hydraulic diameter is played by the equivalent diameter (Equation (5)) defined based on the geometrical foam parameters. In this approach, the flow is laminar when Ref < 150. In the Ref = 150–1300 range, Forchheimer transition flow occurs, and when Ref > 1300, Froud flow occurs.
Foam does not cause phase dispersion of the gas–liquid mixture. When flowing through channels filled with metal foams, homogeneous mixtures typical for flows through other porous media are not observed. In the course of our study, split flows typical of flows through hollow channels were observed.
The value of pressure drop is significantly influenced by the geometrical structure of the foam. The pressure drop increases with the decreasing cell diameter and porosity. For foams of similar cell size (2.25 mm and 2.38 mm), a decrease in porosity by less than 1.5% results in an increase in pressure drop by 28% on average. For the largest air streams, this difference reaches 50%. However, a higher pressure drop in the flow through the foam with lower porosity may also be related to differences in the skeleton shape.
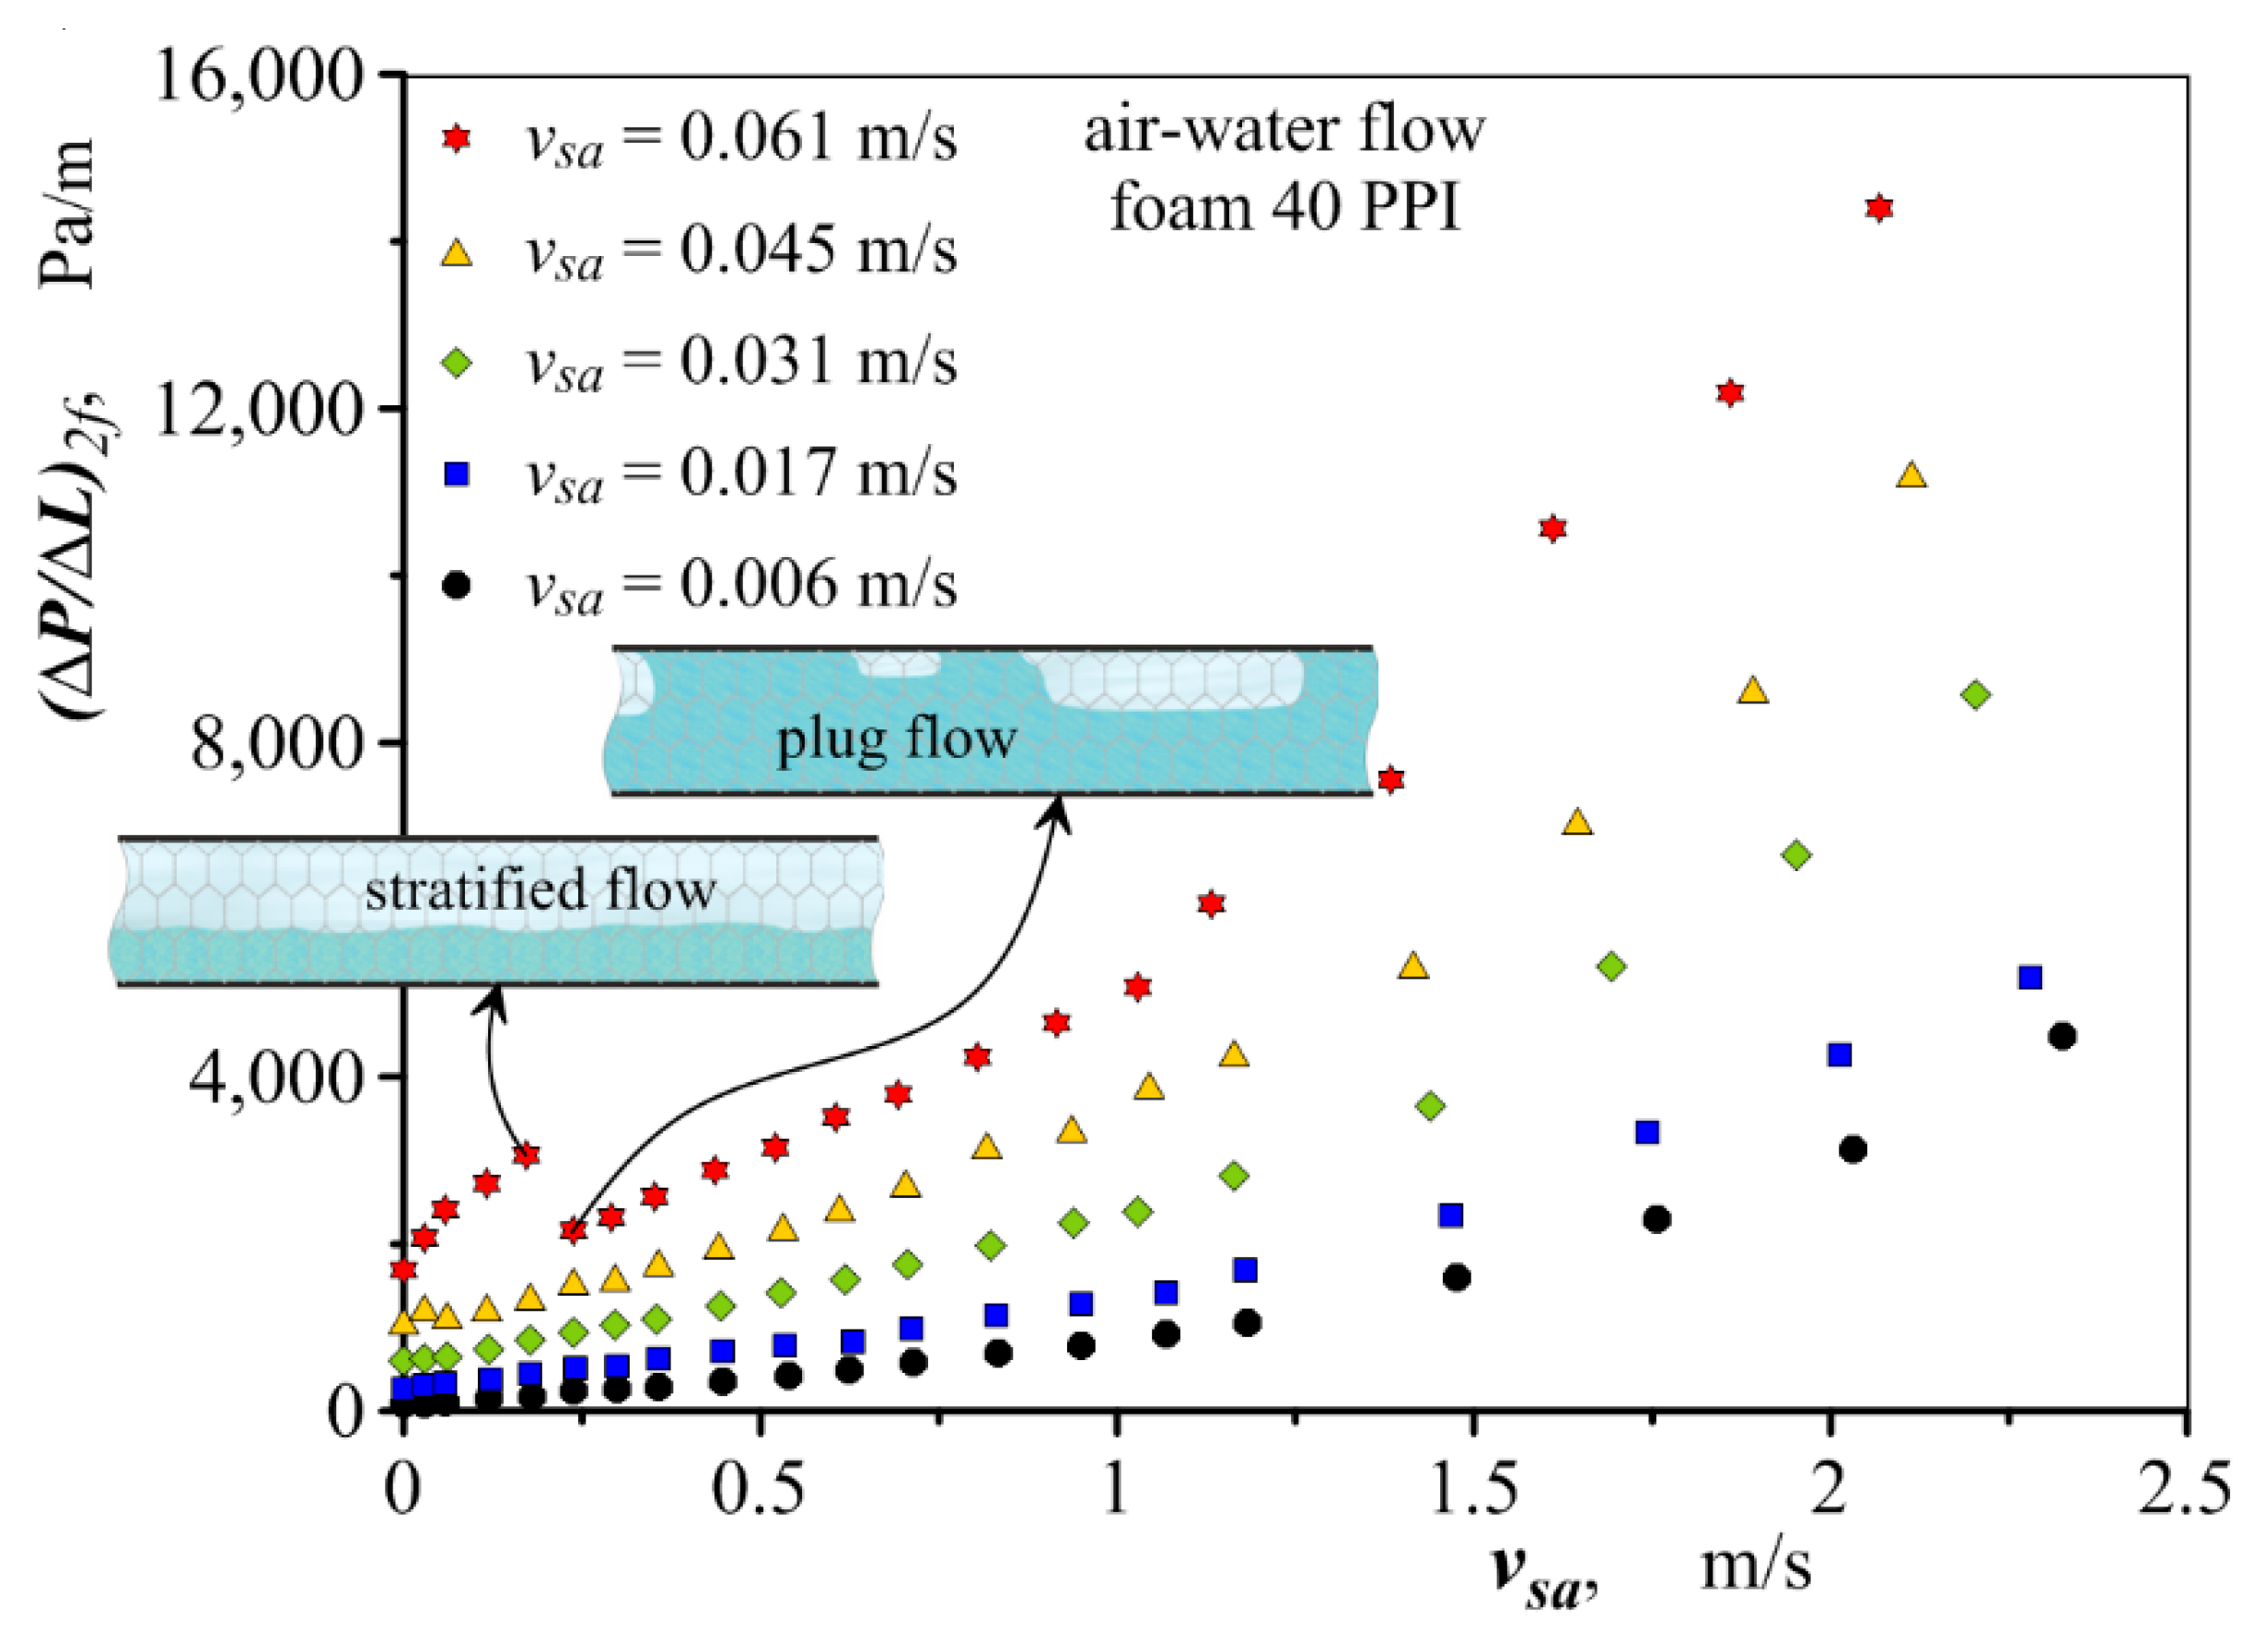
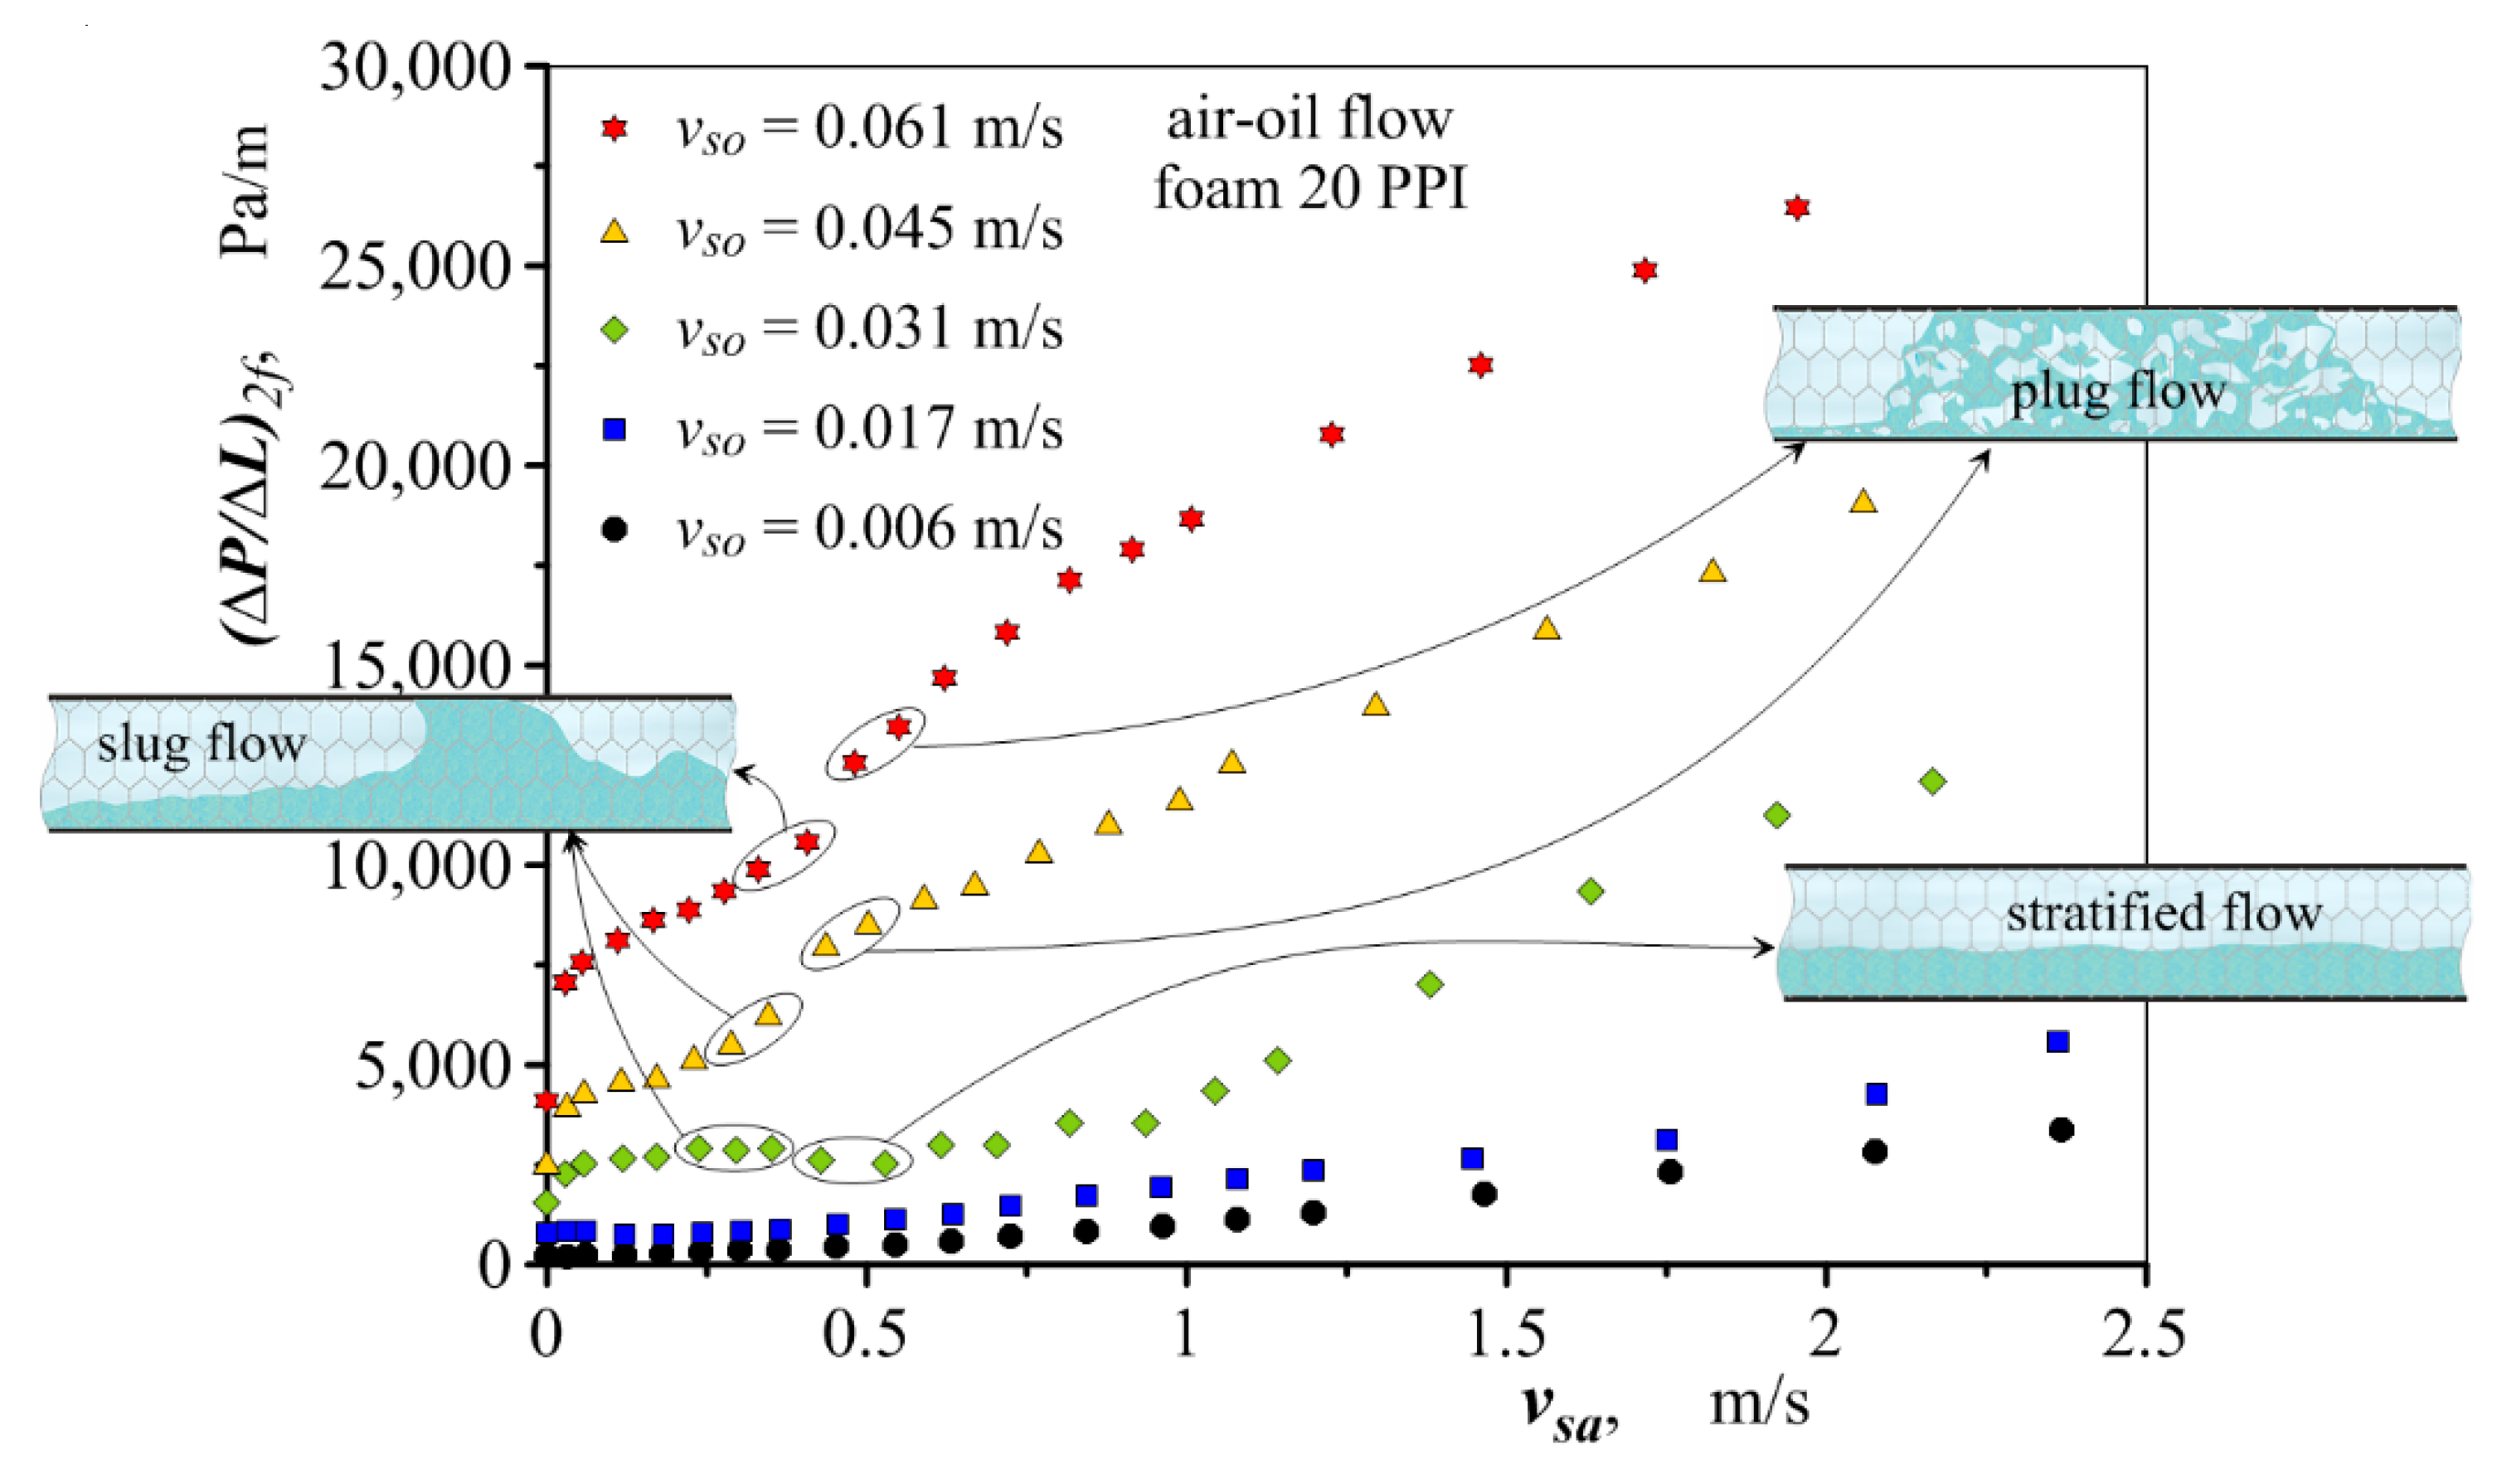
For two-phase flow, flow patterns have a significant influence on pressure drop. Changes in flow patterns can be accompanied by step changes in pressure drop. This is most evident when changing from plug flow to stratified flow. A reduction in pressure drop is observed then despite an increase in flow velocity. The stratified flow is also characterised by pressure drop lower than the slug and churn flows.
Pressure drop in single-phase fluid flow can be determined based on the Darcy-Weisbach equation (Equation (7)) and the friction factor defined for flow through foam by Equations (9)–(11).
We have shown that pressure drop in two-phase flow can be determined as the sum of pressure drop in single-phase gas and liquid flow multiplied by the drop amplification factor (Equation (12)). The amplification factor depends on many factors. It is described by Equation (13) together with Equations (14)–(16).
Equations (12)–(16) form a model of pressure drop in gas–liquid flow through a channel filled with metallic foam. The model can be applied independently of the forming flow patterns. The values of some empirical constants were determined separately for stratified flow and other flow types, which made it possible to capture rapid changes in pressure drop under changing flow patterns.
The developed pressure drop model allows us to determine this quantity with satisfactory accuracy. For single-phase flow, 95% of the results have an error of less than 15%. For gas–liquid flow, 82% of the calculation results have an error smaller than 25%. The model can be applied to flow through horizontal channels filled with metal foams with a structure similar to that of the foams used in this study. The hydrodynamic conditions for the application of the proposed calculation methods shall be as given in
Table 3. The possibility of calculating pressure drops over a wider range of changes in hydrodynamic conditions need to be verified.


