Article

Virtual Digital Substation Test System and Interoperability Assessments

1
Engineering & Asset Management, National Grid Electricity Transmission, Warwick CV34 6DA, UK
2
Department of Electrical & Electronic Engineering, University of Manchester, Manchester M13 9PL, UK
*
Author to whom correspondence should be addressed.
Energies 2021, 14(8), 2337; https://doi.org/10.3390/en14082337
Submission received: 2 March 2021 / Revised: 14 April 2021 / Accepted: 15 April 2021 / Published: 20 April 2021

Abstract

:
Interoperability testing and analysis tools provide a means for achieving and assuring the integrity of multivendor intelligent electronic devices (IEDs) data exchanges. However, the testing and analysis are very time consuming and error prone, and these problems worsen when a substation becomes large and complex during the engineering process, commission, replacement, maintenance, and extension. To address this challenge, this paper presents a virtual digital substation test system (VDSTS) with interoperability analysis tools for assessing and identifying the engineering challenges for the multiple-vendors digital substation. This VDSTS consists of three parts: (i) A virtual digital substation modelling for generating real-time digital substation primary plant operation and fault conditions, (ii) a standard IEC 61850-based substation protection, automation, and control (PAC) system architecture with multivendor IEDs and bay solutions, and (iii) multivendor Substation Configuration description Language (SCL) tools and in-house built data visualisation tool. The study focuses on the interoperability testing of sampled values (SV), generic object-oriented substation events (GOOSE), and manufacturing message specification (MMS) communication services, as defined in IEC 61850. The main issues identified are compatibility issues of SCL tools, protocol implementation issues, different information models, and application limitations. The outcomes will help utilities to reduce the risks associated with the general rollout of digital substations.

1. Introduction

The IEC 61850 standards have been widely applied to substation protection, automation, and control (PAC) systems for real-time applications nowadays [1,2,3,4,5]. The application of digital station and process buses can bring benefits, such as reduced copper cables, fewer construction costs, less commissioning time, maintenance of PAC devices, i.e., intelligent electronic devices (IEDs) in a safer and quicker way, and with increased flexibility for substation extension [1,6]. Additionally, interoperability is a key driver for the adoption of the standards. Achieving full interoperability in multivendor substation PAC systems will allow utilities to confidently deploy new technologies and efficiently manage maintenance, upgrade, and replacement activities.
Due to the flexibility of IEC 61850, the implementation of the standards by various vendors may be different. Many studies [7,8,9,10,11,12,13] have been carried out to test digital solutions and the interoperability of the communication services defined in IEC 61850, i.e., sampled values (SV), generic object-oriented substation events (GOOSE), and manufacturing message specification (MMS). The test results have revealed some interoperability problems, such as compatibility issues of IEC 61850-6 System Configuration description Language (SCL) tools [9,10], difficulties in configuring third-party GOOSE subscriptions [11,12], unsuccessful data reading on human machine interfaces (HMIs) [10,13]. From the point view of performance, the studies in [6,14] tested SV/GOOSE delays under various background traffics, [15] assessed timestamping and processing delays of merging units (MUs) from different manufacturers, [16] studied the response of intelligent electronic devices (IEDs) to SV packet losses, and [17,18] investigated the impact of network redundancy protocols, SV delay, and synchronisation loss on protection functions.
Most interoperability studies from the literature have concentrated on investigating individual device performance. The tests were based on dedicated lab designs (e.g., ad hoc approach) with an interest in sensitivity analysis of IED performance. However, the communication architecture (or network topology) has usually been simplified to one or a few bays with limited types of functional tests [6,18], or to a station bus network or a process bus network only [11,14,17]. Consequently, more distributed applications, such as inter-bay trips, circuit breaker (CB) failure protection, CB synchronisation, interlocking, and station-wide MMS control, have not been fully studied to understand associated interoperability issues. Additionally, the system integration process should be further discussed considering a complex substation where the system integrator needs to handle SCL files from multiple suppliers.
To address these challenges, this paper presents a comprehensive PAC system test platform that consists of key elements for implementing IEC 61850, i.e., substation communication system architecture, SCL integration, data flow visualisation, and interoperability validation. The test system is based on a generic substation PAC system architecture developed from the previous research [19], which considers the requirements for installation, maintenance, replacement, and life-cycle cost of PAC equipment [20].
The test facility consists of a double-busbar substation simulated by a real-time digital simulator (RTDS), and a complete real PAC system that includes multiple bay solutions from different vendors. A data visualisation tool is developed to analyse the interoperability performance by graphically monitoring and plotting SV/GOOSE data links between IEDs. This paper demonstrates the benefits of the proposed architecture and test system through a number of typical test cases with SV, GOOSE, and MMS communications. The interoperability findings are highlighted. The findings can support utilities to develop technical specifications on IEC 61850 configuration, integration, and performance requirements, which will facilitate future deployment.

2. Substation Protection, Automation, and Control System Architecture Design

A key enabler to drive value for secondary equipment, such as AMUs, DMUs, and IEDs, is a standard architecture, designed to deliver standard digital and physical interfaces, which enable the reuse of proven designs to reduce outage time and cost associated with commissioning, maintenance, testing and replacement of PAC solutions, and also enable vendor interoperability. To achieve this objective, the substation PAC system architecture should consider a number of design rules [19,21], such as the following:
  • No single activity on the Main 1 protection system (MP1) shall affect the Main 2 protection system (MP2);
  • No single failure shall result in the loss of control of more than one bay;
  • Fault clearance time shall at least achieve the level of performance of conventional bays.
Figure 1 illustrates a high-level view of the proposed substation PAC system architecture based on the design principles mentioned above. The architecture consists of the following key components.

2.1. Parallel Process Buses

Each individual bay has two physically isolated process buses (PBs) for redundancy purposes. PB1 and PB2 are used to exchange local SV/GOOSE messages for MP1 and MP2 systems, respectively. Optional filter switches may be used if two or more adjacent bays need to share information at the process level, e.g., for mesh corner substations. The bays within a mesh corner (e.g., transformer bay, feeder bay, and mesh corner bay) need to exchange GOOSE messages in order to trip two CBs associated with that corner [6]. However, for double-busbar applications (as shown in Figure 1b), each bay has separated PBs as the protection scheme for each bay operates independently. No connections between bay PBs via filter switches need to be set up in this case.

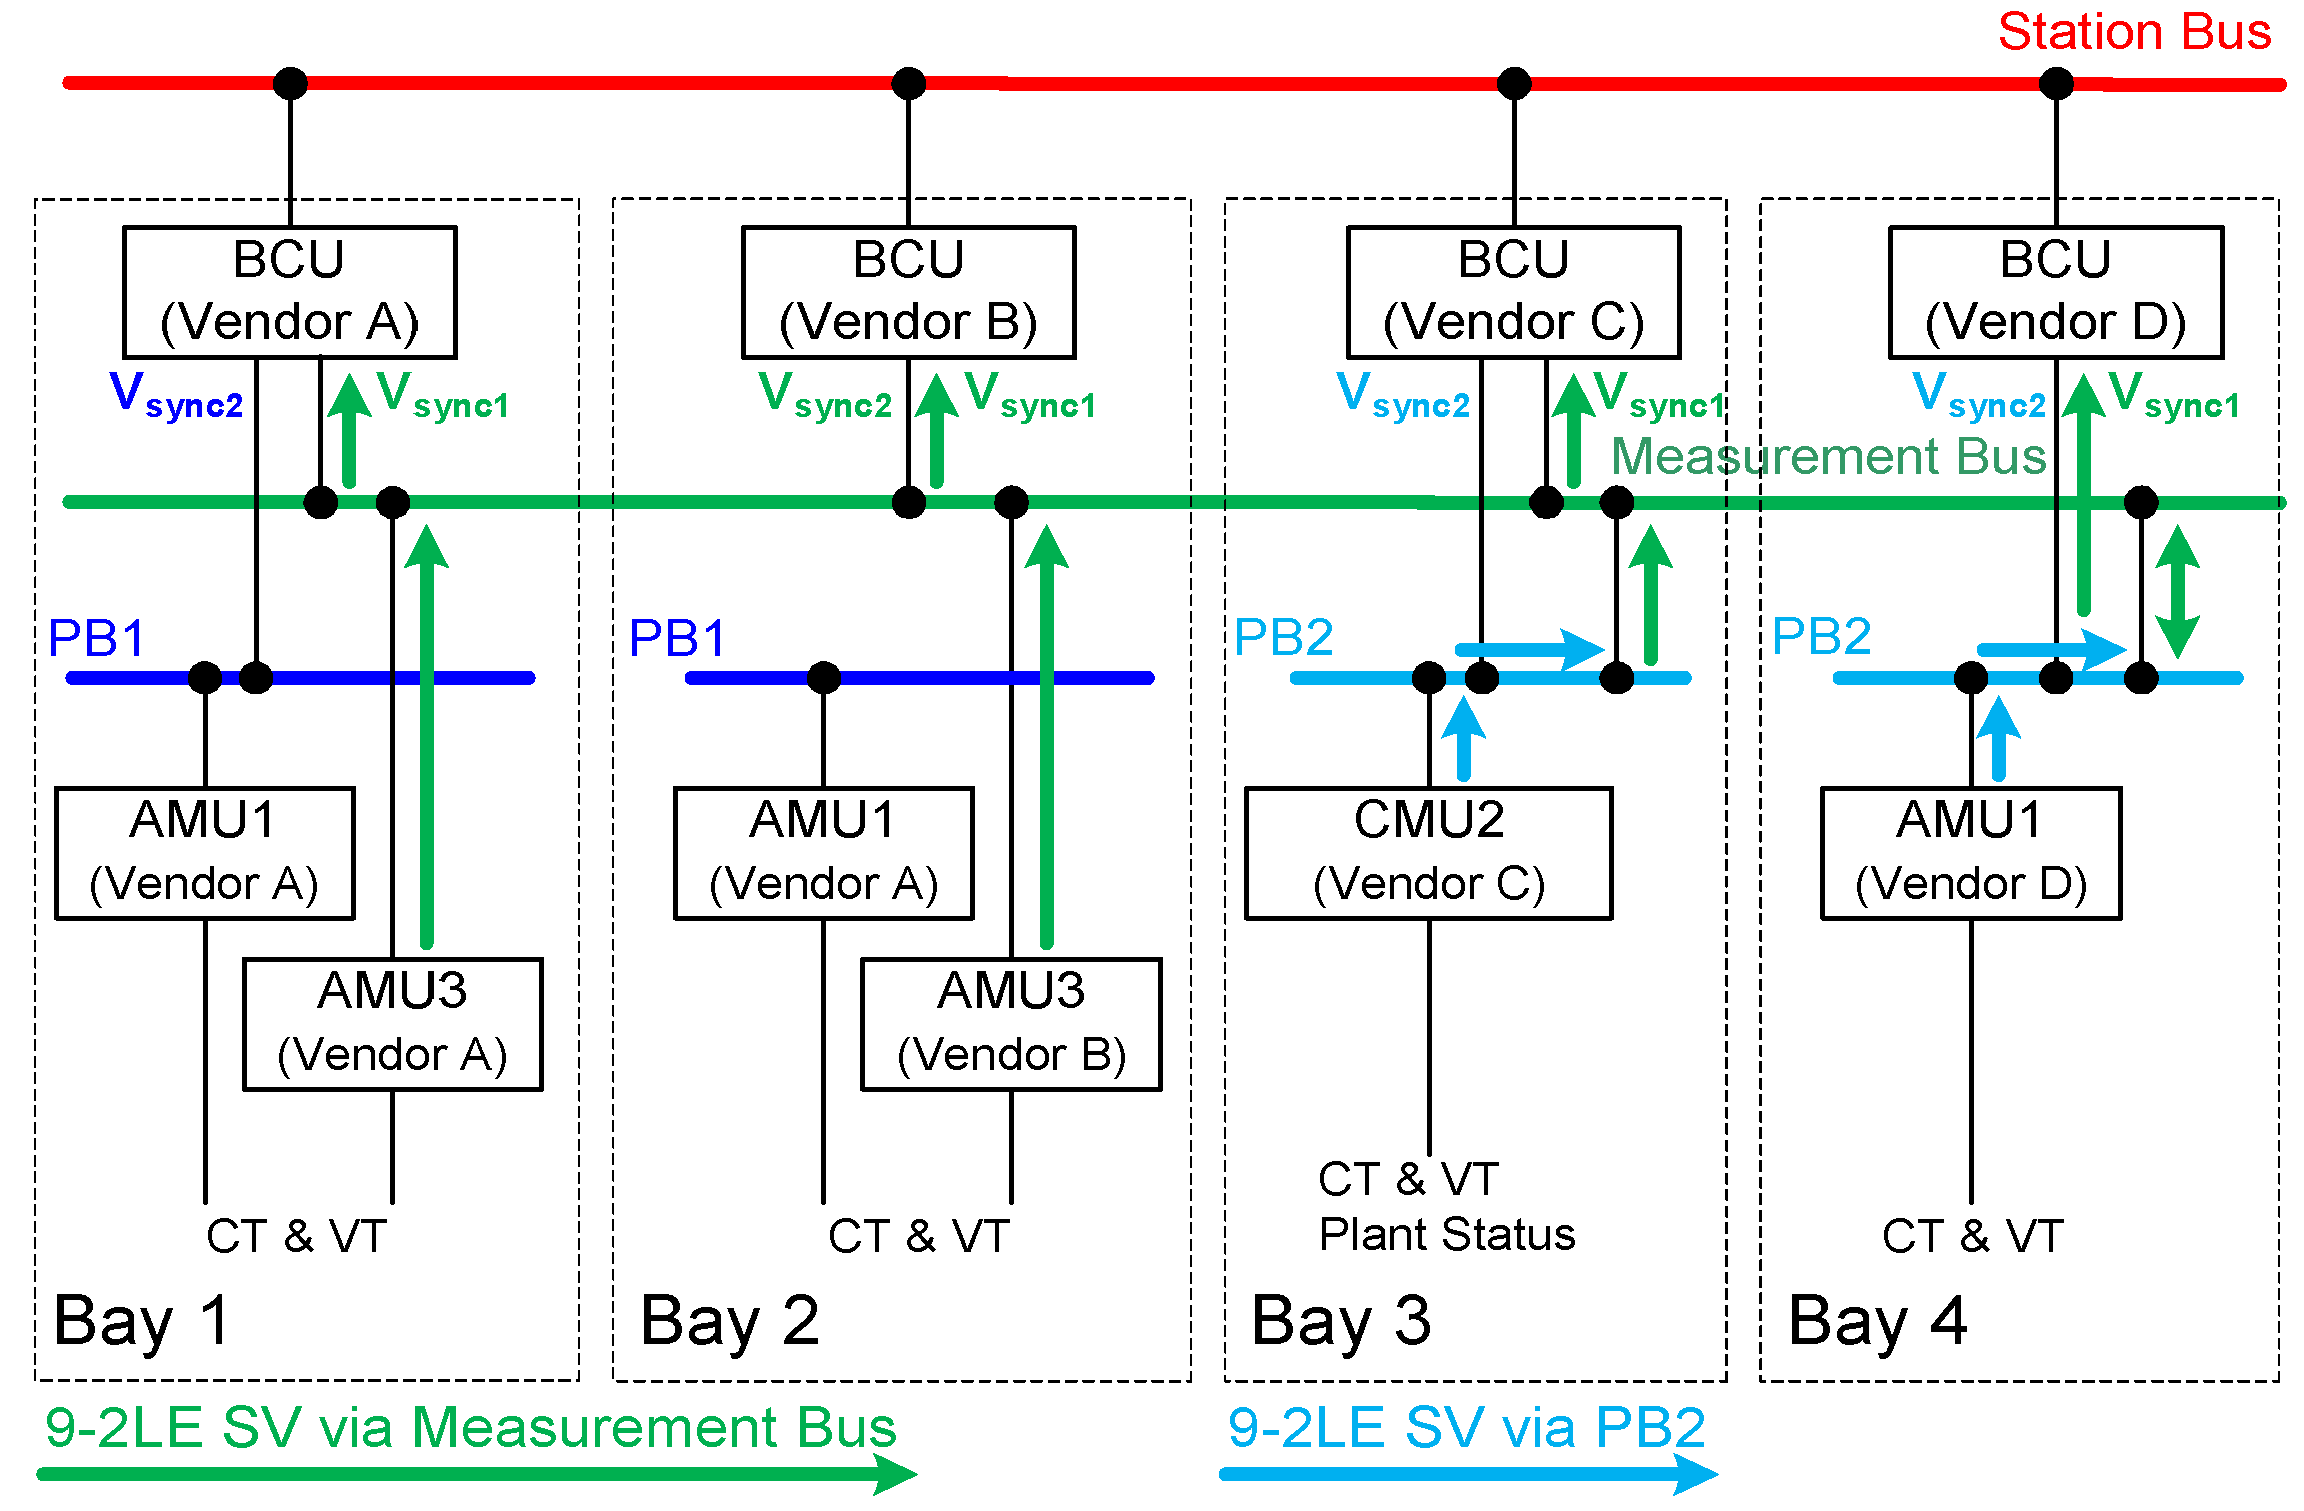
2.2. Measurement Bus for High-Accuracy Metering and Synchronising

The measurement bus provides a high-bandwidth process bus across bays, i.e., inter-bay process bus. Each bay which requires high-accuracy metering (HAM, e.g., SV with 256 samples per cycle) should install a separate MU connected to the measurement bus. Additionally, normal SV streams (i.e., 80 samples per cycle) can be transmitted between bays via the measurement bus. This is important for CB synchronising function in substations without busbar voltage transformers (VTs). In the UK substations, the busbar running voltage is determined from the VTs of its connected bays. The devices with synchronising function, e.g., bay control units (BCUs), can use the measurement bus to access SV streams from their adjacent bays to determine the running voltage (see more details in Section 5.2).

2.3. Standard Bay Solutions

Different suppliers can provide bay solutions (e.g., MUs and IEDs) in a substation. Each supplier configures its own bay solution. This approach reduces the interoperability issues within a bay and facilitates the transition of substations from conventional through partially digital to fully digital.

2.4. Station Bus Network for Substation Automation and Control

The station bus is mainly an IEC 61850-8-1 MMS network for the local HMI and remote-control centre to control bay solutions. Additionally, the station bus can transmit inter-bay GOOSE signals (e.g., station-wide automation schemes and breaker failure trips) if needed. The station bus and measurement buses are required to be physically separated from process buses [22] for transmission substations considering higher performance and security requirements for process buses. The reliability of the station bus (or measurement bus) can be improved via using the High-availability Seamless Redundancy (HSR) protocol or Parallel Redundancy Protocol (PRP).
All the characteristics discussed above aim to ensure that substation operation can have the least possible overall interruption during maintenance and replacement.

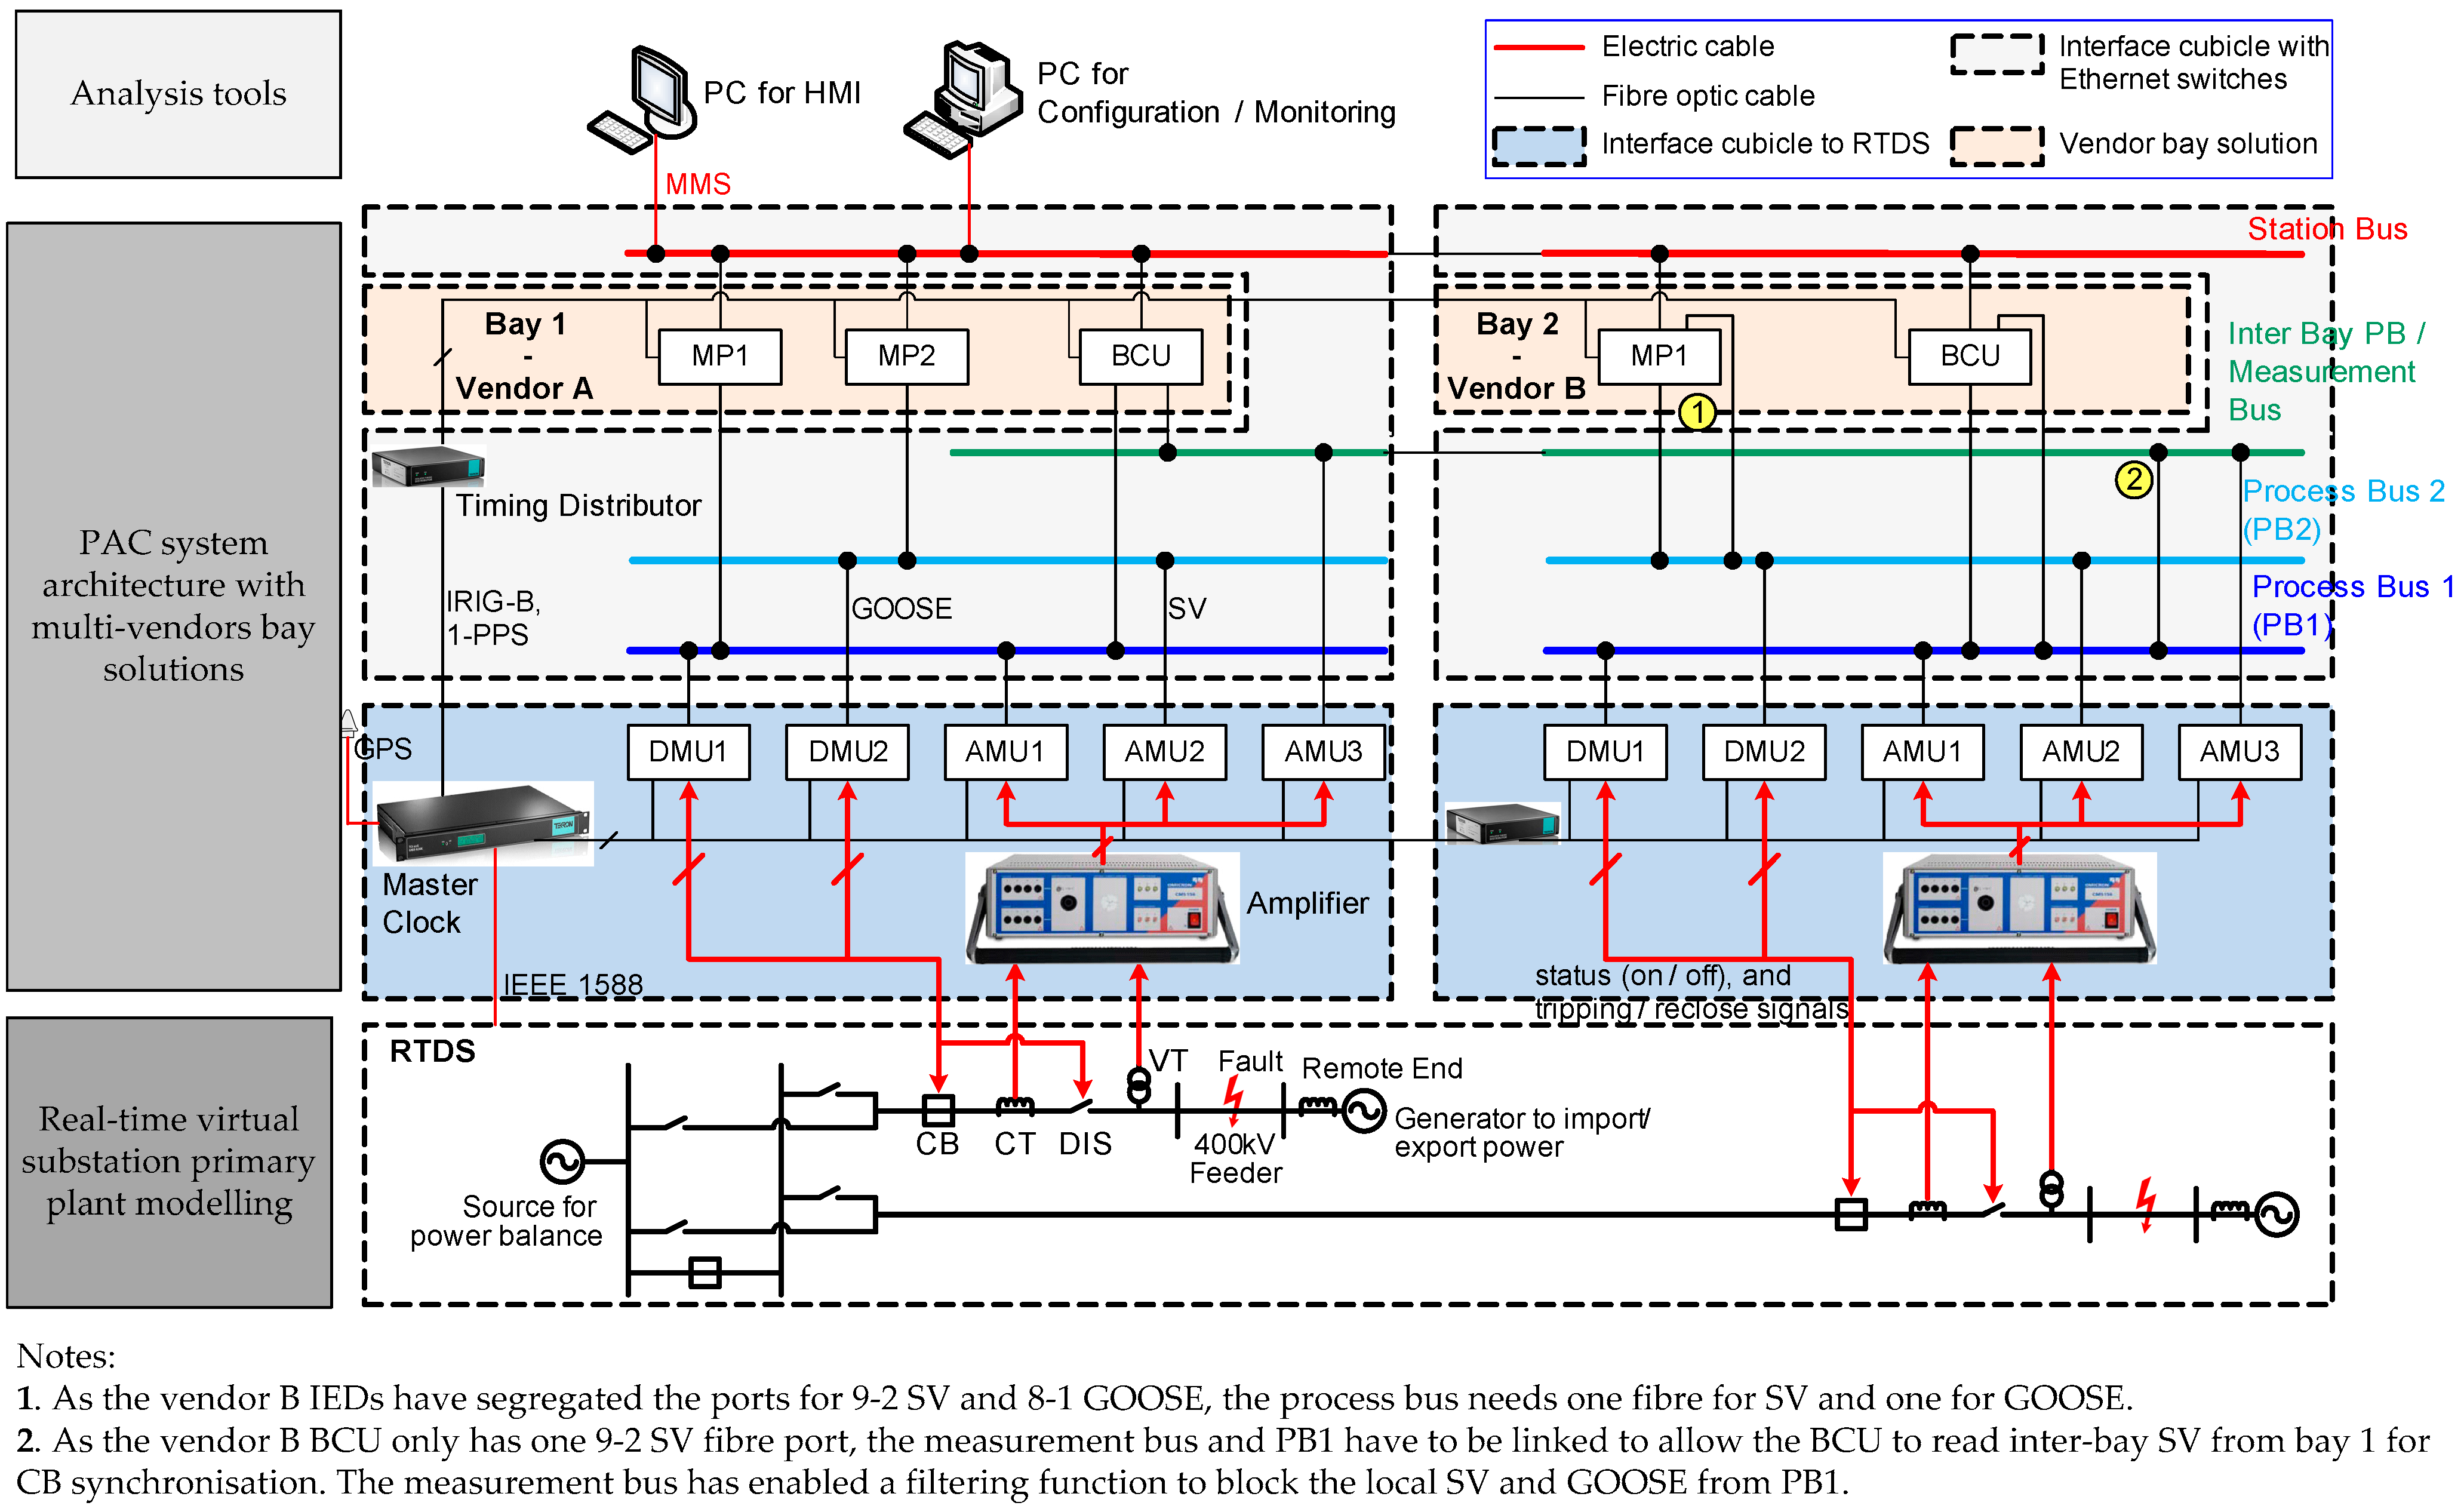
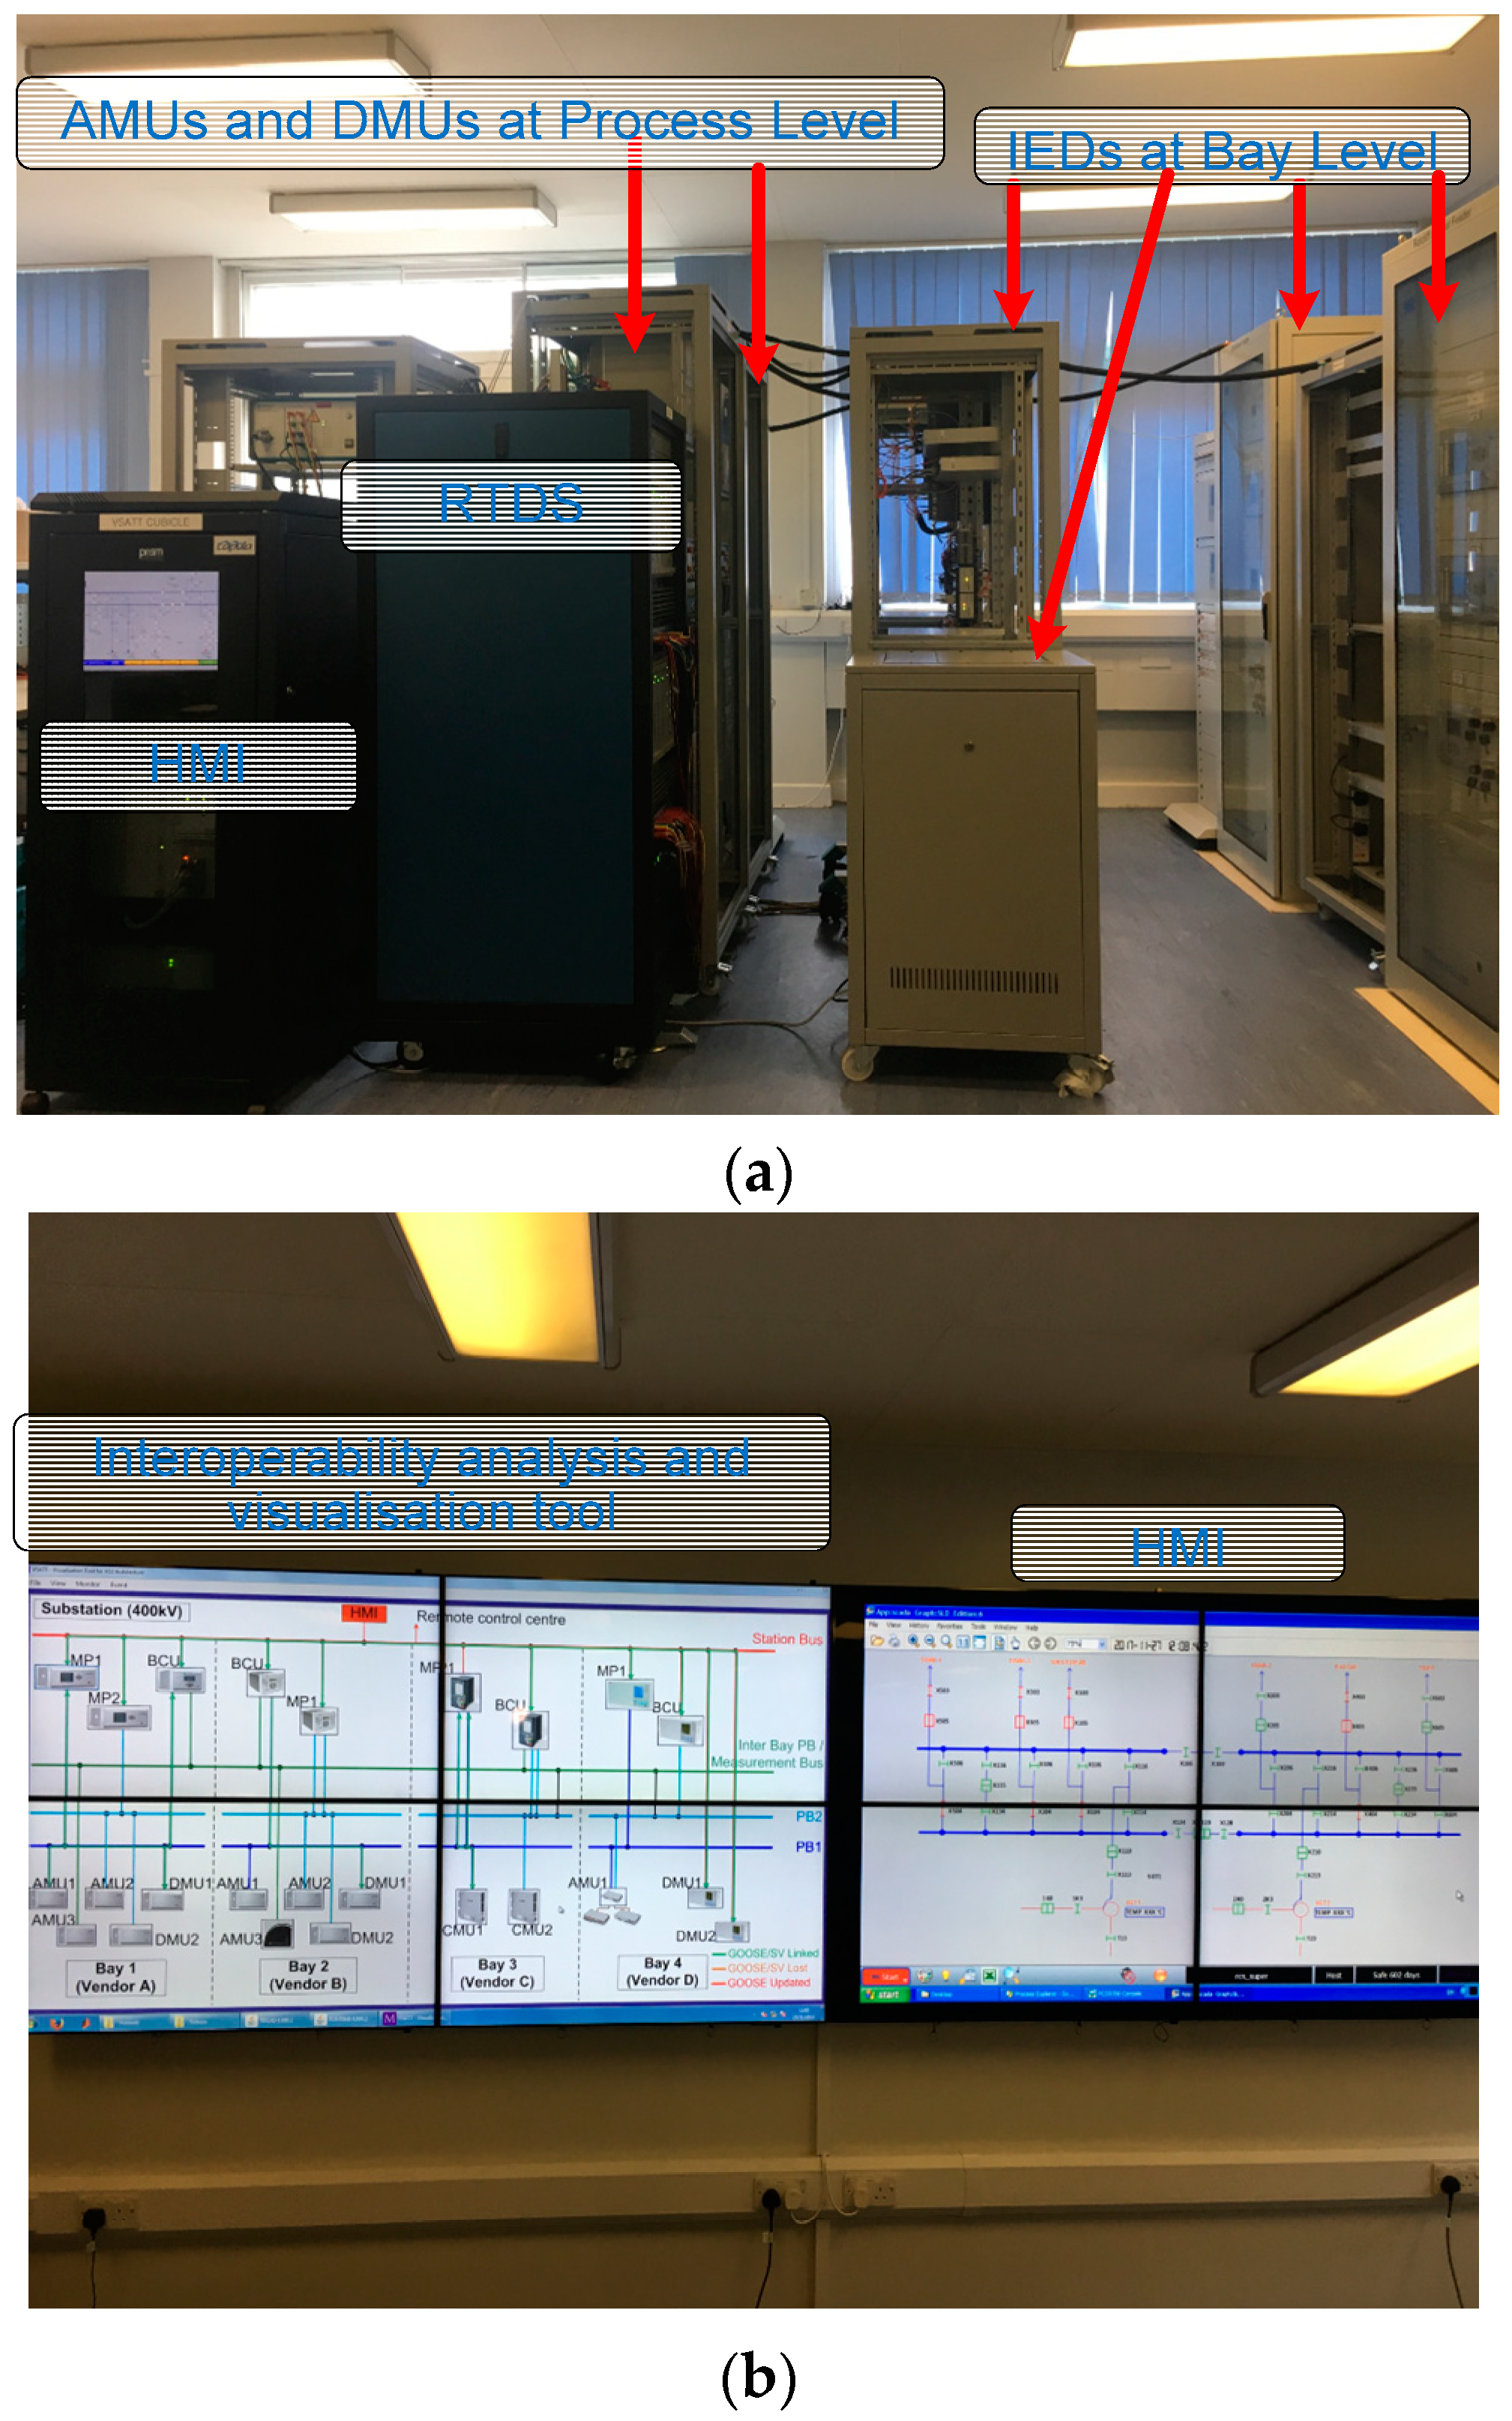
3. RTDS-Based Virtual Digital Substation Test System

Having completed a number of successful piggyback trials of the standard PAC system architecture with individual suppliers, vendor interoperability, in particular at the station bus level, was the key driver behind the development of the virtual digital substation test system (VDSTS) as a real-time, hardware, closed-loop test platform. The test platform uses a real-time digital simulator (RTDS) to simulate the substation primary plant [21,23]. The objective is to provide a lab-based facility implementing the designed PAC architecture with multiple vendor bays solutions. Figure 2 illustrates the lab-based test system, which consists of the following three parts.

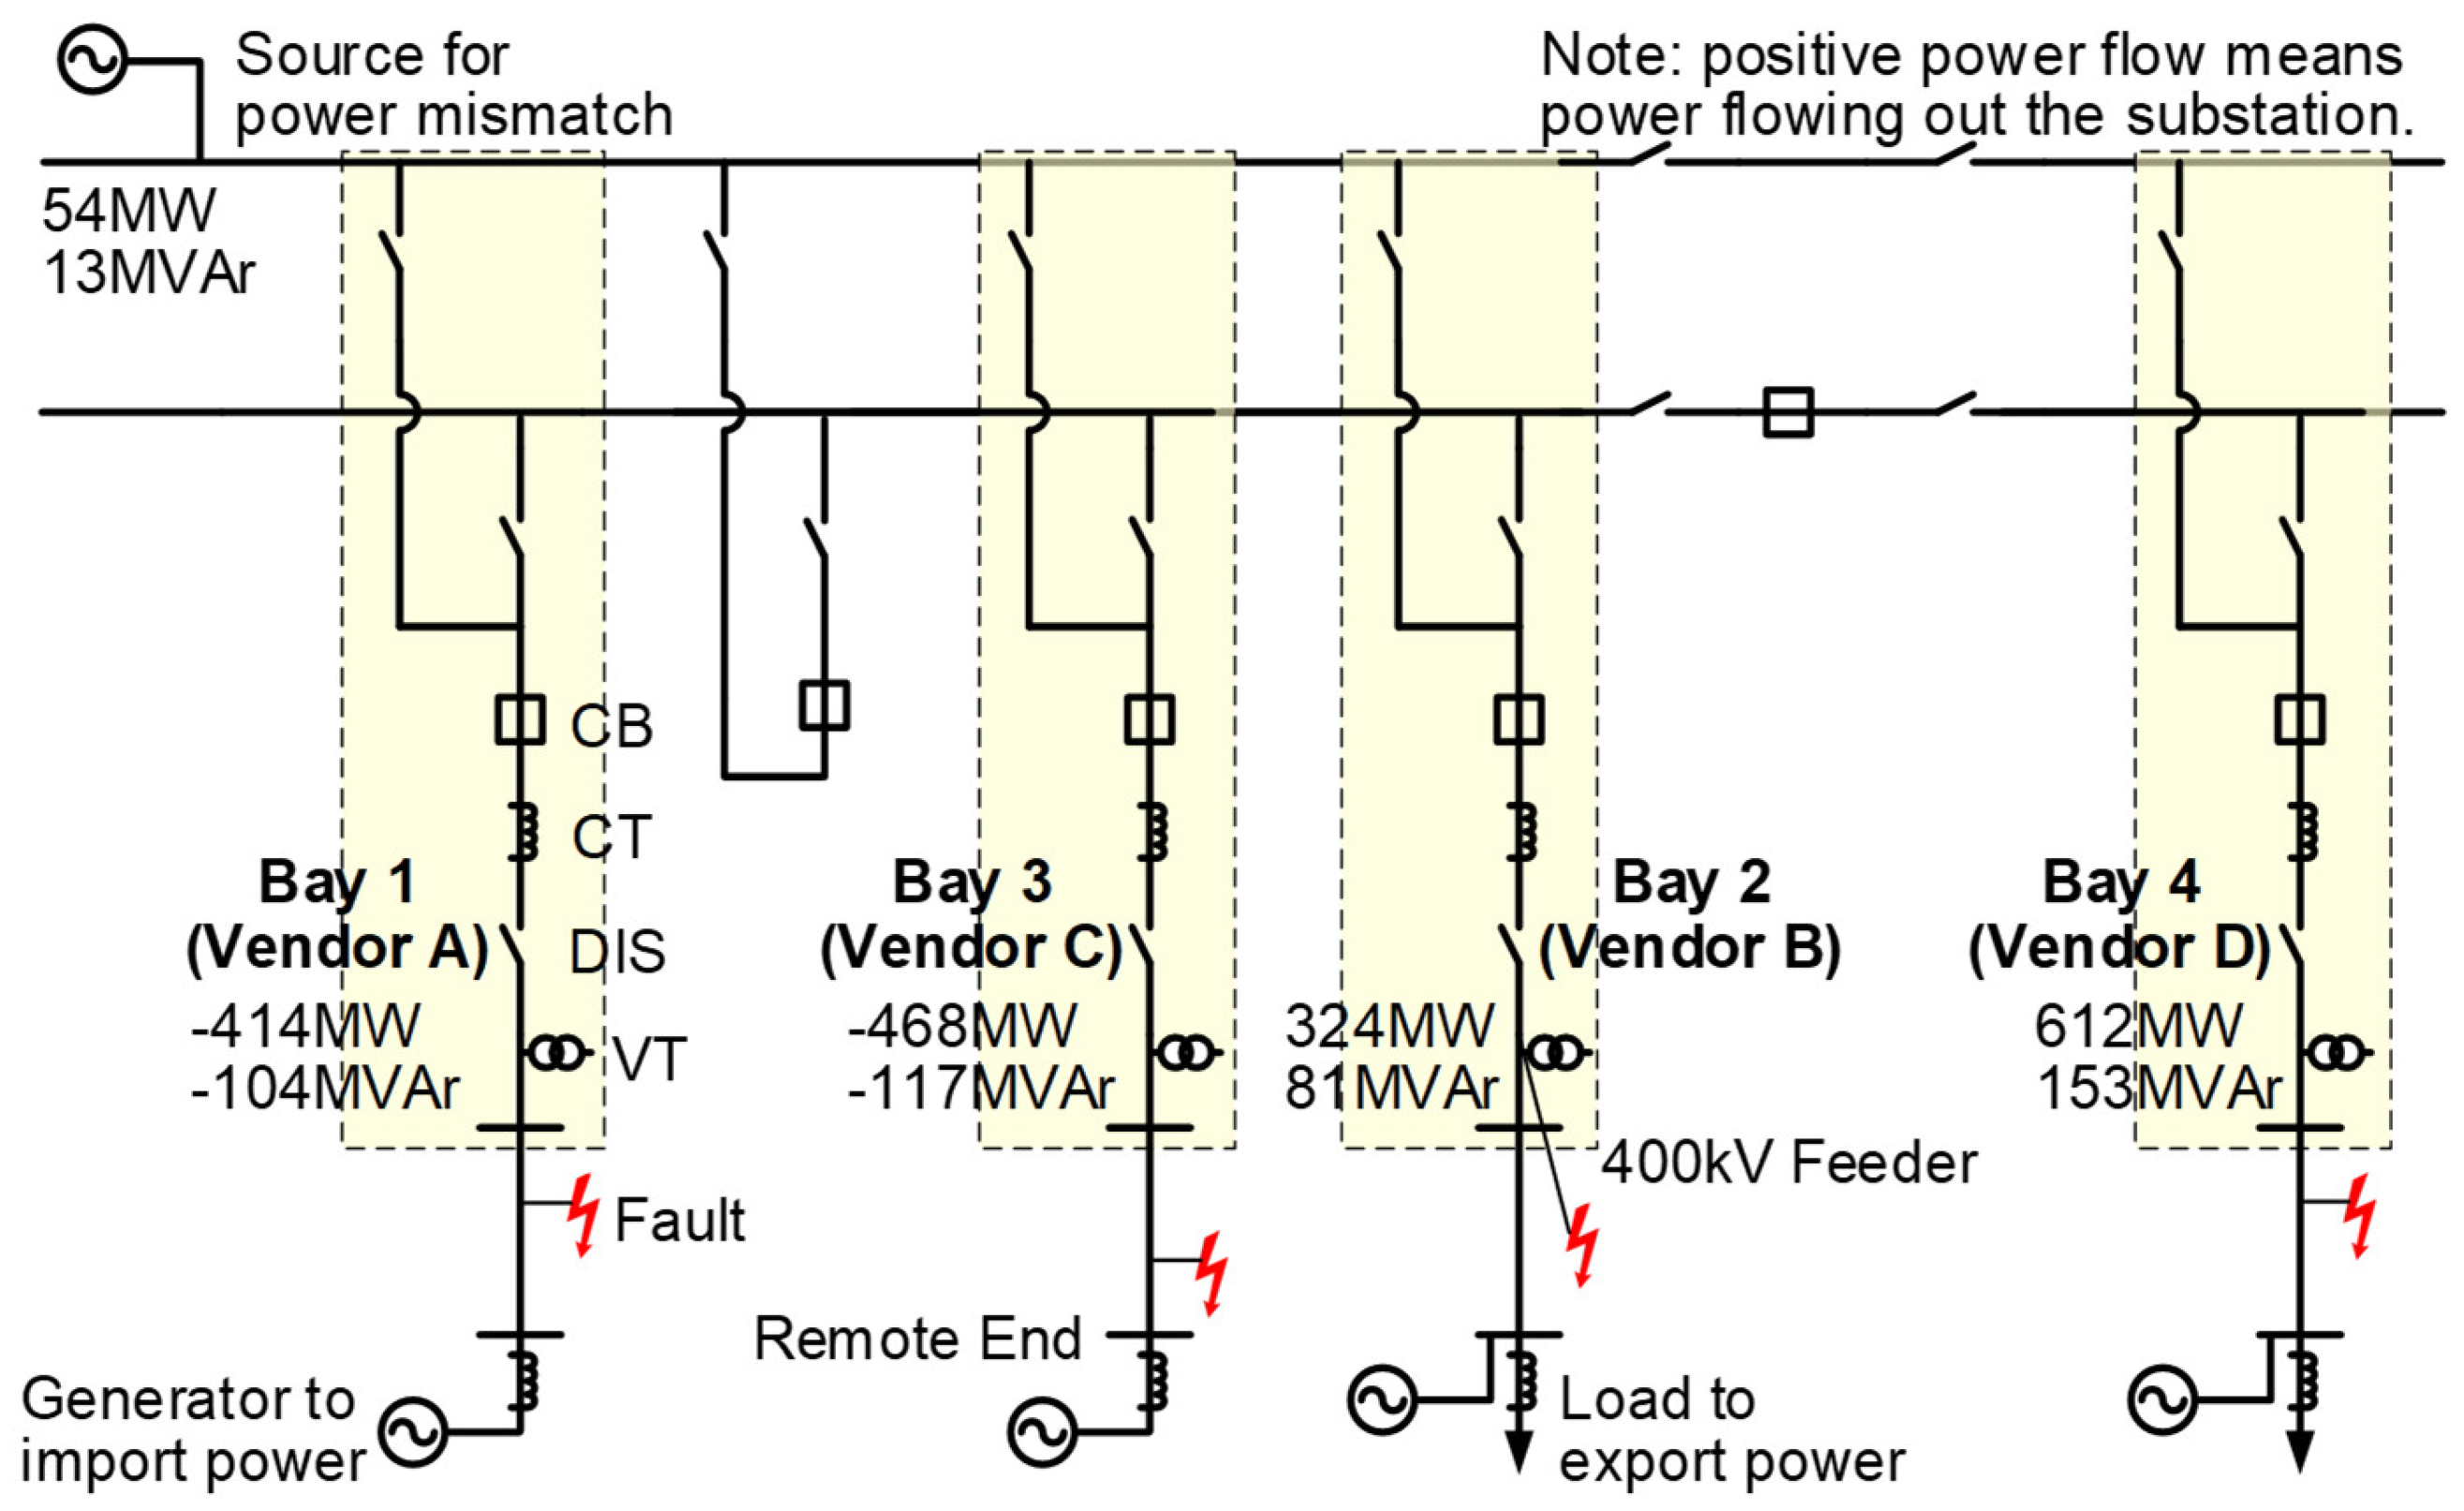
3.1. Real-Time Virtual Substation Modelling for Power Plant Using an RTDS

A typical UK 400 kV double-busbar transmission substation has been modelled in an RTDS simulator with PB5 processors. Figure 3 shows the primary plant model which currently only simulates four feeder bays due to the limitation of the RTDS installed in the lab.
The RTDS produces CT and VT signals for analogue merging units (AMUs) via amplifiers, and CB and disconnector (DIS) positions, for digital merging units (DMUs) via binary outputs. With a fault simulated by RTDS, the external IEDs will generate GOOSE trip signals to the DMUs, which will produce binary signals back to the RTDS.

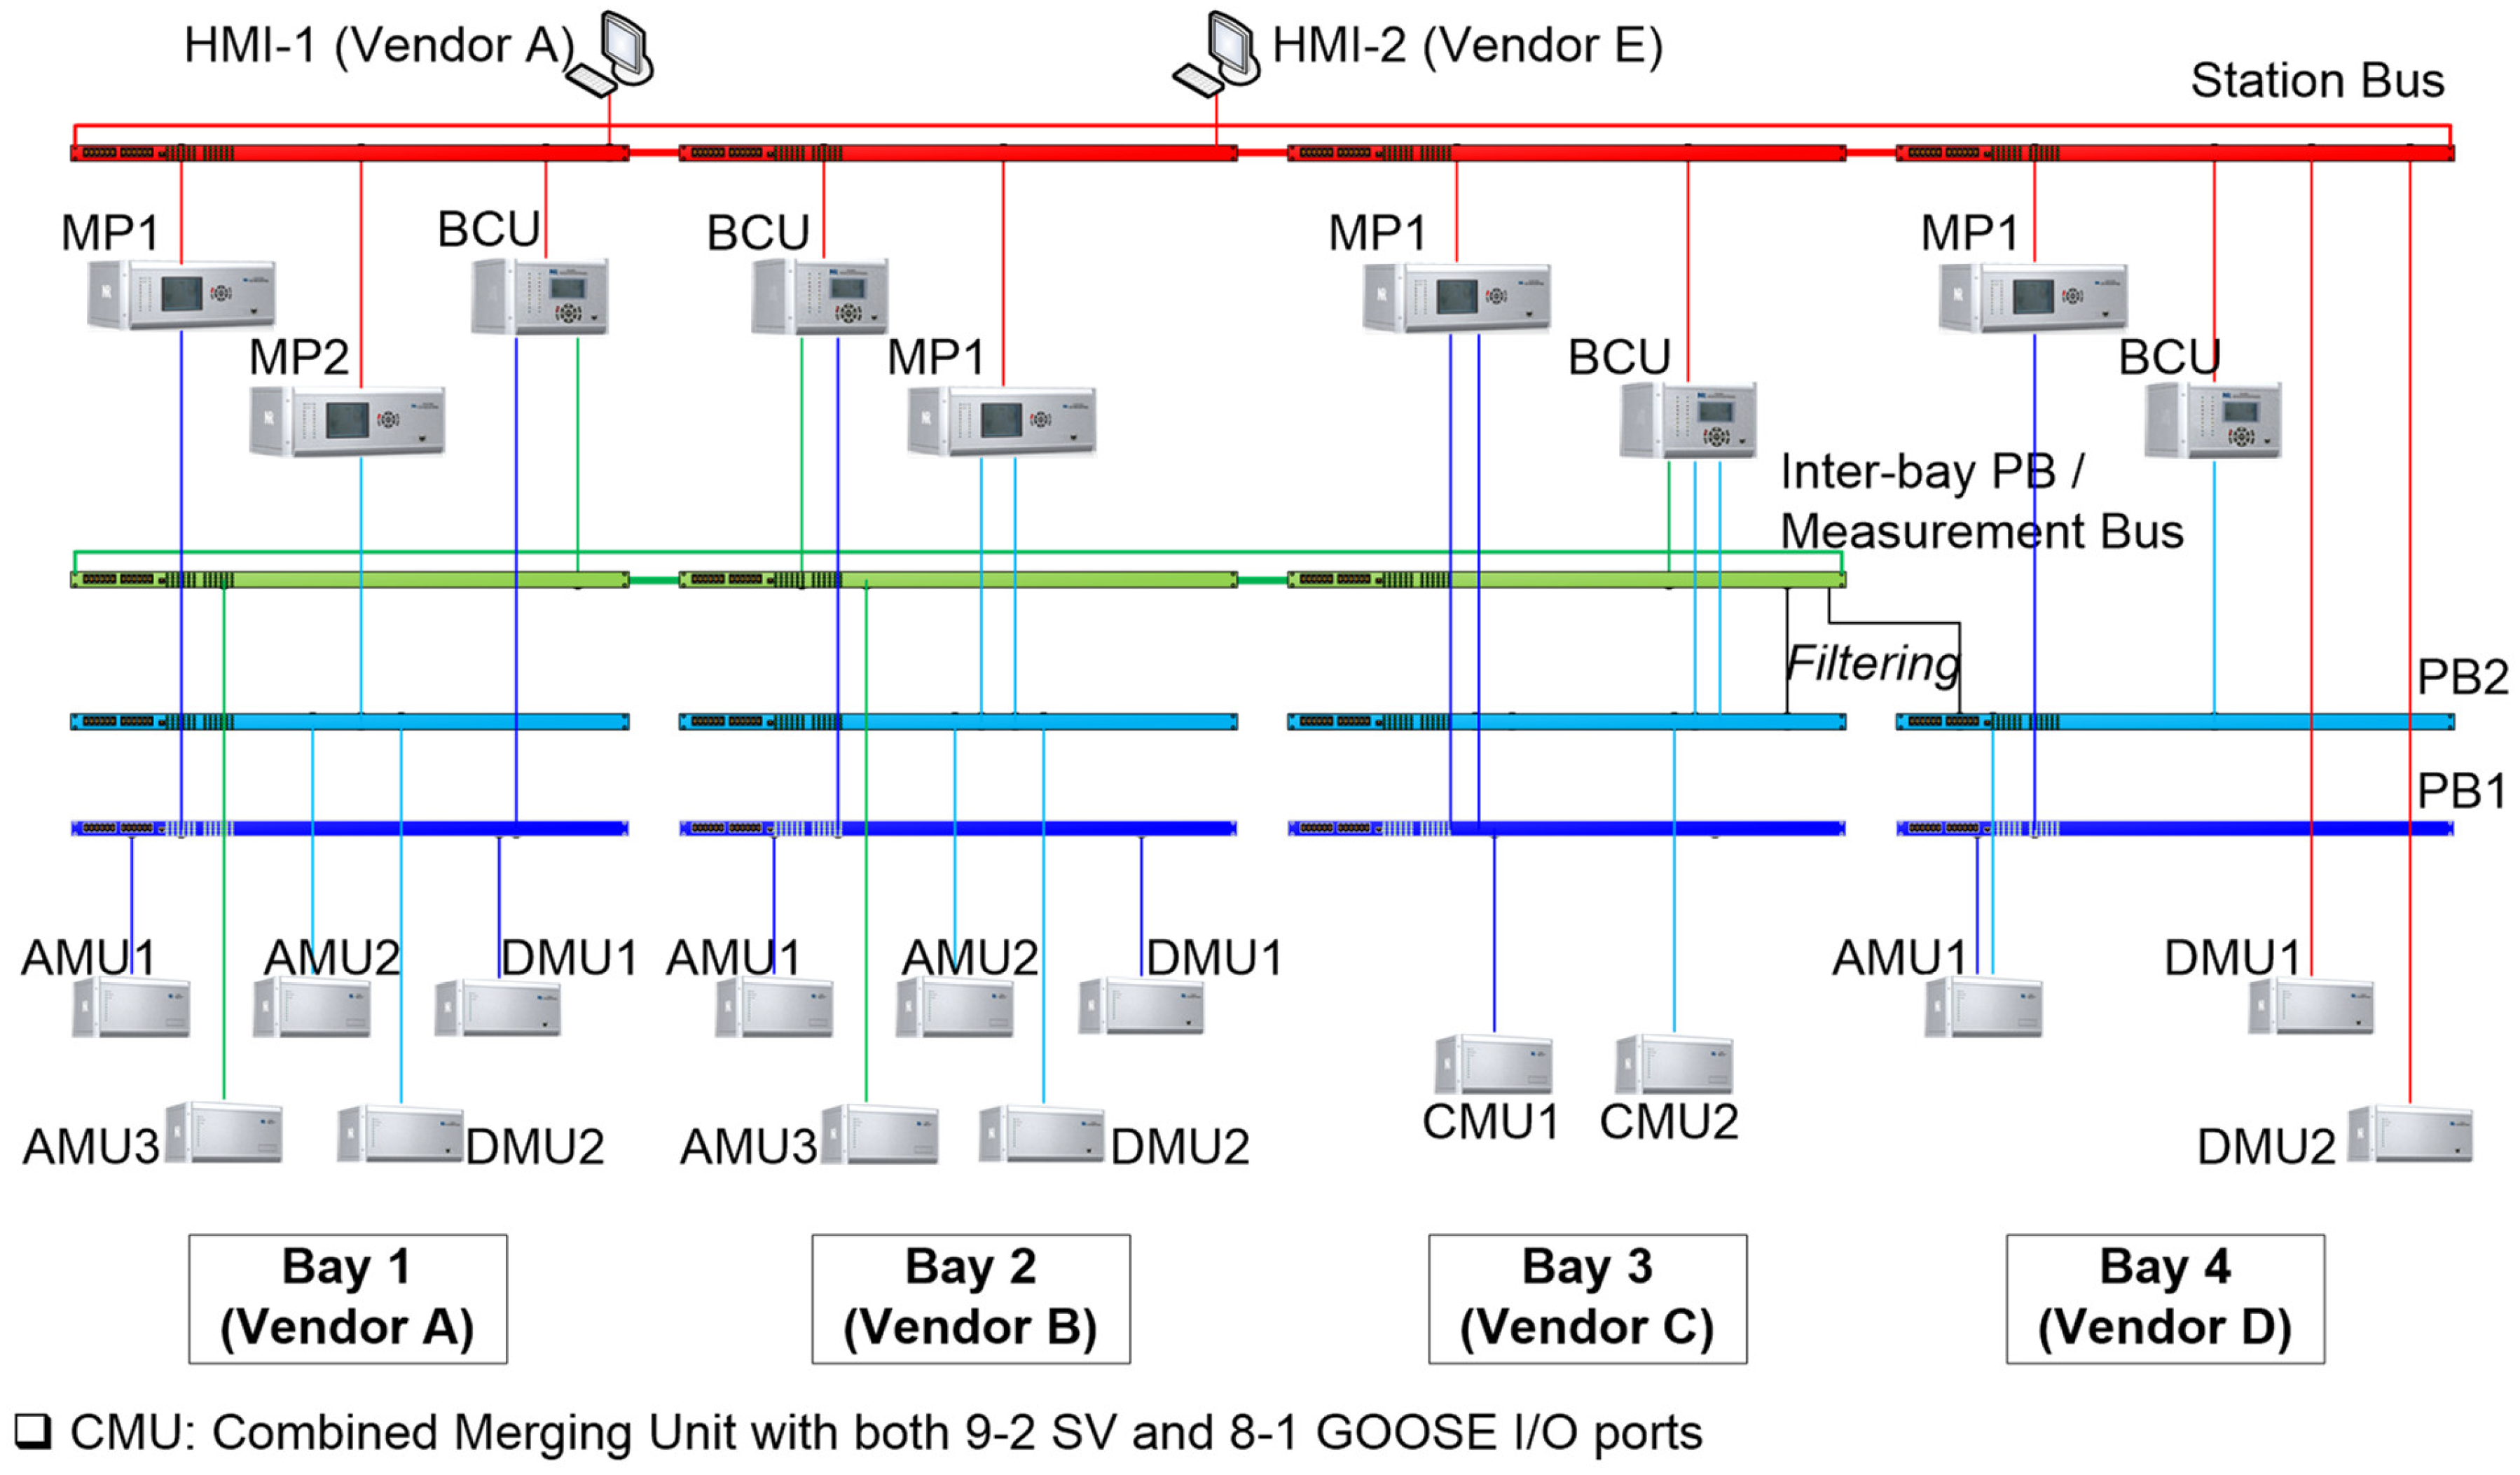
3.2. PAC System with Multivendor Bay Solutions

Five vendor solutions have been installed on the test platform to constitute a secondary system. Figure 4 shows the PAC system with four feeder bay solutions from four suppliers and two vendor HMIs. Figure 5a demonstrates the lab layout.
Each bay implements dedicated Ethernet switches for PB1, PB2, measurement bus, and station bus, respectively. Due to lab limitations, the Rapid Spanning-Tree Protocol (RSTP) has been used to link the station bus switches and measurement bus switches in all bays.
The proposed PAC system architecture also provides flexibility to address hardware limitations. For example, Figure 4 shows that the PB2 in bay 3 is directly connected to the measurement bus to allow inter-bay SV communications for CB synchronisation. An additional AMU can be installed and connected to the measurement bus to remove this link. Additionally, the protection IEDs in bay 4 currently only have one GOOSE port (being used by the station bus); therefore, the DMUs are linked to the station bus (with VLAN) to receive local trips.

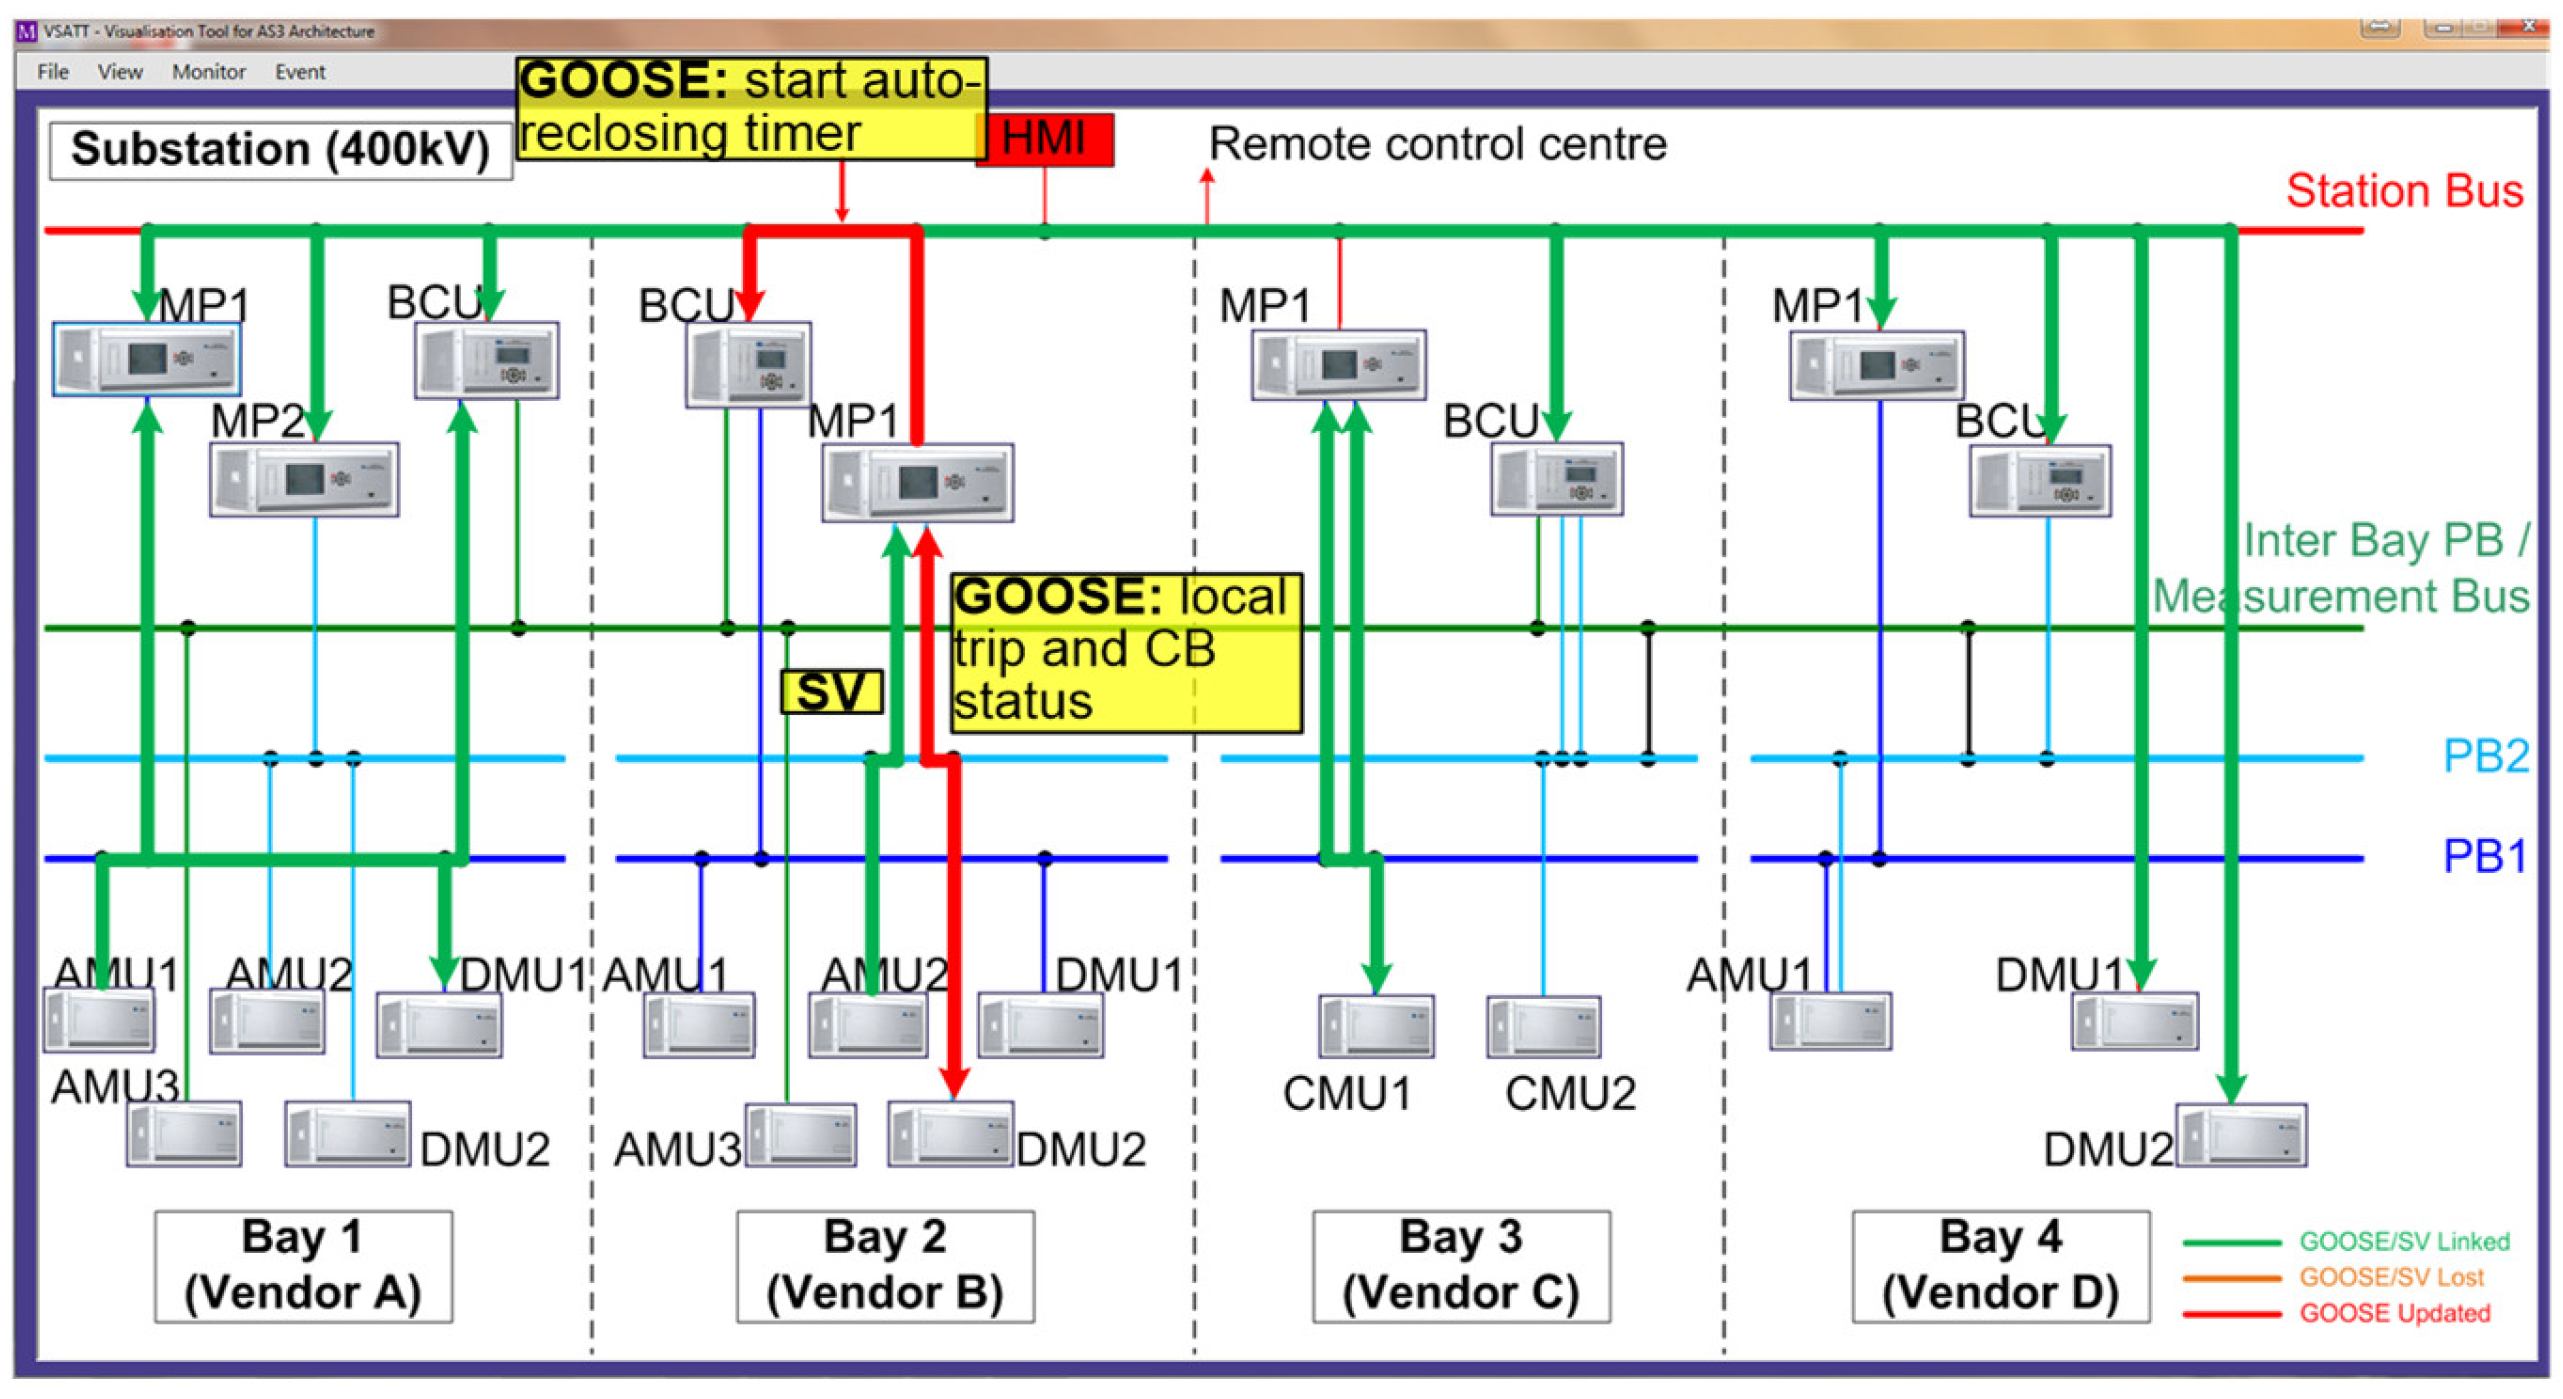
3.3. Visualisation Tool

For a PAC system with IEC 61850 network communication replacing the traditional point-to-point hard wires, commissioning engineers may have difficulties in validating PAC signals. To enhance the readiness of site commissioning, a data visualisation tool has been developed for the test platform (see Figure 5b). The tool can monitor and plot the live SV/GOOSE messages between devices once connected to the station or process buses. The status is presented in three colours as follows:
  • Green—SV/GOOSE being received;
  • Yellow—SV/GOOSE was received but now becomes lost;
  • Red—GOOSE data being updated, e.g., trip signal ON in a fault event (see Section 5).
With a substation configuration description (SCD) file, the tool can automatically record GOOSE data changes. By comparing the time stamps encoded (by IEDs) in GOOSE packets, the tool can calculate the transfer time delays for performance diagnosis. For example, Figure 6 illustrates that the tool can be used to measure the time delays Ta, Tb, Tc, and other parameters which are detailed in Table 1.
The visualisation tool intends to support the validation of IEC 61850 signals for commissioning engineers who are less familiar with network communication protocols. The details of using this tool to perform interoperability tests are presented in Section 5.

4. System Integration with SCL

This section presents the integration process with four vendor bay solutions using IEC 61850-6 SCL. The configuration issues identified from the experience of handling multivendor SCL files are highlighted.

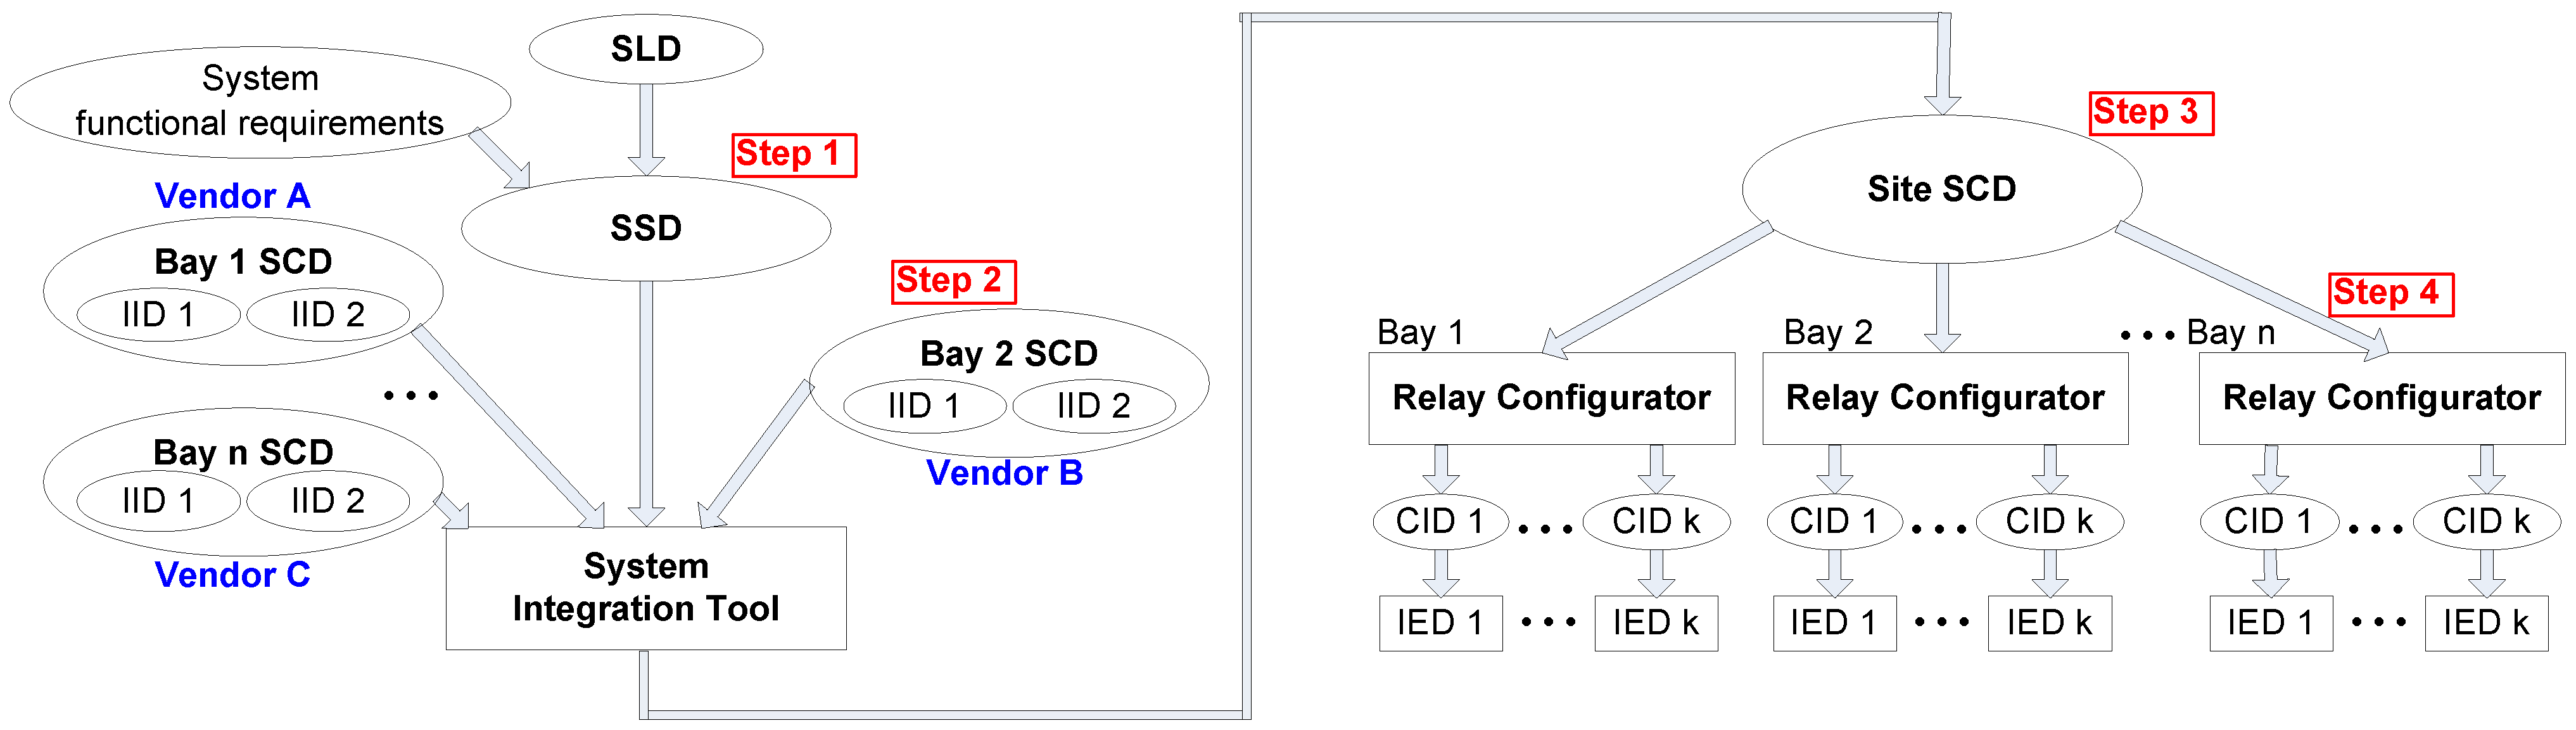
4.1. Bay-Solution Approach with Two Stages Bay SCLs

Figure 7 shows the proposed bay-solution approach with the system integration being decoupled into individual bays or so-called two stages SCLs, namely, (i) Stage 1: producing bay SCD file by a vendor at the bay level and (ii) Stage 2: producing system SCD file by the system integrator at the system level. The key steps are the following:
  • The system integrator produces a system specification description (SSD) file according to a single-line diagram (SLD) and functional requirements from the utility;
  • Each vendor preconfigures its bay by generating an SCD file, i.e., stage 1. A bay SCD file includes the project-specific instantiated IED description (IID) file of each device in the bay. An IID file contains the predefined data sets and control blocks for SV, GOOSE, and MMS messages, as well as SV/GOOSE mappings within the bay;
  • The integrator imports all bay SCD files, i.e., stage 2, into a system integration tool to generate a site SCD file. The site SCD file should include inter-bay GOOSE mappings for distributed applications. The integrator will also configure the HMI with MMS reporting and control functions;
  • With the site SCD file, each bay vendor reconfigures its bay to receive inter-bay GOOSE if needed.
The bay-solution approach provides an advantage in that the substation is not limited to a single vendor solution during a bay replacement, and the interoperability issues within a bay can be minimised. The system integrator just needs to set up MMS monitoring and HMI control functions and configure inter-bay SV/GOOSE subscriptions if necessary. The bay-solution method simplifies the integration process, compared to the case in which the integrator needs to set up the local process bus communications for third-party bays.

4.2. Integration Challenges

The procedures shown in Figure 7 may become difficult at steps 3 and 4 due to the exchange of SCL files between vendors. The two main challenges are as follows.

4.2.1. Information Modelling

There may be difficulties for the system integrator to understand the functions of each logical node (LN) from the SCD files provided by bay suppliers, especially for generic LNs such as generic automatic process control (GAPC) and generic process I/O (GGIO). A temporary solution is to use a lookup table or to clarify the function in the “desc” parameters of data objects (DOs) or data attribute (DAs). For a long-term benefit, utilities should publish specifications to standardise the data modelling [24].

4.2.2. Tool Compatibility Issues

Ideally, each bay supplier should be able to use a site SCD file generated from a common system integration tool to re-configure its IEDs for inter-bay GOOSE subscriptions. However, this is currently not achievable. From the experience of using various SCL integration tools during the lab setup, most SCL tools can read third-party SCL files and create site SCD files with inter-bay GOOSE mappings. However, an IED configurator cannot recognise the mappings created by a third-party SCL integration tool.
To address the mapping issues, the system has to be integrated by skipping the site SCD file. For instance, if vendor A needs to read vendor B GOOSE (see Figure 7), the vendor A SCL tool will import the vendor B bay SCD to create a GOOSE mapping in its own SCD file and then upload SCD to its vendor A IED configurator. A list of tool compatibility issues identified is highlighted in Section 6.

5. Interoperability Test Cases

Based on the integrated system, a number of functional test cases have been carried out to validate interoperability at process bus, measurement bus, and station bus. The developed visualisation tool has been used to monitor data traffic and to evaluate functional compliance and performance.

5.1. Process Bus Interoperability

In the test system shown in Figure 4, bay 2 has AMU2 and DMU2 from vendor A communicating with MP1 (with distance protection) from vendor B. The process bus interoperability performance was investigated by injecting faults at different locations of the simulated transmission lines and recording the trip reception time. The trip time is calculated by RTDS by measuring the elapsed time from a fault occurrence to the receipt of a binary output from a DMU.
To test the distance protection, three phase ground faults were applied to 25%, 50%, and 100% of the feeder, respectively. The zone boundary for MP1 was configured as 80% for zone 1 (with no delay) and 150% for zone 2 (with 200 ms delay). The fault was repeated 50 times for each location. Table 2 summarises the statistical results. The average time of a Zone 1 trip was 25 ms, which reflected a similar level of protection performance, compared to the other bays using single-vendor solutions, e.g., a maximum of 30 ms trip time, as specified by National Grid, UK.
To validate the relevant messages exchanged between devices, the developed visualisation tool was connected to PBs during the tests. Figure 8 shows a screenshot of the tool detecting that GOOSE messages were changed (in red colour) in bay 2. Table 3 summarises the GOOSE updates recorded by the visualisation tool.
As discussed in Section 3, the “time stamp” in Table 3 was retrieved from GOOSE messages indicating the time stamp for an event. With all devices in the lab synchronised to a central master clock, the transfer delays can be measured by comparing the time stamps between each packet (see Figure 6). From the result, the average transfer time (Tb) for the GOOSE trip from MP1 (vendor B) to DMU2 (vendor A) is around 4 ms, including the network delay and GOOSE processing time of DMU2.

5.2. Measurement Bus Interoperability

The CB synchronising function has been configured for the BCUs in all bays. In Figure 9, each BCU obtains the incoming voltage (Vsync2) from its local bay AMU. The BCU needs to derive the relevant busbar voltage (Vsync1) from the AMUs in other bays which it receives via the measurement bus.
A voltage selection function should be configured for a BCU to decide the busbar voltage as the BCU receives more than one SV stream via the measurement bus. Due to function limits, only vendor B and C BCUs have the capability to configure a voltage selection scheme. The scheme was developed by creating priority lists via programmable logic mappings. The BCUs first receive the switchgear status (via GOOSE generated by the RTDS) from the station bus. Depending on the switchgear status, the BCUs select the SV stream from the highest priority bay (if connected) as Vsync1. This priority-based VT selection scheme is limited by the maximum number of SV streams that one IED can read.
As the measurement bus has multivendor SV streams, CB synchronisation tests will help demonstrate the inter-bay SV interoperability. The test results in Figure 10 indicate that synchronising with the developed VT selection scheme is carried out successfully. Note that tests have also proved that the BCUs from vendors A and D can read third-party SV streams for synchronising with fixed VT sources.

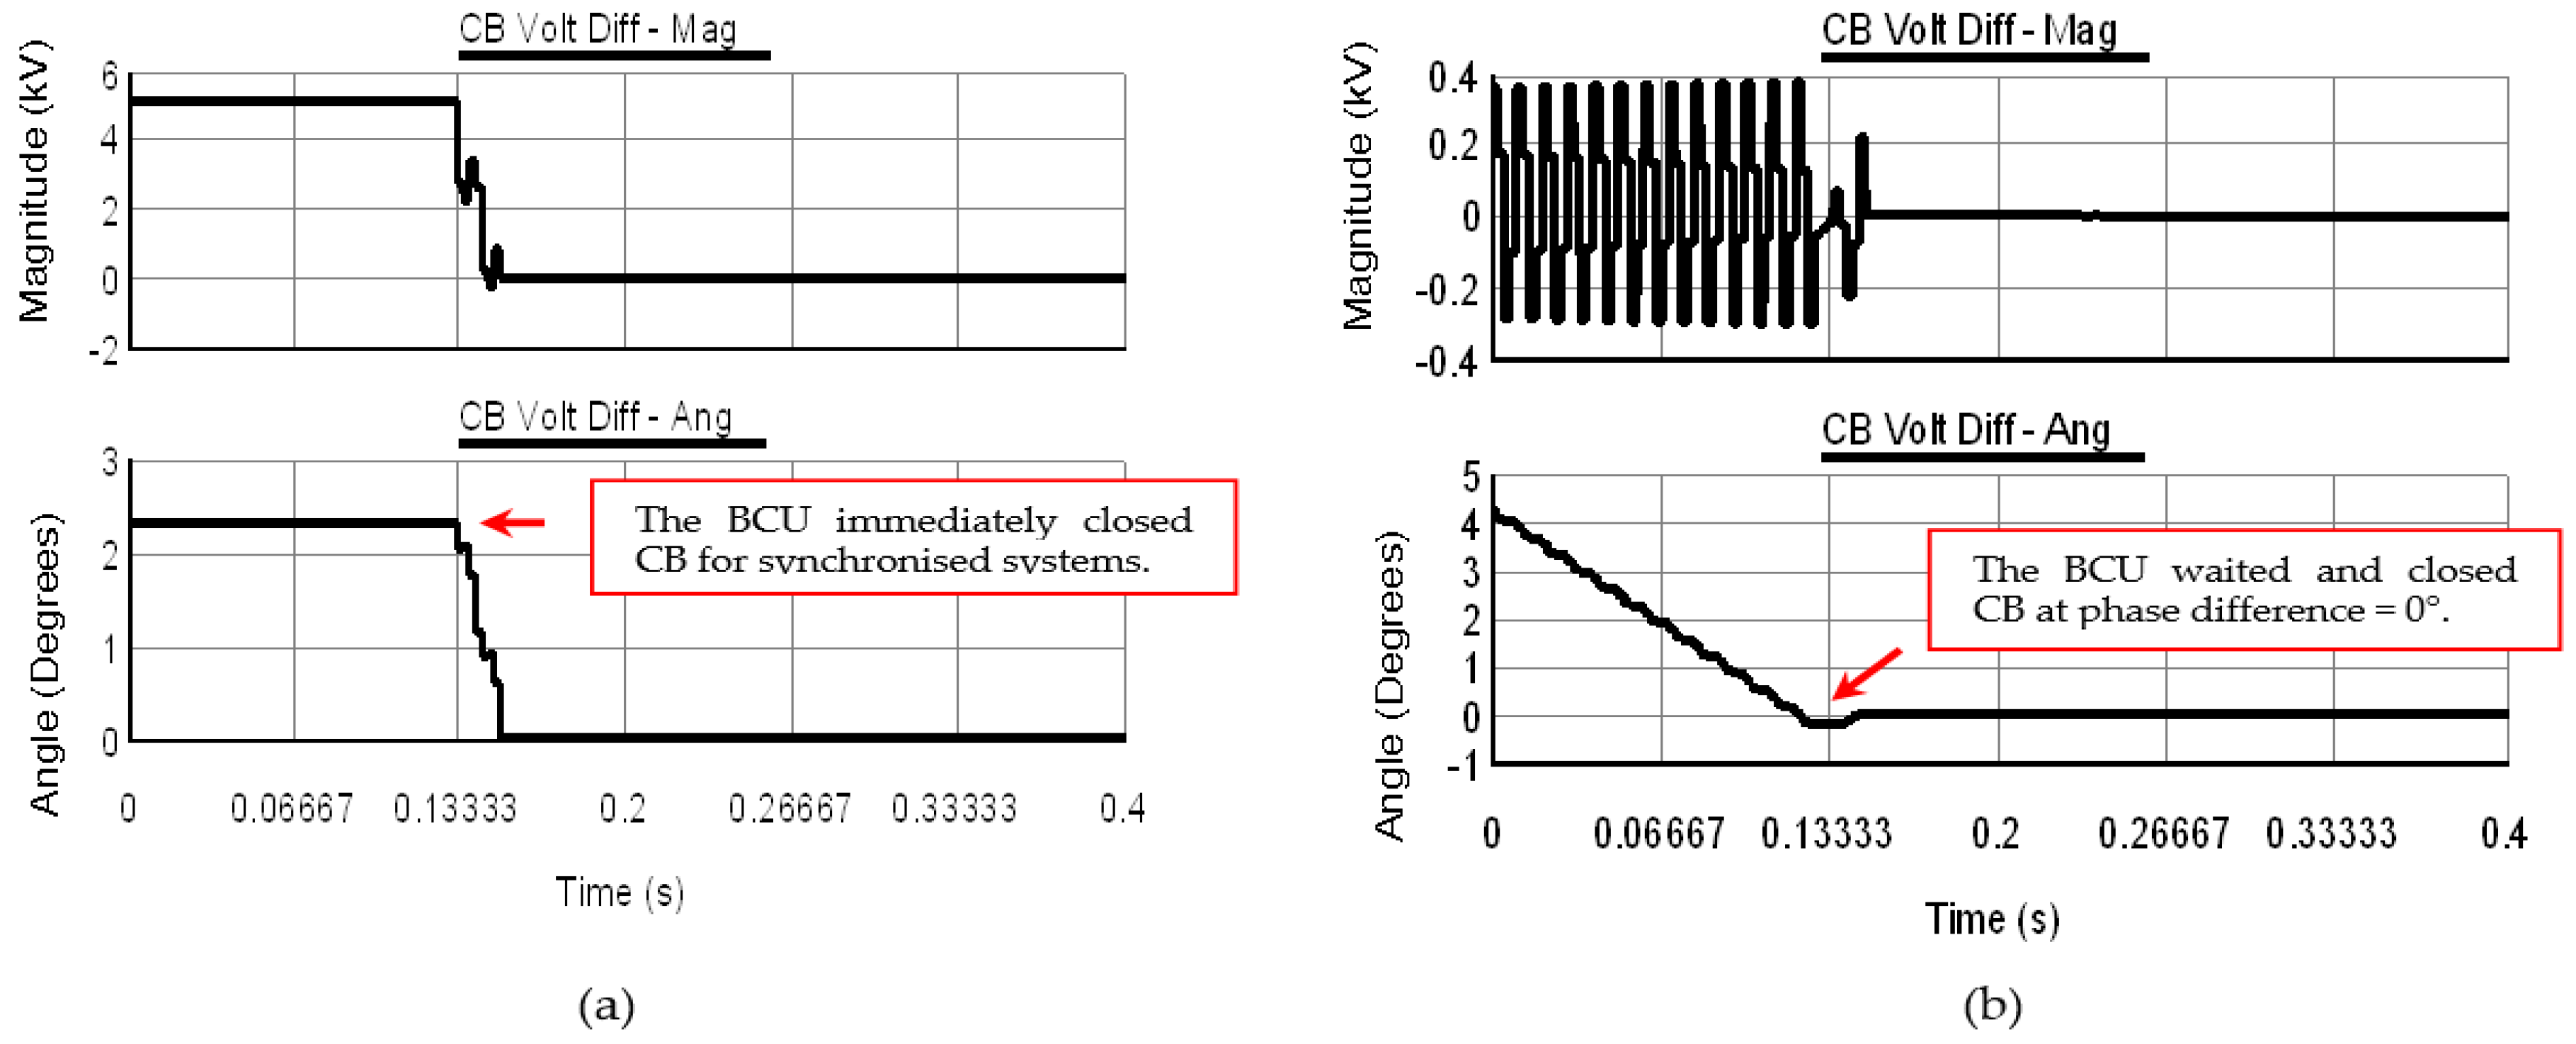
5.3. Station Bus Interoperability

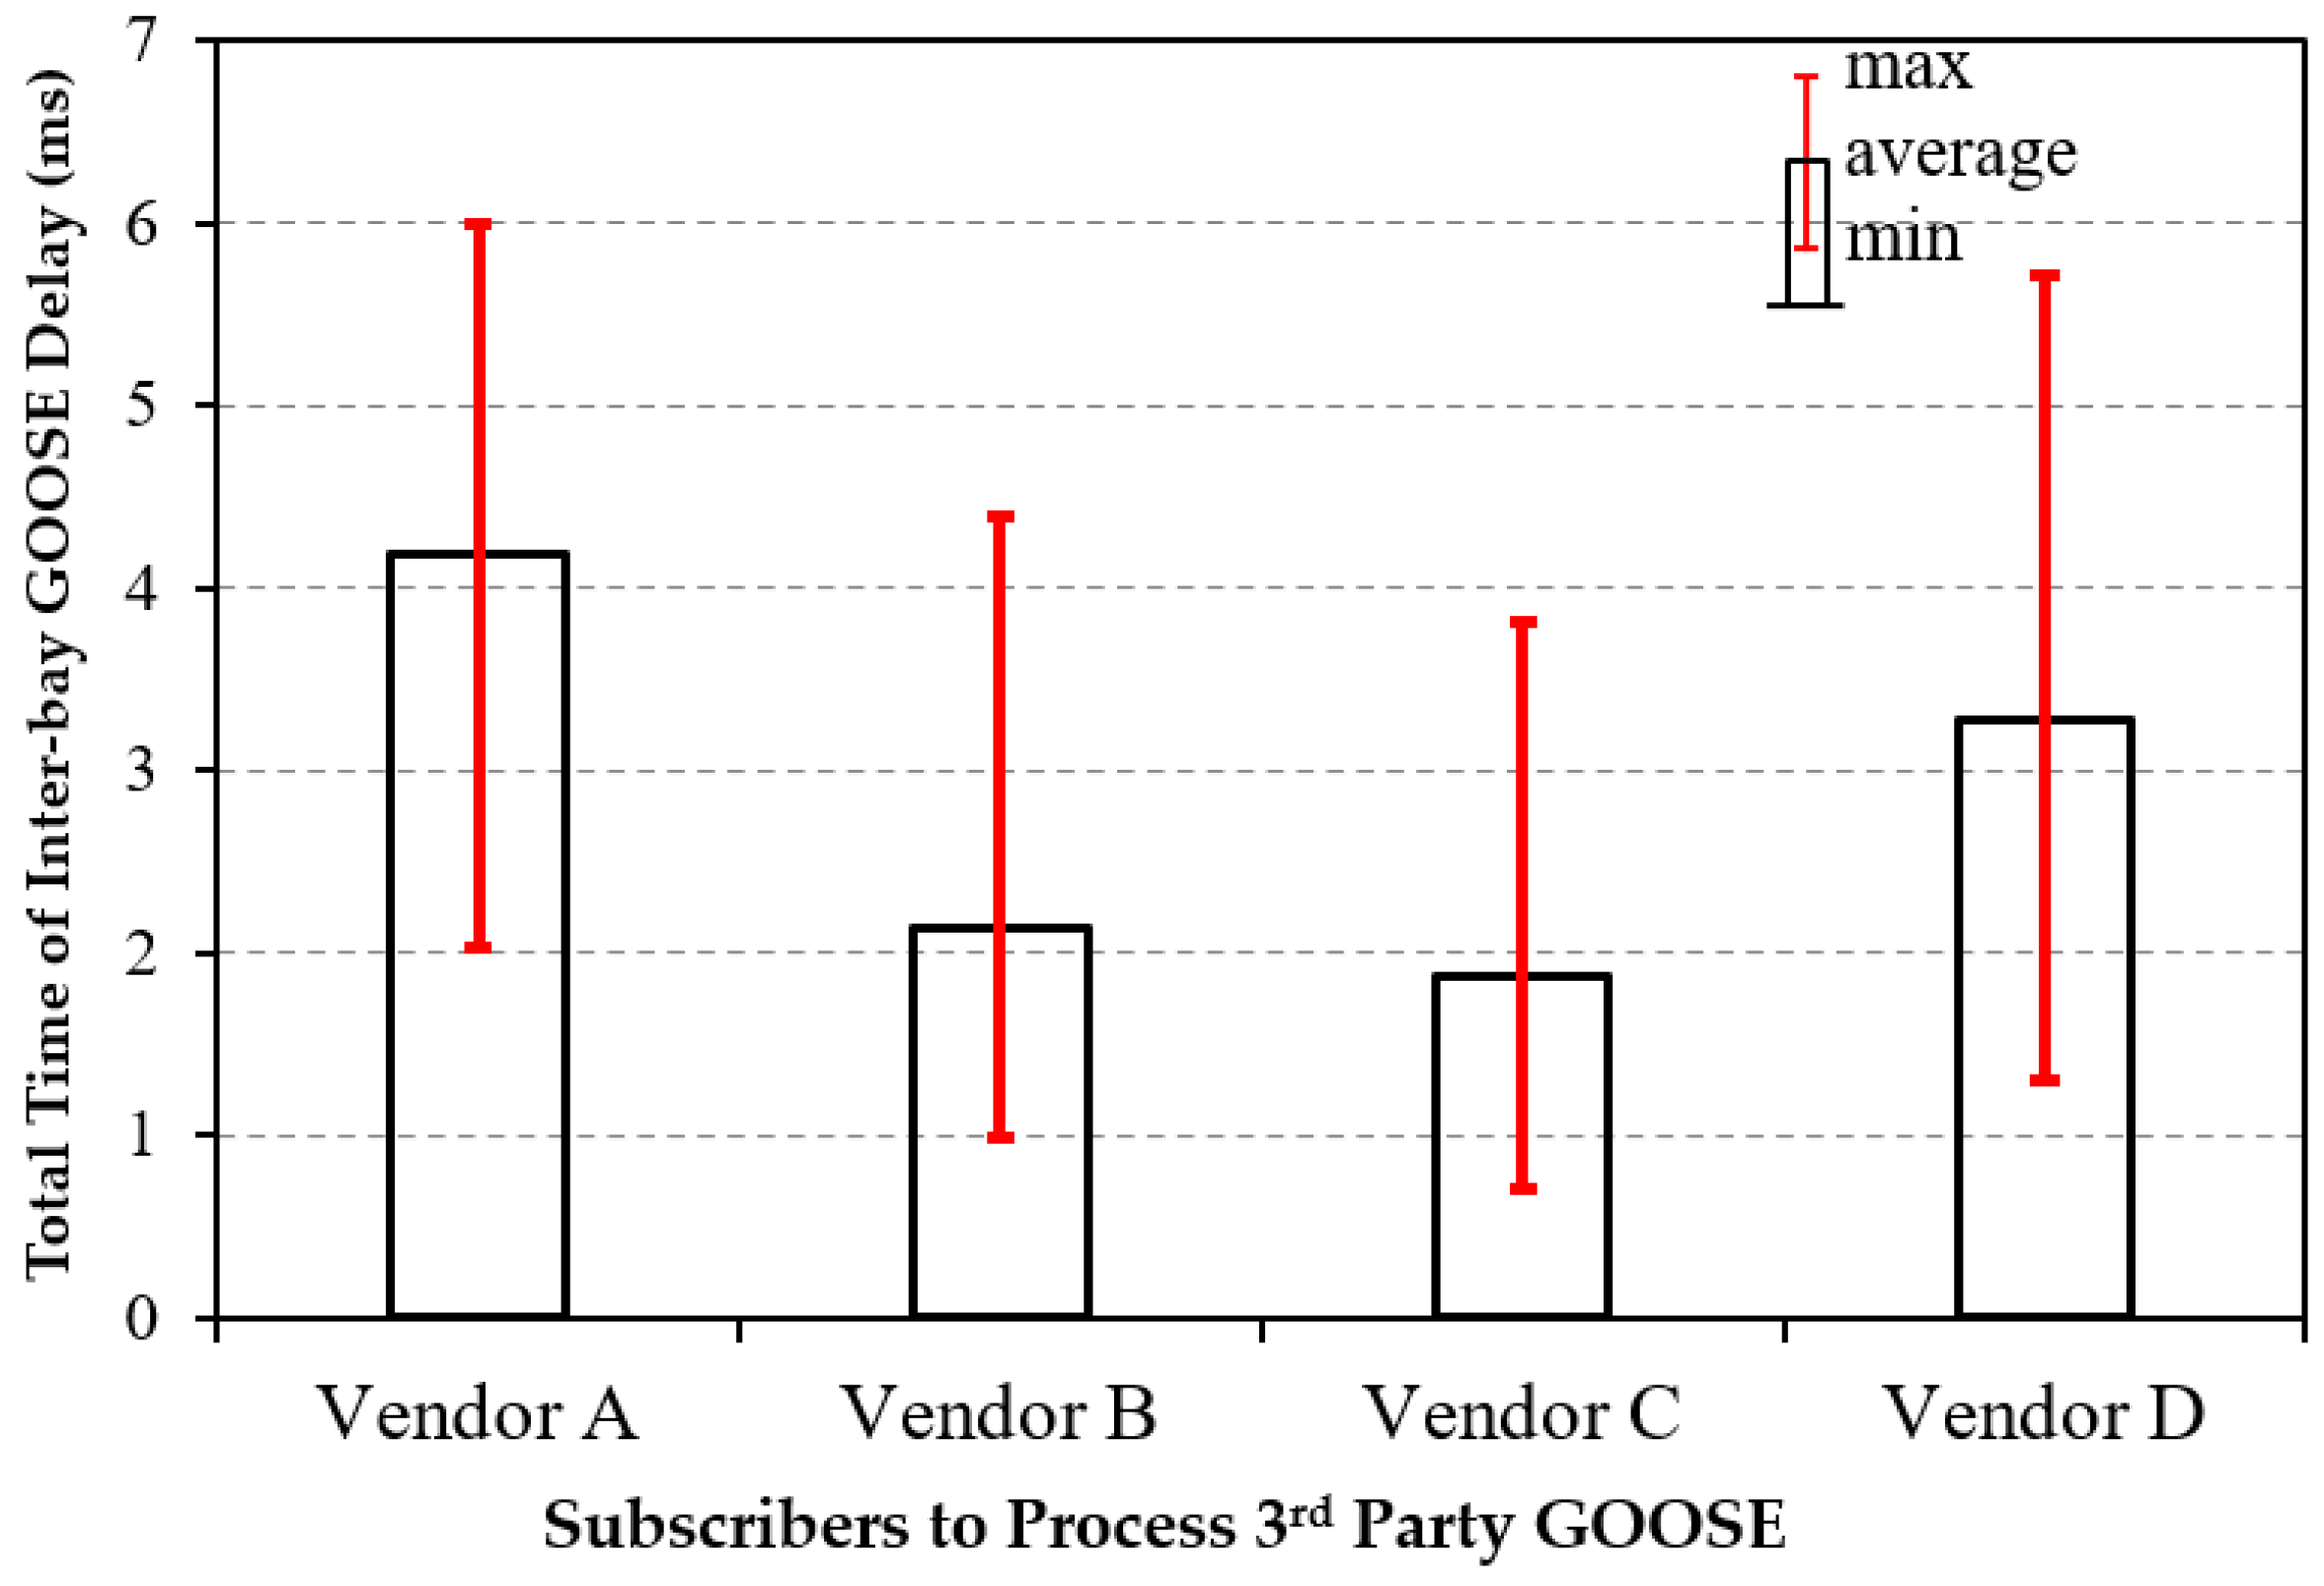
5.3.1. Inter-Bay GOOSE Interoperability via CB Failure Testing

CB failure protection tests have been carried out to assess the inter-bay GOOSE communication. By disconnecting the trip circuit to the RTDS, a CB failure event was created in bay 1. After a pre-set 200 ms delay, vendor A BCU in bay 1 published the CB failure GOOSE trip over the station bus. The IEDs in other vendor bays received the GOOSE message and issued trip signals. The resulting GOOSE changes were saved by the visualisation tool and listed in Table 4.
The rest three bays have also been tested on the CB failure protection function. The tests were repeated 10 times for each bay. The GOOSE updates were captured by the data visualisation tool to calculate the transfer time of inter-bay GOOSE messages. Figure 11 shows the average transfer delay between multivendor IEDs on the station bus. Note that the delay consists of:
  • IED communication processing time to decode and encode GOOSE;
  • IED internal logic processing time to map the incoming GOOSE to a back trip;
  • Station bus network delay.
The results show the variability of GOOSE transfer time between vendor solutions even though interoperability is achieved. The test system, therefore, provides a platform that can validate functional compliance as per utility requirements.

5.3.2. MMS Interoperability via HMI Monitoring and Control

As shown in Figure 4, the vendor A and E HMIs have been installed on the station bus to provide control and monitoring functionality for all bays. The two HMIs can use MMS reporting services to read measurements, binary indications (or alarms), and CB status from the IEDs of all vendors. Additionally, the HMIs can instruct BCUs (via MMS commands) to control switchgear. The following two issues were identified when configuring the HMI databases:
  • Vendor A HMI has interoperability issues when importing SCD files from third parties. To successfully build an IEC 61850 database, the system integrator needs to manually modify some parts of the SCD files as per the proprietary HMI configurator requirements;
  • Vendor E HMI has challenges to configure the HMI database to initialise MMS reporting services on IEDs. The HMI will not issue a “Start Reporting” command to an IED which defines all report control blocks (RCBs) under a common “root logical device (LD)” rather than the source LD containing signals to be reported. This problem was addressed at the HMI database side by creating a dummy IEC 61,850 signal/variable coming from the root LD.

6. Discussions

This section summarises the lessons learned from the aforementioned architecture design, system integration, and interoperability tests.

6.1. SCL Configuration—At Tool Level

There are still issues with the compatibility between IED configuration tools and third-party system integration tools. Table 5 lists the parameters with varying implementations of SCL found during the study. These variations have caused compatibility issues for IED (or SCL) tools when using third-party SCL files. These issues have been reported back to the participated vendors.

6.2. Protocol Implementation—At Device Level

The interoperability tests have also found several issues regarding protocol implementation, such as the following:
The use of “SmpSynch” to represent local or global synchronisation for 9-2 SV messages;
Failed subscriptions to the fixed-length encoded GOOSE as defined in IEC 61850-8-1;
IEDs from some vendors cannot publish GOOSE with data qualities, resulting in issues for test mode.
These implementation issues can only be solved by updating the firmware embedded on IEDs. Therefore, the protocol problems are not similar to SCL issues, which could be quickly solved by manual modifications of SCL files. It is important to check the Protocol Implementation Conformance Statement (PICS) documents of IEDs to understand interoperability limitations at the start and hence avoid issues that may cause project delays.

6.3. Information Modelling

The SCL files provided by all suppliers show a variety of data models (logical nodes) and frequent use of GGIOs or GAPCs without standard semantics. To reduce the integration difficulty, utilities should develop a specification to standardise the LN functions used between vendors. The specification would define which LN (including LN class, prefix, and instance number) should be adopted to represent a specific PAC signal, indication, or alarm in a bay. This approach can improve interoperability by helping suppliers quickly understand third-party SCL files without acquiring additional documents.

6.4. Performance and Application Limitations

From CB synchronisation tests, it has been found that the sampling time delays (e.g., A/D conversion time) of AMUs are different between manufacturers. The IEC 61869-9 AMU standard only specifies that the maximum delay for protective accuracy class outputs shall be less than 2.0 ms, which could still result in up to 36° phase shift for 50 Hz systems. The BCU in bay 3 has been observed with a voltage angle deviation of 12° under a CB closed condition. Therefore, for functions involving multivendor AMUs, IEDs should be able to compensate for the sampling delays when calculating phase angle differences.
Additionally, different IED products have different limits on the number of SV streams that can be read. This could cause challenges for applications requiring multiple SV streams, e.g., CB synchronisation, and busbar protection.

7. Conclusions

This paper presents a standard PAC system architecture design for digital substations and a real-time virtual substation primary plant modelling using RTDS and develops a multivendor test platform to assess the challenges for integration, data visualisation, and interoperability. The test system was integrated using a PAC bay-solution method, reducing the integration complexity while still achieving vendor interoperability. A visualisation tool was also developed to monitor data traffics and facilitate the analyse of interoperability performance.
The studies have shown that the interoperability between IEDs from different vendors is still not yet seamless. Achieving interoperability through a bay-by-bay approach can reduce individual bay configuration time and the integration difficulty of processing multivendor SCL files. The interoperability issues identified have been summarised in this paper. The outcomes of this work show the benefits of the proposed PAC system architecture, PAC bay solutions, and engineering process as well as the potential risks when integrating equipment from multiple suppliers, one of the key issues being SCL file compatibility between bay suppliers and system integrators. The identified key issues can help utilities to develop their configuration guidelines to ensure interoperability and to facilitate the future rollout of digital substations.

Author Contributions

Conceptualization, L.C., H.L., T.C. and R.Z.; methodology, L.C., H.L., T.C. and R.Z.; software, L.C.; validation, L.C., H.L., T.C. and R.Z.; formal analysis, L.C. and H.L.; investigation, L.C. and H.L.; resources, L.C. and H.L.; data curation, L.C. and H.L.; writing—original draft preparation, L.C.; writing—review and editing, L.C. and H.L.; visualization, L.C. and H.L.; supervision, H.L.; project administration, H.L.; funding acquisition, H.L. All authors have read and agreed to the published version of the manuscript.

Funding

This research was funded by Electricity Network Innovation Allowance UK, grant number NIA_NGET0162.

Institutional Review Board Statement

Not applicable.

Informed Consent Statement

Not applicable.

Data Availability Statement

Not applicable.

Conflicts of Interest

The authors declare no conflict of interest.

References

  1. Cheng, X.; Lee, W.J.; Pan, X. Modernizing substation automation systems: Adopting IEC Standard 61850 for modeling and communication. IEEE Ind. Appl. Mag. 2017, 23, 42–49. [Google Scholar]
  2. Manbachi, M.; Sadu, A.; Farhangi, H.; Monti, A.; Palizban, A.; Ponci, F.; Arzanpour, S. Real-time co-simulation platform for smart grid Volt-VAR optimization using IEC 61850. IEEE Trans. Ind. Inform. 2016, 12, 1392–1402. [Google Scholar]
  3. Almas, M.S.; Vanfretti, L. A hybrid synchrophasor and GOOSE-based power system synchronization scheme. IEEE Access 2016, 4, 4659–4668. [Google Scholar]
  4. Etherden, N.; Vyatkin, V.; Bollen, M.H.J. Virtual power plant for grid services using IEC 61850. IEEE Trans. Ind. Inform. 2016, 12, 437–447. [Google Scholar] [CrossRef]
  5. Mazur, D.C.; Entzminger, R.A.; Kay, J.A. Enhancing traditional process SCADA and historians for industrial and commercial power systems with energy (via IEC 61850). IEEE Trans. Ind. Appl. 2016, 52, 76–82. [Google Scholar] [CrossRef]
  6. Yang, L.; Crossley, P.A.; An, W.; Chatfield, R.; Wright, J. Design and performance testing of a multivendor IEC61850-9-2 process bus based protection scheme. IEEE Trans. Smart Grid 2014, 5, 1159–1164. [Google Scholar] [CrossRef]
  7. Jamborsalamati, P.; Sadu, A.; Ponci, F.; Monti, A. A flexible HiL testing platform for performance evaluation of IEC 61850-based protection schemes. In Proceedings of the 2016 IEEE Power and Energy Society General Meeting, Boston, MA, USA, 17–21 July 2016. [Google Scholar]
  8. Liu, Z.; Hoidalen, H.K. An adaptive inverse time overcurrent relay model implementation for real time simulation and hardware-in-the-loop testing. In Proceedings of the 13th IET International Conference on Development in Power System Protection (DPSP), Edinburgh, UK, 7–10 March 2016. [Google Scholar]
  9. Otani, T.; Hagiwara, F.; Matsumoto, S.; Kuroi, K.; Katayama, S.; Ogiyama, T. Requirements for IEC 61850 in terms of Logical Node design and engineering tool compatibility. In Proceedings of the CIGRE Session 2014, Paris, France, 24–29 August 2014. [Google Scholar]
  10. Ridwan, M.I.; Miswan, N.S.; Shokri, M.S.M.; Noran, M.N.; Lajim, R.M.; Awang, H.N. Interoperability in smart grid using IEC 61850 standard: A power utility prospect. In Proceedings of the 2014 IEEE Innovative Smart Grid Technologies-Asia (ISGT ASIA), Kuala Lumpur, Thailand, 20–23 May 2014. [Google Scholar]
  11. Yang, M.-T.; Gu, J.-C.; Lin, P.-C.; Huang, Y.-L.; Huang, C.-W.; Guan, J.-L. Interoperability and performance analysis of IEC61850 based substation protection system. Int. J. Electr. Robot. Electron. Commun. Eng. 2013, 7, 497–504. [Google Scholar]
  12. Eshpeter, A. Resolving the challenges of multiple vendor 61850 implementations. In Proceedings of the 2016 IEEE PES Transmission and Distribution Conference and Exposition (T&D), Dallas, TX, USA, 3–5 May 2016. [Google Scholar]
  13. Koshiishi, K.; Kaneda, K.; Watabe, Y. Interoperability experience with IEC 61850-based substation automation systems. In Proceedings of the 2012 IEEE PES Transmission and Distribution Conference and Exposition (T&D), Orlando, FL, USA, 7–10 May 2012. [Google Scholar]
  14. Manassero, G.; Pellini, E.L.; Senger, E.C.; Nakagomi, R.M. IEC61850-based Systems-functional testing and interoperability issues. IEEE Trans. Ind. Inform. 2013, 9, 1436–1444. [Google Scholar] [CrossRef]
  15. Anombem, U.; Li, H.; Crossley, P.; An, W.; Zhang, R.; Mctaggart, C. Performance testing and assessment of Merging Units using IEC61850. In Proceedings of the 2011 International Conference on Advanced Power System Automation and Protection (APAP), Beijing, China, 16–20 October 2011. [Google Scholar]
  16. Chen, X.; Guo, H.; Crossley, P. Performance testing of IEC 61850 based architecture for UK National Grid standardised substation automation solutions. In Proceedings of the 2015 IEEE Power & Energy Society General Meeting, Denver, CO, USA, 26–30 July 2015. [Google Scholar]
  17. Chen, X.; Guo, H.; Crossley, P. Interoperability performance assessment of multivendor IEC61850 process bus. IEEE Trans. Power Deliv. 2016, 31, 1934–1944. [Google Scholar] [CrossRef] [Green Version]
  18. Ingram, D.M.E.; Schaub, P.; Taylor, R.R.; Campbell, D.A. System-level tests of transformer differential protection using an IEC 61850 process bus. IEEE Trans. Power Deliv. 2014, 29, 1382–1389. [Google Scholar] [CrossRef] [Green Version]
  19. Chen, L.; Charton, T.; Li, H.; Zhang, R. Virtual site acceptance test platform for IEC 61850 based substations with multi-vendor bay solutions. J. Eng. 2018, 2018. [Google Scholar] [CrossRef]
  20. Anombem, U.; Li, H.; Crossley, P.; Zhang, R.; McTaggart, C. Process bus architectures for substation automation with life cycle cost consideration. In Proceedings of the 10th IET International Conference on Developments in Power System Protection (DPSP), Manchester, UK, 29 March–1 April 2010. [Google Scholar]
  21. Charton, T.; Chen, L.; Li, H.; Zhang, R. Virtual Site Acceptance Testing and Training Facility (VSATT) for digital substation solutions. In Proceedings of the CIGRE Study Committee B5 Colloquium, Auckland, New Zealand, 11–15 September 2017. [Google Scholar]
  22. Brand, K.P. IEC 61850 as backbone for smart PAC systems. CSEE J. Power Energy Syst. 2016, 2, 15–22. [Google Scholar] [CrossRef]
  23. RTDS Technologies Inc. The RTDS Simulator-the World’s Benchmark for Real-Time Power System Simulation. Available online: https://www.rtds.com/ (accessed on 19 April 2021).
  24. Guise, L.; Huon, G.; Lhuillier, P.; Haecker, M.; Brunner, C. IEC 61850 interoperability at information level. A challenge for all market players. In Proceedings of the CIGRE Session 2014, Paris, France, 24–29 August 2014. [Google Scholar]
Figure 1. High-level view of the proposed PAC architecture: (a) Generic PAC architecture with filter switches (optional) for linking or isolating process bus bays and (b) PAC system architecture for double busbar with intendent process bus bay.
Energies 14 02337 g001
Figure 2. IEC61850 based VDSTS testing platform made of (1) a virtual substation primary plant modelling using RTDS, (2) PAC system architecture with multivendor secondary equipment and bay solutions, and (3) interoperability analysis and visualisation tools.
Energies 14 02337 g002
Figure 3. Simulated virtual 400 kV substation model in RTDS.
Energies 14 02337 g003
Figure 4. Device arrangement in the proposed substation PAC system architecture, i.e., one station bus, one inter-bay/measurement process bus, and two process buses.
Energies 14 02337 g004
Figure 5. Lab layout of test system consists of (a) hardware platform and (b) HMI and interoperability analysis and visualisation tools.
Energies 14 02337 g005
Figure 6. Example of time stamps captured by the visualisation tool.
Energies 14 02337 g006
Figure 7. System integration process with the bay-solution approach and two stages engineering process.
Energies 14 02337 g007
Figure 8. Example of the visualisation tool detecting GOOSE updated in bay 2.
Energies 14 02337 g008
Figure 9. Inter-bay SVs via the measurement bus for synchronisation.
Energies 14 02337 g009
Figure 10. RTDS monitored voltage differences across CBs during reclosing: (a) Bay 2 (without slip) and (b) B Bay 3 (with a slip frequency = 0.1 Hz).
Energies 14 02337 g010
Figure 11. GOOSE transfer time via station bus (incl. processing and transit time).
Energies 14 02337 g011
Table 1. Time delay and function parameters.
ParameterDescriptions
TaProtection response time = t1 − t0.
TbProcess bus transfer time = t2 − t1.
TcDMU output delay = t3 − t2.
t0The time when the RTDS generates a fault and is stamped by the RTDS.
t1The time when MP1 publishes the GOOSE trip. Time stamped by MP1.
t2The time when the DMU publishes the acknowledgement (via GOOSE) of receiving the trip signal. Time stamped by the DMU.
t3The time when the RTDS receives a binary output from the DMU and is stamped by the RTDS.
Tn1, Tn2Network transmission delays of PBs.
f1Protection function enabled in MP1, e.g., distance protection.
f2Function that converts incoming signals to Binary Output (BO) signals
Table 2. Fault injection tests for MP1 in bay 2.
Fault TypeZoneTrip Reception Time (ms)
AverageStandard DeviationMaximum
ABC-to-ground (25% of feeder)Zone 123.81.34027.4
ABC-to-ground (50% of feeder)Zone 126.41.50429.4
ABC-to-ground (100% of feeder)Zone 2223.71.185226.3
Table 3. Example of GOOSE events recorded by the visualisation tool.
NOIEDGOOSE SignalTime StampPre-ValuePost-Value
1RTDSCTRL/OUT_GGIO6/Ind.stVal (Fault Injected—Bay 2)12:12:03.499299943 UTC01
2BAY2_MP1CtlCB1/CB1PTRC1/Tr.general (Protection Trip)12:12:03.513999998 UTC01
3BAY2_DMU2RPIT/ProtInGGIO1/Ind2.stVal (Trip Received)12:12:03.516993343 UTC01
4RTDSCTRL/OUT_GGIO7/Ind.stVal (RTDS Trip Received—BAY 2)12:12:03.521949946 UTC01
5BAY2_DMU2RPIT/XCBR1/Pos.stVal (CB Position)12:12:03.576992571 UTC80 (On)40 (Off)
Table 4. Exchanged GOOSE data during a CB failure event in Bay 1.
NOIEDGOOSE SignalTime StampPre-ValuePost-Value
1RTDSCTRL/OUT_GGIO2/Ind.stVal (Fault Injected—Bay 1)12:21:37.386099934 UTC01
2BAY1_MP1PROT/PTRC1/Tr.general (Protection Trip)12:21:37.404000043 UTC01
3BAY1_BCUPROT/RBRF1/OpEx.general (CB Failure Trip)12:21:37.611999988 UTC01
4BAY3_BCULn1_ExternalTrip1/EXT_PSCH1/Op.general(Back Trip—BAY 3)12:21:37.613273024 UTC01
5BAY2_BCUSystem/GosGGIO2/Ind1.stVal (Back Trip—BAY 2)12:21:37.613999962 UTC01
6BAY4_DMU1MON/SP16GAPC1/Ind15.stVal (Back Trip—BAY 4)12:21:37.615294635 UTC01
Table 5. SCL parameters with varying implementations.
Item in SCLDescriptions
<ExtRef>This element shows the IED inputs (e.g., GOOSE) from external devices. Different SCL tools may have variations in defining <ExtRef> at different locations in SCL files.
intAddrThis element defines the data attribute where an external input is linked. However, the naming format is not specifically defined in the IEC61850-6 standard.
srcLDInst & srcCBNameThese elements define the LD instance containing the source control block and the name of the source control block, respectively. However, some SCL tools have not implemented these parameters.
appIDThis is an application identifier for a GOOSE control block. Some SCL tools will change the appID into their default format when importing 3rd party files.
<ServerAt>This can be used to reference an existing server containing GOOSE and report control blocks. It may not be recognised by some SCL tools, resulting in failed subscriptions.
smvID & APPIDThese two parameters are used to identify an SV stream. Some vendor tools have a specific format or value range.
Publisher’s Note: MDPI stays neutral with regard to jurisdictional claims in published maps and institutional affiliations.

