1. Introduction
The availability of drinking water is essential in human life and its scarcity may be a source of serious diseases and cause death. According to World Health Organization [
1], 829,000 people die from diarrhea each year globally as a result of drinking contaminated water, sanitation, and hand hygiene. Furthermore, it is estimated that 50% of the World’s population will be living in water-stressed areas by 2025 [
1]. Although 75% of the Earth’s surface is covered by water, this water must be firstly desalinated and purified before it is drinkable. Thermal desalination technologies like multi-stage flash distillation or multi-effect distillation, and membrane-based desalination technologies like reverse osmosis or electrodialysis [
2] can be examples of mature and widely used desalination technologies. However, these conventional technologies consume large amounts of energy, up to 5.5 kWh·m
−3 for electrodialysis, 7.0 kWh·m
−3 for reverse osmosis, 25.5 kWh·m
−3 for multi-stage flash distillation, and 28.0 kWh·m
−3 for multi-effect distillation [
3], which usually comes from burning fossil fuels. As a result, these conventional desalination technologies emit large amounts of greenhouse gases into the atmosphere, e.g., it is estimated that up to 4.3 kg, and 26.9 kg of CO
2 is emitted when 1 m
3 of desalinated water is produced by using reverse osmosis, and multi-effect distillation, respectively [
4]. One of the possibilities of decreasing greenhouse gas emissions is using renewable energy sources or waste heat to preheat the saline water [
2]. However, the current cost of water production from desalination systems incorporated with renewable energy sources is generally higher compared to conventional desalination systems. For example, the cost of water desalination using reverse osmosis varies from 0.26 to 12.99 USD/m
3, while incorporating the photovoltaics into the reverse osmosis system increases the cost of desalination to 6.5–15.6 USD/m
3 [
2]. Furthermore, some desalination technologies, like reverse osmosis, require water pretreatment which involves adding chemicals into the feeding water. Consequently, the toxic chemicals are then present in the brine, which is usually discharged to the water reservoir, e.g., sea, and the chemicals can negatively affect the marine environment [
5]. Thermal desalination processes also impact the marine environment harmfully because the temperature of the brine discharged into the water reservoirs is usually 7–15 °C higher than the temperature of the water in the reservoir [
5]. Thus, due to increasingly limited drinking water resources, population growth, a necessity for reducing the consumption of fossil fuels and decreasing the negative impact on the environment, a cheap and energy-efficient water desalination technology is being sought. A technology that meets these requirements is passive solar distillation.
A working principle of passive solar still (SS) is as follows. Saline water is poured into the tight enclosure, and the enclosure is covered with a cover usually made of glass. Solar irradiance passes through the cover and heats the water which evaporates. Then, the water vapor condenses on the cover and flows through the distillate channel to the external distillate tank. As salt is a non-volatile compound, it remains at the still’s basin, and the distilled water is purified. Hanson et al. [
6] investigated the quality of water from a solar still and found that the salinity, total hardness as well as nitrate, and fluoride concentration of the distillate decreased compared to feed water. The removal efficiency of the still was 99%. Additionally, the SS was also able to remove 99.9% of the bacteria from water.
Although SS is effective in purifying water, its major disadvantage is low productivity, usually not exceeding about 5 L/m
2/day [
7]. It should be noted that in some scientific papers, the SS’s productivity is given in kg/m
2/day. However, to unify the units and simplify the comparison of the literature review results presented in this section, the productivity in kg/m
2/day is converted to L/m
2/day with the assumption that the density of water is 1000 kg/m
3. The productivity of SS depends on climatic, design, and operational parameters [
8]. Thus, there are many different methods of improving the productivity of SS.
Regarding climatic conditions, such as solar irradiance, wind speed, and ambient air temperature [
8], solar irradiance has the greatest impact on the productivity of SS. The SS’s productivity increases with increasing incident solar radiation [
9]. Therefore, as much solar radiation as possible should fall on the water and absorber, and one of the key factors affecting it is the inclination angle of the cover. Solar stills have maximum annual productivity if the inclination angle of cover is equal to the latitude of a location where the still is working [
10]. However, when analyzing the productivity of SS in a monthly period, it is recommended to decrease, and increase the inclination angle of the cover during the summer, and winter months, respectively [
9,
11]. Additionally, an external reflector [
12] or Fresnel lens [
13] can be used to increase the incident solar radiation and improve the solar stills’ productivity.
SS may have various shapes, which also affects productivity. For example, Altarawneh et al. [
14] studied the productivity of single slope, double slope, and pyramidal-shaped SS. It was found that the productivity of single slope SS was greater than the productivity of the double slope and pyramidal-shaped SS. In the case of single slope SS, their geometric dimensions can be optimized to reach possibly high productivity, which was investigated by Feilizadeh et al. [
15]. They reported that extending the length of a still reduces a shadow from side walls. Furthermore, it was concluded that the width over length ratio should be about 0.4, and the height of the front wall was suggested to be 0.10 m to achieve maximum annual efficiency.
Regarding operational parameters, one of the crucial factors influencing the productivity of SS is a mass of water (or water depth) in a still. Thus, investigating the influence of a water mass on the productivity of SS is a subject of many scientific studies. Due to a large specific heat capacity of water, as the mass of water in a SS decrease, the maximum water temperature increases, which accelerates evaporation [
16]. On the other hand, as the mass of water increases, the overnight productivity, i.e., the productivity after sunset, also increases [
17,
18]. Thus, Raj and Manokar [
19] investigated experimentally the productivity of a SS for water depths ranging from 1 to 6 cm. The maximum productivity was obtained for 2 cm of water depth. A similar result was reported by Keshtkar et al. [
20], who investigated, using a computational fluid dynamics (CFD) simulation, the performance of a SS with a water depth of 1 cm, 2 cm, and 4 cm. It was concluded that the daily productivity for 2 cm of water depth was higher by 15.8% than the productivity for 1 cm and 4 cm of water depth. Agrawal et al. [
21] tested experimentally and theoretically the performance of a SS for water depth ranging from 2 to 10 cm. It was found that the water temperature, SS’s productivity, and energy efficiency decreased with increasing depth of water. The productivity, maximum water temperature, and energy efficiency were 4.26 L/m
2/day, 73 °C, and 41.99%, respectively, for a water depth of 2 cm, while for the water depth of 10 cm the values of the abovementioned parameters were 3.24 L/m
2/day, 62 °C, and 32.42%, respectively. As can be seen, finding an optimal mass of water is one of the most popular and easiest ways to increase the productivity of solar stills. However, there are also other methods of improving the SS performance, which include for example: using phase change materials [
22,
23,
24], nano-coating of condensing surface [
25], increasing the evaporating surface area by using a corrugated basin [
26] or wick materials [
27,
28].
Although experimental studies of SS are necessary and help understand the processes occurring in SS, they may be costly and time-consuming. Thus, mathematical modeling [
29] or CFD modeling [
30] is a good alternative to experimental studies, and several models have been proposed to predict the performance of a SS. The most popular and most commonly used is Dunkle’s model [
29]. The other models, also frequently used, are Chen [
29,
31], Clark [
29,
31], Malik [
31], Kumar and Tiwari [
32], Zheng et al. [
33], and Tsilingiris [
34] models. However, Sivakumar et al. [
35] compared the results obtained by using three mathematical models. It was found that the calculated SS’s productivity was 1.327 L/m
2/day, 1.109 L/m
2/day, and 1.231 L/m
2/day when Dunkle’s, Zheng et al.’s, and Tsilingiris’ models, respectively, were used. Thus, Dunkle’s and Tsilingiris’ models overestimated the productivity by about 20% and 11%, compared to Zheng et al.’s model. However, the theoretical results were not compared to the experimental ones. Similarly, Sivakumar and Sundaram [
16] reported that different mathematical models can underpredict, and overpredict the productivity of a SS even by 45%, and 60%, respectively, compared to the experimental results.
As can be seen, SS are a subject of many scientific experimental, as well as theoretical studies. However, in the case of experimental studies, the tests are usually carried out over several consecutive days, e.g., SS with 1 cm of water depth is investigated the first day, 2 cm of water depth is investigated the second day, etc. As a result, climatic conditions, i.e., solar irradiance, ambient air temperature, and wind speed, may vary during these days, which may influence the results of the tests. Therefore, Kalbasi and Esfahani [
36], and Kalbasi et al. [
37] investigated the performance of a SS under laboratory conditions, where the electric heater was used as a heat source to simulate solar radiation. The first series of tests were carried out for 1 cm of water depth and three constant input power, i.e., 200 W/m
2, 500 W/m
2, and 800 W/m
2, for which the daily productivity was 4.25 L/m
2/day, 14.3 L/m
2/day, and 24.56 L/m
2/day, respectively. The second series of experiments were conducted for the input power of 200 W/m
2 and water depth of 1 cm, 2 cm, and 3 cm, for which the productivity of SS was 4.25 L/m
2/day, 3.96 L/m
2/day, and 3.63 L/m
2/day, respectively.
Based on the literature review presented, there is a lack of studies conducted under controlled laboratory conditions in which the effect of water mass on the SS performance at different transient solar irradiance is tested. Furthermore, the mathematical models available in the open literature may significantly overpredict or underpredict the solar stills’ productivity. Therefore, this paper proposes a mathematical model which allows predicting the performance of a SS. The model is validated experimentally and the results of the theoretical calculations are in good agreement with the results of the experimental tests. Furthermore, to the best of the authors’ knowledge, this is the first time that the experimental studies are conducted in laboratory conditions under three different and time-varying solar irradiance and three different masses of water in the SS.
3. Mathematical Model
As mentioned in the Introduction, numerous mathematical models allow predicting the performance of solar stills but they can significantly overestimate the productivity. Therefore, in the first stage of this study, Dunkle’s, Zheng et al.’s, and Tsilingiris’ models were used to predict the performance of investigated solar still and the results of mathematical modeling were compared with the experimental ones. The equations proposed by Dunkle, Zheng et al., and Tsilingiris are described in detail elsewhere in the literature [
29,
33,
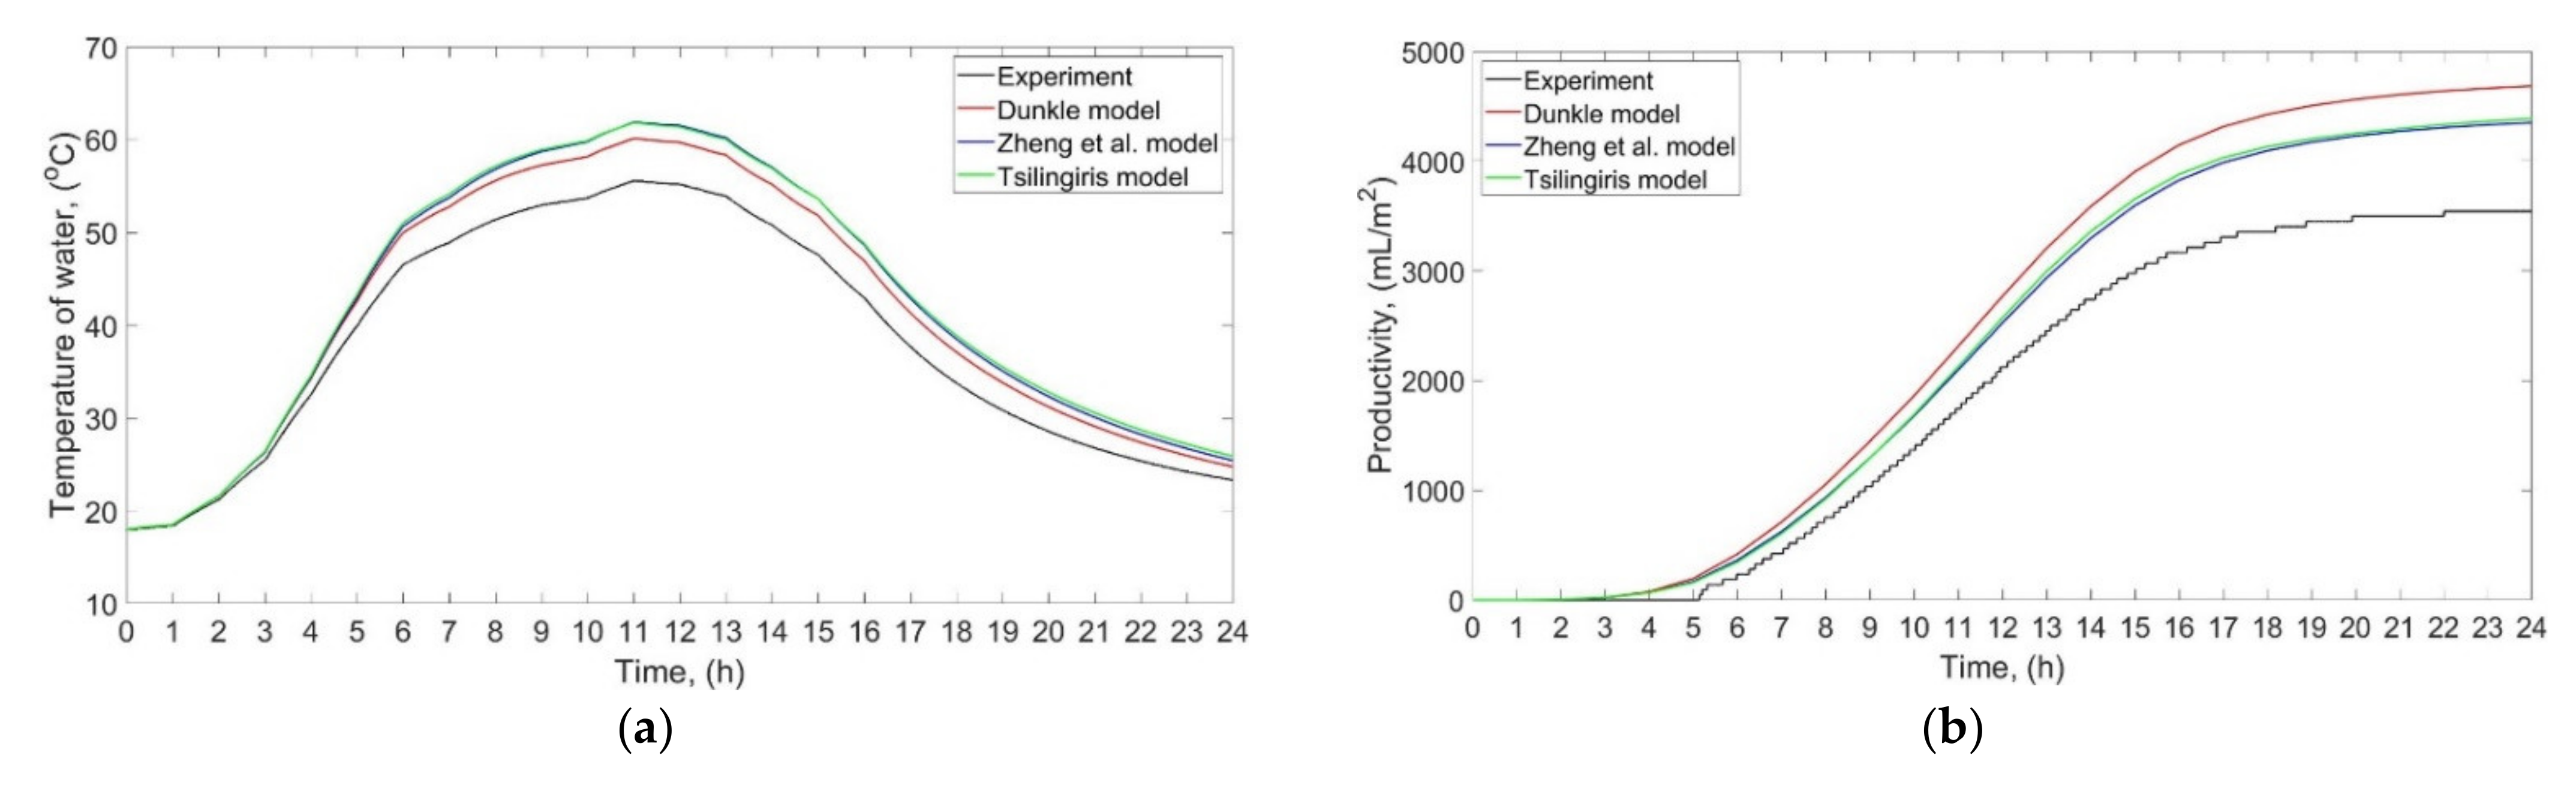
34]. The results of calculations using the abovementioned models were compared with the results of experiments. The comparison between the selected results of theoretical calculations and experimental studies is shown in
Figure 4.
As can be seen, the results of Dunkle’s, Zheng et al.’s, and Tsilingiris’ model are not consistent with the results of the experiment. The models overestimate the temperature of the water and the productivity. Although only one comparison for selected results is presented in this paper, the authors compared the theoretical results with all experiments. It was found that Dunkle’s, Zheng et al.’s, and Tsilingiris’ model overestimate the daily productivity by 32–45%, 22–32%, and 21–37%, respectively, depending on the water mass and the power of the electric heaters. Therefore, the models from various literature were tuned and adjusted to create a new mathematical model that provides better agreement with experimental results.
A mathematical model was established to investigate theoretically the performance of SS. Energy balance equations for the basin, water, inner and outer surface of the glass cover were created and solved using MATLAB software, version 9.8 (R2020a). In order to simplify the model, the following assumptions were made:
There was no temperature gradient in the water mass;
The mass of water was constant;
The thermophysical properties of water and air–water vapor mixture were variable in a function of temperature, while the thermophysical properties of the basin and glass cover were assumed to be constant;
The specific heat capacity of the insulating material was neglected;
Heat conduction from the basin to the side walls above the free surface of the water was neglected;
The SS was assumed to be a lumped system and worked in quasi-steady-state conditions with a 60 s time step Δt;
The glass cover was divided into two parts: inner and outer, with equal masses;
The temperature gradient between the inner and outer glass cover was taken into account;
The water and inner glass cover surfaces were assumed to be infinitely long and parallel;
The air–water vapor mixture between the water and inner glass cover surface did not affect and participate in the radiation heat transfer;
The relative humidity of the air–water vapor mixture was 100% and its total pressure pt was 101,300 Pa.
The energy balance equations for the basin, water, inner glass cover, and outer glass cover are written in Equations (1)–(4), respectively.
where
ah−b is the ratio of heat transferred to the basin to the total power of the electric heater
. In order to determine the value of
ah−b, a series of simulations was performed. It was found that the differences between the results for various values of
ah−b were negligibly small. Thus, the mean value was finally used for the calculations, i.e., it was assumed that
ah−b = 0.5. It should be noted that in the energy balance equation for the basin (Equation (1)), the surface area and the mass of the basin were calculated taking into account the bottom surface area and the surface area of the side walls up to the level of the free surface of the water. Thus, the values of the
Ab and
mb changed depending on the mass of the water (water depth).
where
Tsky is the temperature of the sky, but as the experiments were performed in a laboratory, it was assumed that
Tsky = Tair. To the best of the authors’ knowledge, this is the first time when the energy balance equation for water takes into account the energy losses
. The sources and assumptions regarding this energy loses are discussed in detail later in this section.
The overall heat transfer coefficient between the basin and ambient air was calculated as [
29]:
The convective heat transfer coefficient between the basin and water is given in Equation (6) [
38,
39]:
where Nusselt number
was calculated as follows [
38,
39]:
Additionally, to simplify the calculations, the formula in Equation (7) was used even if the Rayleigh number
Raw exceeded the range given above. Rayleigh number is given by [
38,
39]:
The thermophysical properties of water, i.e.,
βw,
ρw,
μw, and
Prw, were taken from [
40]. The radiation heat transfer coefficient between the water and the inner glass cover was calculated according to Equation (9) [
41]:
The convective heat transfer coefficient between the water and the inner glass cover was calculated as follows [
42]:
The differences between the proposed method of calculating the hc,w-gi and the other methods available in the literature are as follows. In Equation (10), the characteristic length of the solar still is taken into account, which Dunkle’s model does not account for. Moreover, the multiplier and exponent of the Rayleigh number are dependent on the Grashof number, which is not considered in Zheng et al.’s and Tsilingiris’ model. Zheng et al. proposed using constant values of the multiplier (0.2) and exponent (0.26). Therefore, those parameters, i.e., the multiplier and exponent of the Rayleigh number, can be tuned to achieve better agreement between the results of simulations and experiments.
Grashof and Rayleigh numbers for air–water vapor mixture (
Grf and
Raf, respectively) were calculated as in Equations (11) and (12), respectively [
38,
39]:
The proposed way of calculating the Grashof number differs from that proposed by Tsilingiris [
34] and Zheng et al. [
33]. In Equation (11), the Grashof number was calculated using the density of saturated air–water vapor mixture at the glass and water temperatures, and those densities can be calculated using simple correlations [
43,
44]. Therefore, this method of calculating the Grashof number is much simpler than the method proposed by Tsilingiris [
34] and Zheng et al. [
33].
In Equations (11) and (12), all thermophysical properties of air–water vapor mixture, i.e.,
ρf,Tgi,
ρf,Tw,
ρf,
μf,
cpf, and
λf, were calculated from expressions presented in the works [
43,
44]. The calculations were performed for the average temperature of the water and glass cover and the assumption that the relative humidity and the total pressure were 100% and 101,300 Pa, respectively.
The radiation heat transfer coefficient between the outer glass cover and the sky was calculated as [
41]:
The convective heat transfer coefficient between the outer glass cover and the ambient air takes into account only natural convection because the experiments were carried out in a laboratory, and there was no wind. Therefore, the coefficient
hc,go-air was calculated from Equation (14) [
45]:
The mass flow rate of the evaporated water can be written as [
38]:
Assuming that the water vapor is an ideal gas, one can obtain:
where
pw and
pgi are the partial water vapor pressure at the water and inner glass cover temperature, respectively, and were calculated as follows [
29]:
The mass transfer coefficient
hmass was calculated using the Chilton–Colburn analogy [
38,
39]:
where the binary diffusion coefficient of water vapor in air
Dwa was calculated as [
38]:
Equation (15) presents the total mass flow rate of the evaporated water. However, some phenomena were observed while conducting the experiments, such as:
Additionally, not all of the evaporated water condenses on the glass cover due to the following reasons:
Any leakages in the SS, e.g., possible steam leakage through the gasket between the cover and the enclosure as well as through the distillate channel;
A part of the water vapor is used to raise and maintain the relative humidity of the humid air to 100%.
As a result, a design parameter that takes into account the occurrence of the abovementioned phenomena has been introduced and therefore it was assumed that 75% of the evaporated water
condenses on the glass cover and flows into the distillate tank, while 25% of the evaporated water is lost due to the abovementioned condensation on the sidewalls, leakages, etc. Therefore, the mass flow rate of water vapor condensed on the glass cover
, and the water vapor lost
were calculated as in Equations (21) and (22), respectively.
Nevertheless, the design parameter, i.e., the assumption that only 75% of the evaporated water is collected in the distillate tank, was estimated based on the observations of the experiments. Hence, the value of this parameter can be adjusted depending on the SS’s construction to obtain better agreement between the results of simulations and experimental studies.
The productivity of the SS during the time step Δ
t = 60 s was calculated as:
The overall energy efficiency was obtained using Equation (24):
Equations (1)–(24) were implemented in MATLAB software and Equations (1)–(4) were solved numerically using the ode45 function. As a result, the temperature of the basin, water, inner and outer glass cover were obtained, which allowed calculating the productivity and total efficiency, as well as heat transfer coefficients for the next time step. The input parameters used for calculation, which changed depending on the experiment, were: mass of water, initial temperatures of water, basin, inner and outer glass cover, power of the electric heater, and ambient air temperature. The thermophysical properties of water and air–water vapor mixture, as well as heat transfer coefficients, were calculated for each time step as a function of the temperature of the individual elements. Additionally, the remaining constant input parameters are summarized in
Table 2.
The presented model is based on simple heat and mass transfer balance equations, which allow calculating quickly the performance of a solar still. Compared to the other mathematical models available in the open literature, this model takes into account that not all of the evaporated water condenses on the cover and flows into the distillate tank. Additionally, the major advantage of this model over the other models from literature is that this model applies to a wide range of solar irradiance.
4. Results and Discussion
4.1. Effect of Water Mass and Low Solar Irradiance on the Performance of the Solar Still
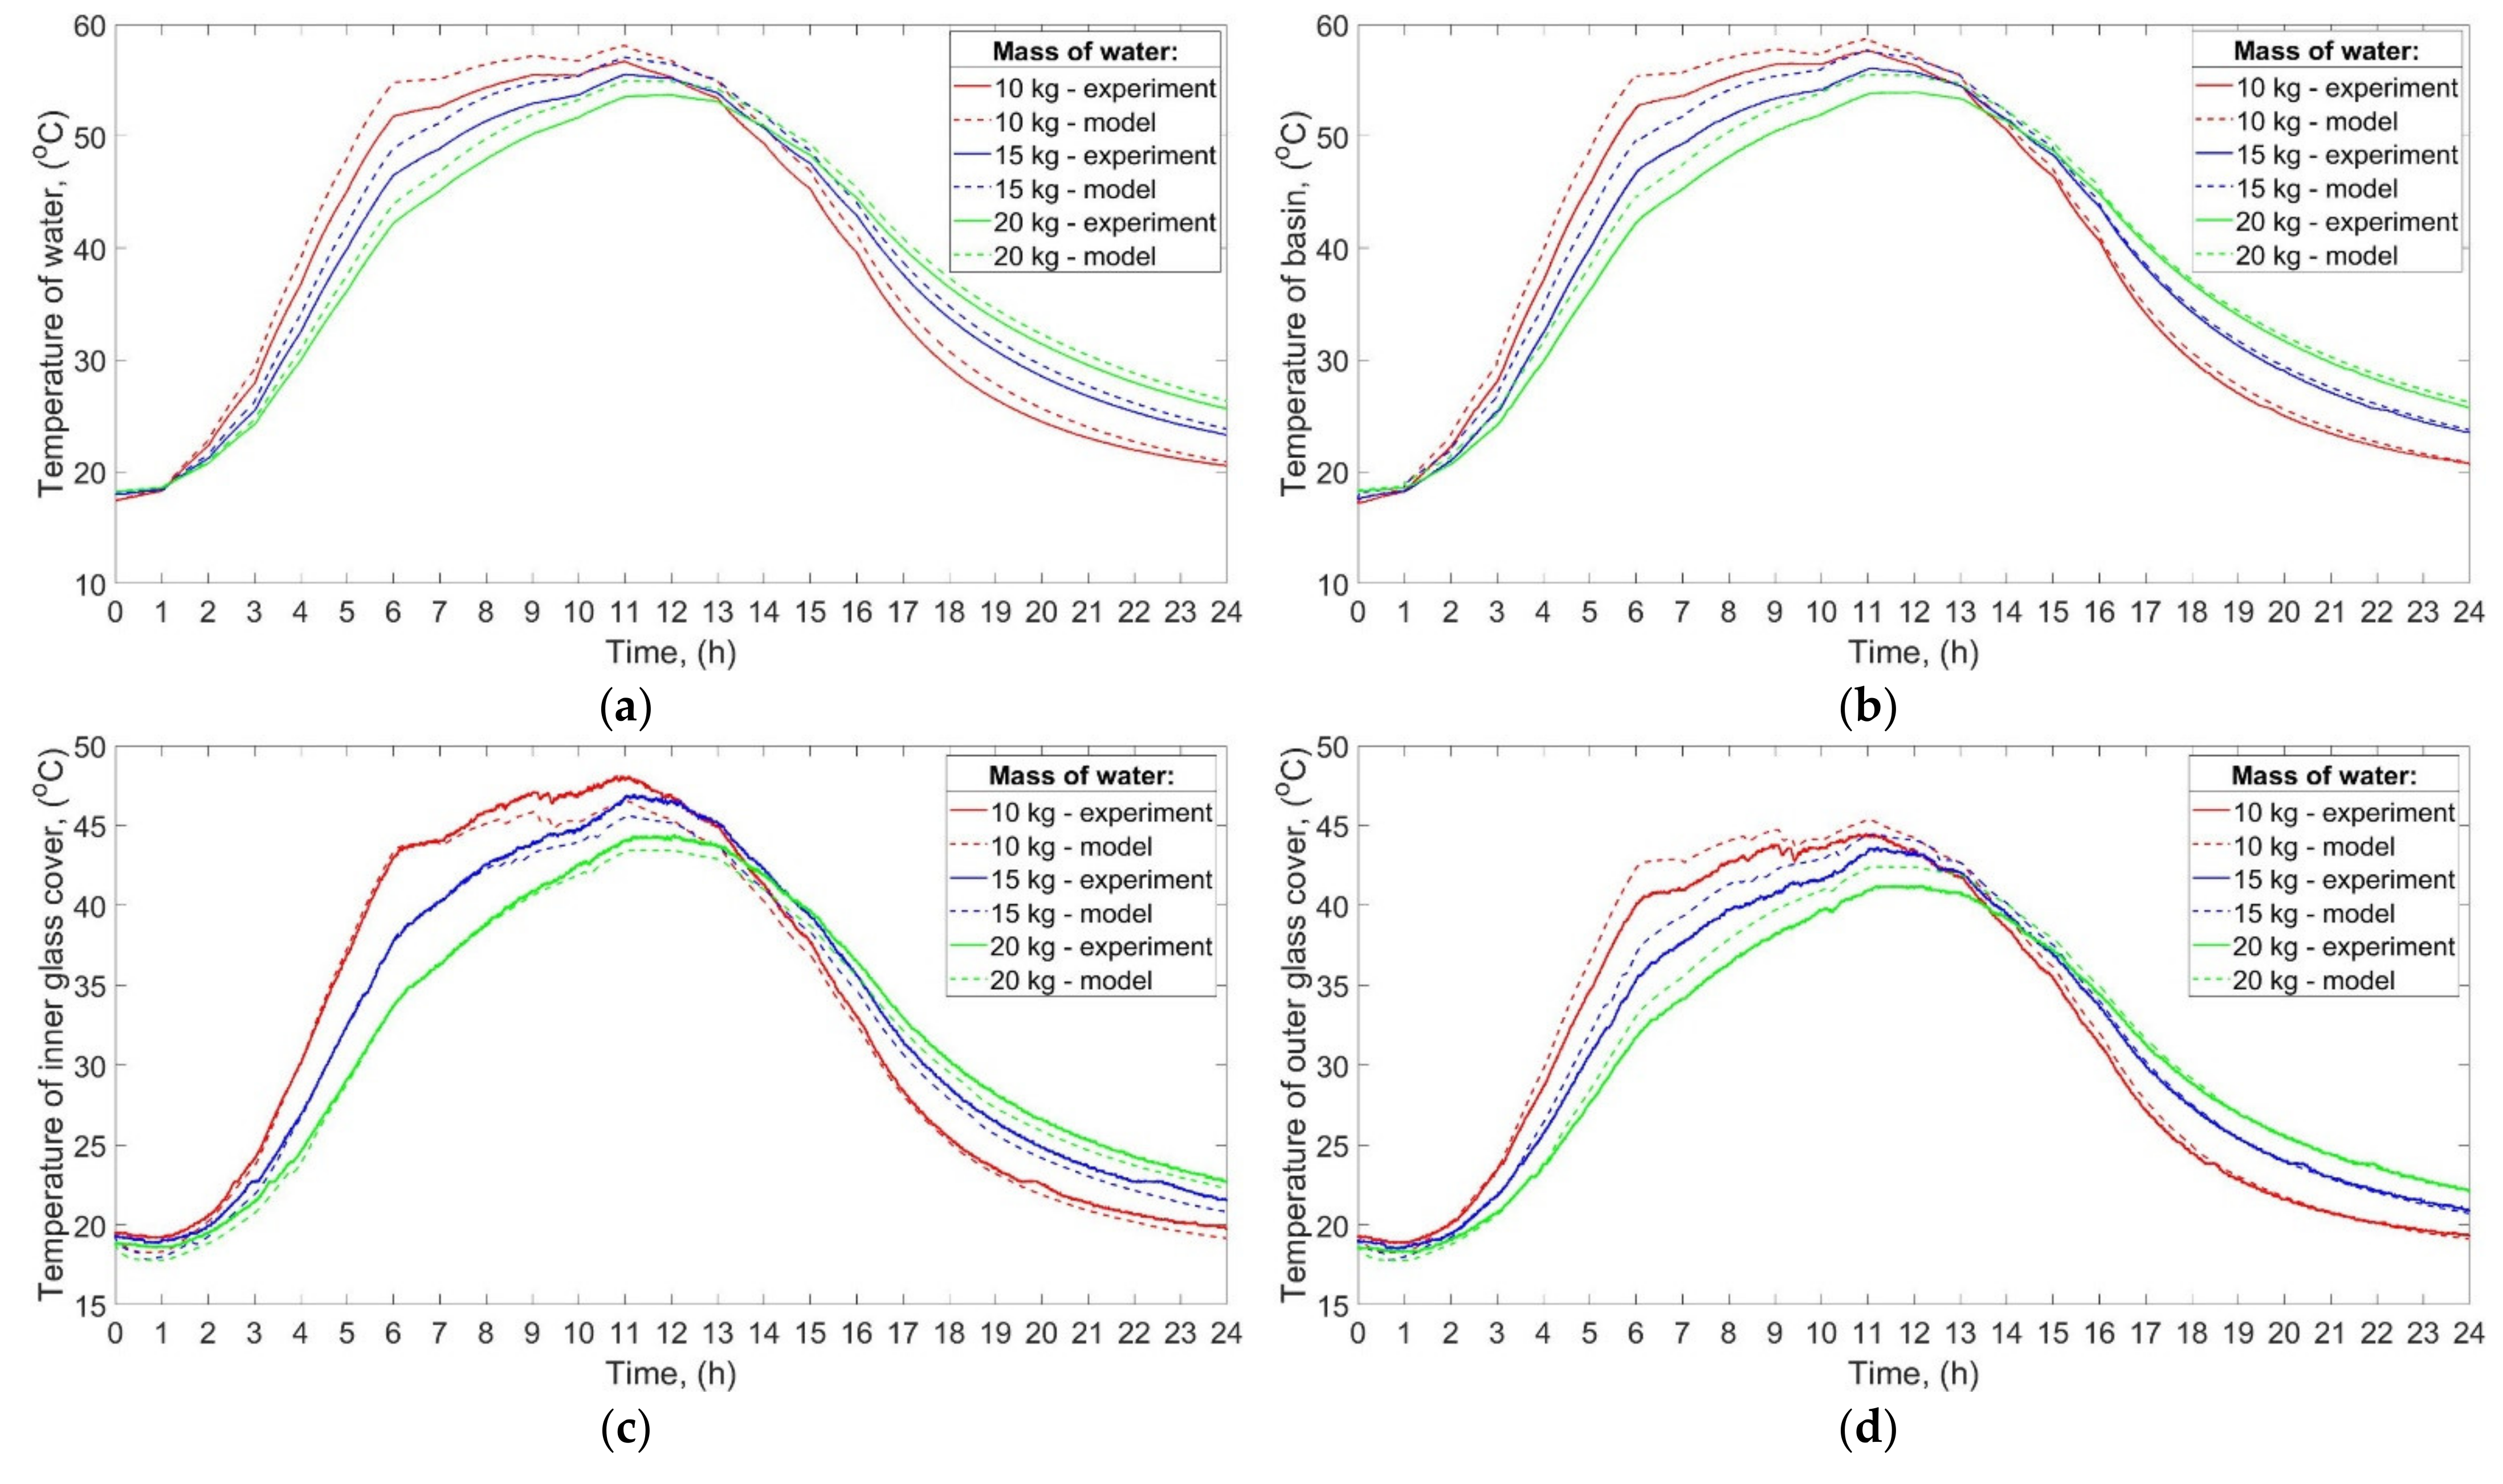
The temperatures of water, basin, inner glass cover, and outer glass cover in the function of time obtained experimentally and theoretically are shown in
Figure 5a–d, respectively.
It can be seen from the experimental results that the maximum temperature of the water, basin, and glass was increasing with decreasing mass of water. The maximum temperature of the water was 43.8 °C, 39.6 °C, and 38.0 °C when the mass of water was 10 kg, 15 kg, and 20 kg, respectively. It is also evident that the temperatures of the abovementioned elements, i.e., water, basin, and glass, increased and decreased faster for the low mass of water. Such a phenomenon is a result of a large specific heat capacity of water. Additionally, the final temperatures of water, basin, and glass were higher than their initial temperatures. For example, the initial and final temperature of the water was 17.8 °C and 20.7 °C, respectively, for 10 kg of water. Such a result can be attributed to the fact that the heat supplied to the abovementioned elements was greater than the heat lost to the environment. Consequently, the excess heat input was used to raise the temperature of the water, basin, and glass.
As can be seen from
Figure 5, the values of the temperatures achieved by the theoretical calculations are in good agreement with the experimental ones. For example, the maximum difference between the temperature of water obtained theoretically and experimentally was 2.8 °C and it was achieved for 10 kg of water. Generally, the temperatures of water, basin, and outer glass cover obtained from the theoretical calculations were higher than those achieved from experiments, while the temperature of the inner glass cover was slightly lower. Additionally, the greater the mass of water, the more consistent experimental and theoretical results were. For example, the maximum difference between the temperature of water obtained theoretically and experimentally for 15 kg, and 20 kg of water was 1.7 °C, and 0.8 °C, respectively.
The abovementioned findings can be attributed to several reasons, including the simplifying assumptions discussed at the beginning of
Section 3. Nevertheless, there are also other possible reasons explaining the differences between the results of calculations and experiments. Firstly, the mathematical model did not take into account a probable additional heat transfer from the basin to the side walls by conduction. The heat might be conducted from the basin to the side walls, which resulted in a greater heat transfer surface area. Therefore, the real heat losses from the basin, and thus from the water to the ambient air were probably higher than the predicted ones. Additionally, the electric heaters possessed some thermal inertia, which means that even if their power was reduced or turned off, they possibly continued to transfer their stored sensible heat to the basin and water. Another possible explanation may be that the heat transfer coefficient, and thus the heat losses, from the basin to ambient air were calculated from the simplified formula (Equation (5)), which did not include the temperature difference between the basin and ambient air. As commonly known, the temperature difference between a surface and a flowing fluid affects the values of some characteristic numbers, i.e., Rayleigh and Nusselt numbers, which in turn affects the convective heat transfer coefficient and thus heat losses. Furthermore, the properties of the ambient air, including relative humidity, thermal conductivity, etc., also impact the heat transfer coefficient and heat losses from the basin and glass cover to the ambient air. In addition, it was assumed that the properties of the basin and the glass cover (specific heat capacity, thermal conductivity, etc.) were constant and independent of temperature. In fact, the abovementioned properties change with temperature, which could also influence the results of calculations. Additionally, differences between the theoretical and experimental results may be caused by the fact that the assumptions made, and certain mathematical formulas used during the calculations might be closer to the reality when, for example, the mass of water was greater, or the power of the electric heater was higher, which will be shown in next sections. For example, the convective heat transfer coefficients
hc,w-gi, and
hc,b-w depended on certain constant and exponent, which in turn depended on Rayleigh and Grashof numbers (see Equations (7) and (10)).
The total energy efficiency of the SS, achieved during the experimental studies, was 32%, 29, and 26% for 10 kg, 15 kg, and 20 kg of water, respectively. Similar results were obtained by theoretical calculations—the total energy efficiency was 34%, 30%, and 27% for 10 kg, 15 kg, and 20 kg of water, respectively.
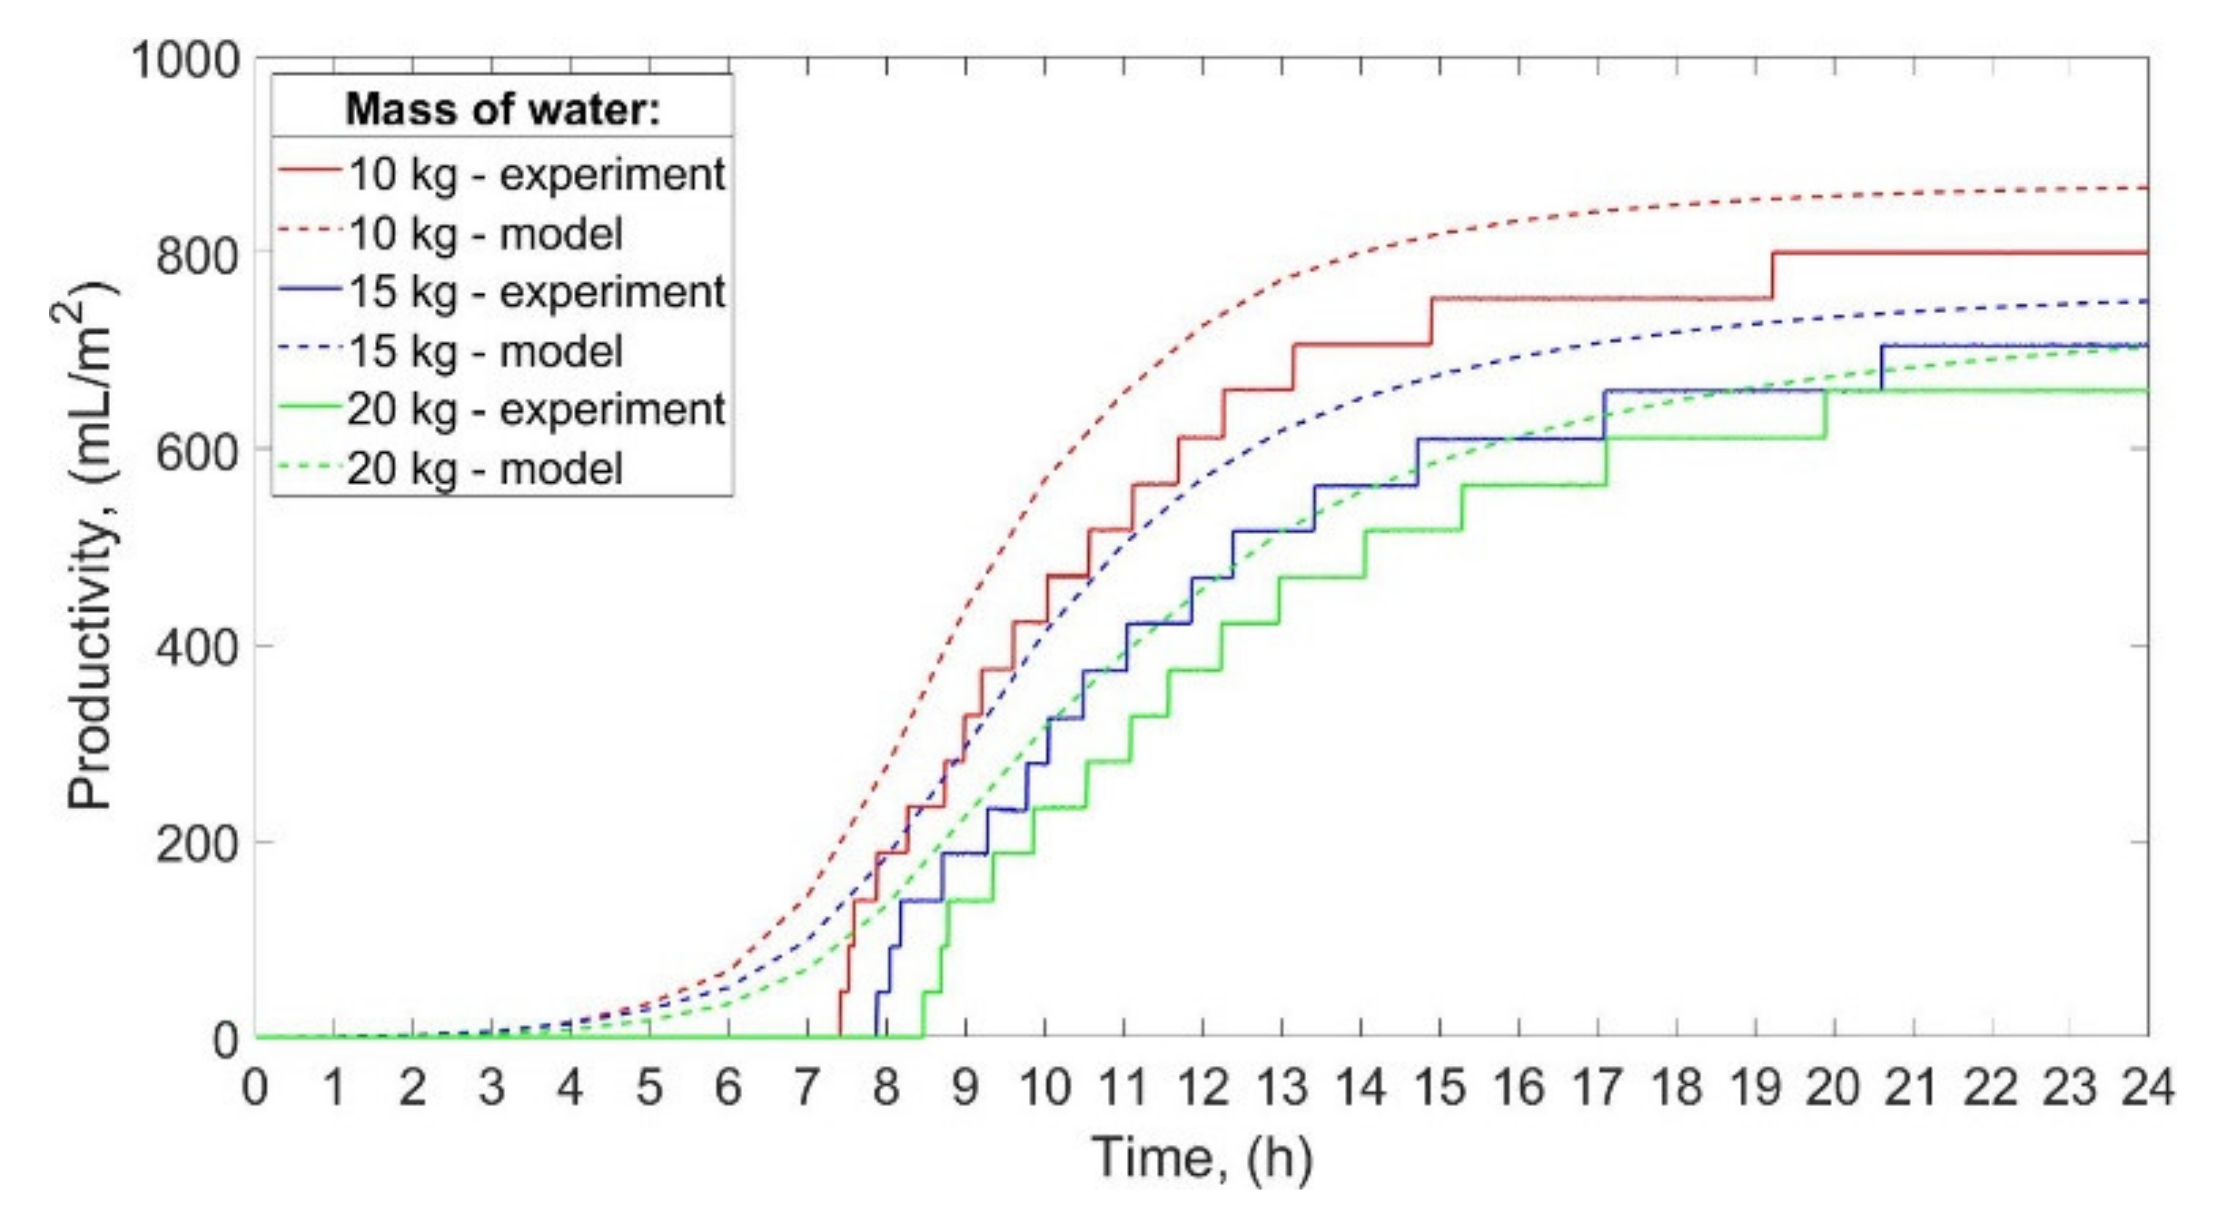
The productivity of the SS for low power of the electric heaters is shown in
Figure 6.
The total productivity of the still was 800 mL/m
2/day, 706 mL/m
2/day, and 658 mL/m
2/day for 10 kg, 15 kg, and 20 kg of water. Thus, when the mass of water decreased from 20 to 15 kg, and from 20 to 10 kg, the productivity increased by 7.3%, and 21.6%, respectively. Furthermore, the smaller the mass of the water, the earlier the condensate occurred in the distillate tank. The condensate started to accumulate in the distillate tank after 7 h 25 min, 7 h 53 min, and 8 h 28 min from the start of working for 10 kg, 15 kg, and 20 kg of water, respectively. Nevertheless, the total operating time of the SS, calculated as the difference between the last and the first observed increase in the condensate volume, was 11 h 49 min, 12 h 44 min, and 11 h 26 min for 10 kg, 15 kg, and 20 kg of water, respectively. As can be seen from
Figure 6, the results achieved by the theoretical calculations are in good agreement with the experimental ones. The productivity of the SS calculated theoretically was greater than the productivity obtained experimentally by 8.3%, 6.2%, and 7.0% for 10 kg, 15 kg, and 20 kg of water, respectively. These differences between the theoretical and experimental productivity can be a consequence of the electric heaters’ thermal inertia mentioned earlier in this section. Additionally, as discussed earlier, the temperature of the water achieved from calculations was greater than the temperature from the experiments, while the temperature of the inner glass cover obtained from calculations and experiments was similar. Therefore, the difference between the water’s and inner glass cover’s temperatures obtained theoretically was higher than those obtained experimentally. The water and inner glass cover temperature difference is the main factor that affects the rate of water evaporation, i.e., the greater the temperature difference, the greater the rate of water evaporation, which may explain the discrepancies between the theoretical and actual productivity of the SS.
4.2. Effect of Water Mass and Medium Solar Irradiance on the Performance of the Solar Still
Figure 7a–d presents the temperature of the water, basin, inner glass cover, and outer glass cover, respectively, achieved both, experimentally and theoretically. The theoretical results are in good agreement with the experimental results.
The maximum difference between the theoretical and experimental temperature of the water was 2.1 °C, 1.3 °C, and 1.9 °C, and it was achieved for 10, 15 kg, and 20 kg of water, respectively. Similarly like in the case of the low solar irradiance, the temperatures of water, basin, and outer glass cover obtained from the theoretical calculations were higher than those achieved from experiments, while the temperature of the inner glass cover was slightly lower. Possible reasons explaining the differences between the theoretical and experimental results are discussed in detail in
Section 4.1.
The maximum temperature of water, basin, and glass increased with decreasing mass of water. For example, the maximum temperature of the water was 56.7 °C, 55.6 °C, and 53.7 °C for 10 kg, 15 kg, and 20 kg of water, respectively. Additionally, the temperatures of the abovementioned elements increased and decreased faster for the lower mass of the water, which, as mentioned earlier, was caused by a large specific heat capacity of water. The fact that the heat supplied to the system was greater than the heat losses was the reason that the final temperatures of water, basin, and glass were higher than their initial temperatures. For example, the initial, and final temperature of the water was 17.4 °C, and 20.6 °C, respectively, for 10 kg of water. Furthermore, the differences between the final and initial temperatures increased with the increasing mass of the water.
According to the experimental results, the total energy efficiency of the SS was 48%, 46%, and 43% for 10 kg, 15 kg, and 20 kg of the water, respectively. Furthermore, the total energy efficiency calculated theoretically was 46%, 43%, and 40% for 10 kg, 15 kg, and 20 kg of water. Therefore, the results obtained theoretically are in good agreement with the results obtained experimentally, which is additionally confirmed by the experimental and theoretical productivity of the SS shown in
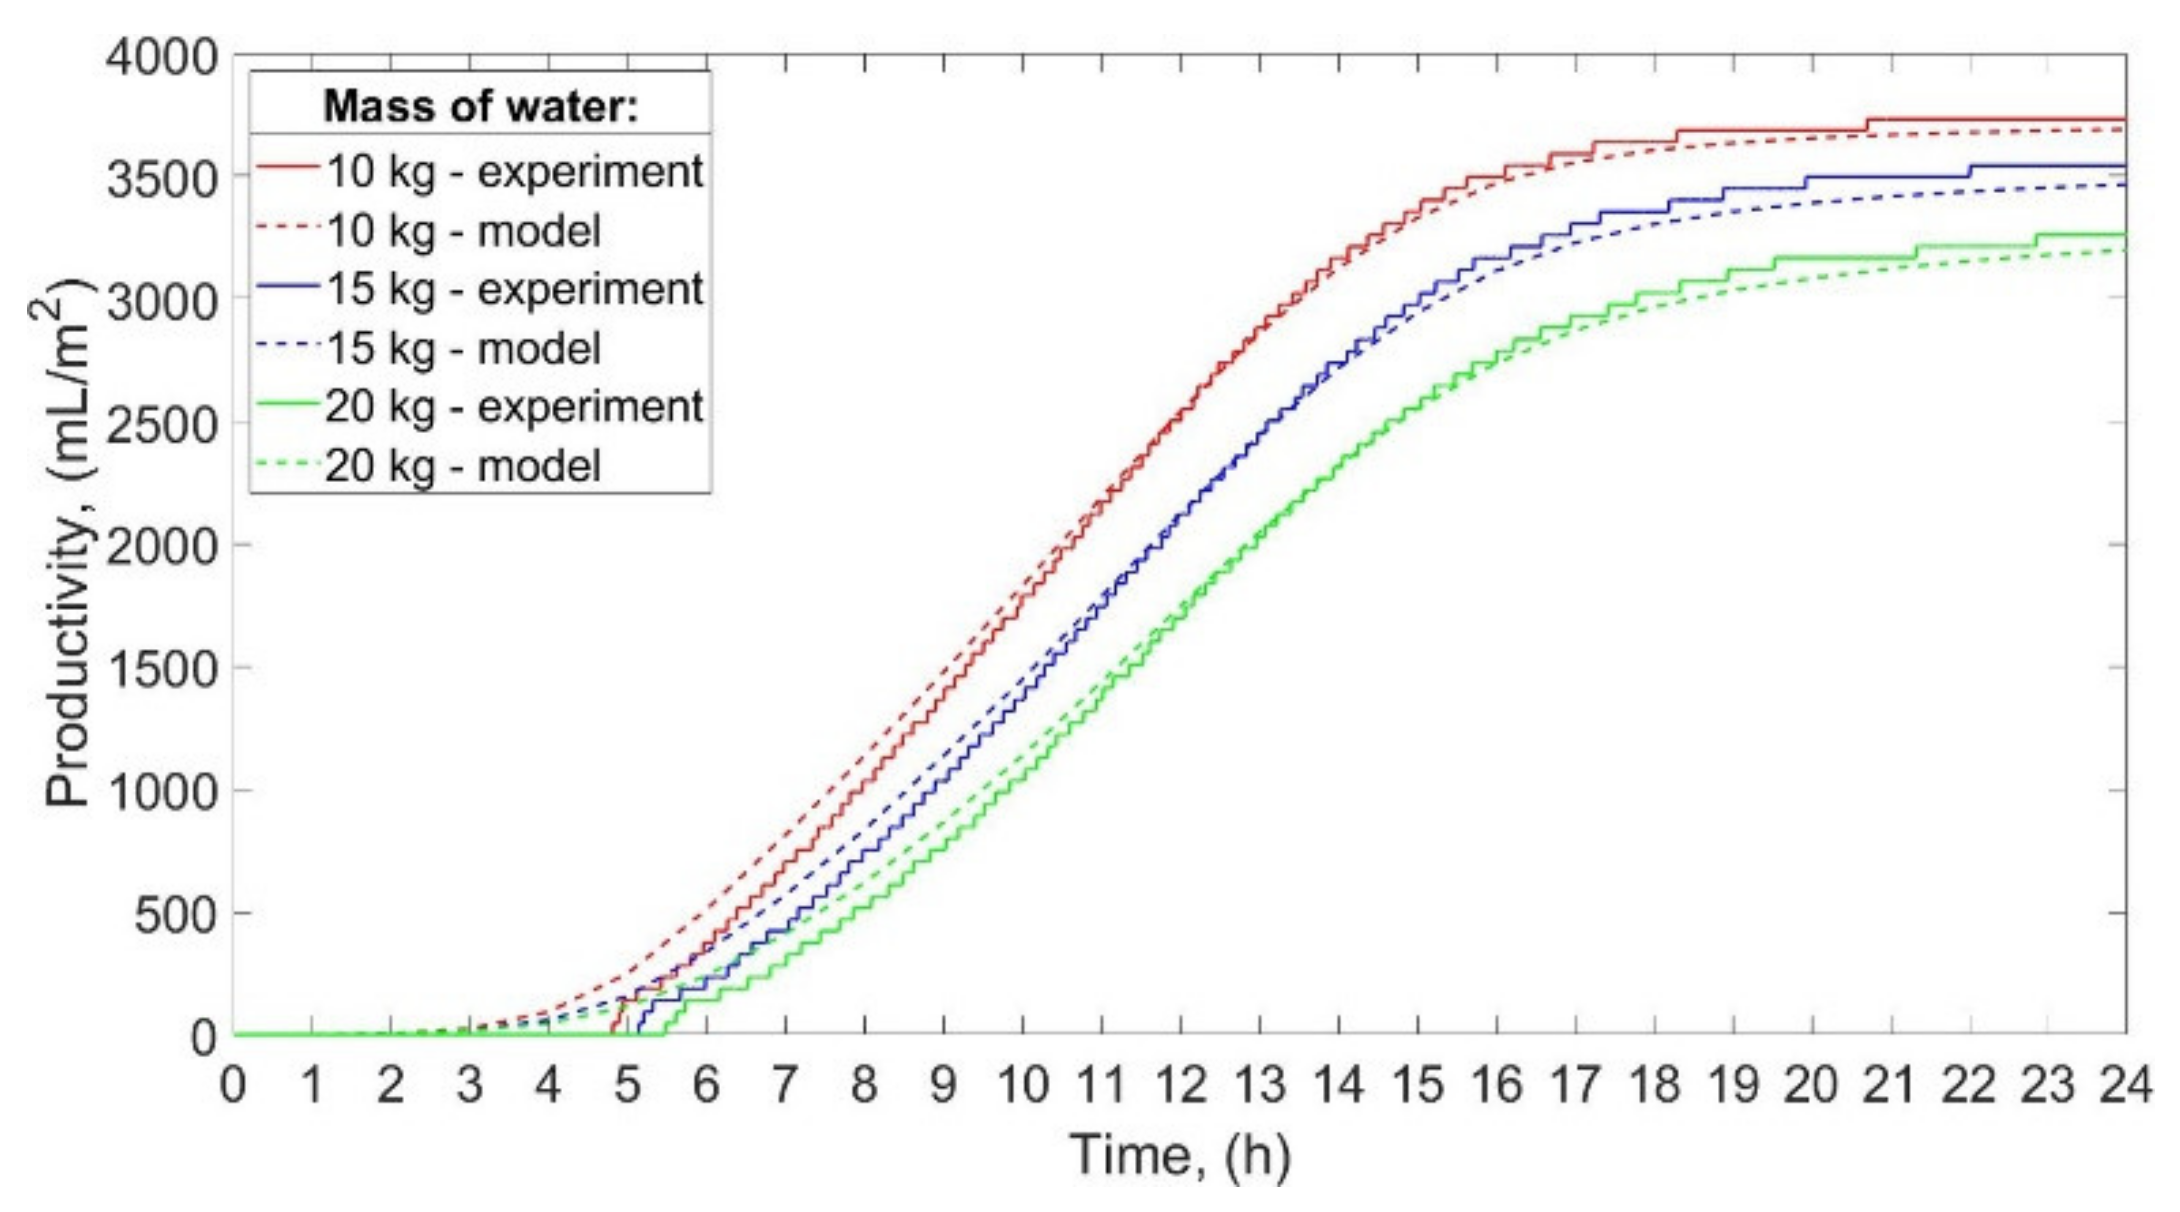
Figure 8.
The experimental productivity of the SS increased with decreasing mass of water. For 10 kg, 15 kg, and 20 kg of water, the total productivity was 3732 mL/m
2/day, 3542 mL/m
2/day, and 3260 mL/m
2/day, respectively. The theoretical calculations slightly underestimated the productivity, because the calculated values of the productivity were lower by 1.1%, 2.2%, and 1.9% for 10 kg, 15 kg, and 20 kg of water, respectively, compared to the experimental productivity. Comparing these results to the results reported for low solar irradiance, it is clear that the proposed mathematical model overpredicts and underpredicts the productivity for low and medium solar irradiance, respectively. Additionally, the theoretical results for medium solar irradiance are more consistent with the experiments than the results for low solar irradiance. A possible explanation of the observed discrepancies might be that, as explained in
Section 4.1., certain assumptions and mathematical formulas used during the calculations might be more suitable for the higher solar irradiance.
Decreasing the mass of water from 20 to 15 kg, and from 20 to 10 kg improved productivity by 8.7%, and 14.5%, respectively. Additionally, if the mass of water was lower, the condensate began to accumulate in the distillate tank earlier, however, the total operating time of the still was shorter. The condensate began to accumulate in the distillate tank after 4 h 49 min, 5h 9 min, and 5 h 29 min from the start of working for 10 kg, 15 kg, and 20 kg of water, respectively. The total operating time of the still was 15 h 54 min, 16 h 52 min, and 17 h 22 min for 10 kg, 15 kg, and 20 kg of water, respectively.
4.3. Effect of Water Mass and High Solar Irradiance on the Performance of the Solar Still
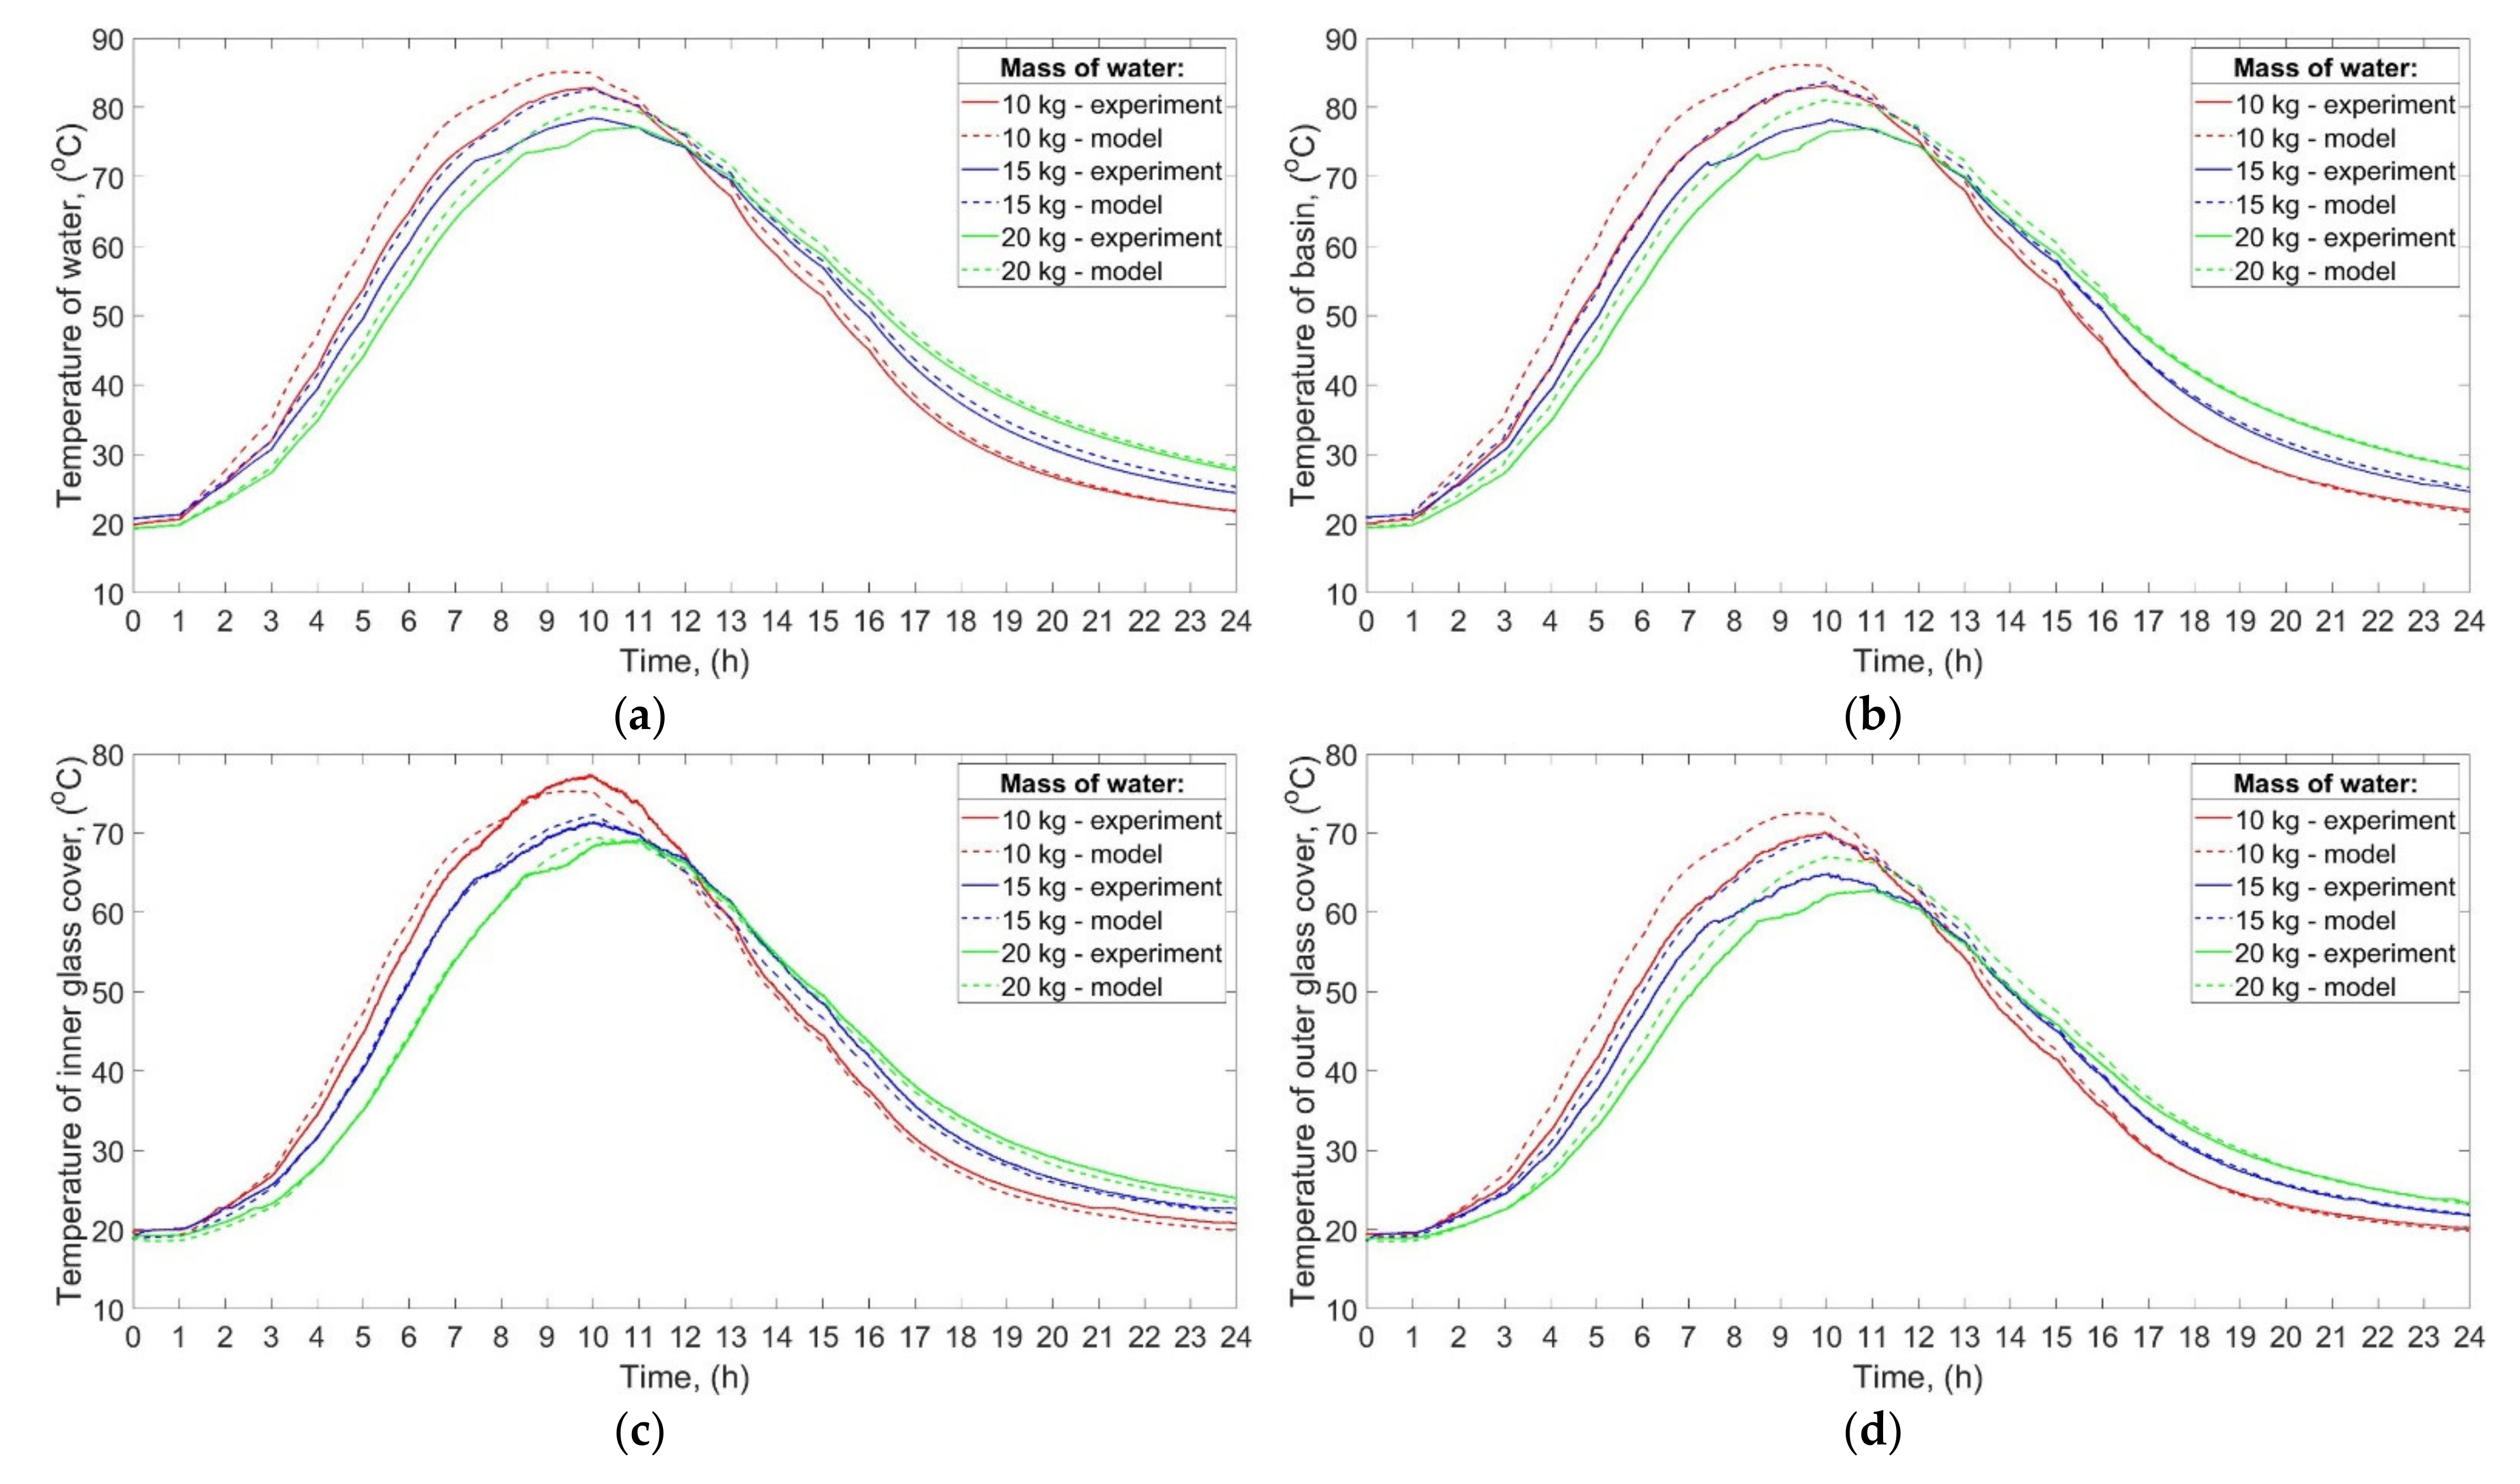
The temperatures of water, basin, inner glass cover, and outer glass cover in the function of time for high power of the electric heaters are shown in
Figure 9a–d, respectively.
Figure 9 presents the temperatures obtained both experimentally and theoretically, and the theoretical results are in good agreement with the experimental ones. The maximum difference between the temperature of water achieved experimentally and theoretically was 6.0 °C (10 kg of water), 4.3 °C (15 kg of water), and 4.5 °C (20 kg of water), which is greater than in the case of low and medium solar irradiance. A possible explanation for such a result might be that, as discussed in detail in
Section 4.1., the actual heat losses were probably greater than the predicted ones. The temperatures of the water, basin, and glass cover were up to about 80 °C for high solar irradiance, so the temperature differences between the components of the SS and the ambient air were large. As a result, underestimating the heat transfer coefficients or heat transfer surface area could cause underestimation of heat losses, which in turn caused the temperatures of water, basin, and glass to rise excessively.
The maximum temperature of the water, basin, and glass cover increased with decreasing mass of water. Additionally, the temperatures increased and decreased faster for a lower mass of the water due to a large specific heat capacity of water. Taking into account the experimental results, the maximum temperature of the water was 82.9 °C, 78.5 °C, and 77.1 °C for 10 kg, 15 kg, and 20 kg of water, respectively. Furthermore, the final temperatures of the water, basin, and glass were greater than their initial temperatures, e.g., for 10 kg of water, the initial, and final temperature of the water was 19.8 °C, and 21.9 °C, respectively.
For the high power of the electric heaters and 10 kg, 15 kg, and 20 kg of water, the total experimental energy efficiency was 63%, 61%, and 57%, respectively, while for the theoretical calculations it was 57%, 55%, and 52%, respectively.
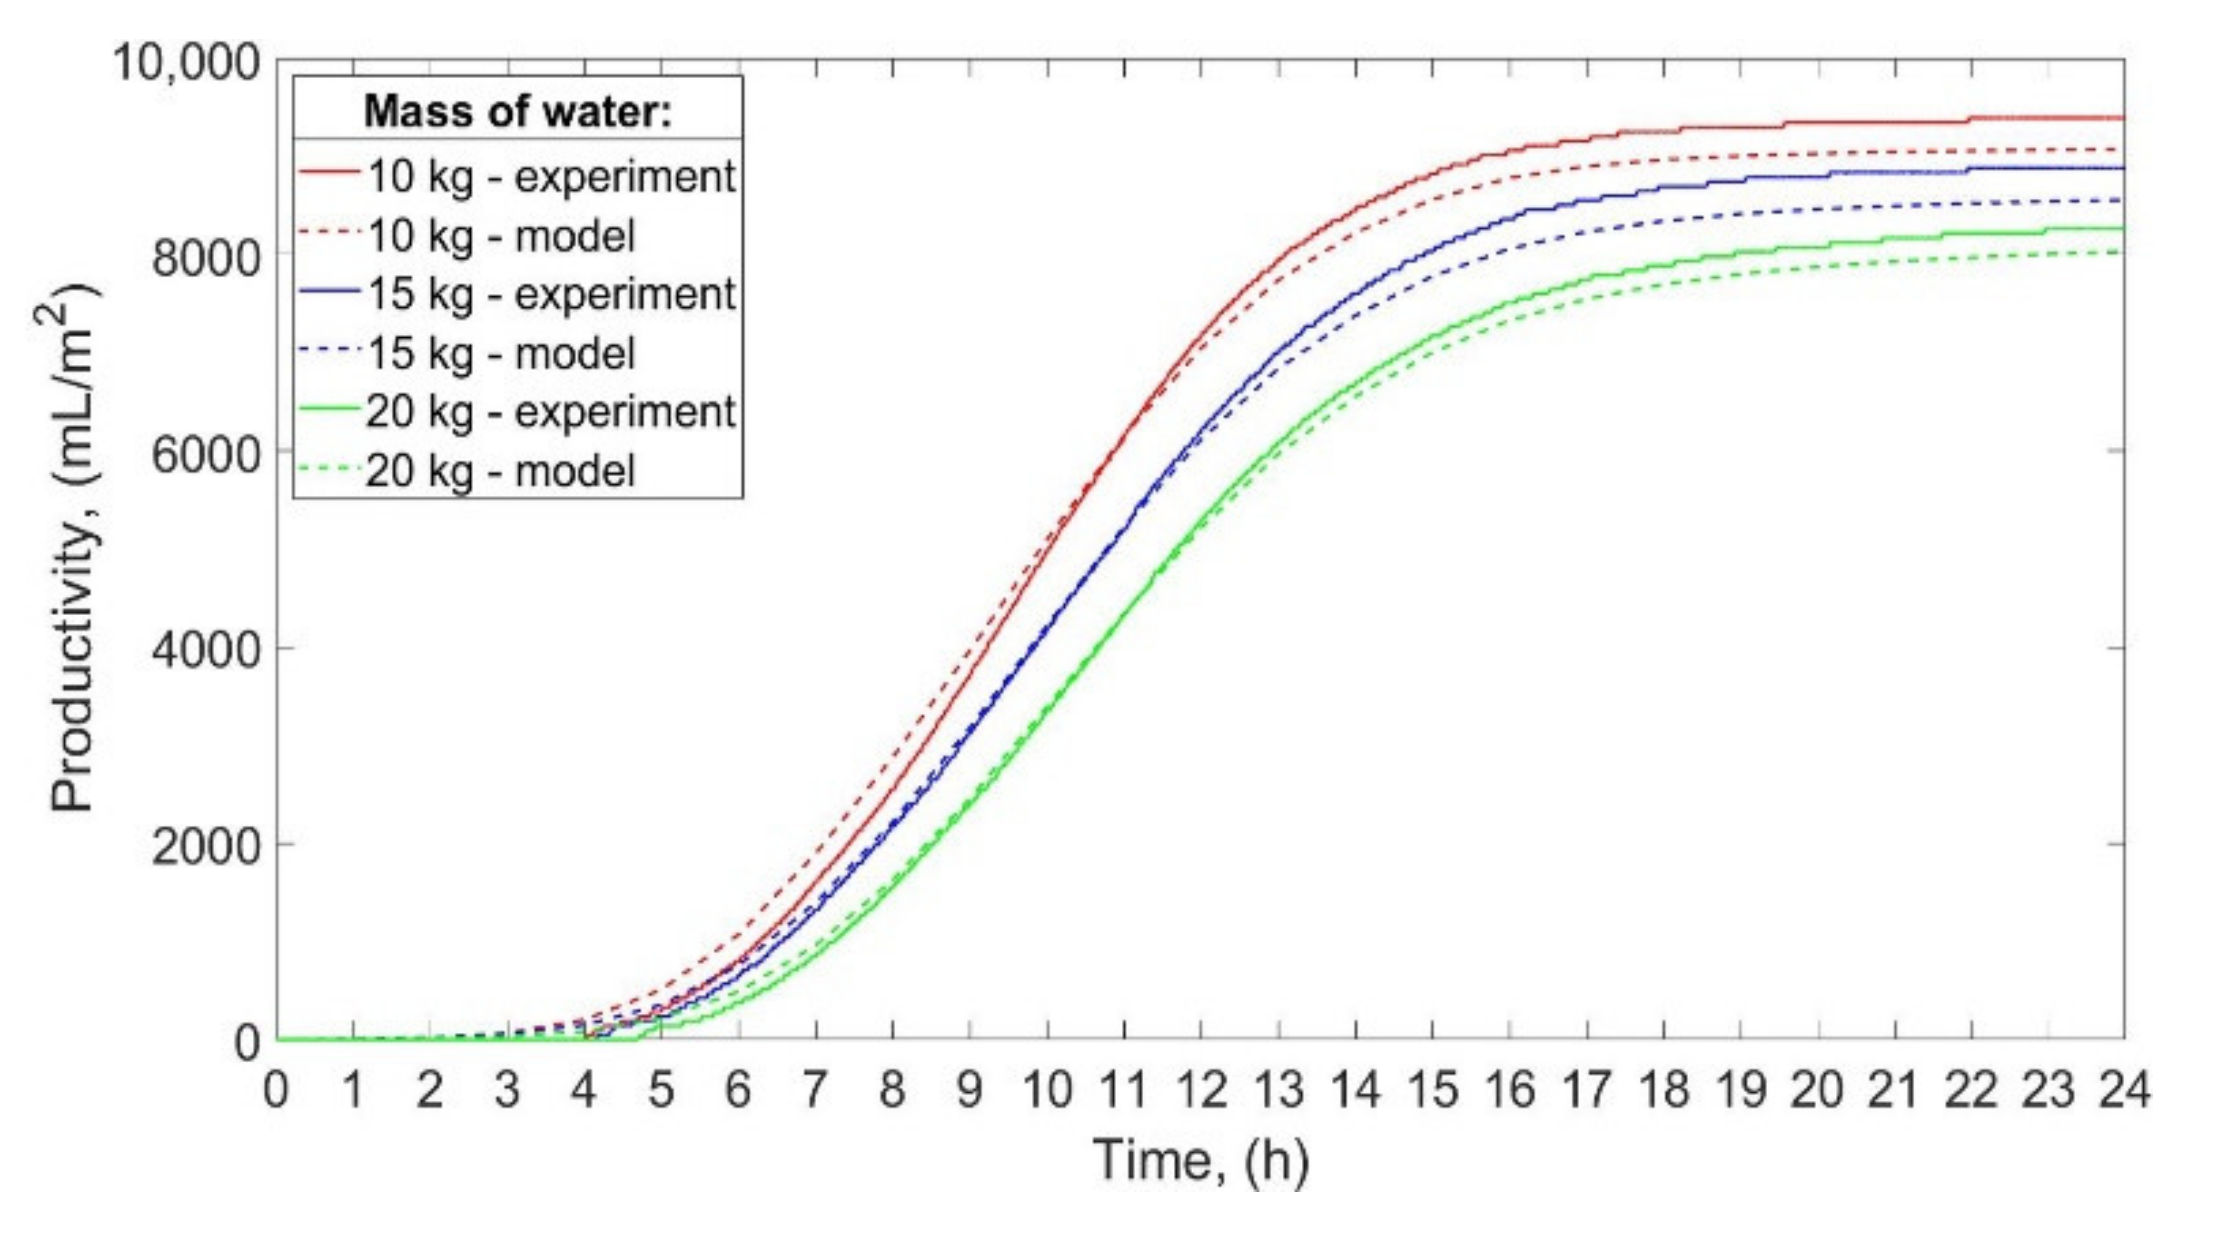
The productivity of the SS, obtained experimentally and theoretically, is shown in
Figure 10.
Regarding the experimental studies, the total productivity of the SS was 9392 mL/m
2/day, 8884 mL/m
2/day, and 8264 mL/m
2/day for 10 kg, 15 kg, and 20 kg of water. Therefore, as the mass of water decreased from 20 to 15 kg, and from 20 to 10 kg, the total productivity increased by 7.5%, and 13.6%, respectively. As can be seen from
Figure 10, the productivity obtained by theoretical calculations is slightly lower than the real productivity. The theoretical productivity is less than the experimental productivity by 3.4%, 3.7%, and 2.8% for 10 kg, 15 kg, and 20 kg of water, respectively. Possible reasons for those differences between theoretical and experimental productivity are discussed in
Section 4.2.
The total operating time of the still was 17 h 55 min, 17 h 47 min, and 18 h 14 min for 10 kg, 15 kg, and 20 kg of water, respectively. Nevertheless, as the mass of water decreased, the condensate started to accumulate earlier in the distillate tank. The condensate began to accumulate after 4 h 3 min, 4 h 10 min, and 4 h 43 min for 10 kg, 15 kg, and 20 kg of water, respectively.
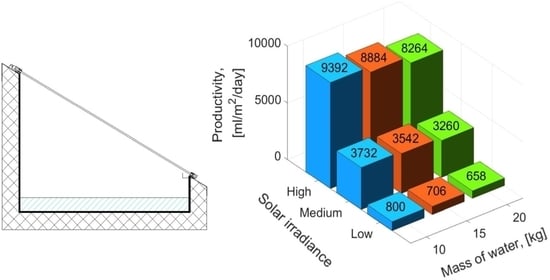
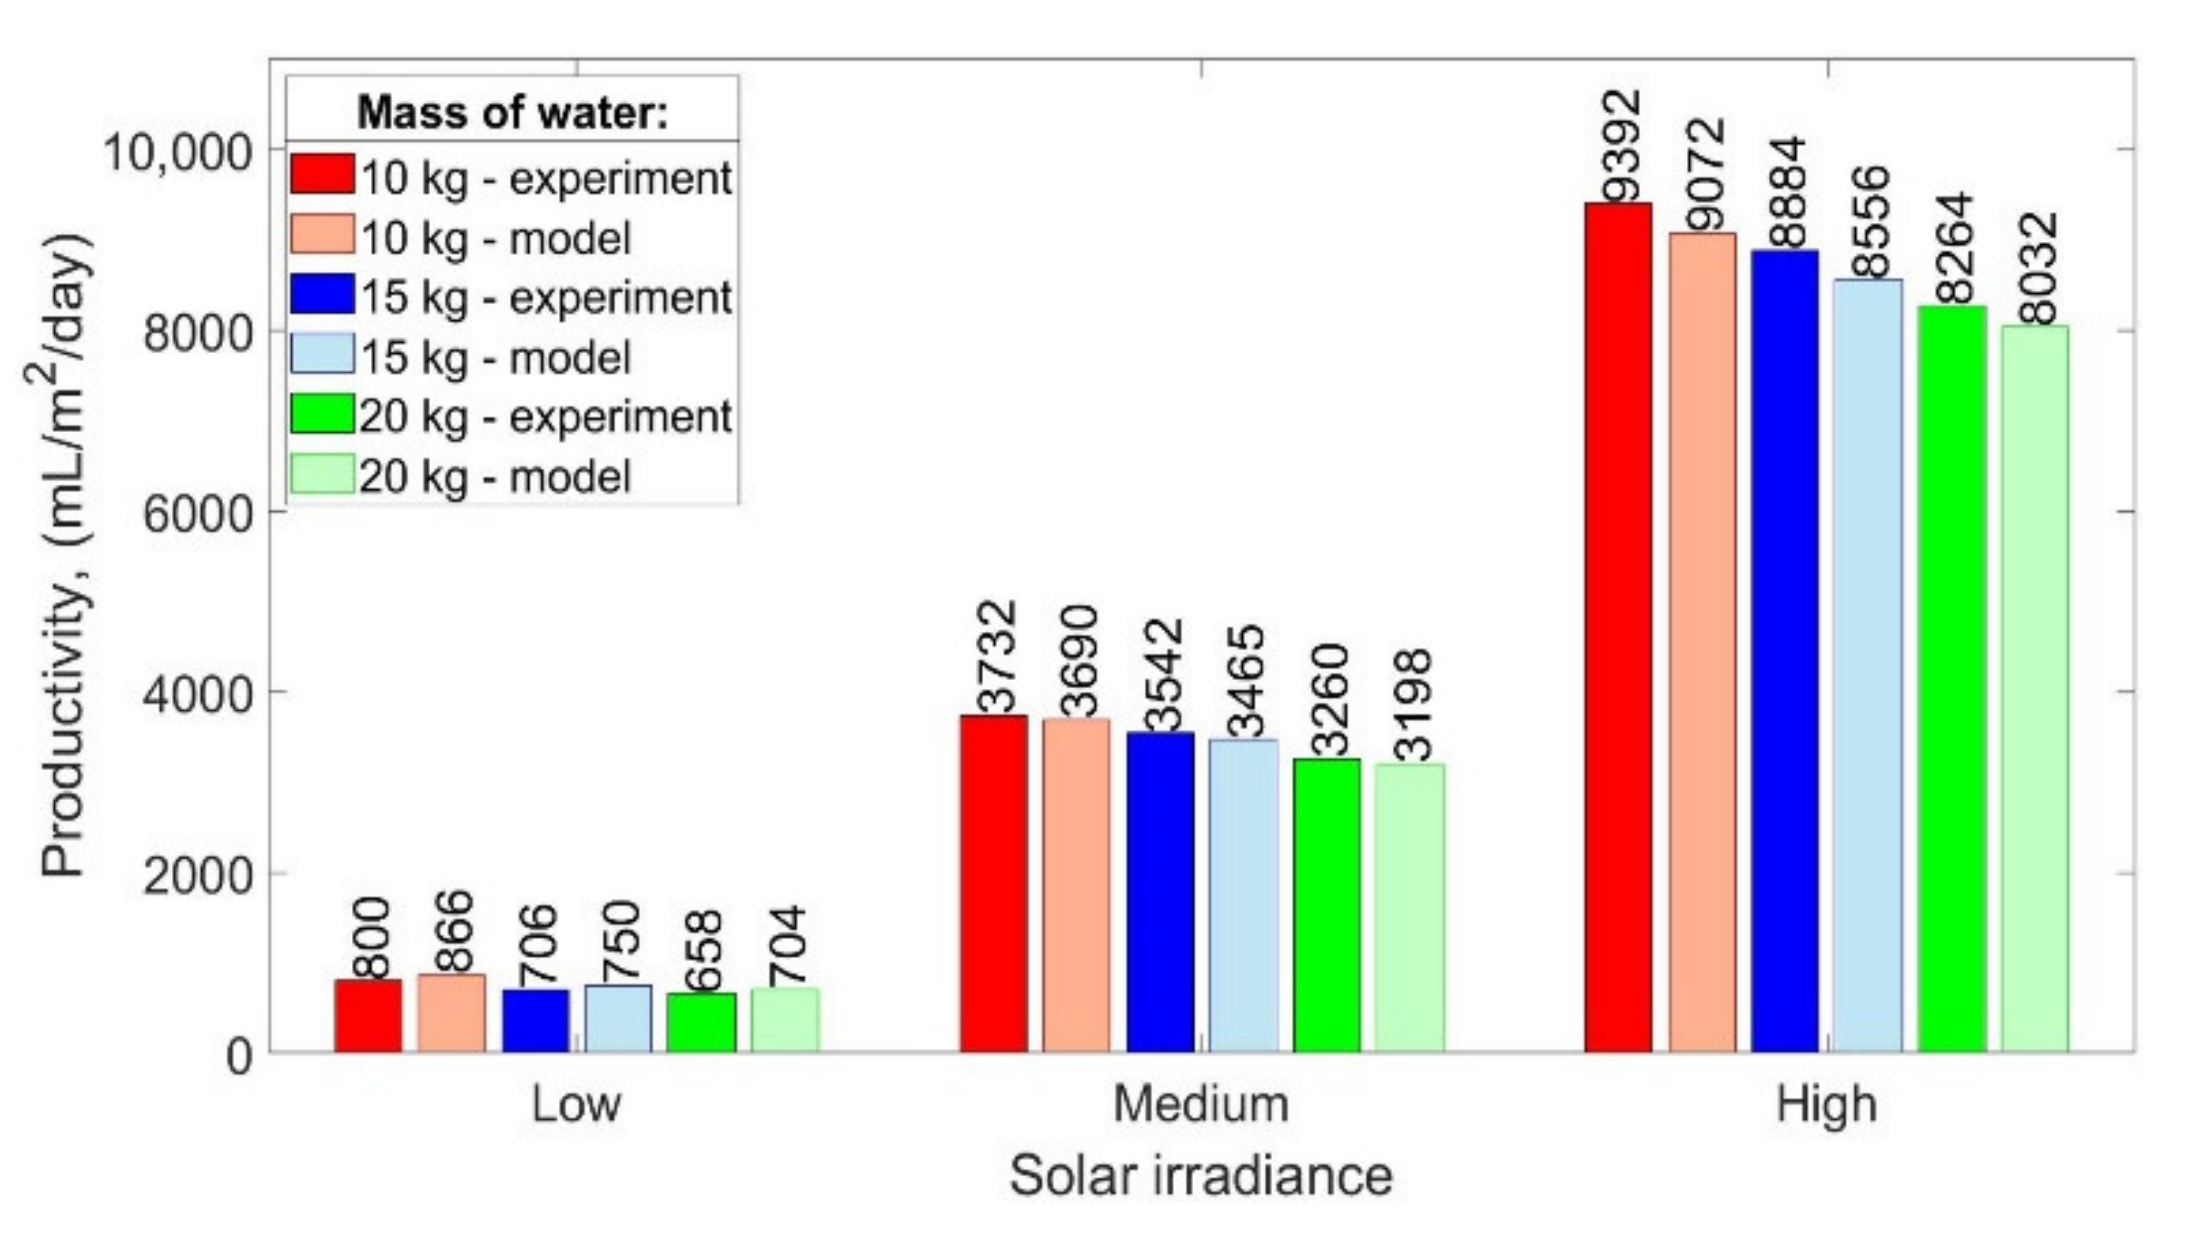
The comparison of the experimental and theoretical daily productivity of the SS for different water masses and solar irradiances is presented in
Figure 11. As can be seen, solar irradiance impacts significantly daily productivity, while the mass of water has a minor influence. Additionally, the results of the experiments and theoretical calculations are in good agreement. The proposed mathematical model overestimates and underestimates the daily productivity up to 8.3% and 3.7%, respectively, while other models available in the open literature, i.e., Dunkle’s, Zheng et al.’s, and Tsilingiris’ model overestimate the productivity by 32–45%, 22–32%, and 21–37%, respectively, which was also confirmed by Sivakumar and Sundaram [
16]. Therefore, it can be concluded that the proposed model provides better results compared to the other models.
5. Conclusions
In this paper, the performance of the solar still for three different water masses (10 kg, 15 kg, and 20 kg) and three different solar irradiances was investigated theoretically and experimentally under controlled laboratory conditions. The solar radiation was simulated by using four electric heaters.
Generally, the mass of water has the greatest influence on the performance of solar still at low power of the electric heaters, while the impact of water mass on the results decreases with the increasing power of the electric heaters.
It was found that independently of the solar irradiance, the productivity of the SS increased with decreasing mass of the water. The results show that the maximum productivity of the SS was obtained for 10 kg of water and it was 800 mL/m2/day, 3732 mL/m2/day, and 9392 mL/m2/day for low, medium, and high power of the electric heater, respectively. When the mass of water decreased from 20 to 15 kg, the productivity increased by 7.3%, 8.7%, and 7.5% for low, medium, and high power of the electric heater, respectively. Additionally, when the mass of water decreased from 20 to 10 kg, the productivity increased by 21.6%, 14.5%, and 13.6% for low, medium, and high power of the electric heater, respectively.
The results show that the maximum temperatures of the water, basin, inner glass cover, and outer glass cover increased with decreasing mass of water, independently of the power of the electric heaters. The maximum temperature of the water was 43.8 °C, 39.6 °C, and 38.0 °C for 10 kg, 15 kg, and 20 kg of water, respectively, for the low power of the electric heaters. The maximum temperature of the water for the abovementioned water masses was 56.7 °C, 55.6 °C, and 53.7 °C, respectively, for the medium power of the electric heaters, and 82.9 °C, 78.5 °C, and 77.1 °C, for the high power of the electric heaters.
Comparing the results of the experimental studies and the theoretical calculations, it can be concluded that the results of the proposed mathematical model are in good agreement with the results of the experimental studies for all water masses and all powers of the electric heaters, which is an advantage of the model. The proposed model slightly overpredicted the temperature of the water, basin, and outer glass cover. Additionally, it underestimated and overestimated the SS’s productivity by a maximum value of 3.7% and 8.3%, respectively. All discrepancies between the theoretical and experimental results can be attributed to numerous possible reasons, but the most probable ones include underestimating the heat losses, the thermal inertia of the electric heaters, disregarding changes in the thermophysical properties of ambient air depending on its relative humidity, and disregarding changes in the thermophysical properties of basin and glass in the function of temperature. Nevertheless, such minor discrepancies between the theoretical and experimental results are not particularly surprising in the light of the fact that each mathematical model describes reality in a simplified manner.


