Article

The Investigation into the Tribological Impact of Alternative Fuels on Engines Based on Acoustic Emission

1
School of Mchanical Engineering, Taiyuan University of Science and Technology, Taiyuan 030024, China
2
Dynamics Group, Department of Mechanical Engineering, Imperial College London, London SW7 2AZ, UK
3
Centre for Efficiency and Performance Engineering, University of Huddersfield, Huddersfield HD1 3DH, UK
*
Authors to whom correspondence should be addressed.
Energies 2021, 14(8), 2315; https://doi.org/10.3390/en14082315
Submission received: 16 February 2021 / Revised: 30 March 2021 / Accepted: 8 April 2021 / Published: 20 April 2021

Abstract

:
The wide use of different alternative fuels (AL) has led to challenges to the internal combustion (IC) engine tribology. To avoid any unpredicted damages to lubrication joints by using AL fuels, this study aims to accurately evaluate the influences of alternative fuels on the tribological behavior of IC engines. Recent achievements of the acoustic emission (AE) mechanism in sliding friction provide an opportunity to explain the tribological AE responses on engines. The asperity–asperity–collision (AAC) and fluid–asperity–shearing (FAS) mechanisms were applied to explain the AE responses from the piston ring and cylinder liner system. A new adaptive threshold–wavelet packets transform (WPT) method was developed to extract tribological AE features. Experimental tests were conducted by fueling three fuels: pure diesel (PD), biodiesel (BD), and Fischer–Tropsch (F–T) diesel. The FAS–AE indicators of biodiesel and F–T diesel show a tiny difference compared to the baseline diesel using two types of lubricants. Biodiesel produces more AAC impacts with higher AAC–AE responses than F–T diesel, which occurs at high speeds due to high temperatures and more particles after combustion than diesel. This new algorithm demonstrated the high performance of using AE signals in monitoring the tribological impacts of alternative fuels on engines.

1. Introduction

Many investigations of alternative fuels (AL) focus on the emissions and performance because of the environmental vulnerabilities and resource shortage of fossil fuels. The physical and chemical properties of alternative fuels are different from those of ordinary diesel, which inevitably lead to physical and chemical changes in the combustion chamber. The efforts to reduce fuel emissions may lead to further tribological problems such as a loss of lubricity and surface damage [1]. Moreover, the influence on the friction and lubrication condition of the engines using AL fuels is still unknown. Therefore, it is necessary to monitor the alternatives’ tribological behaviors on engines under the working condition.
Biodiesel (BD) and Fischer–Tropsch (F–T) diesel have become a research focus in China recently because these two fuels show good potential to put into use on diesel engines with good performance and lower emissions. Furthermore, F–T diesel synthesized from coal can promote the clean utilization of coal in China. Biodiesel is a potential substitute fuel blended mainly with bio-oil and diesel. Numerous research achievements prove that biodiesel and diesel blends have progressive effects on emissions and power performance [2,3,4,5,6]. F–T diesel is also a promising diesel substitute fuel that contains a high cetane number, near–zero sulfur content, and low aromatic level [7,8,9]. However, the studies of the tribological impacts of F–T diesel and BD on engines are still not in–depth.
Some research results provide theoretical support for online evaluation of the tribological impacts of alternative fuels. Biodiesel has poor thermal stability [10] and higher unsaturated fatty acids that may cause injector coking, carbon deposition, oxidation, and corrosion [11,12]. The main drawbacks of F–T diesel are poor lubricity and destiny [13]. The above studies show that AL fuels may lead to tribological impacts on the components of engines. Several laboratory studies of BD were performed on a four-ball wear machine [11,14,15,16], the results exhibited auspicious lubricating performance in terms of wear and friction. Some other studies [17,18,19] conducted on-the-road use of biodiesel for thousands even millions of miles, and the results show that all engines fueling B20 exhibited normal wear for their mileage compared with diesel. Oppositely, Sundus and co–workers [20] reported critically on the downsides of BD’s high viscosity, such as the poor atomization of injector, plugging of fuel filter, and the tribo–pairs sticking. From the chemical view, biodiesel is a mixture of methyl or ethyl esters with long-chain fatty acids [21], the corrosion reactions of biodiesel were deliberated and discussed in [21,22,23]. However, the laboratory studies of F–T diesel on friction and lubrication performance are still in the blank.
The acoustic emission (AE) technique has shown technical superiority in non-intrusive measurement because of its high sensitivity to the strain energy spontaneously generated due to stress, deformation, or fracture [24]. Recently, there has been significant increase in the amount of research into condition monitoring and early fault detection in gears [25,26] and bearing [27,28,29] using AE. Specially, AE techniques are widely used in the conditions monitoring of engine systems because it is sensitive to the combustion processes [30], the valve faults [31], and fuel injection process [32]. Based on the previous achievements, AE monitoring towards the slider to disk test rigs revealed that the sliding speed, acceleration, and load can affect the AE root means square (RMS) values [33,34]. Deshpande et al. [35] developed AE and machine learning (ML)-based framework to monitor and classify in situ abrasive wear in real-time. Hence, the AE measurements prompt monitoring the tribological behavior on the engine system. Douglas et al. [36] focused their study on the tribology of piston ring and cylinder liner surfaces using AE, and a series of experiments were conducted to relate the asperity contacts between the ring-pack and liner to the AE signal RMS values through several engine tests. Shuster et al. [37] correlated AE signals to the scuffing phenomenon of the piston ring and cylinder liner system at different levels. The authors [38] studied the potential impacts of alternative fuels based on AE signals on the cylinder outer surface. It showed the possibility to insight the tribological influence on engines. Ref. [39] employed a discrete wavelet transform (DWT) to highlight the AE contents relating to the tribological process and succeeded in creating tiny differences between oils with different lubricant viscosities. These discoveries demonstrated the high feasibility of AE signals in investigating the friction and wear conditions between piston rings and cylinder surfaces.
Modeling studies try to describe the AE formation mechanism during the sliding friction based on different lubrication regimes. Based on well-known lubrication mechanisms, the sliding surfaces between the ring and liner generally have three lubrication regimes: boundary lubrication (BL), mixed lubrication (ML), and hydrodynamic lubrication (HL) [40]. It found that asperity contact was the AE source in sliding friction [41,42]. The classic model of asperity–asperity collision (AAC) based on BL regimes was suggested by Fan et al. [42]. However, the AE observed in references [36,38,43] cannot be explained by the AAC effect in the mid-stroke of piston basically under HL. Some new findings show that the dynamic fluid-asperities shearing (FAS) under the hydrodynamic lubrication (HL) regime is another AE source in sliding friction. The authors [44] developed a new fluid-asperity shearing (FAS) induced AE model to explain AE responses from the tribological conjunction of the piston ring and cylinder. Ma et al. [45] developed a new FAS model to decipher the FAS–AE frequency characteristics under the HL regime. Hence, in the piston ring and cylinder liner system, AE features under different regimes can be explained mainly with AAC and FAS models.
This paper uses an adaptive threshold method based on the wavelet packet transform (WPT) to characterize the AE responses on the external cylinder surface to decipher the impacts of the alternative fuels on the engine. AE signals were acquired by fueling two substitute fuels, biodiesel and F–T diesel, and the baseline diesel with two different lubricants recommended from the engine manufacturer. An autocorrelated threshold–WPT noise suppression approach was proposed for enhancing the tribological features in this study. The denoised AE indicator based on the new method can quantify the tribological impacts by two AL fuels in different lubrication regimes of the piston ring and cylinder liner system.

2. AE Signal Acquisition

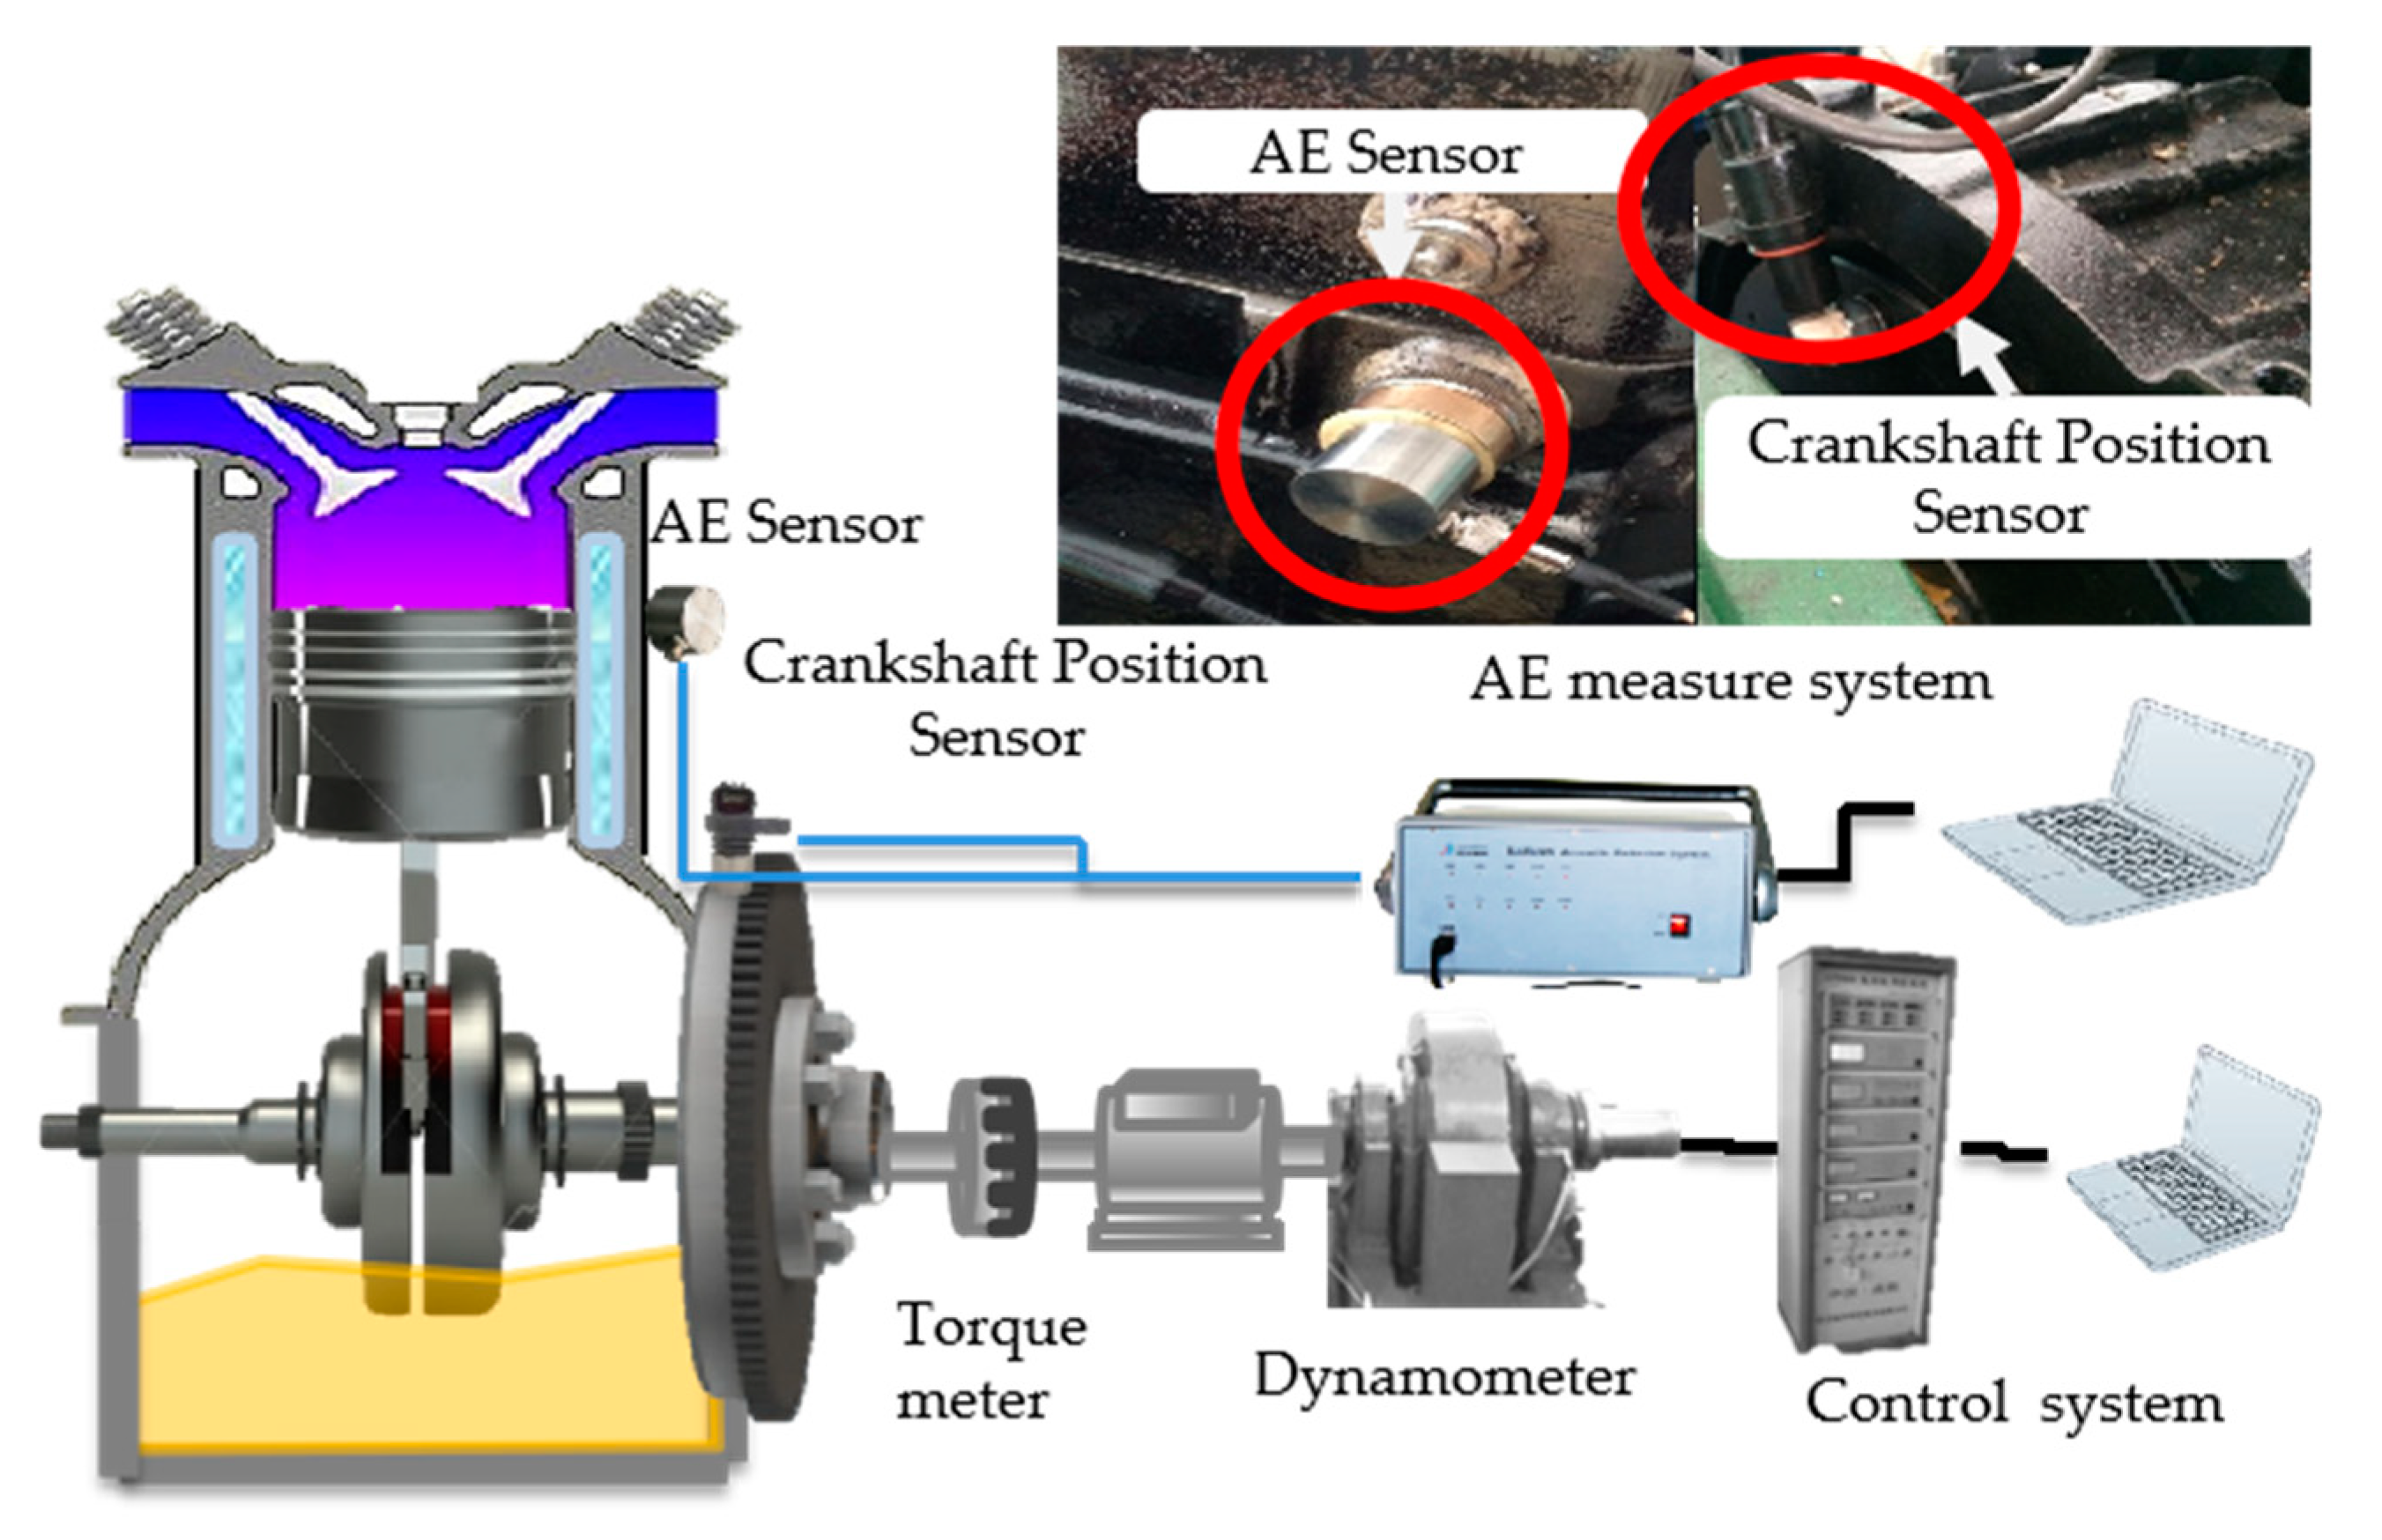
2.1. Engine Test Rig and Test Conditions

The experimental studies were conducted on a single-cylinder direct injection diesel engine (Anhui Quanchai Engine Co., Ltd., Quanjiao, China) test rig. The schematic diagram of the diesel engine test system is shown in Figure 1. The engine was coupled by the eddy current dynamometer (Chengbang, China, Model: DW 160). The key specification of the test engine is given in Table 1. The material of the piston ring and the cylinder liner are chrome-plated alloy steel and alloy cast iron. The roughness parameter Ra of the ring and liner were 0.8 and 0.2 μm according to the surface finish grade numbers (ISO 1302:1992).
The AE sensor was located closer to the contact part between the outer cylinder wall and the liner. The crankshaft position sensor is an electronic device located on the flywheel housing. A crank angle signal was measured by crankshaft position sensor 39180 (Hyundai Mobis, Seoul, Korea) at the same time to record the TDC (top dead center) of each revolution. The AE measurement system is composed of the AE sensor, pre-amplifier, AE detector, and PC. The wideband piezoelectric AE sensor (model SR800, Qing Cheng AE Institute, Guangzhou, China) was selected to acquire AE signals because this sensor has a good frequency response in the band from 20 and 400 kHz according to the calibration chart as shown in Figure 2. A number of trial tests also showed that AE signals of interest were more significant below 250 kHz on engine surfaces. Therefore, the frequency band in this study was focused around 20 to 400 kHz.
The AE sensor was verified by the manufacturer before tests where the AE response of pencil-lead breaks on the engine housing was observed. Because the output voltage signal of the AE sensor is sometimes as low as a few microvolts. The signals are processed by a pre-amplifier (the magnification is 40 dB). The acoustic emission detector is the SEAU2S–1016-08 acoustic emission detector of Beijing Shenghua Industrial Technology Co., Ltd. (Beijing, China). The sampling length is up to 128 k sampling points under 16-bit precision.

2.2. Test Procedure

Three types of fuels (pure Diesel, F–T diesel and Biodiesel), the testing conditions, and fuel properties are presented in Table 2. Two new oils (CD–10W30 and CD–15W40, Sinopec Lubricant Company, Beijing, China) are taken as baselines to verify the effectiveness and sensitivity of extracted features fueling with diesel. The viscosity–temperature characteristics of the lubricating oils (CD–15W40 and CD–10W30) were measured by the sinusoidal viscometer (SV–10, A&D Company, Limited, Tokyo, Japan) as given in Figure 3. The length of the AE data record is 1,144,000 points for each working cycle. The sampling rate is 800 kHz, which covers over 100 engine working cycles for sufficient average and thus obtaining reliable results.

3. AE Signal Process
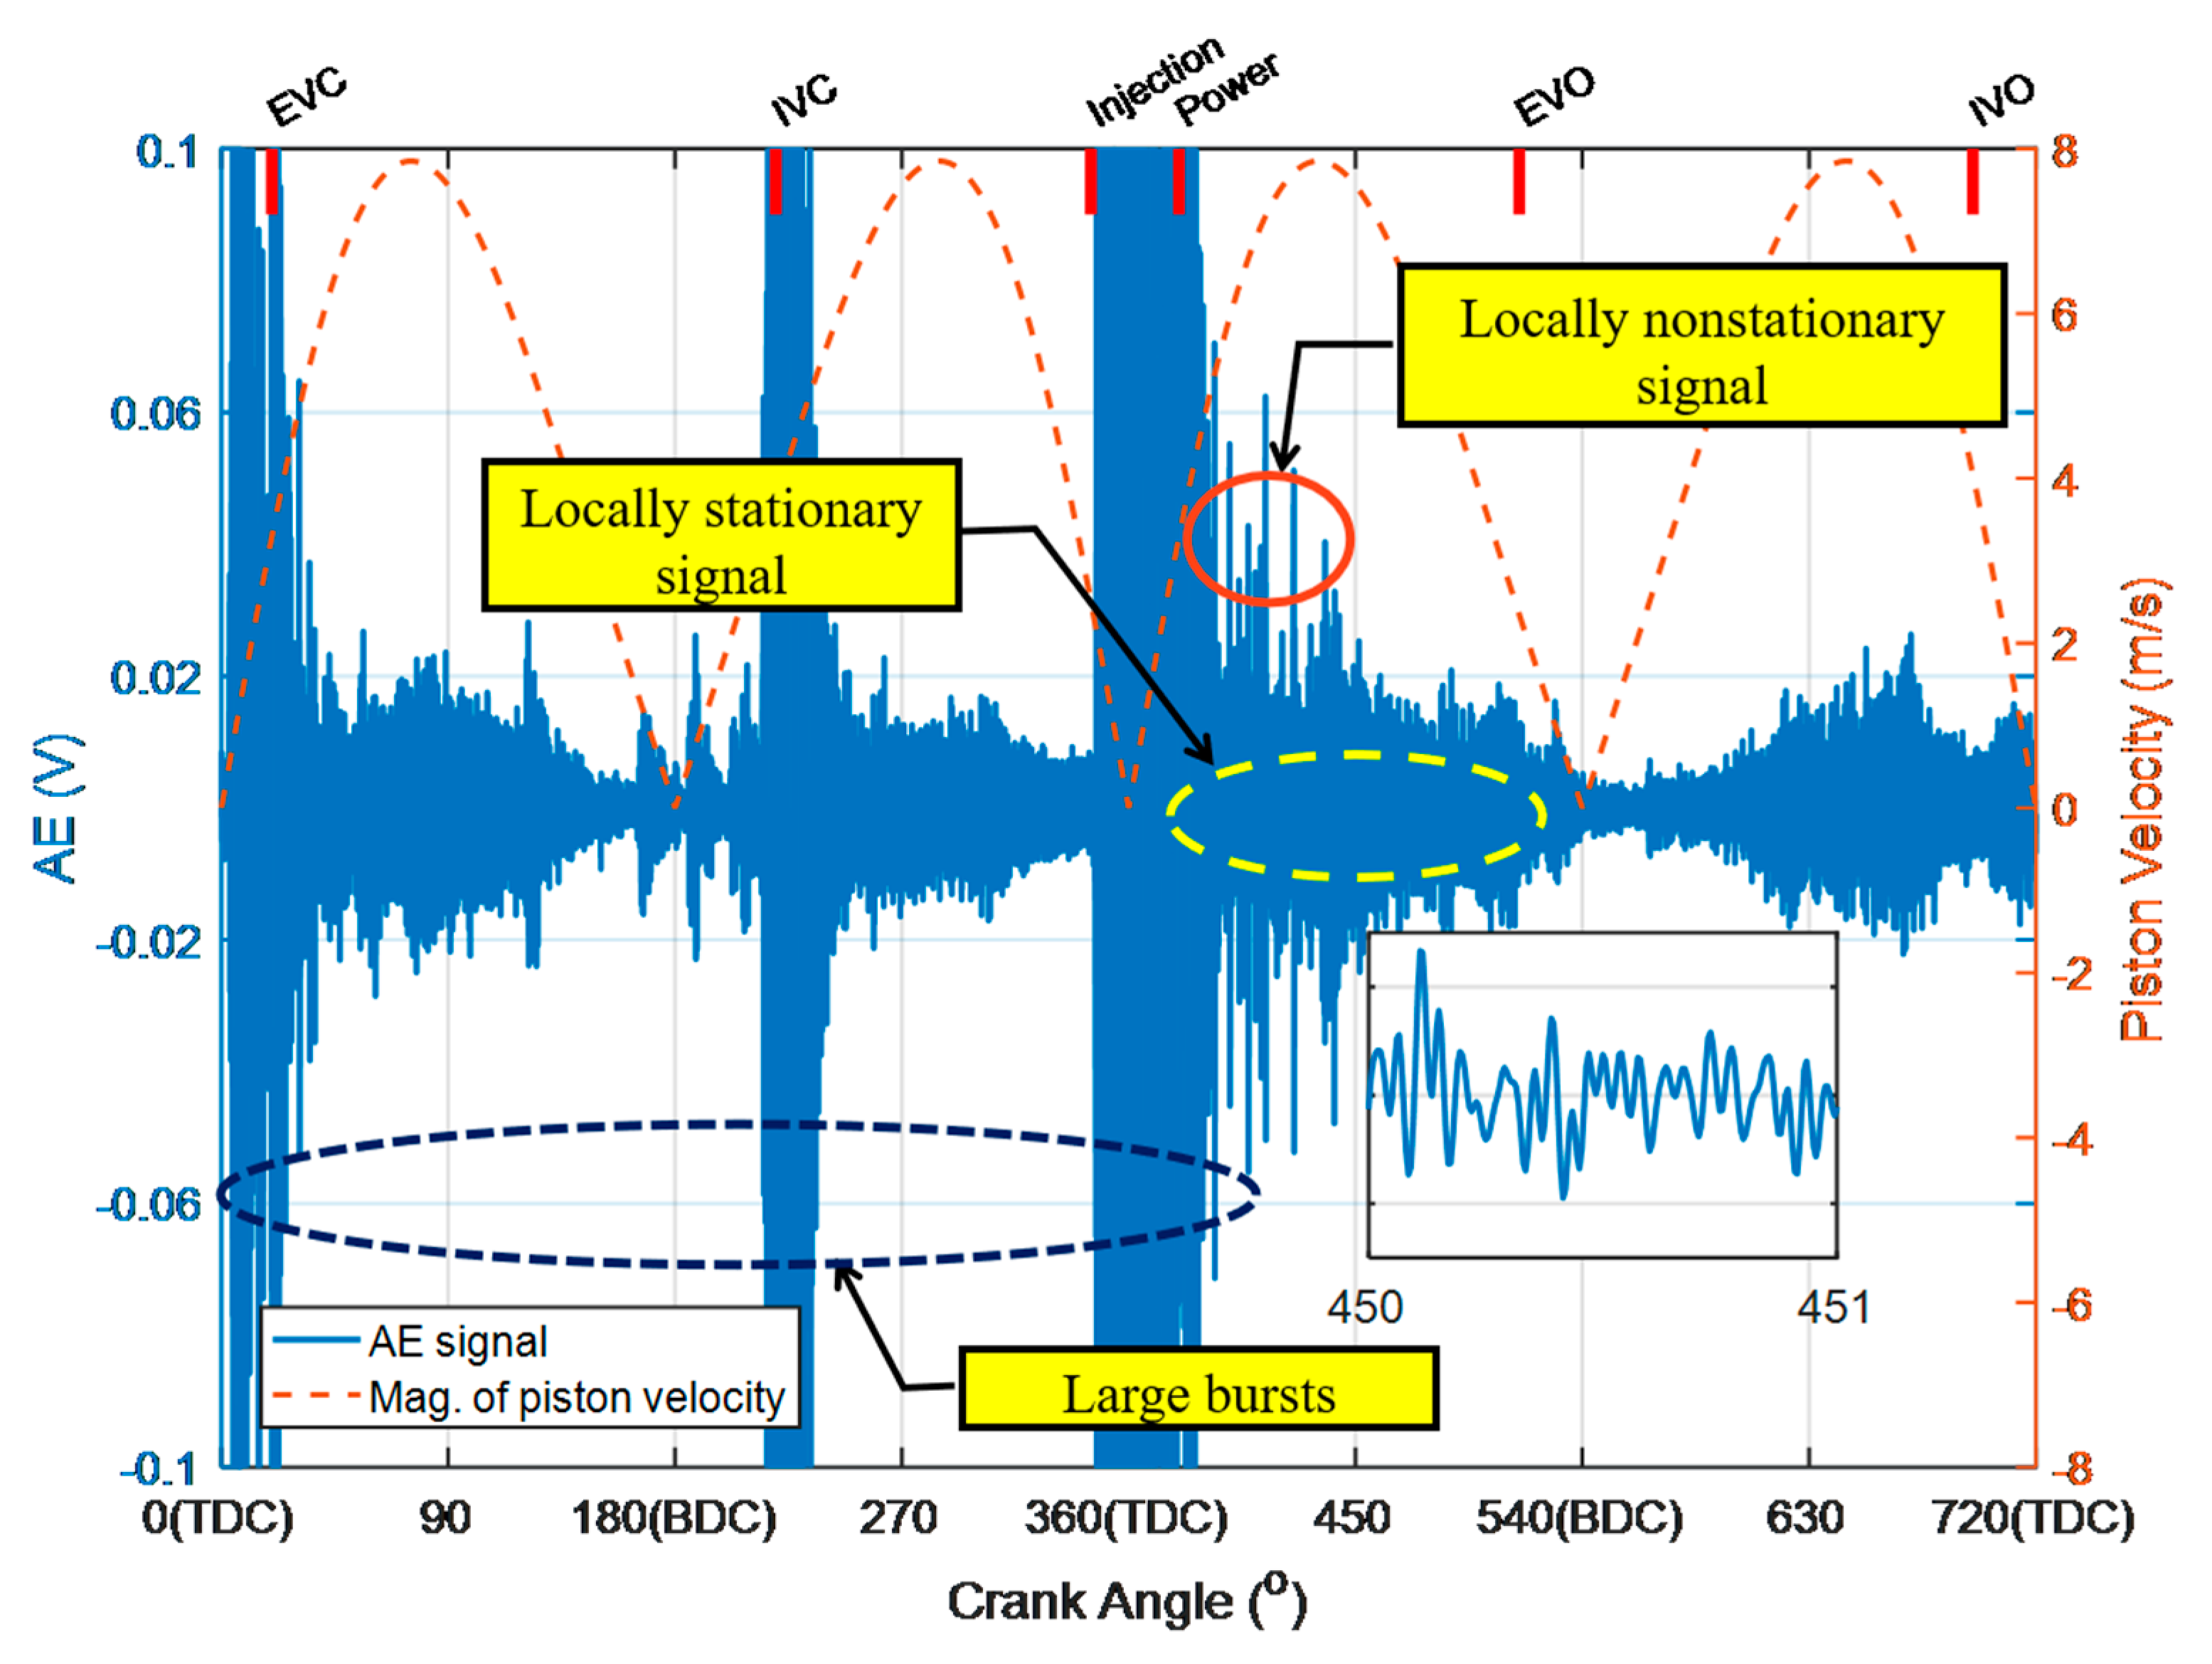
3.1. AE Signals

Figure 4 presents typical AE signals and the varying piston speed profile in the angular domain for an engine working cycle. The piston speed reaches its maximum in each middle stroke and decreases to zero at the top dead center (TDC) and bottom dead center (BDC). The large AE events to be attributed sequentially to the excitations of exhaust valve closing (EVC), inlet valve closing (IVC), fuel injection, combustion shocks, exhaust valve open (EVO), and inlet valve opening (IVO). Each of them exhibits strong AE bursts and reflects the short impulses of the sources. Between the strong bursts, there is nothing moving components except for piston assembly in the single-engine. It is worth noting that there are local stationary waves in the middle of each stroke. The amplitude of these stationary waves varied with the piston speed, displaying a close association with the FAS effects suggested in [42,44]. Within the same local range, some locally nonstationary signals are generated stochastically. The locally stochastical AE peaks varied with piston speed are related to the asperity–asperity collision based on the AAC model of the BL lubrication regimes.
Therefore, a more effective signal processing technique is required to emerge the weak pseudo-continuous AE for the evolution of tribological behavior between the ring and the liner.

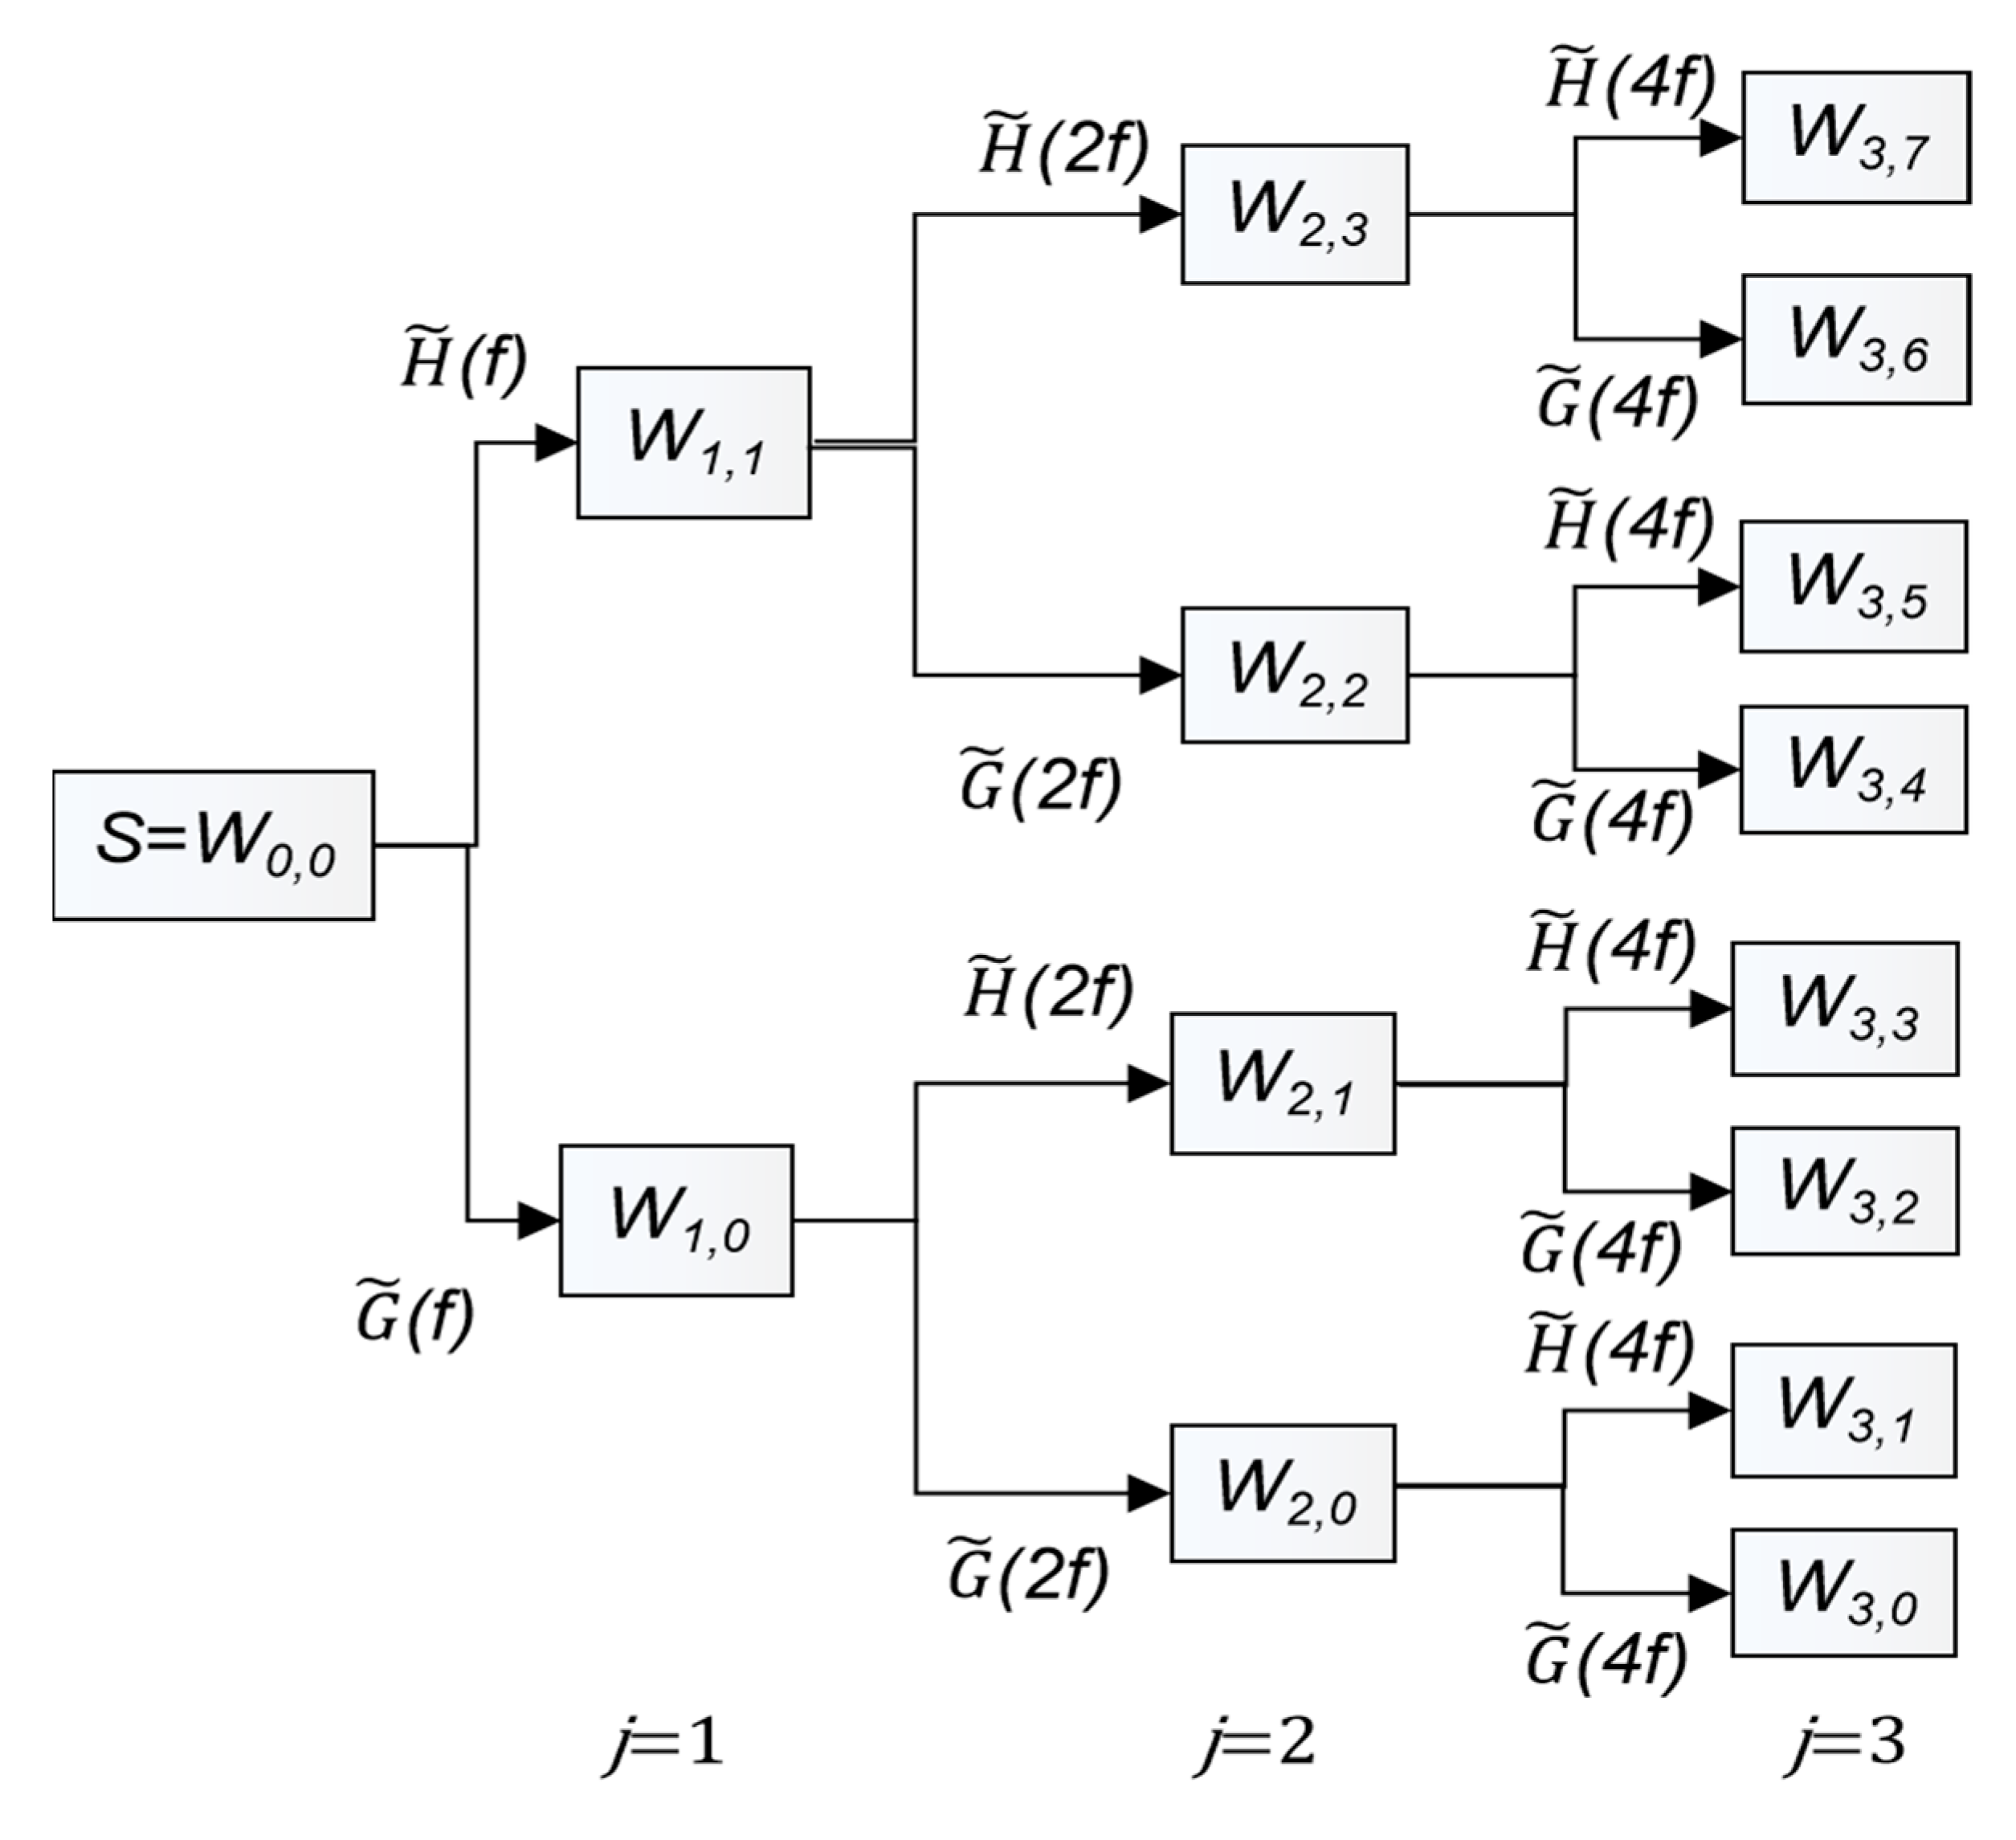
3.2. Wavelet Packet Transform

As shown in previous studies, the measured AE signal will inevitably be affected by various noises. The nonstationary weak AE needs more effective approaches to extract the tribological features accurately. Compared with wavelet transform under the same bandwidth, wavelet packet transform (WPT) can process nonstationary signals with better frequency resolution. Moreover, WPT only adds a limited amount of decomposition calculations, which is lower than continuous wavelet transform and short-time Fourier transform. Hence, this study employed an adaptive threshold WPT method to investigate the AE denoising and feature extracting. WPT is widely used in condition monitoring and fault diagnosis in rotary mechanical systems such as gears [46,47] and bearings [48], diesel engines [49]. Remarkably, reference [50] analyzed AE signals to investigate the failure of tribological systems based on wavelet packet decomposition.
The wavelet packet decomposition, shorten as wavelet packets (WP) or sub-band tree, is extended by discrete wavelet decomposition (DWT) passed through more filters than the DWT. Based on the DWT, the calculation function of wavelet packets can be defined as [51]:
{ W 2 n j ( t w ) = 2 k = 0 2 N 1 h ( k ) W n j ( 2 t w k ) W 2 n + 1 j ( t w ) = 2 k = 0 2 N 1 g ( k ) W n j ( 2 t w k ) ,
where n = 1, 2, 3⋯; k = 1, 2, 3⋯ 2N–1; W 0 0 ( t w ) is the scaling function ϕ ( t w ) and W 1 0 ( t w ) the wavelet function φ ( t w ) . The superscript j presents the jth level of wavelet packets basis.
The algorithm of wavelet packet spectrum which contains the absolute values of the coefficients from the frequency-ordered terminal nodes of the input binary wavelet packet tree was first introduced by Wickerhauser [52].
Figure 5 presents a full wavelet packet tree down to level 3. The terminal nodes approximate bandpass filters of the form at the j level of the wavelet packet transform is [ n F s 2 J + 1 , ( n + 1 ) F s 2 J + 1 ]   n = 0 , 1 , 2 , 3 , 2 J 1 , where Fs is the sampling frequency. The orthogonal wavelet decomposition procedure separates the coefficients into two parts using the high pass filter H ˜ ( f ) and the low pass filter G ˜ ( f ) .

3.3. Adaptive AE-WP Algorithm for Tribological Behaviors

3.3.1. Adaptive Threshold–AE Based on FAS

The main idea of the traditional threshold denoising method is to retain useful information and denoise in different frequency bands according to appropriate threshold criteria. As shown in Figure 4, besides the large AE bursts aroused by the landing of valves and combustion process, it also has some small AE bursts that occurred randomly in the middle of the stroke. The amplitude of AE caused by FAS is very weak and its envelope is remarkably similar to the modified piston velocity curve. To accurately extract FAS–AE, a threshold needs to be determined under various working conditions. Hence, this paper designs a new adaptive threshold denoising function Yik to exclude the noise from valves, combustion and injection:
Y i k = { 0 i f   | x i k | > λ i x i k i f   | x i k | λ i
where xik is the raw AE data; k is the number of working cycles; λi is the adaptive threshold designed to quantitatively check the similarity between a modified velocity curve and the envelope of the AE signals.
λ i = c i d min ( x ¯ i , v p i )
in which ci is the iteration coefficient, ci is iteratively reduced until the distance d ( x ¯ k , v p i ) turned to the minimum:
d ( x ¯ i , v p i ) = s i g n ( v p i ) x ¯ i v p i T s i g n ( v p i ) x ¯ i s i g n ( v p i ) x ¯ i T v p i v p i T ,
in which x ¯ i is the mean value of 20 working cycles at the ith working condition. It can find that the data around some specific crank angles are too noisy and have less AE content of the FAS effect. The ‘sign’ function is applied to convert the piston speed around these crank angles into zero means. Therefore, the x ¯ i is closer to the velocity profile and to better reflect the FAS effect.
Besides, the interval of the Y-axis is scaled at each speed by a factor of the quintuple standard deviation 5 σ j calculated by:
σ i = 5 k = 1 K m = 1 M x i 2 ( m ) k K M ,
where n is the time index, running up to M of the sample number for the AE signal in an engine cycle; and the K = 20 is the number of engine cycles.

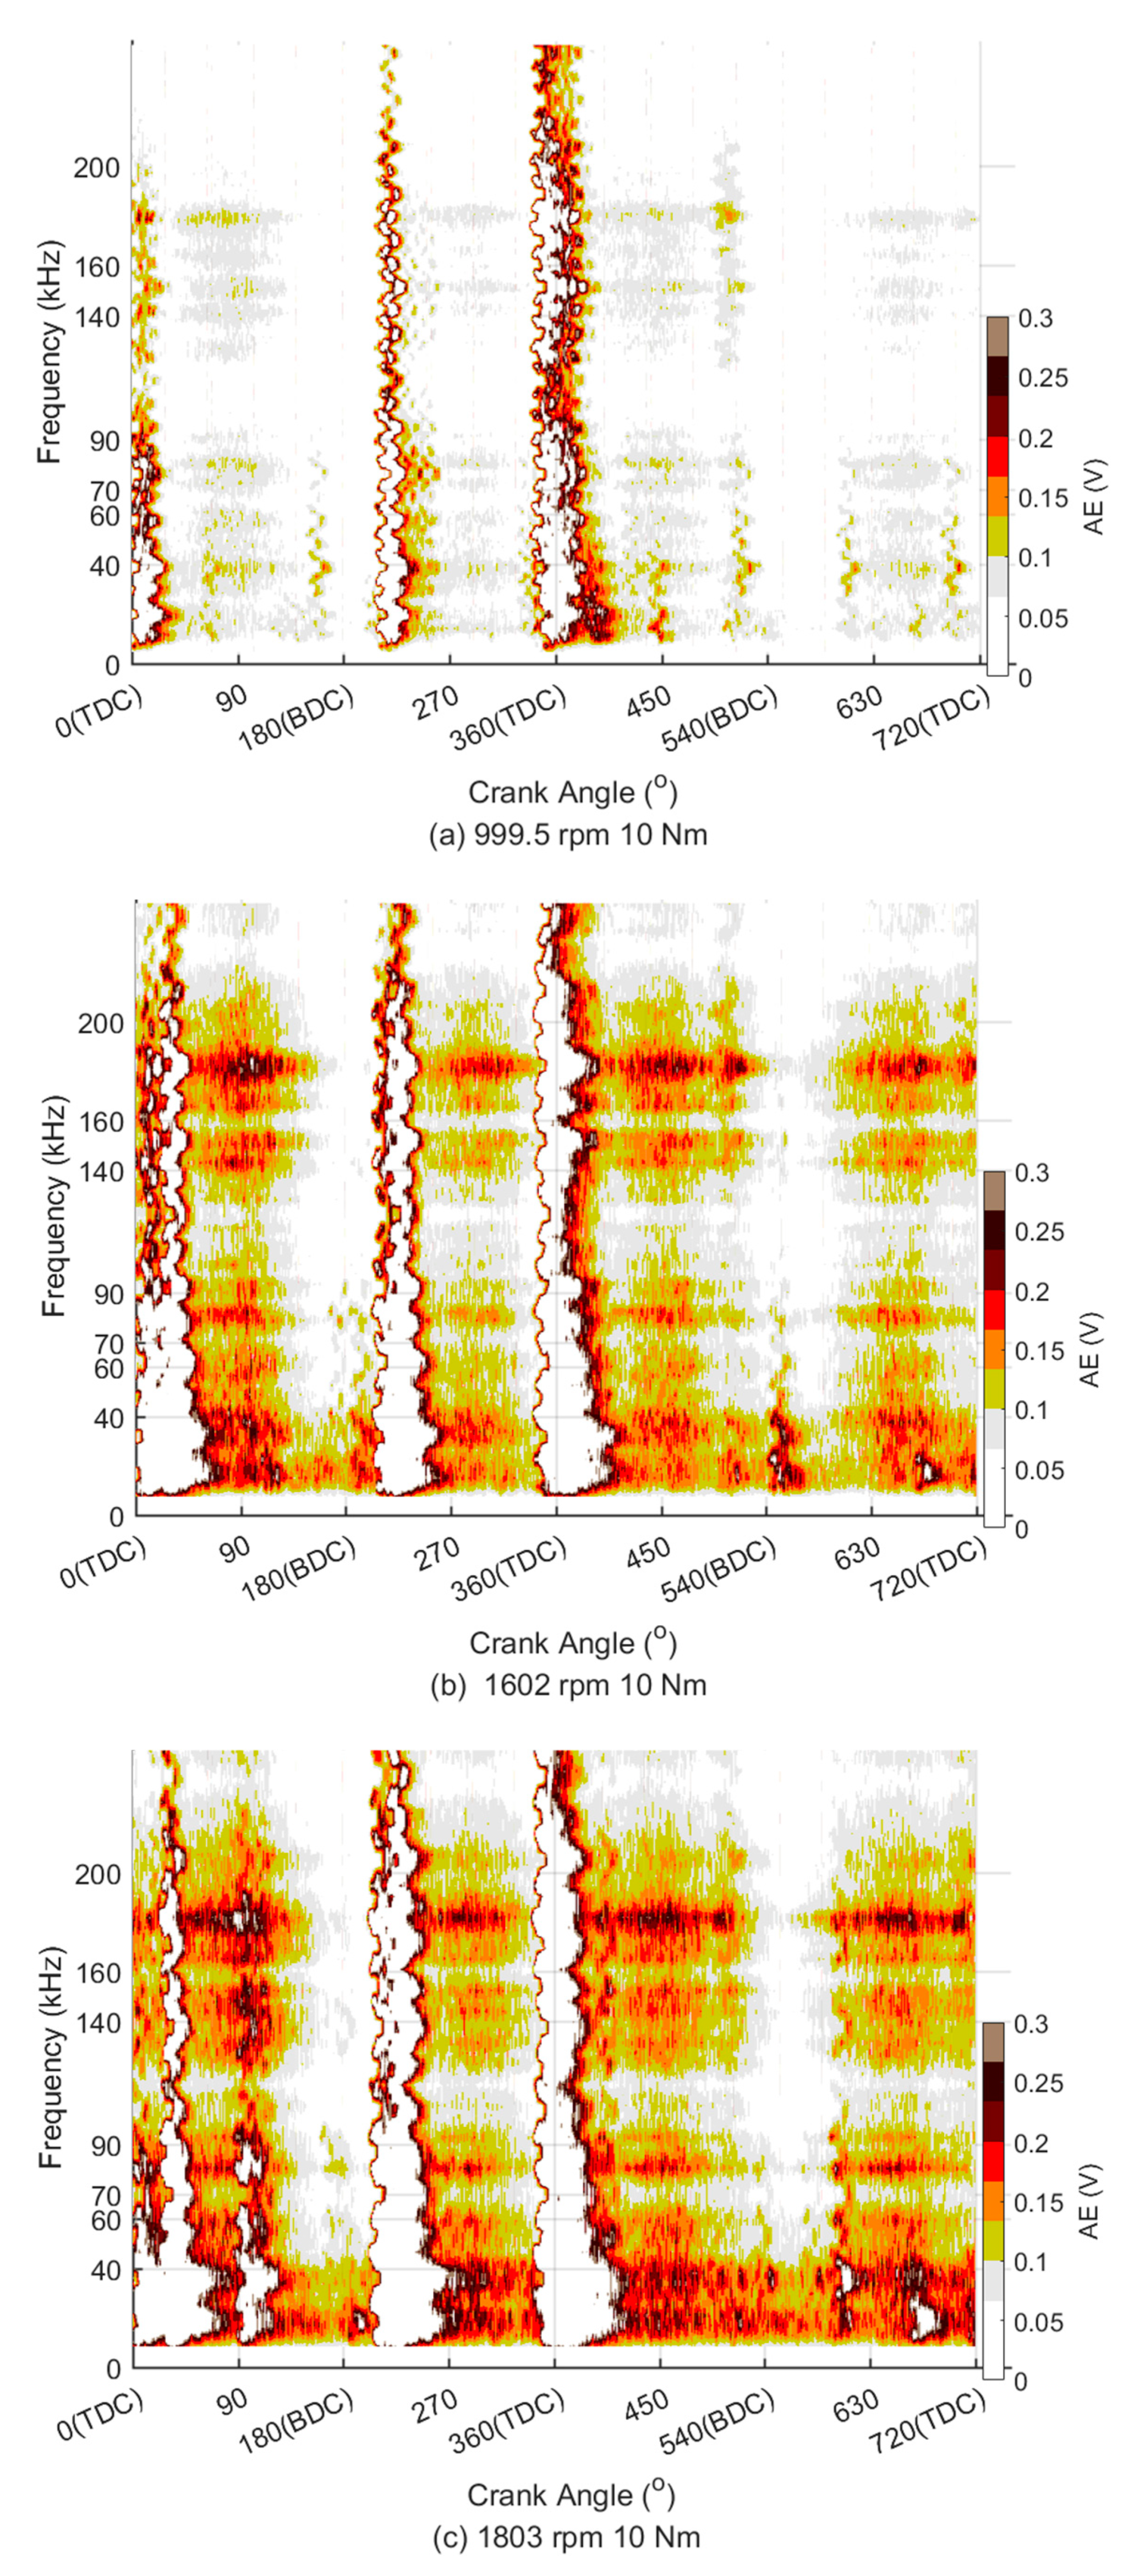
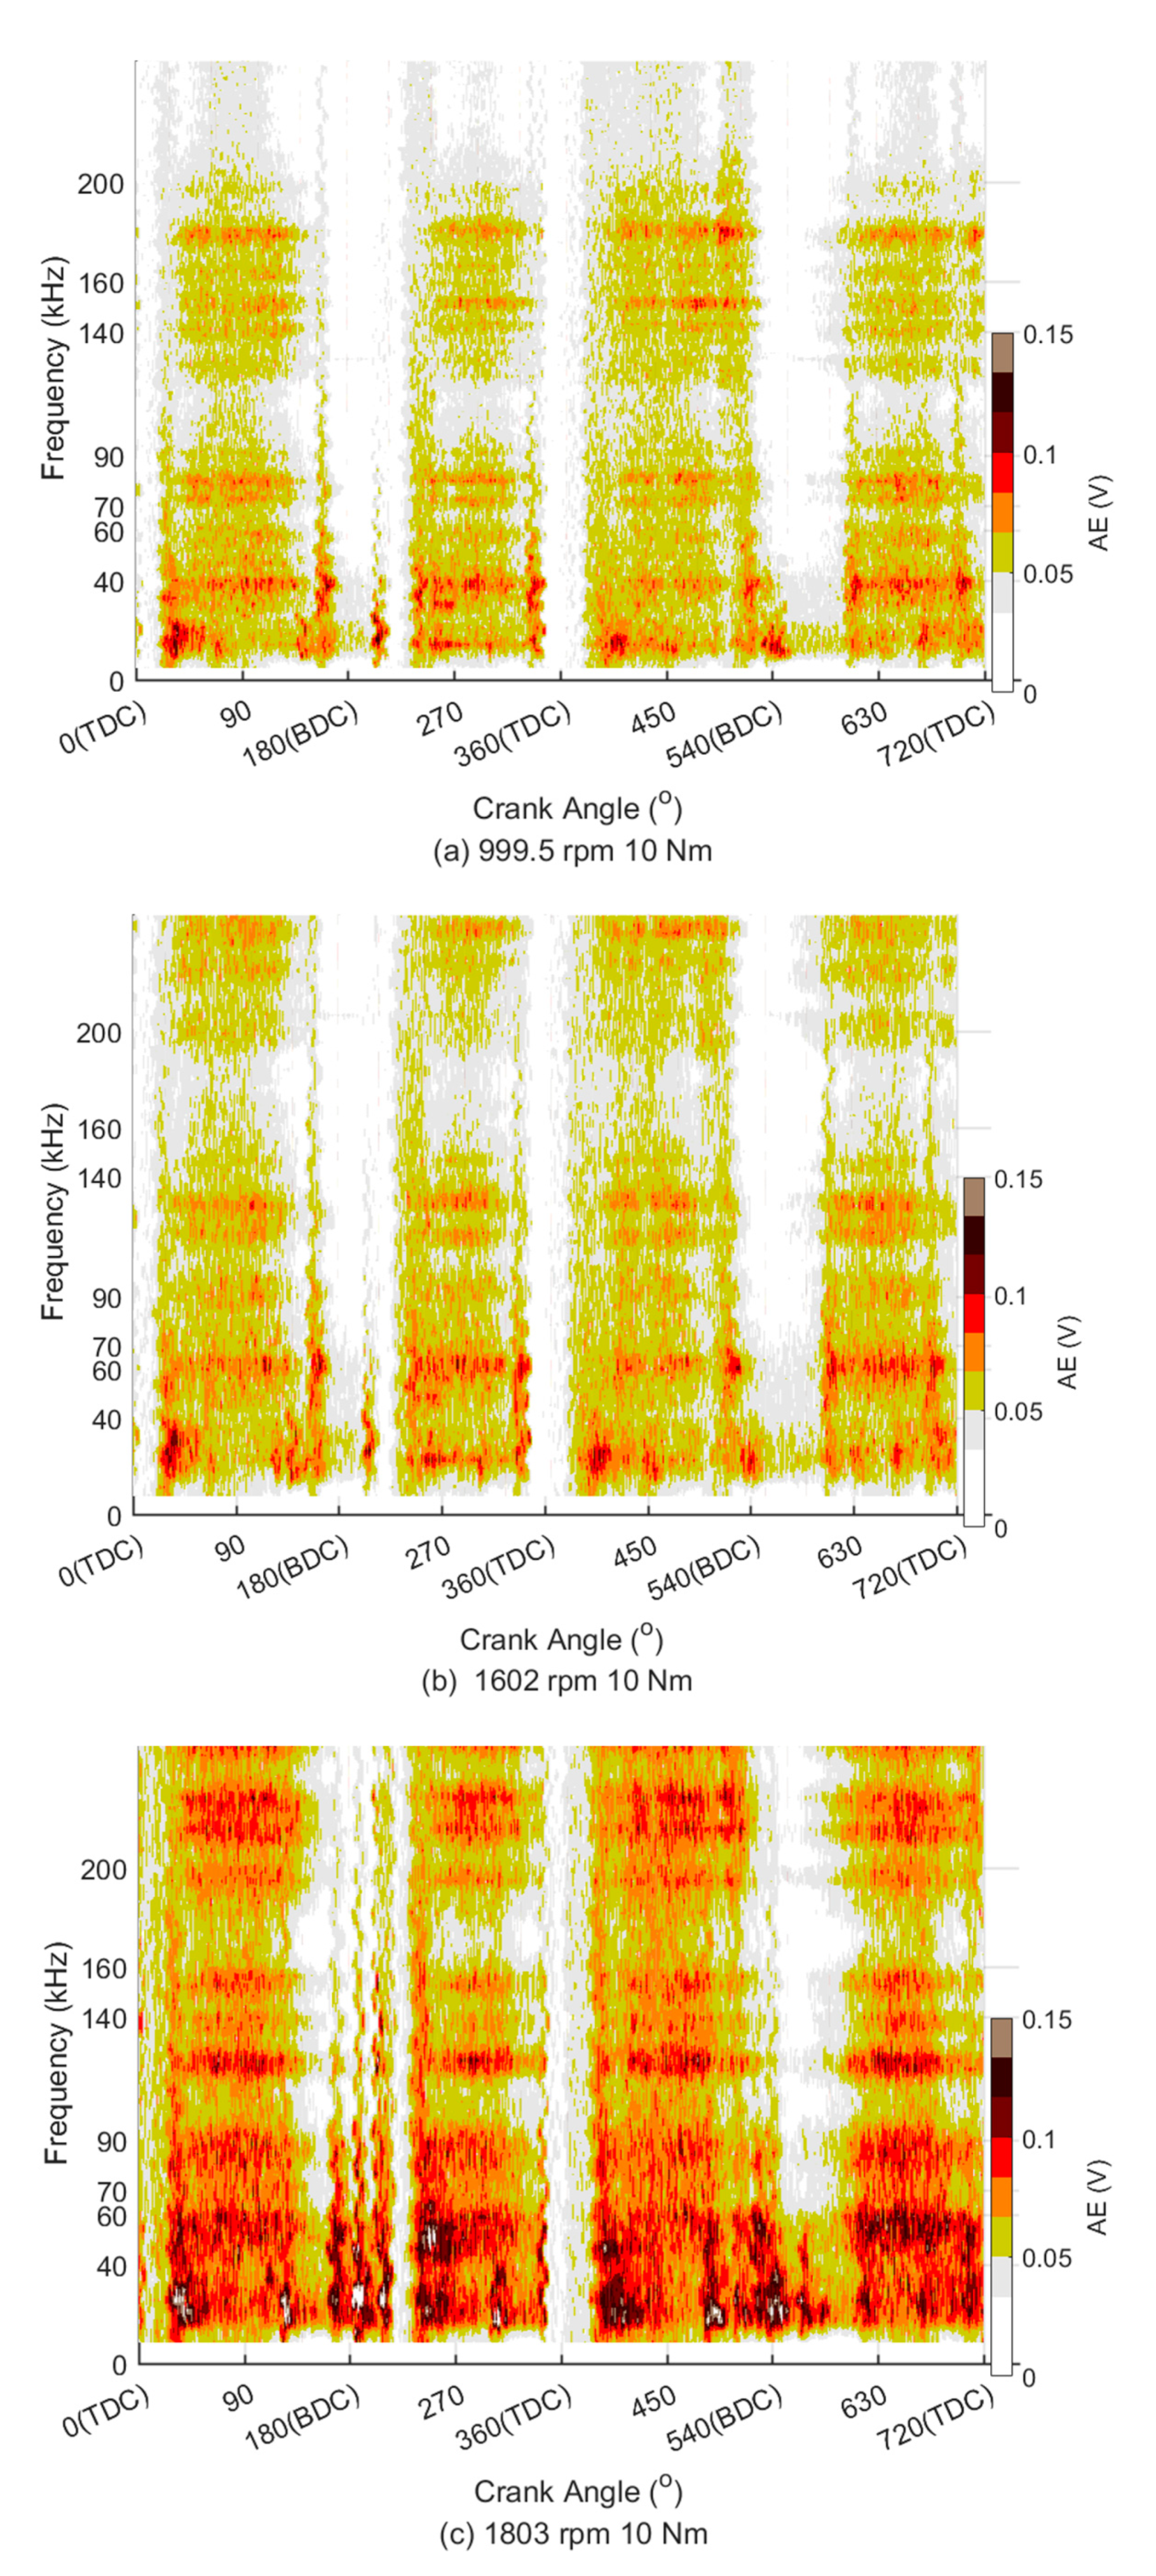
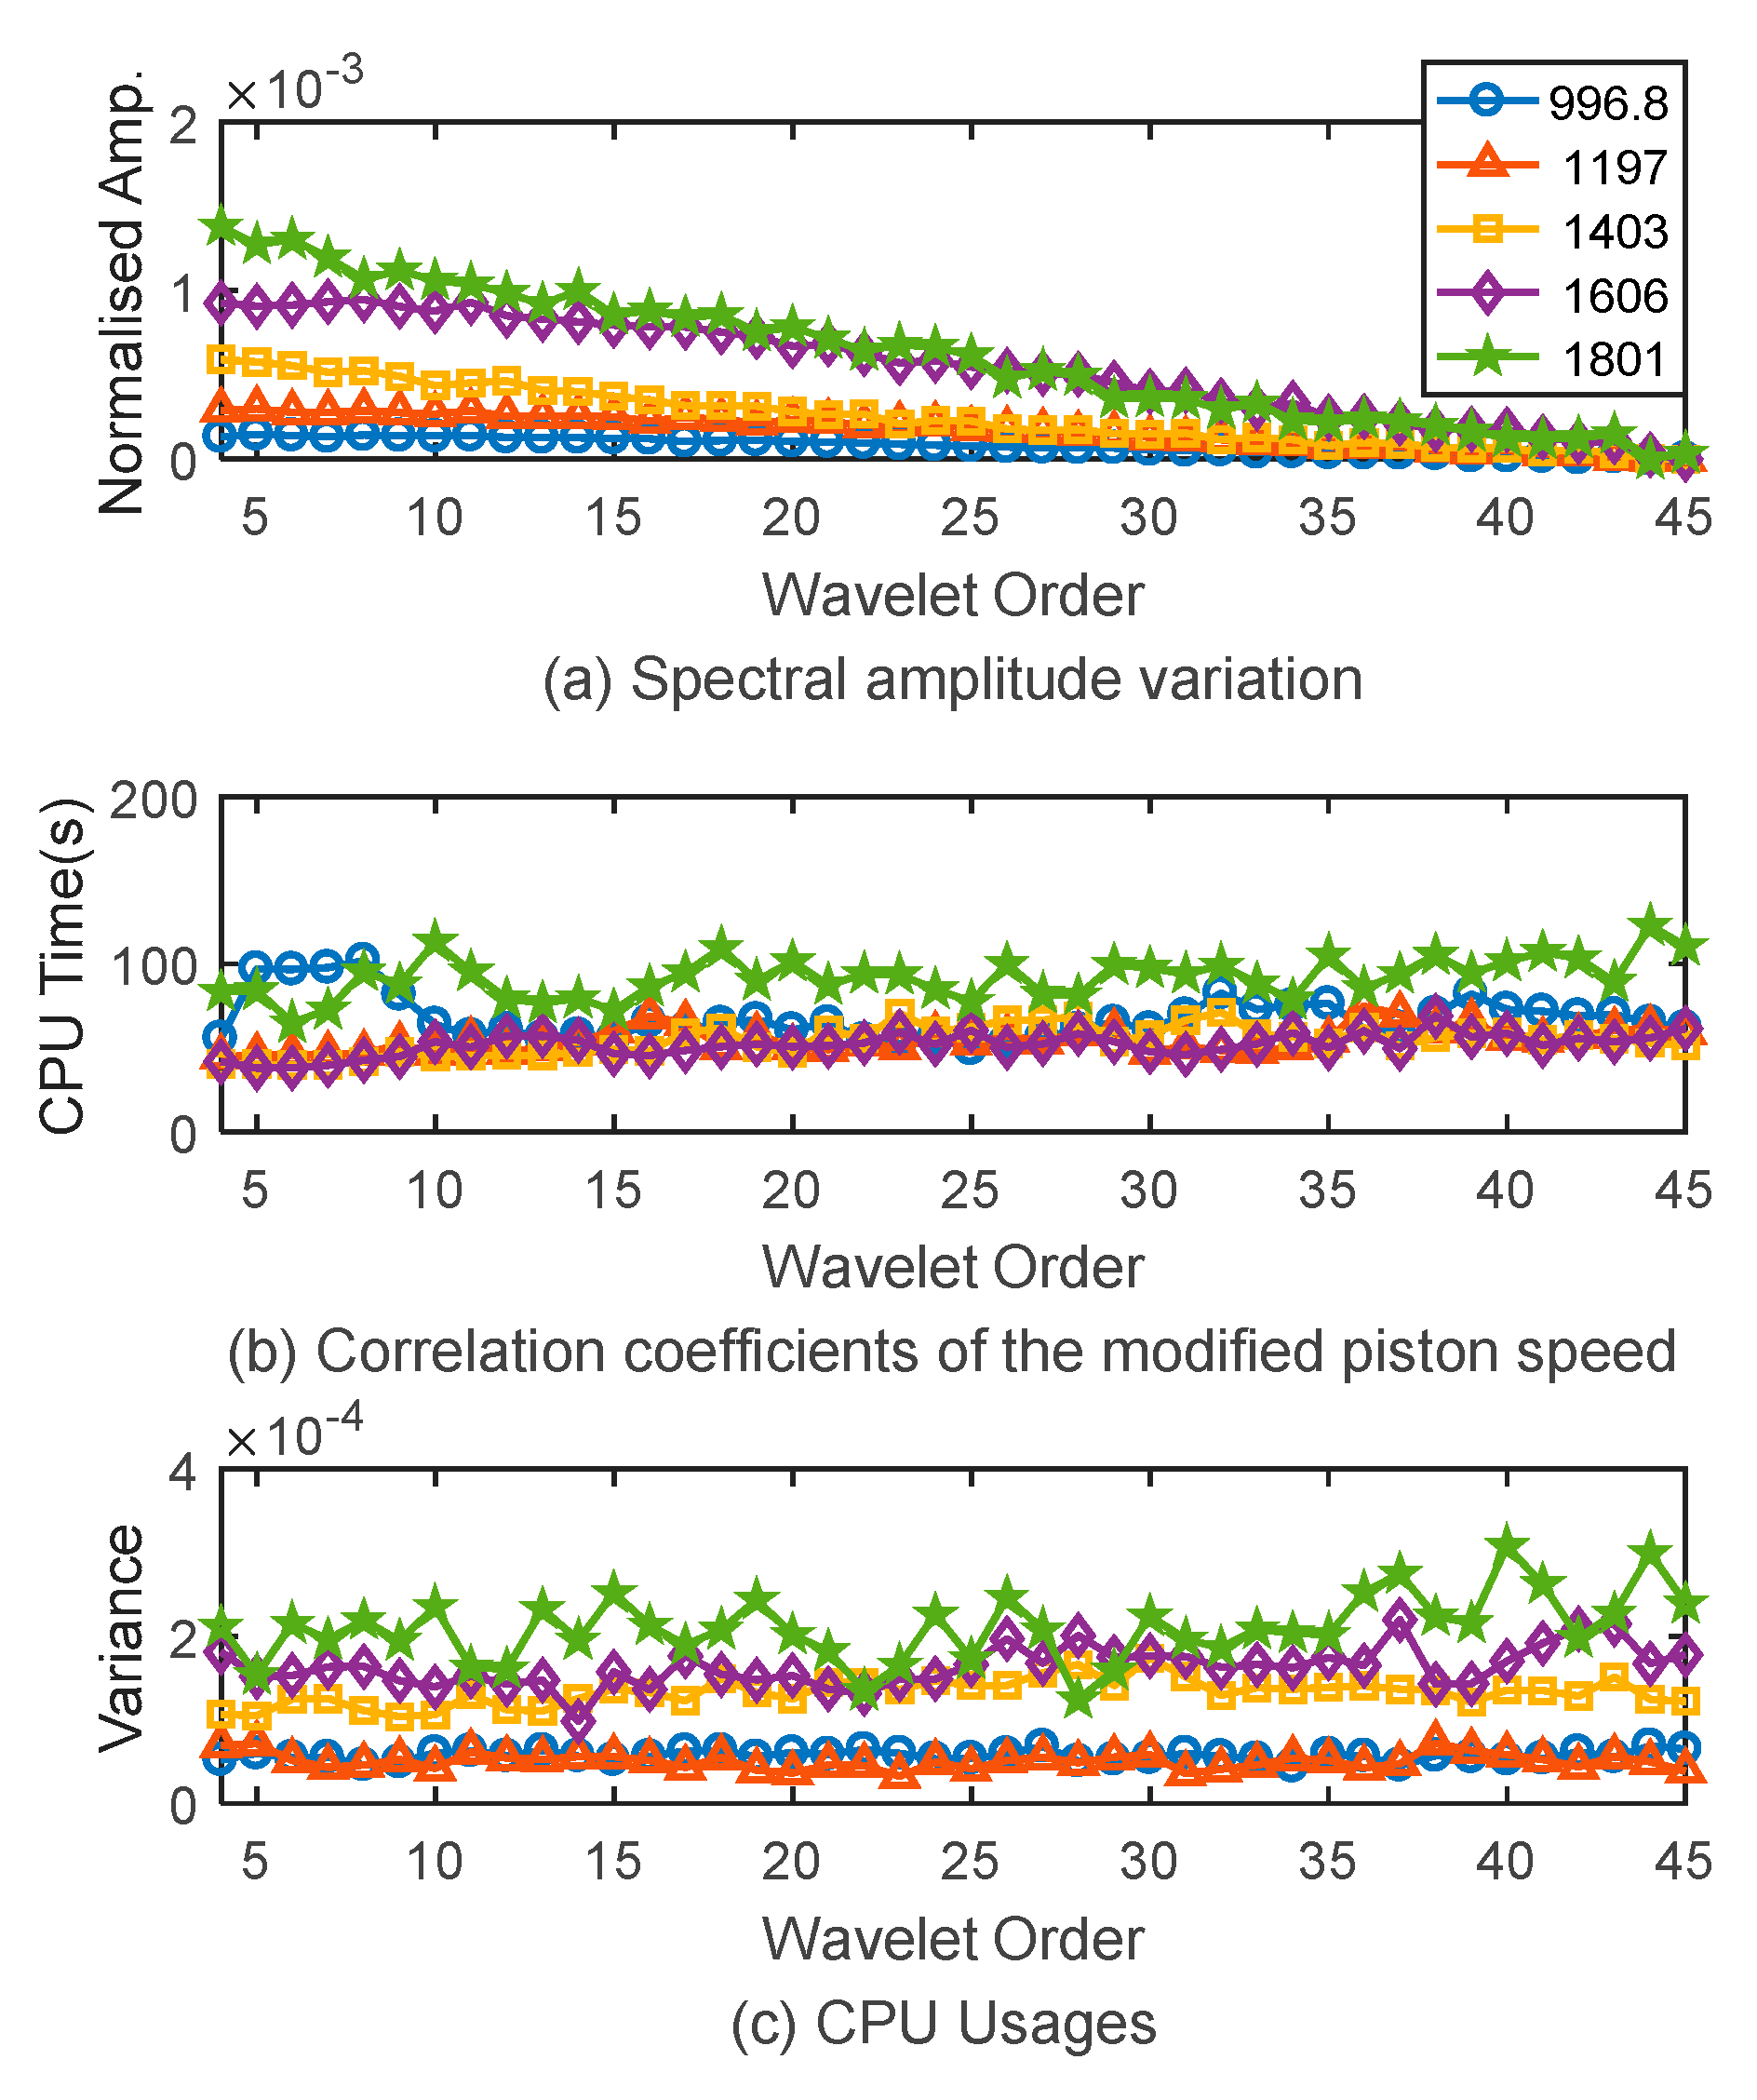
3.3.2. WPT Spectrum of AE Signals and Optimal Wavelet Basis

A Daubechies wavelet with order 35 is selected to identify the low amplitudes AE. The selection of wavelet basis is an important step to determine the effect of wavelet denoising. Daubechies wavelet has good symmetry and biorthogonality. The gradual attenuation profile is conducive to highlight the weak AE events with asymmetric characteristics and low amplitudes. Hence, Daubechies (db) wavelet is used.
To verify the effectiveness of AE thresholds to extract FAS–AE, WPT spectra of raw AE and threshold–AE are calculated for all different tested cases using db5 wavelet. The decomposition level for WPT is level 8 for a trial and error test. Figure 6 and Figure 7 show the typical WPT spectra for the baseline pure diesel with the lube-oil 10W30 running at different speeds at 10 Nm. In both above two figures, it can find some semi-continuous distinguished peaks in four discrete frequency bands: 40–60 kHz, 70–90 kHz, 140–160 kHz, and 170–190 kHz. These AE events that emerged around each middle stroke in narrow frequency bands are correlating to FAS–AE according to the analysis of Section 3.1.
It should be noted that some little high irregularly AE peaks are accompanied by the FAS–AE in Figure 6 compared with Figure 7. These small bursts may be aroused by the AAC effects owing to the unevenness of the oil film thickness between the piston ring and cylinder liner surface at high sliding speeds. Hence, the threshold–WPT spectra analysis in Figure 7 provides a new way to differ FAS–AE from the other AE sources. Besides, the AE spectra around the low-frequency range (<40 kHz) were possibly less connected with the tribological–AE between the ring and liner with too irregularly high AE spikes.
Based on the critical understanding of WPT spectrum analysis, the optimal wavelet base selection principle which is according to the energy of signals is not suitable in this situation. Hence, a new criterion for the optimal order in Daubechies wavelet family is developed to submerge the wake signals from a strong background noise. For doing so, an average amplitude criterion is established in the time-frequency domain of a WPT spectrum as:
W ¯ = 1 K k = 1 K 1 N n = 1 N W k n ( Y i k ) 2 ,
where n is the frequency index which covers a frequency range from 40 to 200 kHz within which the spectral amplitudes at the four frequencies are more significant, and k is the index for engine cycles. The correlation coefficient between and modified piston speed curve was calculated as one of the criteria to choose the suitable order of Daubechies wavelet.
In Figure 8, the average correlation amplitudes for different wavelet orders decline with the order increase and the correlation coefficients with the piston speed show very slight variations with the order increase. Therefore ‘db4’ is the maximal amplitudes with a shorter time for all the cases explored. Considering a slightly better smooth effect at the high order, the wavelet decomposition order is selected as ‘db5’ for further WP analysis in this study.
To select an optimal order for extracting weak AE signals, the average amplitude in the middle of the power stroke, correlation coefficients of the modified piston speed and the WPT spectrum, and the CPU computing time were chosen as an evaluation parameter. The baseline test case is the pure diesel with 10W30 oil.
Figure 8a illustrates the average amplitudes under each testing speed calculated by different wavelet orders which are from ‘db4’ to ‘db40’. The average correlation amplitudes for different wavelet orders decline with the order increase. Figure 8b shows the correlation coefficients of the WPT spectrum and the modified piston speed show very slight variations with the order increase. Moreover, the computation time of CPU is increasing linearly with wavelet orders as shown in Figure 8c therefore ‘db4’ is the maximal amplitudes with shorter time for all the cases explored. Considering a slightly better smooth effect at the high order, the wavelet decomposition order is selected as ‘db5’ for further WP analysis in this study.

3.3.3. Optimal Threshold–WP Based on the Auto-Correlation Analysis of the Piston Velocity

Autocorrelation analysis has great performance in noise cancellation by retaining periodic components to increase the signal-to-noise ratio (SNR) [53]. It is difficult to extract the steady and periodic AE components correlated to engine tribological behaviors because of the unknown characteristics in a non-stationary system. The AE modeling studies show that the FAS–AE are closely related to the piston speed. This FAS–AE feature provides an opportunity to increase the SNR of the denoising WPT approach for the tribological AE analysis.
According to the results of wavelet packet decomposition, four frequency bands are selected to denoise the semi-continuous signal. The Daubechies wavelet basis function ‘db4’ is selected. To obtain a finer angle-frequency domain analysis result, the autocorrelation coefficients between the WPT spectrum of different frequency sequence and the modified piston curve were calculated as follows:
ρ ( W ¯ , V p i ) = cov ( W ¯ , V i ) σ W ¯ σ V i ,
where Vi is the modified piston speed V i = s i g n ( v p i ) ; cov ( W ¯ , V i ) is covariance of W ¯ and V i ; σ W ¯ and σ V i are the standard deviation of W ¯ and V i .
Figure 9 shows the correlation coefficients of four selected bands under different working conditions with the baseline diesel–10W30. The correlation between the two variables is low when the correlation coefficient is less than 0.3. The WPT spectrum in the band 170–190 kHz has the lowest correlation to the piston speed which is less than 0.3 under most working conditions. That indicates the AE spectrum is less correlated to the FAS effect. Therefore, the frequency bands: 40–60 kHz, 70–90 kHz, 140–160 kHz were chosen as the target bands.
With applying this adaptive threshold method to AE signals, anther diagnostic parameters should not be neglect to reflect AAC effects corresponding to ML and HL regimes. The AAC–AE was observed in the WPT spectrum analysis as given in Figure 6 and Figure 7. These AE bursts with tiny higher amplitudes than FAS–AE can be obtained the wavelet coefficients by subtracting between two sets of x i k and Y i k . Specifically, it is calculated by:
R W = 1 K k = 1 K 1 N 1 N W k n ( x i k Y i k ) 2 ,
where N is the frequency index which covers a frequency range from 40–200 kHz. The average residual wavelet packets coefficient can represent better the locally non-stationary AE bursts reflecting more AAC effects.
To evaluate tribological impact using AE, AE signals are de-noised with an adaptive threshold–WPT approach, which is summarized as following key steps:
  • Apply the threshold given by Equation (2) to suppress the non-stationary AE bursts in the middle of the strokes; calculate the d value obtained Equation (4), and judge whether di − di−1 ≥ 0, otherwise reduce the iteration coefficient ci, and repeat step 1;
  • Apply WPT to threshold–AE signals (K = 20 for the limited memory in the PC used) with analysis parameters: J = 8 and ‘db5’.
  • Calculate the correlation coefficients between the envelope of WPT spectrums W ¯ and modified piston speed V p i , remove the frequency band with a low correlation which ρ ( W ¯ , V p i ) is less than 0.3;
  • Calculate the residual WP coefficient RW as given in Equation (8) from 40–200 kHz to remove the noise of other sources.
  • Perform inverses WPT to reconstruct the AE signals in the selected frequency bands; calculate the average envelope of 20 reconstructed signals of selected frequency bands, to enhance the similarity to the velocity profile sum the envelope signal matrix;
  • Select the local sequence in the middle of each stroke, calculate the mean standard deviation for 20 working cycles as the FAS–AE indicator and AAC–AE indicator for four strokes.

4. Diagnosis of AL Fuel Tribological Impact

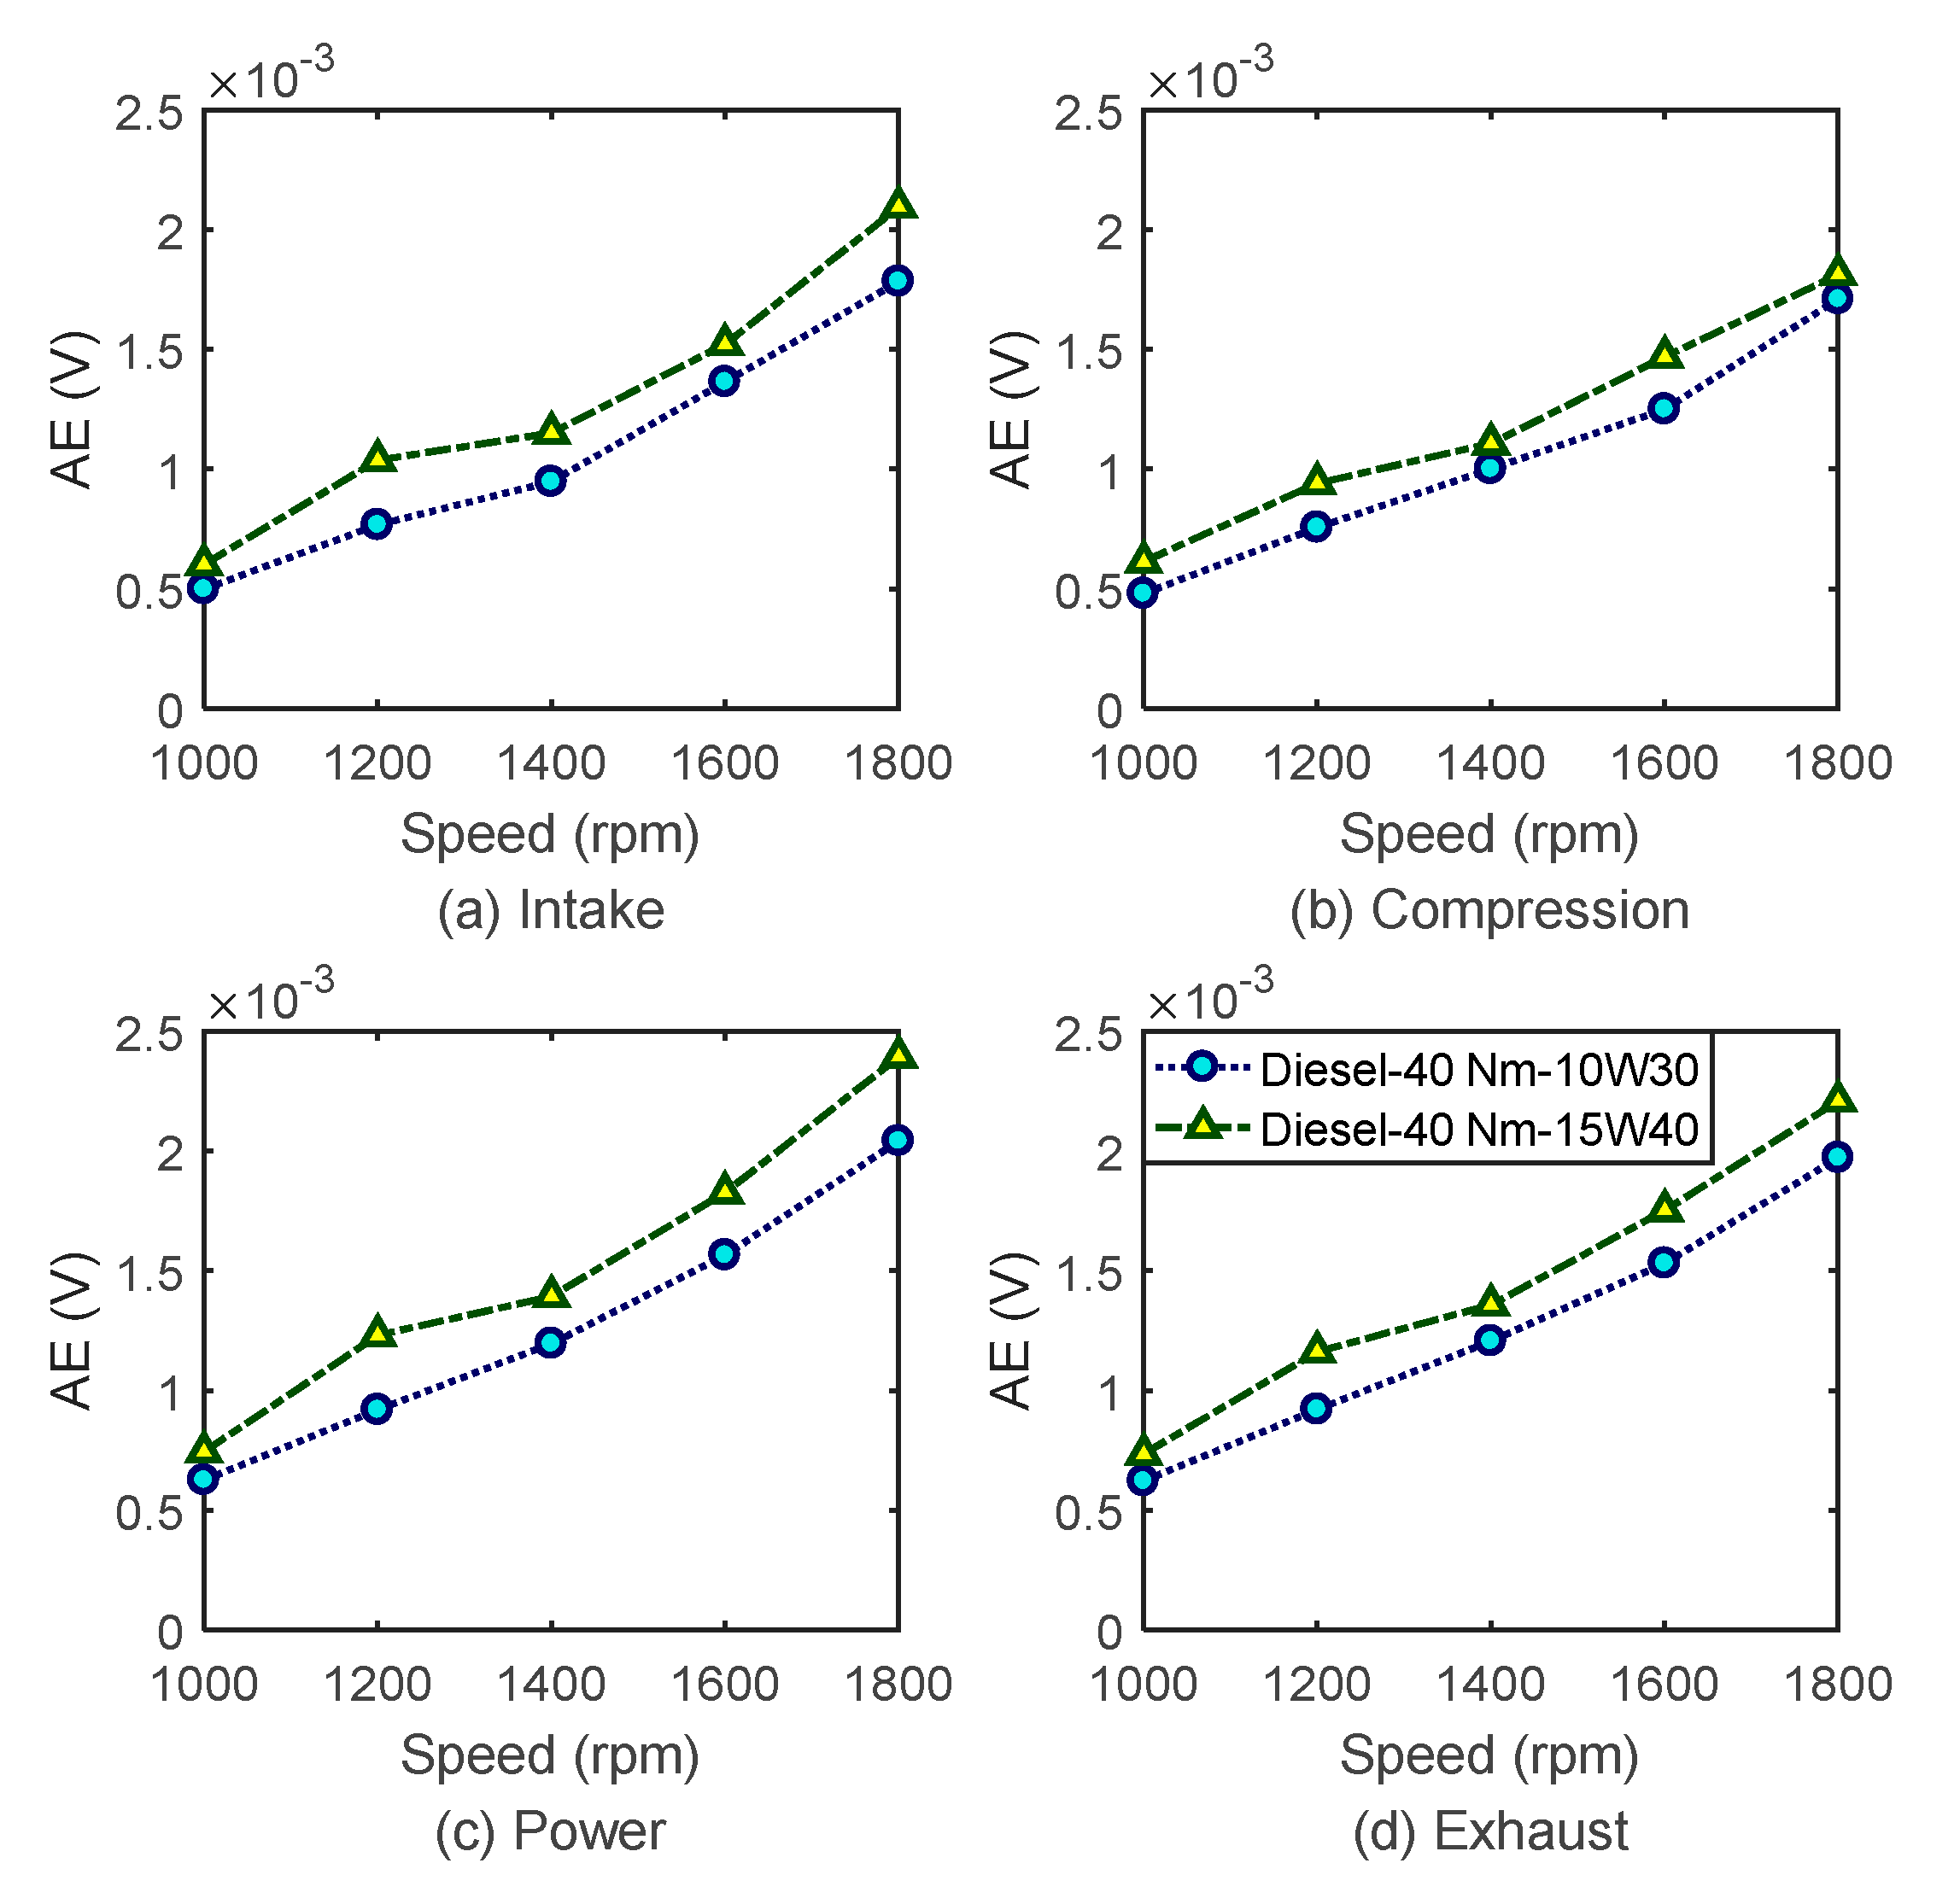
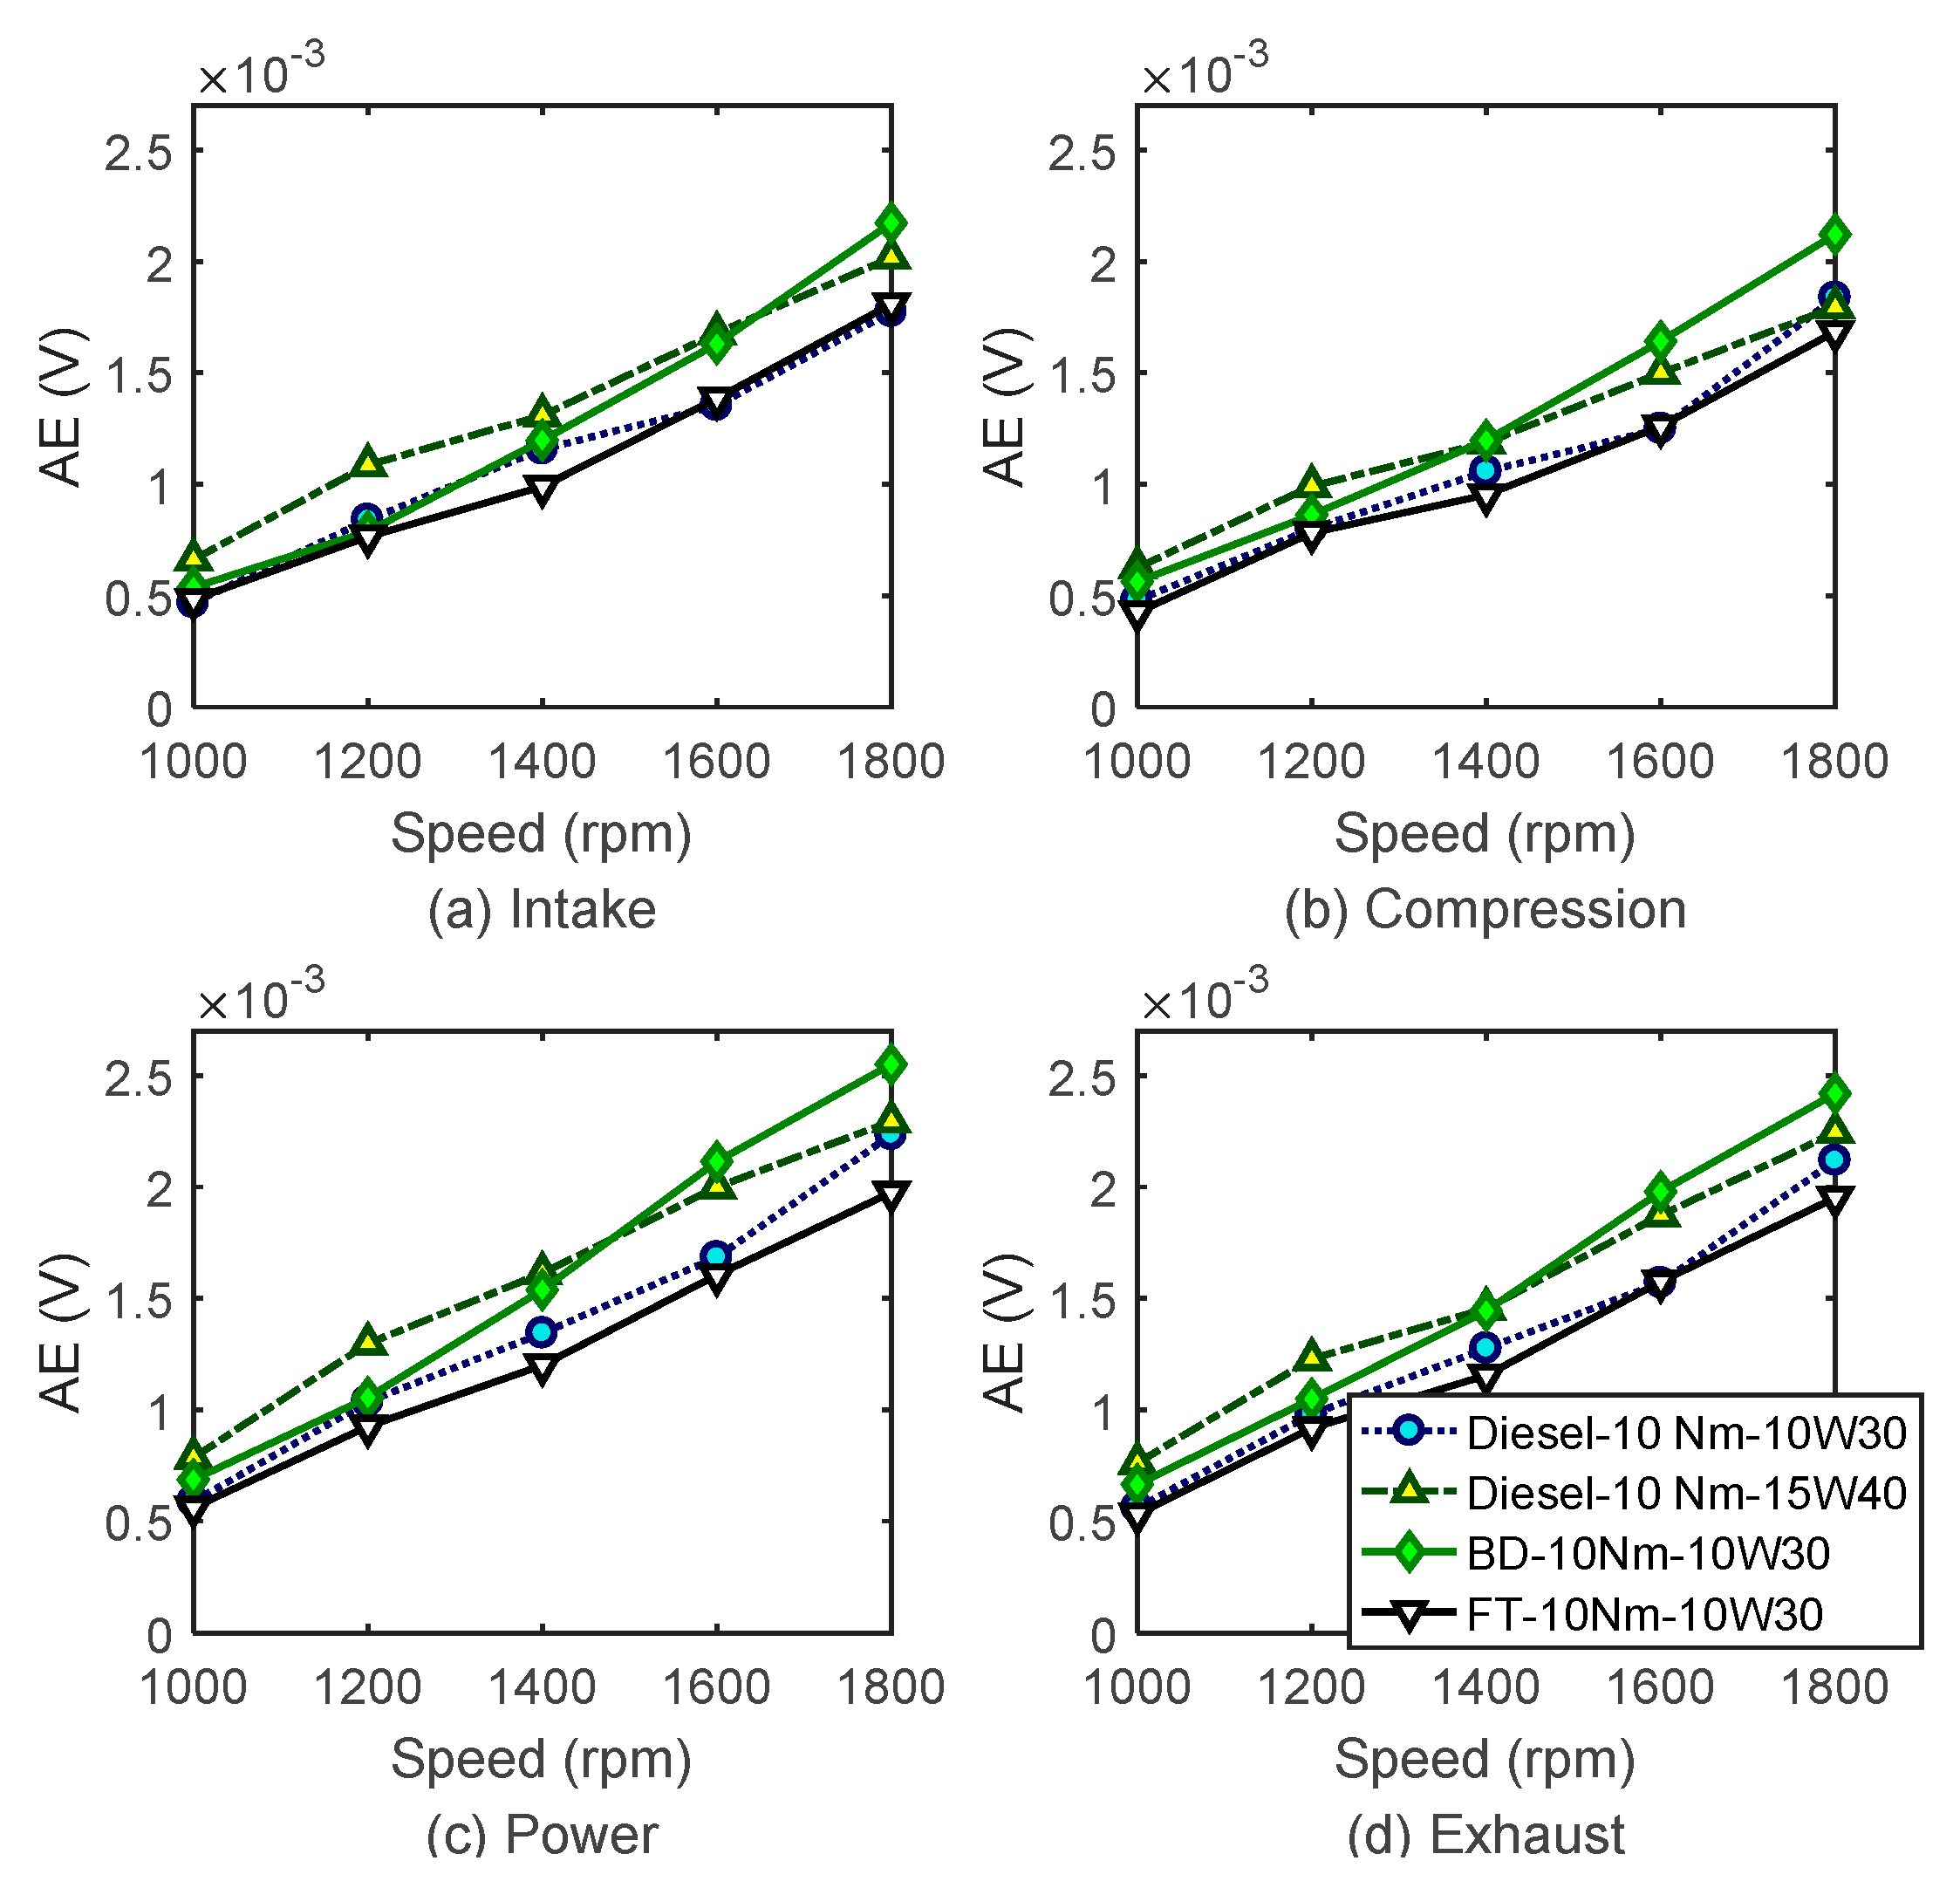
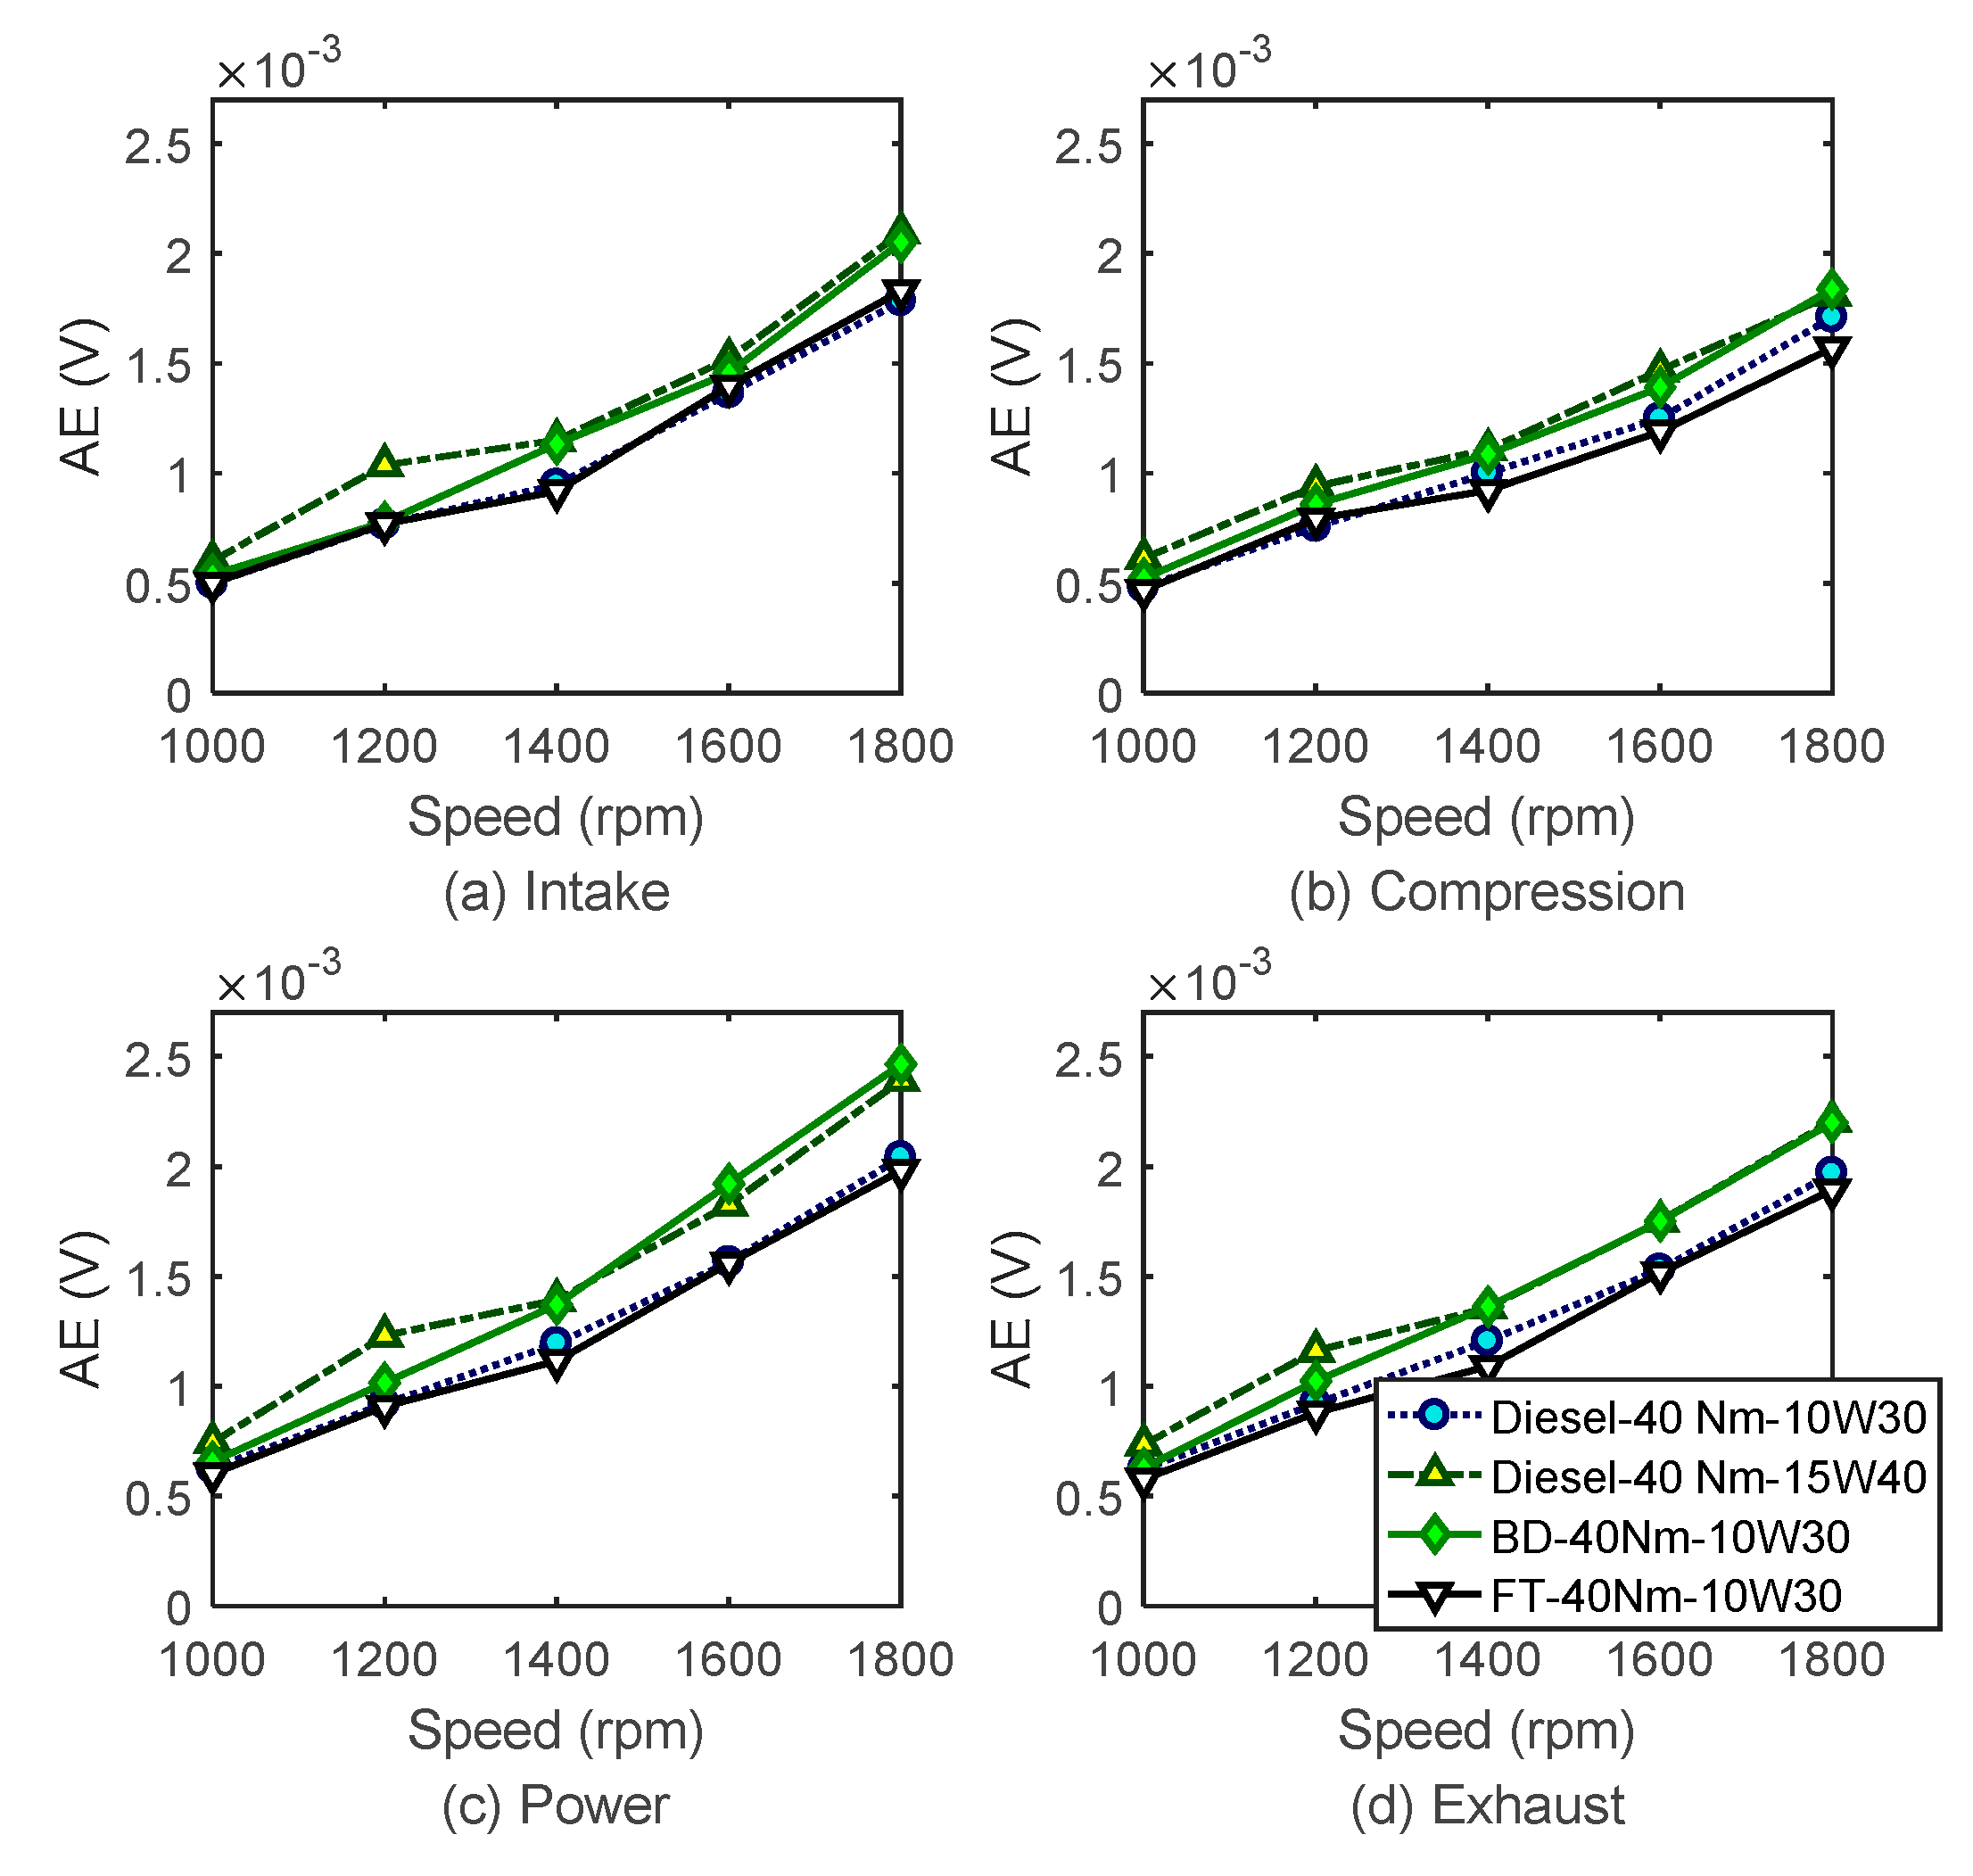
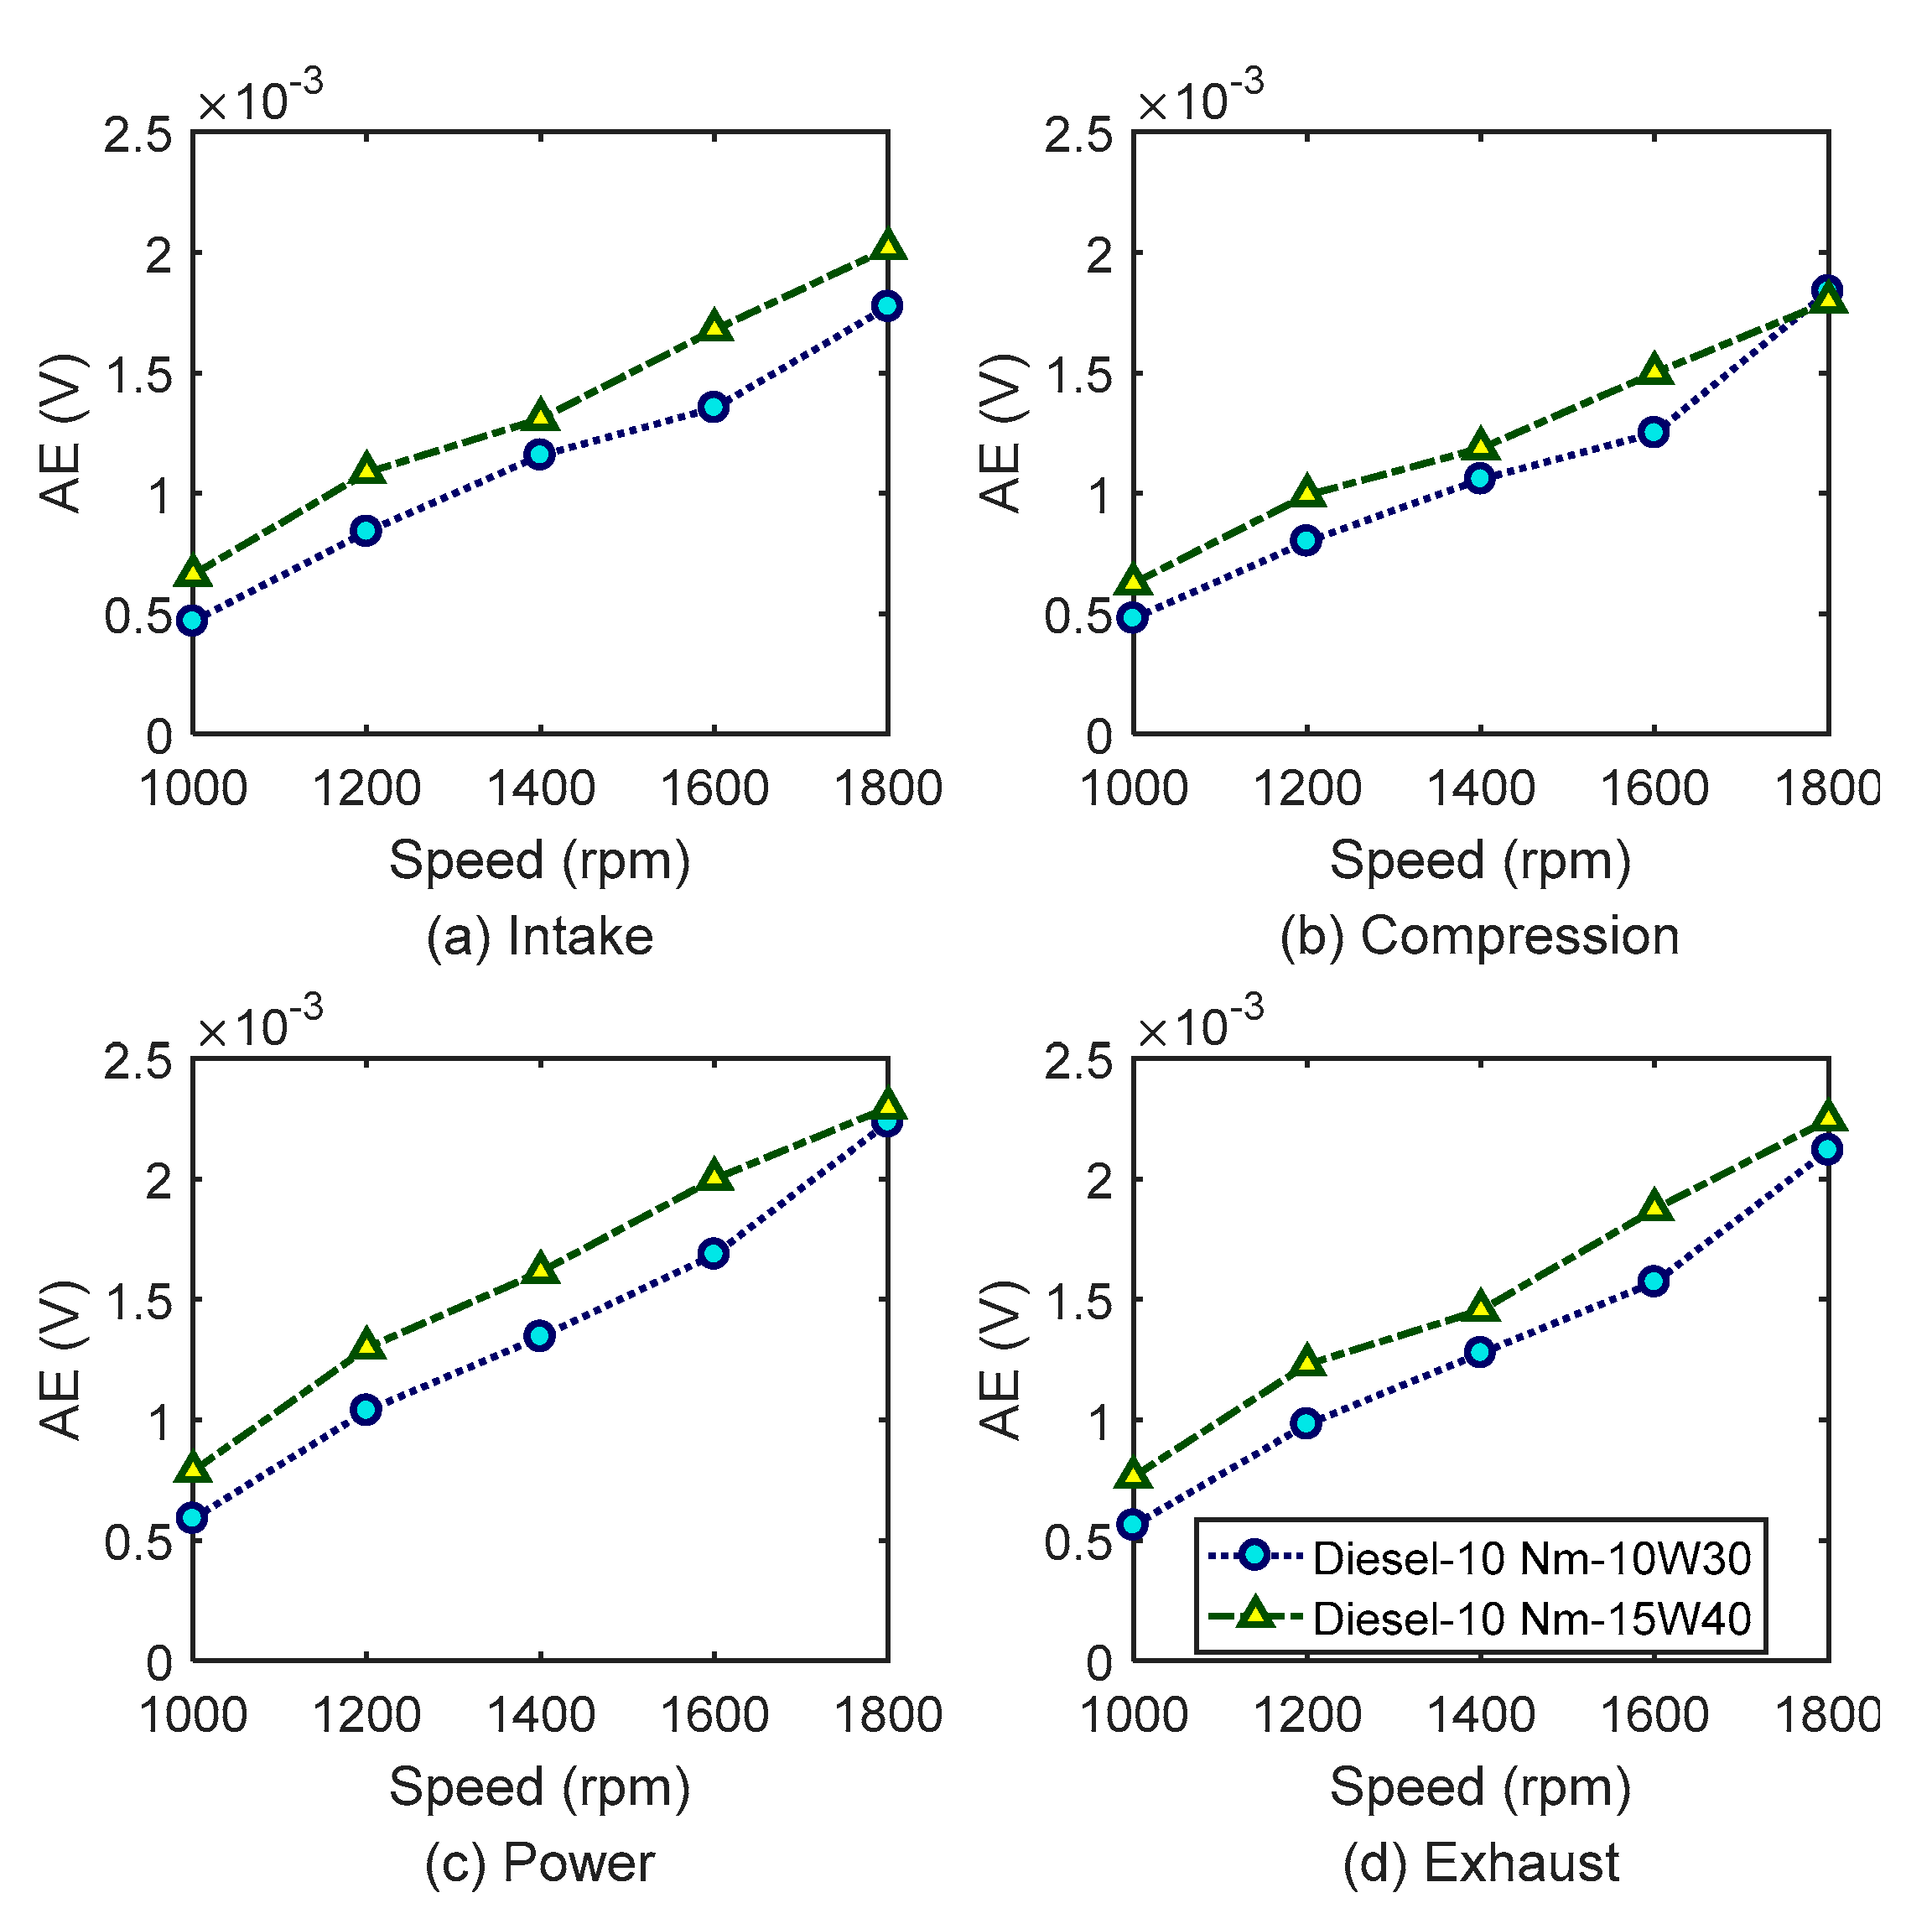
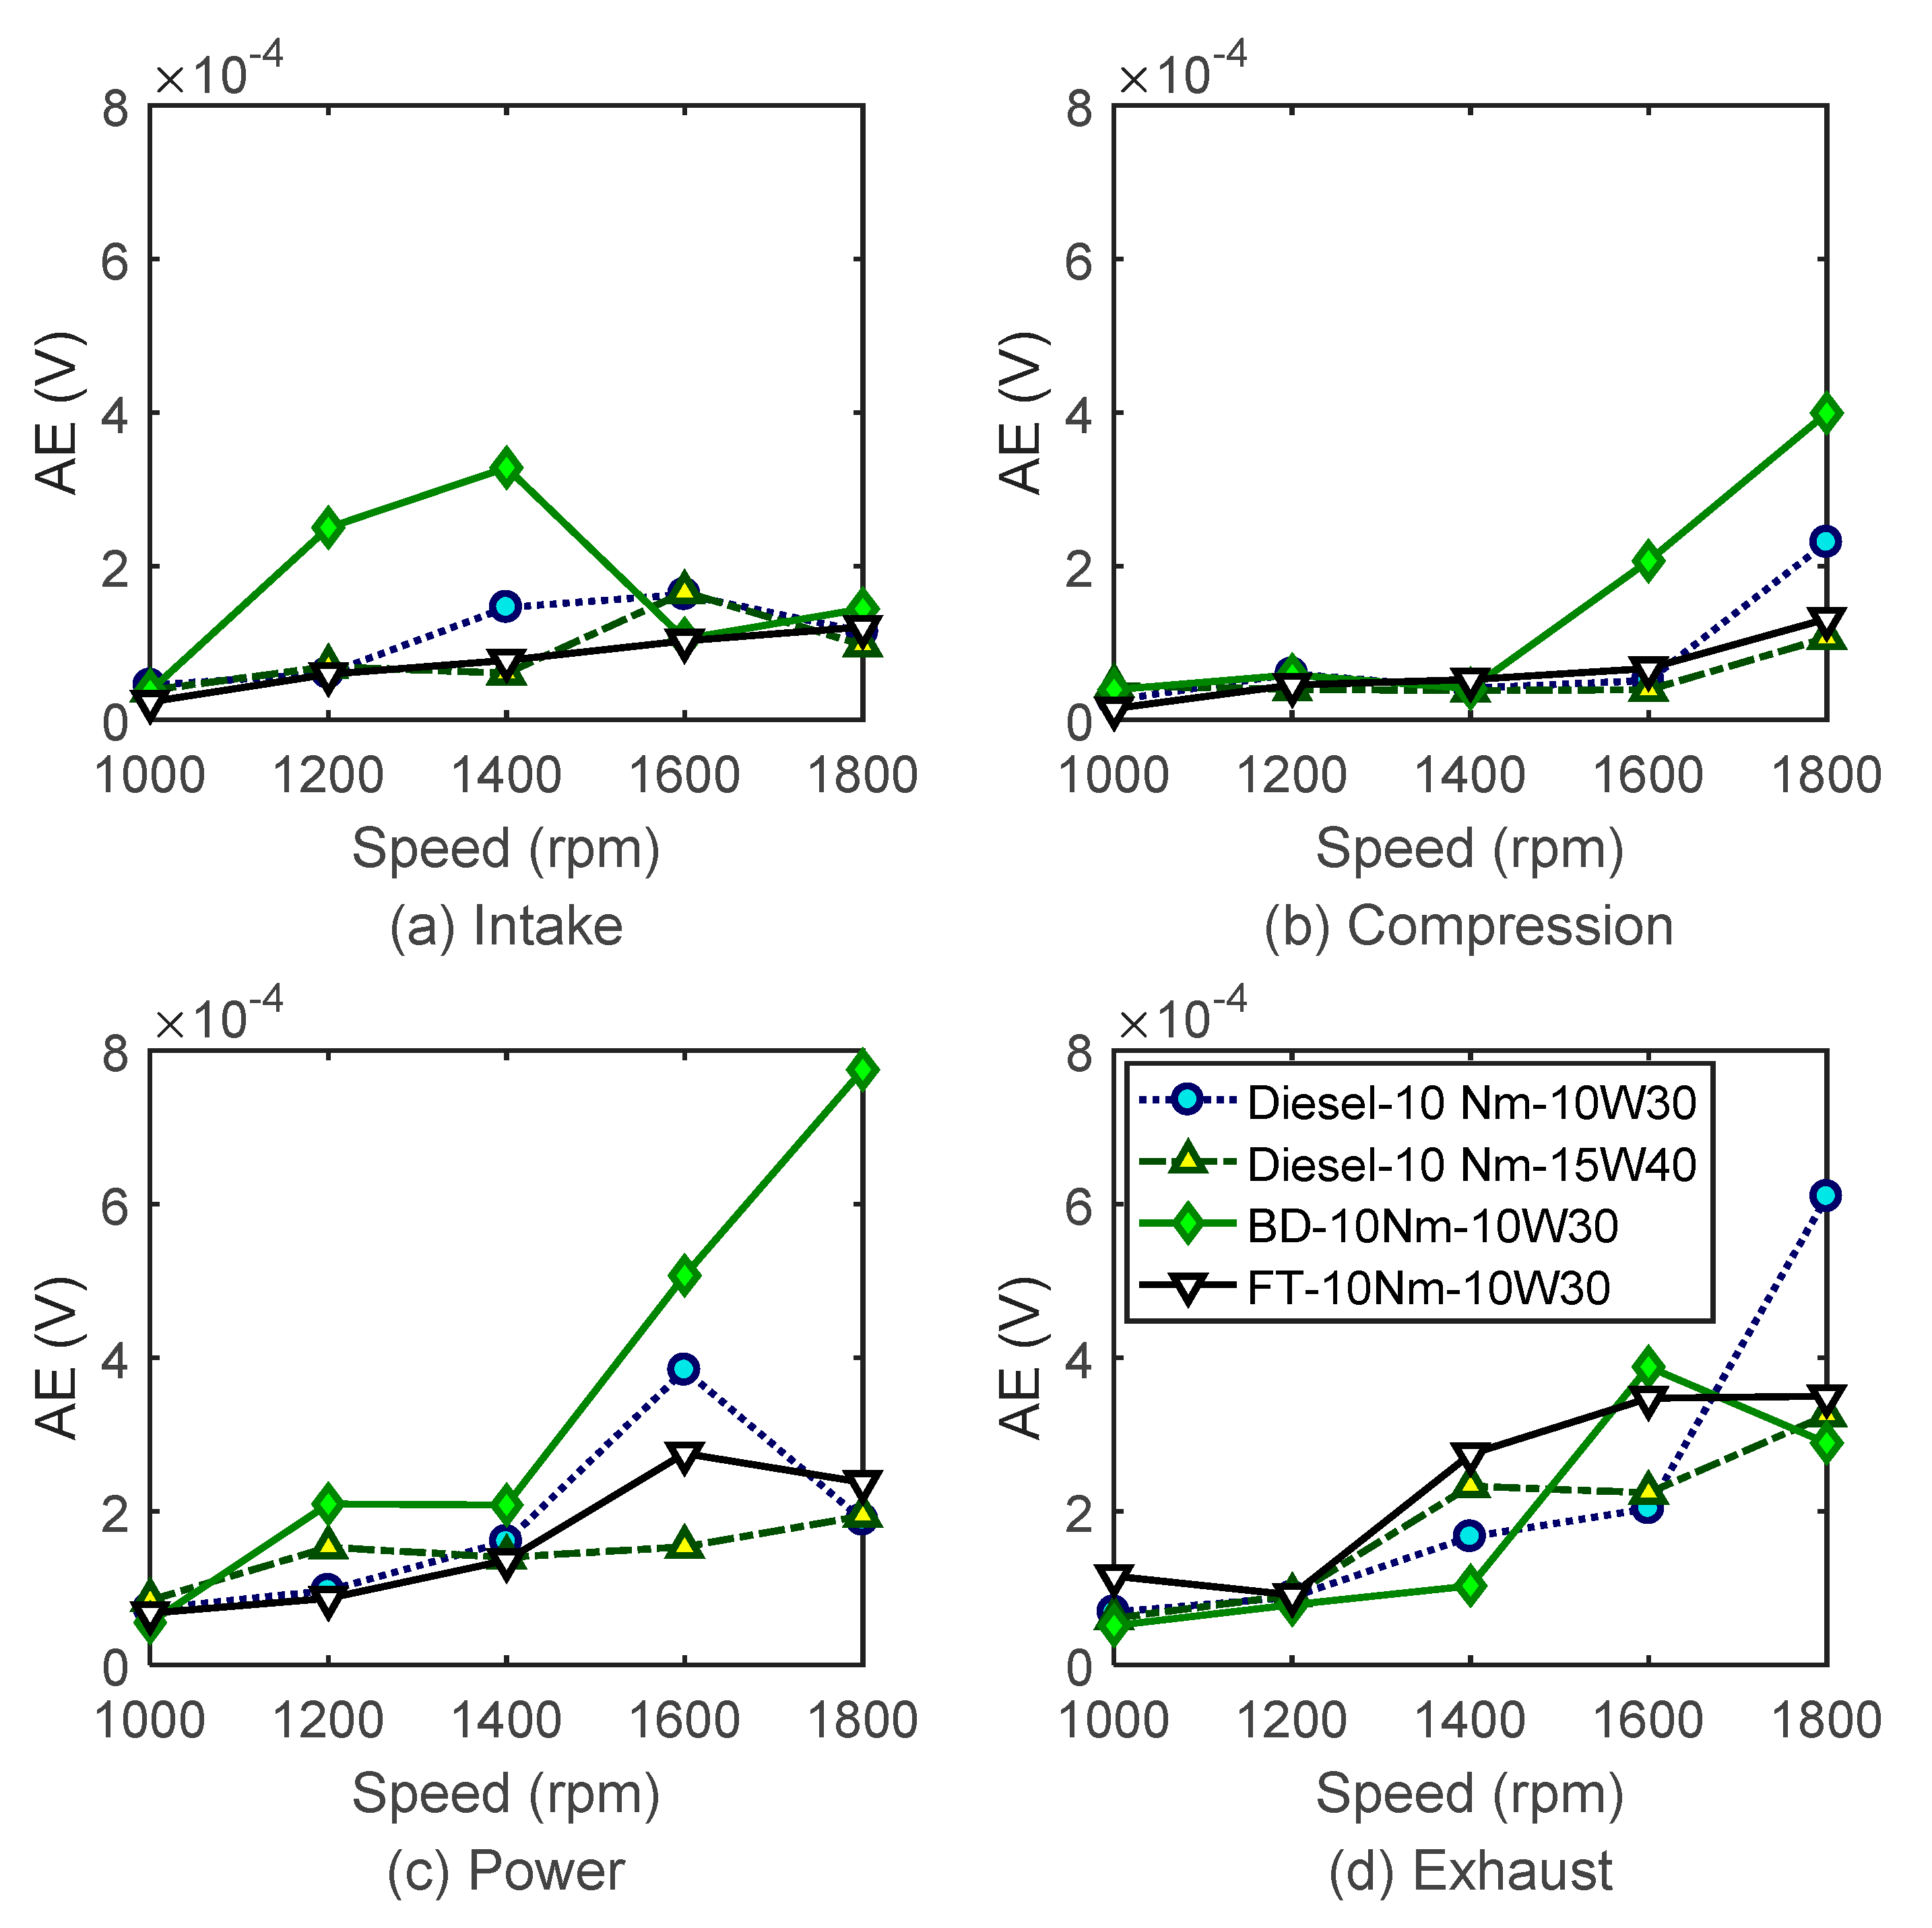
4.1. Diagnosis of Alternatives and the Baselines with FAS Effects

Figure 10 and Figure 11 show the differences of FAS–AE indicators between two baselines: 15W40 and 10W30. AE signals for 15W40 oil with higher viscosity exhibit greater amplitudes than 10W30 with lower viscosity. It shows that AE signals are sufficiently sensitive to small changes in the properties of lubricants. Therefore, they can be based to detect and diagnose the FAS–AE effects of alternative fuels on engines.
Figure 12 and Figure 13 show the comparison of FAS–AE between different fuels under the two engine loads respectively. The AE responses of F–T diesel are similar to the diesel with the same type of lubricating oil (10W30) during all the strokes, except for power stoke under 10 Nm with tiny lower amplitudes than diesel. The FAS–AE indicators of biodiesel show higher amplitudes than the diesel with 10W30 oil. The AE indicators are similar to the diesel with 15W40 oil even with a higher response up to 1600 rpm under 10 Nm. It indicates that these two alternative fuels produce little negative influences on FAS effects for most operating conditions.
The FAS–AE exhibits the impacts on the lubricity of the oil film fueling the alternatives. Too high FAS–AE indicates high power consumption to overcome viscous friction using AL fuel, and too low FAS–AE shows the viscosity. of oil film decreasing when using AL fuels.

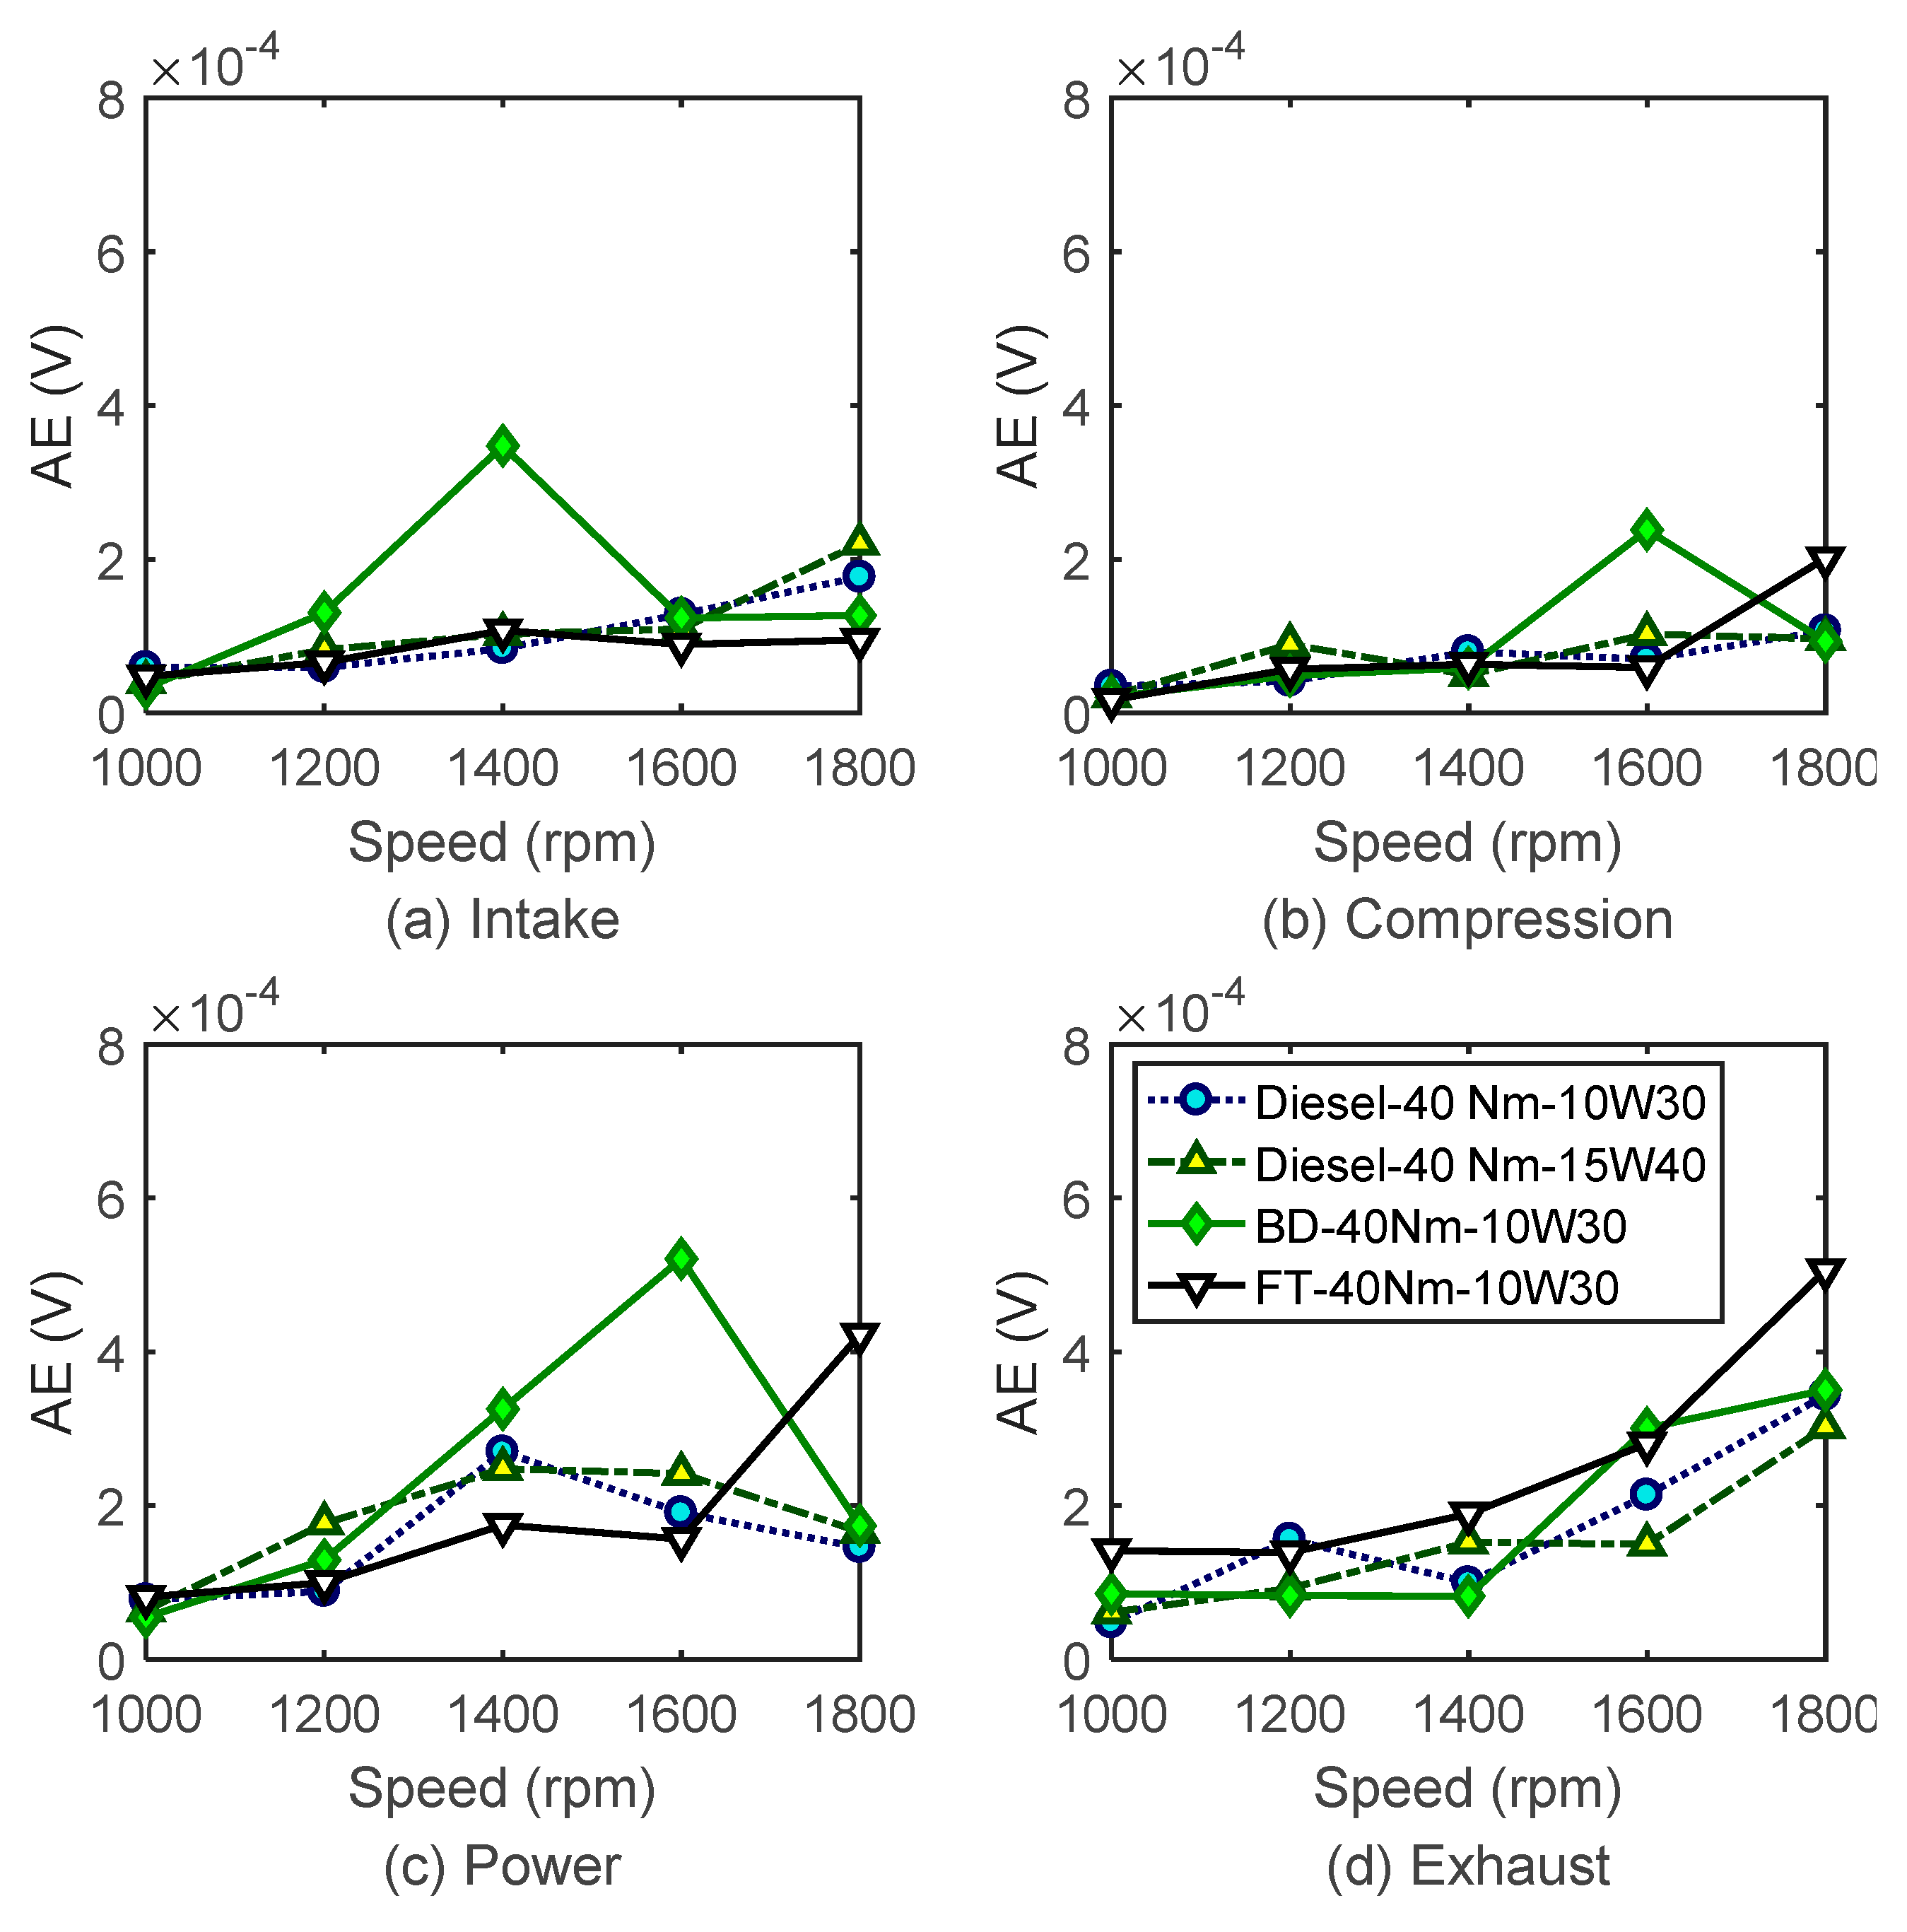
4.2. Diagnosis with AAC Effects

Figure 14 and Figure 15 show the AAC–AE indicators of different alternative fuels under different loads. The AAC–AE trends are unstable at speeds. Especially, the AAC–AE of biodiesel has high values in the power stroke and exhaust stroke. This can indicate that the combustions of these alternative fuels are less perfect. Reference [47] suggested that the particles fuelling biodiesel were higher than fuelling diesel. The particles generate immediately after combustion in which the instantaneous temperatures are relatively high. Hence, more AAC effects are caused by the particles adhered to the lubrication surfaces. Therefore, between the two alternative fuels, biodiesel produces more impact because it has higher AAC–AE responses, which occur at high speeds due to high temperatures.
The diagnosis of AAC–AE indicator shows a slight abnormality accompanied by FAS reaction. This demonstrates the potential of using AE to conduct a comprehensive analysis of the tribological effects of alternative fuels.

5. Conclusions

The AE signals can reflect the dynamic information of tribology behavior of engines by AAC–AE and FAS–AE. Around the middle of each stroke, significantly higher sliding speed leads to more hydrodynamic lubrication in which little AAC can occur, but high AE activities arise mainly from the FAS effects. A new adaptive threshold–wavelet packet analysis was proposed as an effective tool to extract the tribological AE from the ring–liner contact surface with more details. The FAS–AE indicator was acquired by the mean envelops of the reconstructed WP coefficients in several frequency bands: 40–60 kHz, 70–90 kHz, and 140–160 kHz, because of a higher correlation of these bands towards the piston speed than 170–190 kHz. The AAC–AE indicator was acquired by the difference between raw WP coefficients and threshold WP coefficients from 40 kHz to 200 kHz. Therefore, the two indicators based on two classical AE generation mechanism on the sliding surface can give a comprehensive evaluation of the tribological impacts of AL fuel as follows.
  • The FAS–AE indicators are increased with speed and viscosity increasing. The AAC–AE is less significant using diesel than using biodiesel.
  • The developed FAS–AE indicators from AE signals for biodiesel show tiny higher than the baseline diesel with the same lubricant 10W30 and similar to the baseline using oil 15W40. The developed FAS–AE of F–T diesel is close to the baseline diesel using 10W30.
  • The FAS–AE exhibits the impacts on the lubricity of the oil film fueling the alternatives. Too high FAS–AE indicates high power consumption to overcome viscous friction using AL fuel, and too low FAS–AE shows the decreasing the lubricity of oil film using AL fuels.
  • Biodiesel produces more AAC impacts with higher AAC–AE responses than F–T diesel, which occurs at high speeds due to high temperatures and more particles after combustion than diesel.
  • The AL fuel diagnosis of AAC–AE indicator shows a slight abnormality accompanied by FAS. That demonstrates the potential of AE to conduct a comprehensive analysis of the tribological effects of alternative fuels.

Author Contributions

N.W. and F.G. were involved in the full process of producing this paper including modelling, test designing, data processing and preparing the manuscript. Z.C. and Y.X. provided valuable comments for improving the model and test design, A.B. reviewed the model and improved data process and edited the manuscript at all stages. All authors have read and agreed to the published version of the manuscript.

Funding

This research was funded by the National Natural Science Foundation of China (grant number 51375326), the Natural Science foundation of Shanxi (grant number 201901D211286), the Scientific and Technological Innovation Programs of Higher Education Institutions in Shanxi (grant number 2020L0350) and the Doctor Research Foundation of Taiyuan University of Science and Technology (grant number 20192017).

Institutional Review Board Statement

Not applicable.

Informed Consent Statement

Not applicable.

Data Availability Statement

The data are not publicly available due to privacy.

Acknowledgments

Thanks are due to Guoxing Li, Jie Zhao, Huanhuan Wang, Haoyu Lu, Xingchen Lu, Hu Zhang and Xuan Dang, of Taiyuan University of Technology, for their help in the testing.

Conflicts of Interest

The authors declare no conflict of interest.

List of Abbreviations

AACAsperity–Asperity Collision
AEAcoustic Emission
BDCBottom Dead Centre
BLBoundary Lubrication
DWTDiscrete Wavelet Transform
dbDaubechies
EVOExhaust Valve Opening
EVCExhaust Valve Closing
FASFluid–Asperity Shearing
HLHydrodynamic Lubrication
ICInternal Combustion
IVOInlet Valve Opening
IVCInlet Valve Closing
MLMixed Lubrication
STFTShort-Time Fourier Transform
TDCTop Dead Centre
WPTWavelet Packet Transform
WPWavelet Packets

References

  1. Qu, J.; Truhan, J.J.; Blau, P.J.; Meyer, H.M. Scuffing transition diagrams for heavy duty diesel fuel injector materials in ultra low-sulfur fuel-lubricated environment. Wear 2005, 259, 1031–1040. [Google Scholar] [CrossRef]
  2. Tesfa, B.; Gu, F.; Mishra, R.; Ball, A. Emission Characteristics of a CI Engine Running with a Range of Biodiesel Feedstocks. Energies 2014, 7, 334–350. [Google Scholar] [CrossRef]
  3. Ramadhas, A.; Muraleedharan, C.; Jayaraj, S. Performance and emission evaluation of a diesel engine fueled with methyl esters of rubber seed oil. Renew. Energy 2005, 30, 1789–1800. [Google Scholar] [CrossRef]
  4. Shahabuddin, M.; Masjuki, H.; Kalam, M.; Mofijur, M.; Hazrat, M.; Liaquat, A. Effect of Additive on Performance of C.I. Engine Fuelled with Bio Diesel. Energy Procedia 2012, 14, 1624–1629. [Google Scholar] [CrossRef] [Green Version]
  5. Agarwal, A.K.; Das, L.M. Biodiesel Development and Characterization for Use as a Fuel in Compression Ignition Engines. J. Eng. Gas Turbines Power 2001, 123, 440–447. [Google Scholar] [CrossRef]
  6. Carraretto, C. Biodiesel as alternative fuel: Experimental analysis and energetic evaluations. Energy 2004, 29, 2195–2211. [Google Scholar] [CrossRef]
  7. Cheng, A.S.; Dibble, R.W. Emissions Performance of Oxygenate-in-Diesel Blends and Fischer-Tropsch Diesel in a Compression Ignition Engine; SAE Technical Paper: Warrendale, PA, USA, 1999. [Google Scholar] [CrossRef]
  8. Schaberg, P.W.; Myburgh, I.S.; Botha, J.J.; Khalek, I.A. Comparative Emissions Performance of Sasol Fischer-Tropsch Diesel Fuel in Current and Older Technology Heavy-Duty Engines; SAE Technical Paper: Warrendale, PA, USA, 2000. [Google Scholar] [CrossRef]
  9. Alleman, T.L.; Mccormick, R.L. Fischer-Tropsch Diesel Fuels—Properties and Exhaust Emissions: A Literature Review; SAE International: Warrendale, PA, USA, 2003. [Google Scholar]
  10. Vicente, G.; Coteron, A.; Martinez, M.; Aracil, J. Application of the factorial design of experiments and response surface methodology to optimize biodiesel production. Ind. Crop. Prod. 1998, 8, 29–35. [Google Scholar] [CrossRef]
  11. Rahman, M.; Rasul, M.; Hassan, N.M.S. Study on the Tribological Characteristics of Australian Native First Generation and Second Generation Biodiesel Fuel. Energies 2017, 10, 55. [Google Scholar] [CrossRef]
  12. Haseeb, A.; Sia, S.; Fazal, M.; Masjuki, H. Effect of temperature on tribological properties of palm biodiesel. Energy 2010, 35, 1460–1464. [Google Scholar] [CrossRef]
  13. Gill, S.; Tsolakis, A.; Dearn, K.; Rodríguez-Fernández, J. Combustion characteristics and emissions of Fischer–Tropsch diesel fuels in IC engines. Prog. Energy Combust. Sci. 2011, 37, 503–523. [Google Scholar] [CrossRef]
  14. Fazal, M.; Haseeb, A.; Masjuki, H. Investigation of friction and wear characteristics of palm biodiesel. Energy Convers. Manag. 2013, 67, 251–256. [Google Scholar] [CrossRef]
  15. Sharma, B.K.; Rashid, U.; Anwar, F.; Erhan, S.Z. Lubricant properties of Moringa oil using thermal and tribological techniques. J. Therm. Anal. Calorim. 2009, 96, 999–1008. [Google Scholar] [CrossRef]
  16. Habibullah, M.; Masjuki, H.; Kalam, M.; Zulkifli, N.; Masum, B.; Arslan, A.; Gulzar, M. Friction and wear characteristics of Calophyllum inophyllum biodiesel. Ind. Crop. Prod. 2015, 76, 188–197. [Google Scholar] [CrossRef]
  17. Agarwal, A.K. Experimental investigations of the effect of biodiesel utilization on lubricating oil tribology in diesel engines. Proc. Inst. Mech. Eng. Part D J. Automob. Eng. 2005, 219, 703–713. [Google Scholar] [CrossRef]
  18. Peterson, C.L.; Thompson, J.L.; Zhang, X.; Hammond, B.L.; Beck, S. Development of Eapeseed Biodiesel for Use in High Speed Disesl Engines; Report to USDOE University of Idaho; University of Idaho: Moscow, ID, USA, 1996. [Google Scholar]
  19. Serrano, L.; Carreira, V.; Câmara, R.; Gameiro da Silva, M. On-road performance comparison of two identical cars consuming petrodiesel and biodiesel. Fuel Process. Technol. 2012, 103, 125–133. [Google Scholar] [CrossRef]
  20. Fraer, R.; Dinh, H.; Proc, K.; McCormick, R.L.; Chandler, K.; Buchholz, B. Operating Experience and Teardown Analysis for Engines Operated on Biodiesel Blends (B20); SAE Technical Paper: Warrendale, PA, USA, 2005. [Google Scholar] [CrossRef] [Green Version]
  21. Sundus, F.; Fazal, M.; Masjuki, H. Tribology with biodiesel: A study on enhancing biodiesel stability and its fuel properties. Renew. Sustain. Energy Rev. 2017, 70, 399–412. [Google Scholar] [CrossRef]
  22. Hu, E.; Xu, Y.; Hu, X.; Pan, L.; Jiang, S. Corrosion behaviors of metals in biodiesel from rapeseed oil and methanol. Renew. Energy 2012, 37, 371–378. [Google Scholar] [CrossRef]
  23. Hassan, M.B.H. Comparative corrosive characteristics of petroleum diesel and palm biodiesel for automotive materials. Fuel Process. Technol. 2010, 91, 1308–1315. [Google Scholar]
  24. Haseeb, A.; Masjuki, H.; Ann, L.; Fazal, M. Corrosion characteristics of copper and leaded bronze in palm biodiesel. Fuel Process. Technol. 2010, 91, 329–334. [Google Scholar] [CrossRef]
  25. Mthis, K.; Chmelk, F. Exploring Plastic Deformation of Metallic Materials by the Acoustic Emission Technique. In Acoustic Emission; Sikorski, W., Ed.; InTech: Rijeka, Croatia, 2012; ISBN 978-953-51-0056-0. [Google Scholar]
  26. Sánchez, R.-V.; Lucero, P.; Vásquez, R.E.; Cerrada, M.; Cabrera, D. A comparative feature analysis for gear pitting level classification by using acoustic emission, vibration and current signals. IFAC-PapersOnLine 2018, 51, 346–352. [Google Scholar] [CrossRef]
  27. Hutt, S.; Clarke, A.; Evans, H. Generation of Acoustic Emission from the running-in and subsequent micropitting of a mixed-elastohydrodynamic contact. Tribol. Int. 2018, 119, 270–280. [Google Scholar] [CrossRef]
  28. Poddar, S.; Tandon, N. Study of Oil Starvation in Journal Bearing Using Acoustic Emission and Vibration Measurement Techniques. J. Tribol. 2020, 142. [Google Scholar] [CrossRef]
  29. Mokhtari, N.; Pelham, J.G.; Nowoisky, S.; Bote-Garcia, J.-L.; Gühmann, C. Friction and Wear Monitoring Methods for Journal Bearings of Geared Turbofans Based on Acoustic Emission Signals and Machine Learning. Lubricants 2020, 8, 29. [Google Scholar] [CrossRef] [Green Version]
  30. Hase, A. Early Detection and Identification of Fatigue Damage in Thrust Ball Bearings by an Acoustic Emission Technique. Lubricants 2020, 8, 37. [Google Scholar] [CrossRef] [Green Version]
  31. Jiang, J.; Gu, F.; Gennish, R.; Moore, D.; Harris, G.; Ball, A. Monitoring of diesel engine combustions based on the acoustic source characterisation of the exhaust system. Mech. Syst. Signal Process. 2008, 22, 1465–1480. [Google Scholar] [CrossRef]
  32. Elamin, F.; Fan, Y.; Ball, A.; Gu, F. Diesel Engine Valve Clearance Detection Using Acoustic Emission. Adv. Mech. Eng. 2010, 2, 495741. [Google Scholar] [CrossRef]
  33. Albarbar, A.; Gu, F.; Ball, A. Diesel engine fuel injection monitoring using acoustic measurements and independent component analysis. Measurement 2010, 43, 1376–1386. [Google Scholar] [CrossRef] [Green Version]
  34. Khurshudov, A.G.; Talke, F.E. A Study of Subambient Pressure Tri-Pad Sliders Using Acoustic Emission. J. Tribol. 1998, 120, 54–59. [Google Scholar] [CrossRef]
  35. Lee, D.-Y.; Lee, J.; Hwang, J.; Choa, S.-H. Effect of relative humidity and disk acceleration on tribocharge build-up at a slider–disk interface. Tribol. Int. 2007, 40, 1253–1257. [Google Scholar] [CrossRef]
  36. Deshpande, P.; Pandiyan, V.; Meylan, B.; Wasmer, K. Acoustic emission and machine learning based classification of wear generated using a pin-on-disc tribometer equipped with a digital holographic microscope. Wear 2021, 203622. [Google Scholar] [CrossRef]
  37. Douglas, R.; Steel, J.; Reuben, R. A study of the tribological behaviour of piston ring/cylinder liner interaction in diesel engines using acoustic emission. Tribol. Int. 2006, 39, 1634–1642. [Google Scholar] [CrossRef]
  38. Shuster, M.; Combs, D.; Karrip, K.; Burke, D. Piston Ring Cylinder Liner Scuffing Phenomenon Studies Using Acoustic Emission Technique; SAE Technical Paper 2000-01–1782; SAE International: Warrendale, PA, USA, 2000. [Google Scholar]
  39. Wei, N.; Ball, A.; Gu, F. A Study of Alternative Fuels Potential Effects on the Combustion Engines using acoustic emission. In Proceedings of the Computing and Engineering Annual Researchers’ Conference 2013: CEARC’13, San Juan, Puerto, 18–22 May 2013; Lucas, G., Ed.; University of Huddersfield: Huddersfield, UK, 2013; p. 239. [Google Scholar]
  40. Wei, N.; Gu, F.; Wang, T.; Li, G.; Xu, Y.; Yang, L.; Ball, A.D. Characterisation of acoustic emissions for the frictional effect in engines using wavelets based multi-resolution analysis. In Proceedings of the 2015 21st International Conference on Automation and Computing (ICAC), Glasgow, UK, 11–12 September 2015; pp. 1–6. [Google Scholar]
  41. Lu, X.; Khonsari, M.M.; Gelinck, E.R.M. The Stribeck Curve: Experimental Results and Theoretical Prediction. J. Tribol. 2006, 128, 789–794. [Google Scholar] [CrossRef]
  42. Boness, R.; McBride, S. Adhesive and abrasive wear studies using acoustic emission techniques. Wear 1991, 149, 41–53. [Google Scholar] [CrossRef]
  43. Fan, Y.; Gu, F.; Ball, A. Modelling acoustic emissions generated by sliding friction. Wear 2010, 268, 811–815. [Google Scholar] [CrossRef]
  44. Elamin, F.; Gu, F.; Ball, A. Online Monitoring of Engine Oil Quality Based on AE Signal Analysis. In Future Technologies in Computing and Engineering, Proceedings of Computing and Engineering Annual Researchers’ Conference 2010: CEARC’10, Athens, Greece, 7–10 July 2010; Lucas, G., Xu, Z., Eds.; University of Huddersfield: Huddersfield, UK, 2010; pp. 116–123. ISBN 978-1-86218-093-2. [Google Scholar]
  45. Wei, N.; Gu, J.X.; Gu, F.; Chen, Z.; Li, G.; Wang, T.; Ball, A.D. An Investigation into the Acoustic Emissions of Internal Combustion Engines with Modelling and Wavelet Package Analysis for Monitoring Lubrication Conditions. Energies 2019, 12, 640. [Google Scholar] [CrossRef] [Green Version]
  46. Ma, J.; Zhang, H.; Shi, Z.; Chu, F.; Gu, F.; Ball, A.D. Modelling Acoustic Emissions induced by dynamic fluid-asperity shearing in hydrodynamic lubrication regime. Tribol. Int. 2021, 153, 106590. [Google Scholar] [CrossRef]
  47. Fan, X.; Zuo, M.J. Gearbox fault detection using Hilbert and wavelet packet transform. Mech. Syst. Signal Process. 2006, 20, 966–982. [Google Scholar] [CrossRef]
  48. Dalvand, F.; Kalantar, A.; Safizadeh, M.S. A Novel Bearing Condition Monitoring Method in Induction Motors Based on Instantaneous Frequency of Motor Voltage. IEEE Trans. Ind. Electron. 2015, 63, 364–376. [Google Scholar] [CrossRef]
  49. Wang, X.; Liu, C.; Bi, F.; Bi, X.; Shao, K. Fault diagnosis of diesel engine based on adaptive wavelet packets and EEMD-fractal dimension. Mech. Syst. Signal Process. 2013, 41, 581–597. [Google Scholar] [CrossRef]
  50. Bianchi, D.; Mayrhofer, E.; Gröschl, M.; Betz, G.; Vernes, A. Wavelet packet transform for detection of single events in acoustic emission signals. Mech. Syst. Signal Process. 2015, 64–65, 441–451. [Google Scholar] [CrossRef]
  51. Gómez, M.J.; Castejón, C.; García-Prada, J.C. Review of Recent Advances in the Application of the Wavelet Transform to Diagnose Cracked Rotors. Algorithms 2016, 9, 19. [Google Scholar] [CrossRef]
  52. Wickerhauser, M.V. Lectures on Wavelet Packet Algorithms. In Lecture Notes; INRIA: Washington, DC, USA, 1992. [Google Scholar]
  53. Xu, Y.; Zhen, D.; Gu, J.X.; Rabeyee, K.; Chu, F.; Gu, F.; Ball, A.D. Autocorrelated Envelopes for early fault detection of rolling bearings. Mech. Syst. Signal Process. 2021, 146, 106990. [Google Scholar] [CrossRef]
Figure 1. Schematic and photographic representation of the diesel engine test system.
Energies 14 02315 g001
Figure 2. The frequency characteristic curve of the acoustic emission sensor SR800.
Energies 14 02315 g002
Figure 3. The viscosity–temperature curve of two tested lubricating oils.
Energies 14 02315 g003
Figure 4. Acoustic emission (AE) raw signals and piston speed in a working cycle at 1200 rpm under 10 Nm.
Energies 14 02315 g004
Figure 5. Full wavelet packet tree down to level 3.
Energies 14 02315 g005
Figure 6. Wavelet packet transform (WPT) spectrum of raw AE for 10W30 oil by db4 wavelet: (a) 999.5 rpm 10 Nm; (b) 1602 rpm 10 Nm; (c) 1803 rpm 10 Nm.
Energies 14 02315 g006
Figure 7. WPT spectrum of threshold AE for 10W30 oil by db4 wavelet: (a) 999.5 rpm 10 Nm; (b) 1602 rpm 10 Nm; (c) 1803 rpm 10 Nm.
Energies 14 02315 g007
Figure 8. Optimal wavelet basis selection for diesel–10W30: (a) Spectral amplitude variation; (b) Correlation coefficients of the modified piston speed;(c) Central processing unit (CPU) usages.
Energies 14 02315 g008
Figure 9. The correlation coefficients of four selected bands with the baseline diesel-10W30: (a) Diesel with 10W30 under 10 Nm; (b) Diesel with 10W30 under 40 Nm.
Energies 14 02315 g009
Figure 10. Fluid asperity shearing-acoustic emission (FAS–AE) indicators of two base line under low load: (a) Intake; (b) Compression; (c) Power; (d) Exhaust.
Energies 14 02315 g010
Figure 11. FAS–AE indicators of two base line under high load: (a) Intake; (b) Compression; (c) Power; (d) Exhaust.
Energies 14 02315 g011
Figure 12. FAS–AE indicators of different fuels under low load: (a) Intake; (b) Compression; (c) Power; (d) Exhaust.
Energies 14 02315 g012
Figure 13. FAS–AE indicators of different fuels under high load: (a) Intake; (b) Compression; (c) Power; (d) Exhaust.
Energies 14 02315 g013
Figure 14. Asperity–asperity–collision acoustic emission (AAC–AE) indicators of different alternative fuels under low load: (a) Intake; (b) Compression; (c) Power; (d) Exhaust.
Energies 14 02315 g014
Figure 15. AAC–AE indicators of different alternative fuels under high load: (a) Intake; (b) Compression; (c) Power; (d) Exhaust.
Energies 14 02315 g015
Table 1. Specification of the test engine.
Technical ParametersTechnical Data
ManufacturerAnhui Quanchai Engine Co., Ltd., China
Engine modelQCH1125
Number of cylinderOne
Combustion systemDirect injection, vertical type
Bore/stroke125/120 mm
Displacement 1.473 L
Compression ratio18:1
Rated power20.6 kW @ 2200 rpm
Maximum torque67 Nm @ 1920 rpm
Table 2. Engine operating conditions and the fuels properties tested.
Fuel Lube-OilEngine Speed (rpm)Load (Nm)Lower Heating Value (MJ/kg)Cetane
Number
Viscosity
(mm2/s) at 20 °C
Density
(g/cm3) at 20 °C
Bio–DieselCD10W301000
1200
1400
1600
1800
10
40
39595.20.88
F–T dieselCD10W3044.274.82.140.76
Standard Diesel CD10W3042.6454.650.83
Standard Diesel CD15W4042.6454.650.83
Publisher’s Note: MDPI stays neutral with regard to jurisdictional claims in published maps and institutional affiliations.

