Article

Methodology for Implementing the State Estimation in Renewable Energy Management Systems

School of Electrical Engineering, Daegu Catholic University, Gyeongbuk 38430, Korea
*
Author to whom correspondence should be addressed.
Energies 2021, 14(8), 2301; https://doi.org/10.3390/en14082301
Submission received: 28 February 2021 / Revised: 2 April 2021 / Accepted: 13 April 2021 / Published: 19 April 2021
(This article belongs to the Section F: Electrical Engineering)

Abstract

:
This paper describes a methodology for implementing the state estimation and enhancing the accuracy in large-scale power systems that partially depend on variable renewable energy resources. To determine the actual states of electricity grids, including those of wind and solar power systems, the proposed state estimation method adopts a fast-decoupled weighted least square approach based on the architecture of application common database. Renewable energy modeling is considered on the basis of the point of data acquisition, the type of renewable energy, and the voltage level of the bus-connected renewable energy. Moreover, the proposed algorithm performs accurate bad data processing using inner and outer functions. The inner function is applied to the largest normalized residue method to process the bad data detection, identification and adjustment. While the outer function is analyzed whether the identified bad measurements exceed the condition of Kirchhoff’s current law. In addition, to decrease the topology and measurement errors associated with transformers, a connectivity model is proposed for transformers that use switching devices, and a transformer error processing technique is proposed using a simple heuristic method. To verify the performance of the proposed methodology, we performed comprehensive tests based on a modified IEEE 18-bus test system and a large-scale power system that utilizes renewable energy.

1. Introduction

Recently, Korean electric power systems (KEPS) have been experiencing some cascading outages of generators and photovoltaic (PV) systems. The unusual temperatures and wrong setting parameters of some protective devices lead to cascading outages. On March 28 2020, when Shin Boryeong Unit 1 (coal-fired, 805 MW) suddenly stopped, the grid frequency dropped to 59.8 Hz after 10 s, and the PV system in the grid considered it a low frequency and stopped. Also, it was found that the frequency further dropped to 59.67 Hz [1]. About 15.8 GW of the generated solar power from KEPS is lost when recognizing abnormal frequencies, especially when the frequency drops to 59.3–59.8 Hz.
Korea has recently announced the 9th Basic Plan of Long-Term Electricity Supply and Demand, which aims at having 78.1 GW of renewable energy by 2034 [2]. As shown in Table 1, the capacity of coal should decrease from 34.7 GW in 2020 to 29.0 GW in 2034. For the 30 abolished coals, 24 will be converted to liquefied natural gas (LNG). Also, during the same period, the capacity of LNG facilities should increase from 41.3 to 60.6 GW. Moreover, the plan aims at maintaining the current gradual reduction in the number of nuclear power plants and the increase in the number of renewable energy facilities. It is predicted that the capacity of nuclear power plants will decrease from 24.7 GW in 2019 to 19.4 GW in 2034 and that the capacity of renewable energy facilities will increase from 19.3 to 78.1 GW.
As more variable renewable sources are frequently installed in KEPS, the reliable assessment and operation of power systems with a high penetration of renewable energy should depend on network applications and on good-quality data acquisition. Therefore, one of the most challenging tasks for today’s power system engineers in Korea is the development and operation of renewable energy management systems (REMSs) to be used by operators for proper power system operation and planning. In Korea, REMSs are currently under development, and they usually involve hardware, data acquisition, databases, applications, and displays, as shown in Figure 1.
In an REMS, although online data may include incorrect data due to communication failures or the scale-factor errors of telemetered points, the state estimation is calculated on the basis of the actual state of a power system using analog and digital data obtained from supervisory control and data acquisition systems (SCADA) [3,4]. Once a state estimation is carried out, the network’s estimated state should be evaluated in two aspects: network analysis and economic operation. A dynamic stability assessment is applied to the calculation of the penetration of renewable energy, and the final solution of the REMS is determined to control the amount of generated renewable energy based on various application outputs, as shown in Figure 1. Then, the security-constrained economic dispatch uses the state estimation results as inputs and calculates the desired megawatt (MW) output limit for all the units while considering the transmission constraints in normal and contingency conditions.
The state estimation reliability depends on various factors, such as power system modeling and the quality of the telemetered data and pseudo measurements. In KEPS, renewable energy and transformers are among the most important factors in state estimation, as the measurements associated with them are very lacking. In KEPS, the state estimation cannot be calculated up to the exact transformer tap positions because of its unique feature such as lack of measurement. In order to overcome these problems, a state estimation technique that adopts a robust tap estimation algorithm and an accurate connectivity model is required for REMSs.
Many have researched this topic and proposed various techniques. To enhance the accuracy of state estimation, these research efforts focused on developing three functions. The first one is enhancing the accuracy of the state estimation using phasor measurement unit (PMU). Algorithm for estimating the state variables based on a limited number of PMU as well as determining the optimal PMU placement was proposed [5,6,7]. To enhance the performance of state estimation using various measurements based on the remote terminal unit (RTU) and PMU, the robust and fast algorithm with the linear weighted least square (WLS) technique and the architecture based on a multistage scheme is proposed [8,9,10]. The second function is identifying the topology and measurement errors of devices using practical heuristic methods. A state estimation monitoring tool based on pseudo measurements, statistic functions, and coherency checks was proposed, and it could detect potential topology errors and enhance the performance of state estimation [11,12]. The third function is a residual sensitivity method based on the WLS approach, which detects and replaces bad data points using normalized residuals. The largest normalized residual method with highly efficient technique was proposed [13]. A method for detecting and identifying topology errors using the recursive Bayesian approach and its improved version was proposed [14]. Also, an orthogonal iteratively re-WLS for solving equality-constrained state estimations was estimated to power system state variables and transformer tap positions under erroneous zero-power injections [15]. Although it showed good features in estimating the tap positions of transformers based on both approaches, this approach is still insufficient of practicality, as there is a lack in comparative studies that are based on large-scale power systems and in extensive testing trials that use many topology errors. However, various enhanced algorithms for state estimation were proposed and tested in small testing and power systems, including non-variable resources.
In this paper, a methodology for implementing the state estimation and enhancing the accuracy in large-scale power systems that partially depend on variable renewable energy resources. The methodology implemented in this paper is detailed below:
  • First, the structure of the application common database of renewable energy management systems containing power system components based on a physical node is constructed. The application common database is composed of a node-breaker model and bus-branch model for enhancing the accuracy and speed of network applications. The aggregated renewable energy is modeled as a generator, transformer and collector transmission line to estimate the actual system. To overcome the shortage of measurement connected to transformer, the connectivity model of a transformer using a switching device is proposed.
  • Second, the simple heuristic method based on the condition of feasibility check are proposed to decrease the effects of the lack of measurements of three winding transformer, two winding transformer, and step-up transformer. As the renewable energy expands, the accuracy of state estimation should be depended on the measurement associated with transformer connected to renewable energy. The heuristic method is applied to the topology processing as a preprocessing function.
  • Third, the state estimation based on the fast-decoupled WLS approach is implemented to estimate the actual state of the power systems including variable renewable energy resources based on decoupled gain matrix, pseudo measurement and bad data processing. The bad data processing is composed of an inner processing module and outer processing module. The inner processing module based on the largest normalized residue method deals with the bad data detection, identification, and adjustment. The tap position was estimated through a modified sensitivity calculation for reactive flow and voltage measurements. The outer processing module performs the function of analyzing that the bad measurement selected in inner processing exceeds the condition of Kirchhoff’s current law. The outer processing method is applied to the bad data processing as a postprocessing function
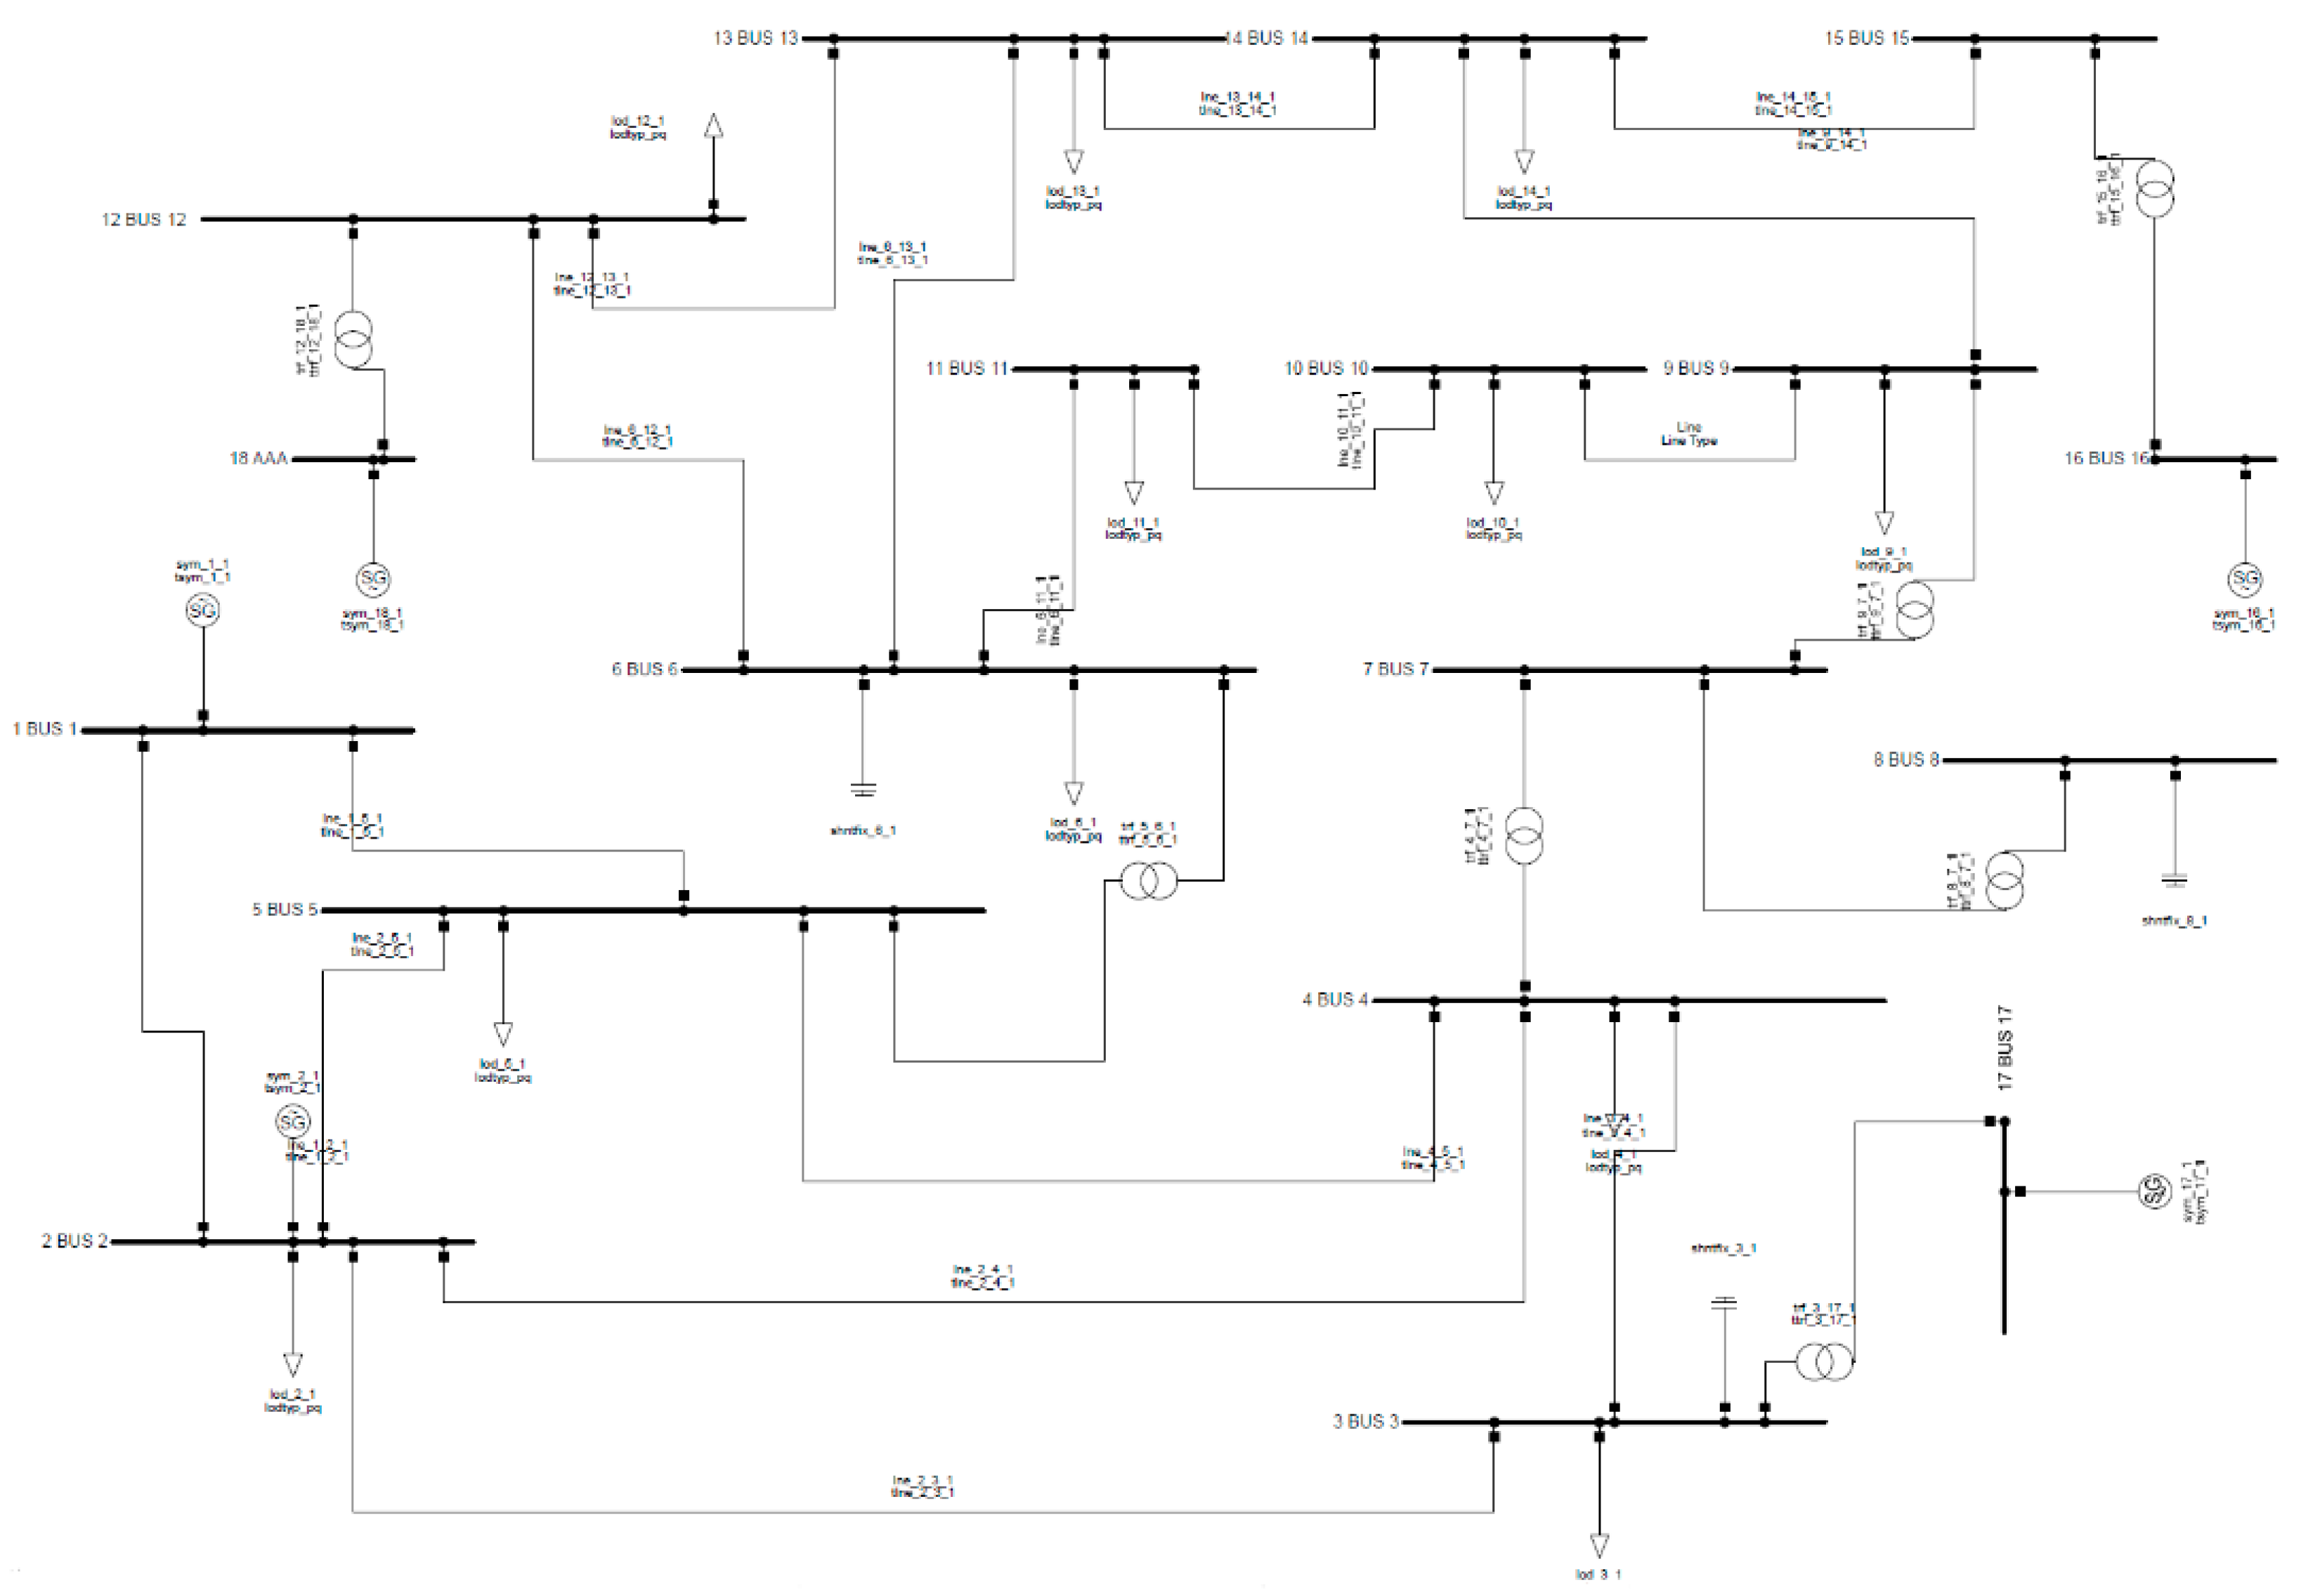
  • Finally, the performance of the proposed methodology is validated through the comprehensive tests based on a modified IEEE 18-bus test system and a large-scale power system that utilizes renewable energy. The performance for large-scale power system is validated through the dynamic test for assessing the performance requirements based on ERCOT, analyzing the system at different meter accuracy range, and performing the pseudo measurement processing and bad data processing for severe events.

2. Structure and Model of REMSs

2.1. REMS Structure

In the considered REMS in this study, the database consists of a real-time database (RTDB), an application common database (ACDB), and an offline database (OFFDB), as shown in Figure 1. The RTDB handles the SCADA information and the remote terminal unit (RTU), and the ACDB handles the state estimation I/O, the power flow analysis, and other applications [16]. The OFFDB handles all the data acquisition information, the application, and the display. The topology processing module in state estimation periodically transfers online data from the RTDB to the ACDB. If the OFFDB is updated on the basis of a common information model (CIM), the RTDB and ACDB are also updated and maintained. The ACDB is composed of static and network hierarchy model data in addition to dynamic data for the hierarchy model. Each block in Figure 2 represents a static table and a dynamic table for a system hierarchic layer, which is composed of several fields. The link list method was used to create a relationship between the tables. Each table of the database has relationships using one or more of the following three link types.
The network analysis role in the REMS is to analyze the actual power system static analysis state and to calculate the maximum renewable energy penetration using a power flow analysis, a contingency analysis, voltage stability, and transient stability. As shown in Figure 3, the major parts of the applications in the REMS are composed of a SCADA level w.r.t monitoring, an ON-LINE level w.r.t network analysis, and an OFF-LINE level w.r.t a further study using offline software. The analog data of voltage, tap position, active power, and reactive power is acquired as 2 s and the digital data of the status of circuit breaker is acquired as 4 s. The total number of analog and digital data is 128,809. State estimation plays a key role in the calculation of the maximum renewable energy penetration using online dynamic stability assessment systems. The reliability of most of the applications is based on a power flow technique that depends on the state estimation solution quality. State estimation and powerflow run 1 min, and steady-state assessment runs 2 min, and dynamic stability assessment runs 5 min.

2.2. Renewable Modeling

As shown in Figure 4, the telemetry information for renewable energy connected to >154- and 22.9-kV dedicated lines was acquired in the REMS. On the basis of the telemetered points of SCADA and RTU, the renewable energy sources, such as the solar PV and wind power plant, were modeled as generators in the network application. The procedure of modeling the renewable energy plants and the interface between the renewable energy and telemetered point is described as follows:
(1)
Model 1: For the renewable energy connected to >154 kV, it was modeled based on a generator, a step-up transformer, and a transmission line.
(2)
Model 2: For the renewable energy connected to the 22.9 kV dedicated line, it was modeled on the basis of a generator and a step-up transformer.
(3)
Models 1 and 2: The renewable energy generation was calculated using the acquired data because the losses in the transformers were very small. More detailed data are shown in Table A1 [17,18].

3. Renewable State Estimation

3.1. Topology Error Model Associated with Transformer

In KEPS, transformers are among the critical parameters in state estimation because the active power (MW) and reactive power (MVAR) of the secondary winding and the tap position of the primary winding are only obtained for substations. Also, the telemetered data associated with step-up transformers in power stations do not exist. Recently, the tap positions of unattended substations were measured, and the measured values were included in bad measurements. As shown in Figure 4, the lack of measurement data associated with transformers as well as the use of suspected data may cause an observability problem as well as inaccurate state estimation results. Because of these problems, the tap estimation function was not well operated in KEPS. To get a precise expression for improving the accuracy of state estimation, a connectivity model of a three-winding transformer using switching devices and common nodes is proposed, as shown in Figure 5.
The three-winding transformer is modeled using two-winding transformers connected together at a common bus that has no physical meaning. Three circuit breakers (CBs) are connected at the common bus, which controls the in or out of service status of the transformer. As shown in Figure 6, the procedure of analyzing the three-winding transformer is described as follows:
(1)
Step 1: Add the TRCB #1, #2, and # 3 w.r.t the three-winding transformer connected to the common node (ND) if topology processing runs firstly.
(2)
Step 2: Create a dynamic link between the common ND of the three-winding transformer and the CB. Some links between the three-winding transformer and the ND as well as between the CB and the three-winding transformer should be added.
(3)
Step 3: Perform the feasibility check based on the CB’s state and measurements of P, Q and Tap associated with transformer as shown in Table 2.
(4)
Step 4: Assign the status of the new CB based on the state of the equipment connected to the three-winding transformer based on the conditions of feasibility check.
(5)
Step 5: Perform a topology processing and state estimation to prevent the MVAR flow toward the open winding of the transformer
Through the proposed approach, the operating states of the three-winding transformer were dynamically determined by handling the status of the switching devices without additional OFFDB. From the database of the EMS perspective, the new links among the CB, ND, and three-winding transformer were created at the step of the OFFDB, which is based on the CIM and is stored in an Oracle relational database management system. If the proposed scheme w.r.t the three-winding transformer was processed in an OFFDB, several functions, such as a modification of the three-winding transformer in the CIM, would have been modified and validated. Importantly, the OFFDB validation was among the critical factors in the EMS. However, these approaches are very complex.

3.2. State Estimation Methodology

The state estimation algorithm is based on a fast-decoupled WLS technique, which uses a decoupled right-hand side and a constant decoupled gain matrix computed at a flat voltage. The state estimation can be mathematically formulated as in the following problem [20,21,22]:
M i n   J ( x 1 , , x N s ) = i = 1 N m [ z i m e a s f i ( x 1 , , x N s ) ] 2 σ i 2
where fi = a function used to calculate the value measured using the ith measurement; σi2 = variance for the ith measurement; J(x) = measurement residual; Nm = number of independent measurements; zimeas = ith measured quantity; Ns = number of unknown parameters.
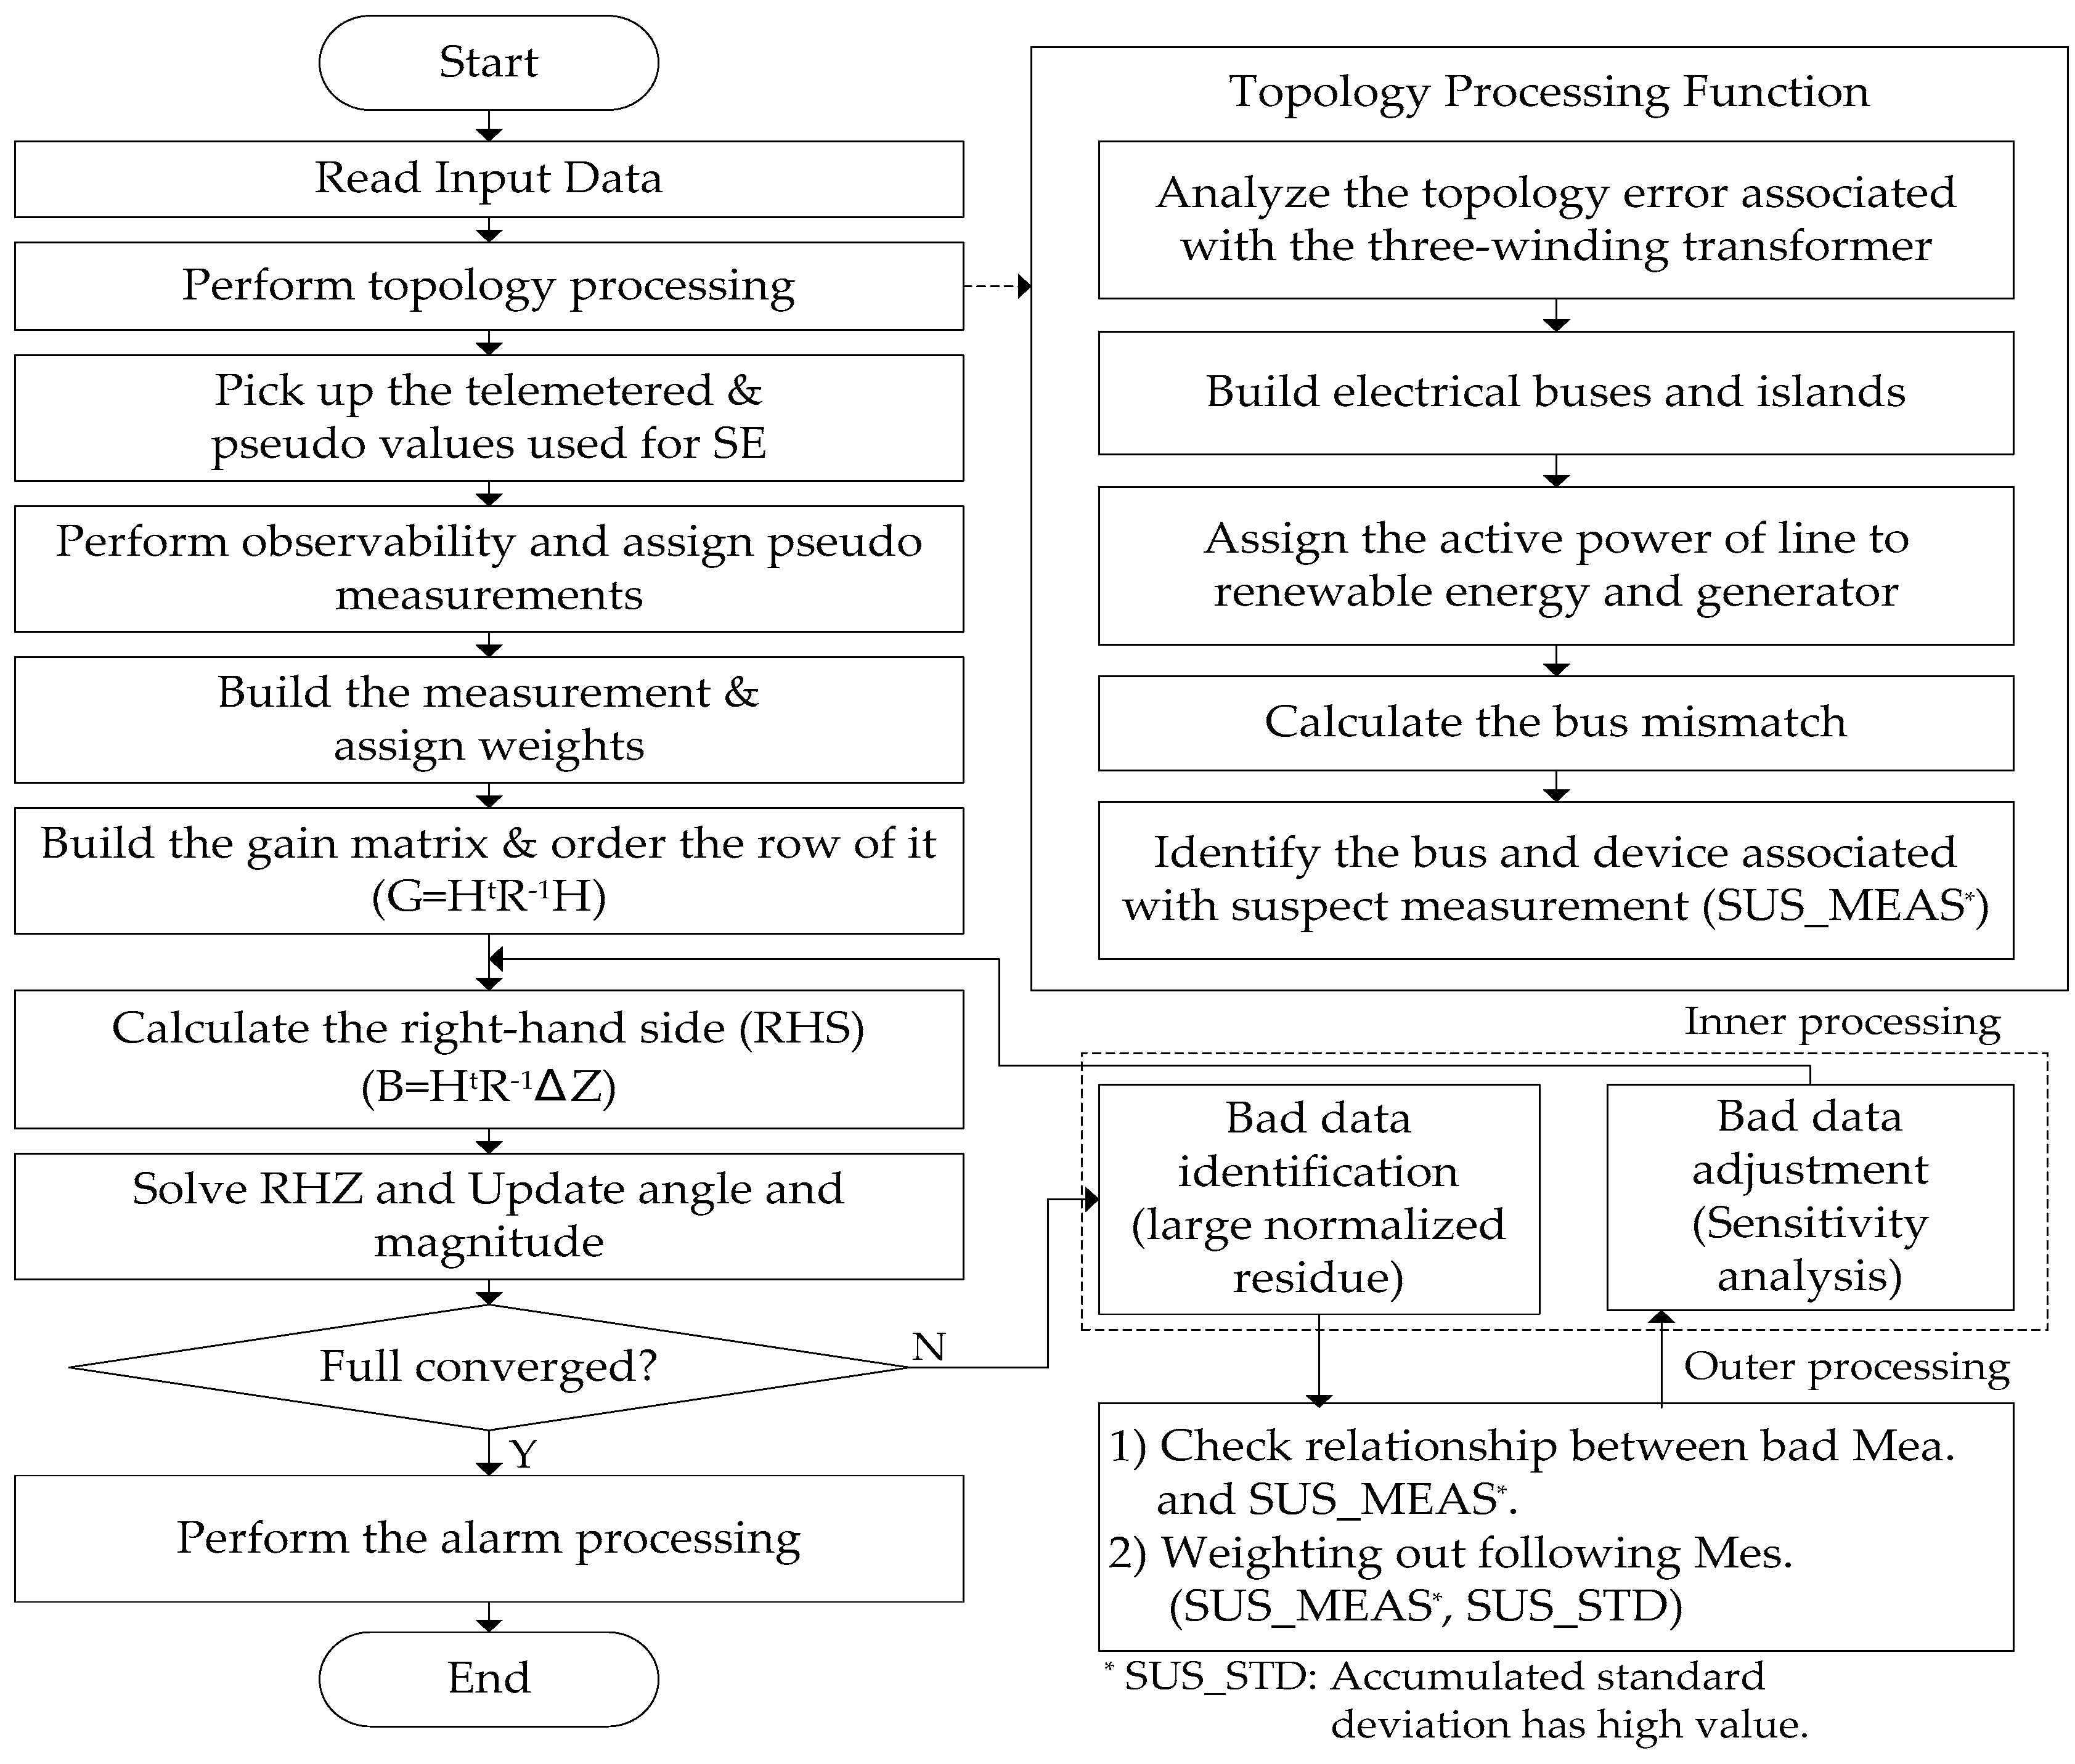
Figure 7 shows the overall flow chart of the state estimation adopting the proposed algorithm for the fast WLS approach and bad data processing.
To solve the value of G∙Δx = B, forward and backward substitutions using the factorized gain matrix should be performed. The fast-decoupled WLS method uses a fixed gain matrix. This approach calculates two gain matrices for the voltage angle and magnitude. The gain matrix assigns in-service buses to the rows of the gain matrix. Depending on the type of measurement, off-diagonal entries are created. Two gain matrices are created: the MW-angle and MVAR-magnitude. The structure of the two matrices is the same. To improve the accuracy, the high-voltage direct current (HVDC) system and flexible AC transmission system (FACTS) are modeled. For the HVDC system, the direct current (DC) is defined as a state variable to be estimated in the MW-angle iteration [23]. Vd and X denote the DC voltage and the reactance of the DC line, respectively.
V d = 3 2 / π V a c cos α 3 / π X I d
The FACTSoutput corresponding to its terminal voltage is calculated using Equation (3). If the FACTSoutput will be outside limits, the change of MVAR is calculated and voltage magnitude is updated. FACTSvalue denote the last estimated value, and FACTSvalue denote the last estimated value.
F A C T S o u t p u t = ( V m e a s u r e m e n t V e s t i m a t e d ) F A C T S s l o p F A C T S c h a n g e = ( F A C T S o u t p u t F A C T S v a l u e ) × F A C T S s e n s i v i t i t y

3.3. Inner Bad Data Processing

The bad data processing of the MW-angle iteration handles the MW measurements, DC measurements, and phase shift taps, whereas the bad data processing of the MVAR-magnitude iteration handles the MVAR and voltage. There is a simple methodology for computing the bad data processing, and it is illustrated as follows:
(1)
Identify the measurement with the highest normalized residue (rNi) and check if its normalized residue is above a pre-specified limit.
r N i = Δ Z i σ i Π i
where Πi is the ith diagonal of the residual sensitivity matrix W. The sensitivity matrix can be written as [20,21,22]
W = I H ( H t R 1 H ) 1 H t R 1
(2)
Perform the outer bad data processing and confirm the bad measurement.
(3)
Calculate the replacement of the identified bad measurement. The replacement is expressed as
Z k ( n e w ) = Z k ( o l d ) + Δ Z k ¯
Δ Z k ¯ = i = 1 m Δ Z i Δ Z i σ 2 / i = 1 m ( Δ Z i ) 2 σ 2
where m is the number of measurements.
(4)
Adjust the calculated voltage magnitudes and angles and the other measurements residue based on the bad measurement replacement.
(5)
Go back to Step 1 until all the bad measurements are processed. If the number of iterations w.r.t the bad data processing is more than the threshold value, skip the bad data processing step.

3.4. Outer Bad Data Processing

The outer function is performed to analyze the influence of the identified bad measurements. If the measurements exceed the condition of Kirchhoff’s current law (KCL), the weighting factor of the measurements is decreased. The condition of KCL is described as follows:
(1)
If the measurement is related with the results of topology error model associated with transformer, the measurement is selected.
(2)
If the accumulated standard deviation and bias of the measurement using Equation (8) has high value, the measurement is selected.
S T D n e w = S T D o l d 2 × r u n c o u n t + r e s i d u e 2 / ( 1 + r u n c o u n t ) B i a s n e w = ( B i a s × r u n c o u n t + r e s i d u e ) / ( 1 + r u n c o u n t )

3.5. Tap Position Estimation

As shown in Table 3, the metering point of the transformer is less than that of the other devices, such as the transmission line, generator, shunt, and HVDC. In KEPS, as the grid connection of the renewable energy increases, the telemeter point associated with the transformer affects the state estimation accuracy. To enhance the accuracy of the tap position estimation of the two- and three-winding transformers, the modified residues of the MVAR flow and voltage at one terminal of the transformer are used to decide if a magnitude tap adjustment is required. The tap is adjusted until the measurement residue is minimized. The tap position estimation is adopted to the bad data processing for the MVAR-magnitude iteration. The proposed method of the transformer tap position is as follows:
(1)
Assign the active power of the transmission line and transformer to the active power of the renewable energy generator, as shown in Figure 4. The weighting factor of the renewable energy generator is set as pseudo.
(2)
Calculate the bus mismatch of the secondary side of the transformer in the substation. If the mismatch is rather a threshold value, the measurement connected to the bus is regarded as a suspect flag.
(3)
Perform a tap position estimation if the state estimation is partially converged. Calculate the sensitivities of the MVAR flow and bus voltage to the measurements of each transformer based on Equation (9). Then, compute the kth column of HtR−1 in the sensitivity matrix. Afterward, perform a forward/backward substitution with the gain matrix and multiple H and substitute one.
Ta p k n e w = Ta p k o l d + Δ Ad j k Δ A d j k = { j = 1 m ( Δ S j Δ Z j ) / σ 2 } M v a r + { j = 1 n ( Δ S j Δ Z j ) / σ 2 } v o l t a g e { j = 1 m Δ S j 2 / σ 2 } M v a r + { j = 1 n Δ S j 2 / σ 2 } v o l t a g e
where m and n denote the number of measurements associated with the MVAR flows of the branch and injection and the bus voltages for each transformer, respectively.
(4)
Adjust the transformer tap based on Equation (9) if the adjustment value is more than the threshold value.
(5)
Go back to Step 3 until all the transformers with an on-load tap changer are processed.

4. Case Study

A case study was described to demonstrate the performance of the state estimation method using two kinds of extensive simulations. In the first simulation, static testing for the individual function in the state estimation was applied using a modified IEEE 18-bus test system. The test system was constructed by adding renewable energy to the IEEE 14-bus test system [24]. Figure 8 shows the configuration of the test system considering the characteristics of the measurement locations in KEPS. The number of all the analog measurements in this test system was 125. The number of the installed analog measurement devices of the MW, MVAR, voltage, and tap position was 50, 51, 13, and 2 respectively. The total number of analog measurements and their ratio were 115 and 92%, respectively. In the second simulation, a comprehensive dynamic test of the state estimation adopting the proposed algorithm was performed in large-scale power systems.

4.1. Static Tests

The proposed algorithm for the state estimation was evaluated by applying input data, where the electrical information of the digital/analog data, power system components, and user-defined parameters were constructed in a comma-separated values (CSV) file. The modified IEEE 18-bus test system was decomposed into different CSV files based on the ACDB structure. To demonstrate the performance of the proposed algorithm, various scenarios were used, as shown in Table 4.

4.1.1. Scenario A

In order to validate the accuracy and reliability of the proposed state estimation method in REMS, a comparative simulation between an REMS and measurements with some suspects was performed at various conditions. In the SCADA and EMS, the quality flag of the telemetered data was set to a suspect when a communication failure occurs. Table 5, Table 6 and Table 7 show the comparative results of the state estimation for various cases. Cases 1–3 were applied to different suspect ratios: 0%, 10%, and 20%, respectively. The voltage, generation, and branch flow for the three cases were compared with the true values. The results for Case 1 exhibited good agreement with the REMS and the measurement results. As for Cases 2 and 3, the suspect measurements of the MW, MVAR, and voltage were randomly selected. On the basis of these results, the estimated values of the test system can be accurately calculated from the measurements with the suspect quality flag.

4.1.2. Scenario B

This scenario illustrates the bad data detection and replacement function of the state estimation. The simulation condition of this case is identical to Case 1 of scenario A, except for the wrong value with the good-quality flag, which could be generated by the scale-factor error of the measurement units as well as by human error w.r.t the RTDB maintenance. Table 8 shows the estimated values of the various variables for the voltage, MW, and MVAR, which were used to investigate the bad data processing of the REMS. I represents the wrong input data of bad data processing. Table 9 shows the normalized residuals and sensitivity of the bad data detection and replacement for the four cases. Even though the input data had a big error, the results exhibited good agreement with the REMS and the true values as shown in Figure 9.

4.1.3. Scenario C

This scenario uses test procedures to validate the proposed tap estimation method in this paper. The simulation condition of this case is identical to scenario B, except for the location of the wrong data. Table 10 shows the estimated values of the tap positions and the voltage. I represents the wrong input data of the tap position estimation. Table 11 shows the normalized residuals and sensitivity of the bad data detection and replacement for the four cases. From the results, the true values of the power system can be accurately calculated from the wrong data using the proposed process.

4.1.4. Scenario D

This scenario compares the performance of the proposed algorithm with the simulation results of state estimation function in PowerFactory (PoF), which consists of four components such as pre-processing, plausibility check, observability analysis, and non-linear optimization including the bad data detection [25]. Figure A1 shows the modified IEEE 18 bus test system based on PoF, and the simulation condition of this case is identical to Case 3 of scenario A. Because of the functional difference between the proposed algorithm and the PoF, the gap between two programs may occur. In order to configure the conditions equally between two programs, the location of measurement and standard deviation are set to the same. Figure 10 shows the voltage magnitude of the true value, the proposed algorithm and PoF. From the results, the proposed algorithm exhibited good agreement with the true value. The function and parameters of PoF should influence to some differences between the proposed algorithm and PoF.

4.2. Dynamic Tests

An important factor for dynamic tests is to validate the performance of the proposed algorithm using the standard of state estimation. For large-scale power systems with a massive number of network components, a solution may not converge, and some difficulties may arise, such as differences in the performance. In order to maintain the performance of state estimation, power system transmission operators, such as ERCOT, PJM, and NGESO, create state estimation standards w.r.t convergence and the differences between the measurements and estimations for branch flows and power stations. The dynamic test in this study was focused on finding differences between the REMS and the measurements in KEPS. Table 12 shows various scenarios for validating the state estimation performance in KEPS. The test system was based on the KEPS in 2016. The system’s total generation was 58,748 MW and 10,878 MVAR, and its load was 57,470 MW and 10,697 MVAR, respectively. The two HVDC systems in the KEPS transmit relatively cheap electric power from the mainland to the Jeju. As shown in Table 13, the penetration of renewable energy used in this paper is approximately 6.6%, which consists of generator with renewable energy of 251.

4.2.1. Scenario E

In this scenario, the state estimation was checked to ensure that it meets the originally specified functions, which calculate the bus voltage, branch flow, and generation based on the standard deviation of the measurements. In KEPS, the weighting factor of the generators is more than that of the other devices because the security-constrained economic dispatch uses the state estimation results. The state estimation adopting the proposed algorithm in this study converged after nine iterations. The voltage convergence tolerance was 0.005 p.u. Table 14 shows a summary of the state estimation, including the number of bad data processing instances, the value of the largest bus mismatch, and the suspect ratio. Because of the suspect measurements of the HVDC system, the number of iterations was creased. In the case of >20 MW and 20 MVAR, the number of bus mismatches of the MW and MVAR was 0 and 5, respectively. Table 15 shows the MW and MVAR summary of the generation and load for the state estimation results and measurements. The MW generation between the estimation results and measurements had a small difference because of the different weighting factors, which represent the reciprocal of the standard deviation. Figure 11 shows the voltage magnitude of the 345 kV between the telemetered voltage and the state estimation. Figure 12 and Figure 13 show the generator unit for the 50 largest equipment and active power of the branch flow, respectively. The results of this scenario exhibited good agreement with the REMS and the measurements.
The performance of the state estimation of the REMS was evaluated using the reference of the state estimation of ERCOT [26], which is among the system operators in the United States with a high penetration of renewable energy. The installed capacity of renewable energy in 2020 year is 35,114 MW. The reasons for selecting the reference of the state estimation of ERCOT in this paper are as follow.
First, Korea Power eXchange (KPX) operates the power system based on EMS. To analyze and maintain the performance of generation, voltage and power flow, KPX has established the reference of state estimation based on ERCOT and other ISOs. KPX updates the EMS function by benchmarking ERCOT cases in terms of the penetration of renewable energy. Second, Korea has recently announced the target of 78.1 GW of renewable energy by 2034. Since most of the large-scale renewable energy is wind power, ERCOT with high penetration of wind power is a good reference. Third, loads are concentrated in the metropolitan area in Korea. The transmission lines connecting the metropolitan area and the non-metropolitan area are very important. In particular, a thyristor controlled series capacitor (TCSC) is installed and a special protection system (SPS) is operated in preparation for an accident on a 765 kV line.
Table 16 shows the performance requirements of the state estimation of ERCOT for the convergence, branch flow, and voltage. Table 17 shows the performance requirements of the state estimation of CASIO [27].
Table 18 shows the performance of the state estimation adopting the proposed algorithm based on the reference of ERCOT. The maximum differences for the branch flow, critical branch flow, and voltage were 2.17%, 0.4%, and 0.92%, respectively. As shown in Table 18, although the comparative study was performed with one dataset, the proposed algorithm agrees well with the reference of ERCOT.

4.2.2. Scenario F

In order to analyze the telemetry accuracy effect on the proposed algorithm, the state estimation was simulated for different meter suspects ranging from 3% to 10%. The MW measurements on both sides of the transmission line were randomly selected as data with suspect flags, and the state estimation was run for 100 times. Because the number of measurements associated with the transmission line is largest in KEPS, this scenario selected its MW measurement. The simulation condition of this scenario is identical to scenario E, except for the additional suspected data. The total number of metering points of the transmission line was 4378, and the available data with good flags was 4320. This scenario was assigned as the suspect data from 3% to 10% of 4320. Table 19 shows the average values of the estimation results and measurements for the branch flow and generation, respectively.
With the increase in the range of suspects, the average difference between the estimation data and the measurements increased, as shown in Figure 14 and Figure 15. Overall, this scenario shows that the proposed algorithm can be accurately utilized for datasets with high suspect ratios.

4.2.3. Scenario G

In this simulation, all the measurements in the same station and a metropolitan area division were assumed to have suspect flags. This test was required to guarantee the performance of the bad data processing and pseudo processing method in the case of a severe event involving the loss of a large amount of data. On the basis of the same conditions as scenario E, all the measurements in the division of Nam-Seoul were set to suspects. The division of Nam-Seoul has 63 stations, 4 of which are 345-kV stations. For the 63 substations in this division, the suspect values of the voltage, branch, and injection were replaced by pseudo measurements, such as the values calculated using an economic dispatch and the BLDF. Nam-Seoul division in the metropolitan area is the largest load division. If the contingency in this division occurred, the impact is relatively more sensitive than other divisions. Table 20 shows the estimated values using the telemetered data and suspect data. Although the number of suspect stations increases, the average difference between the estimation results and measurements for voltage, MW, MVAR remains similar. In the case with 63 of suspect station, the average difference is 18.20 MW and 8.6 MVAR, and the largest difference is 265.72 MW and 65.71 MVAR, respectively. Because there are a lot of load, transformer and transmission line in 154-KV and 345-kV stations, the largest difference has some big values despite of the small average difference. In order to solve this problem, the difference could be decreased by correcting the parameters such as pseudo measurement and standard deviation. System operator should be adjusted by controlling the standard deviation which causes the increasing of the average difference and the decreasing of the largest difference. Figure 16 shows the active power flow of the transmission line in the Nam-Seoul division between the estimation results and measurements. The results of the state estimation showed that the proposed algorithm can exactly estimate the actual values from the suspected data and that it can be correctly operated during these severe situations.

5. Conclusions

In this paper, a methodology for implementing the state estimation and enhancing the accuracy in large-scale power systems including various renewable energy resources is presented, and it showed accurate and reliable performance in the studied REMS.
First, the application common database for analyzing the power system is proposed based on node-breaker model, bus-branch model and linked list method. Renewable energy was modeled by the basis of the point of data acquisition, the type of renewable energy, and the voltage level of the bus-connected renewable energy. The connectivity model of a three winding transformer using a switching device is proposed to overcome the lack of measurements related to transformer.
Second, the procedure of analyzing the topology error associated with the three-winding transformer is proposed based on simple heuristic method which could be analyzed and identified the suspect measurements using the condition of feasibility check. This is a pre-processing, which assign the active power of line to the renewable energy generator, calculate the bus mismatch, and identify the suspect measurements and buses. Third, the state estimation based on the fast-decoupled WLS approach and bad data processing is implemented. The bad data processing based on two stages is proposed. One stage is an inner-processing, which estimates the MW, MVAR, voltage, and tap position through a normalized residue and modified sensitivity calculation. Two stage is an outer-processing, which analyze the validation of the bad measurement selected in inner processing using the condition of Kirchhoff’s current law. Through the two steps, the proposed algorithm could be estimated for the power system with a lack of the measurements associated with a transformer because of the expanding renewable energy.
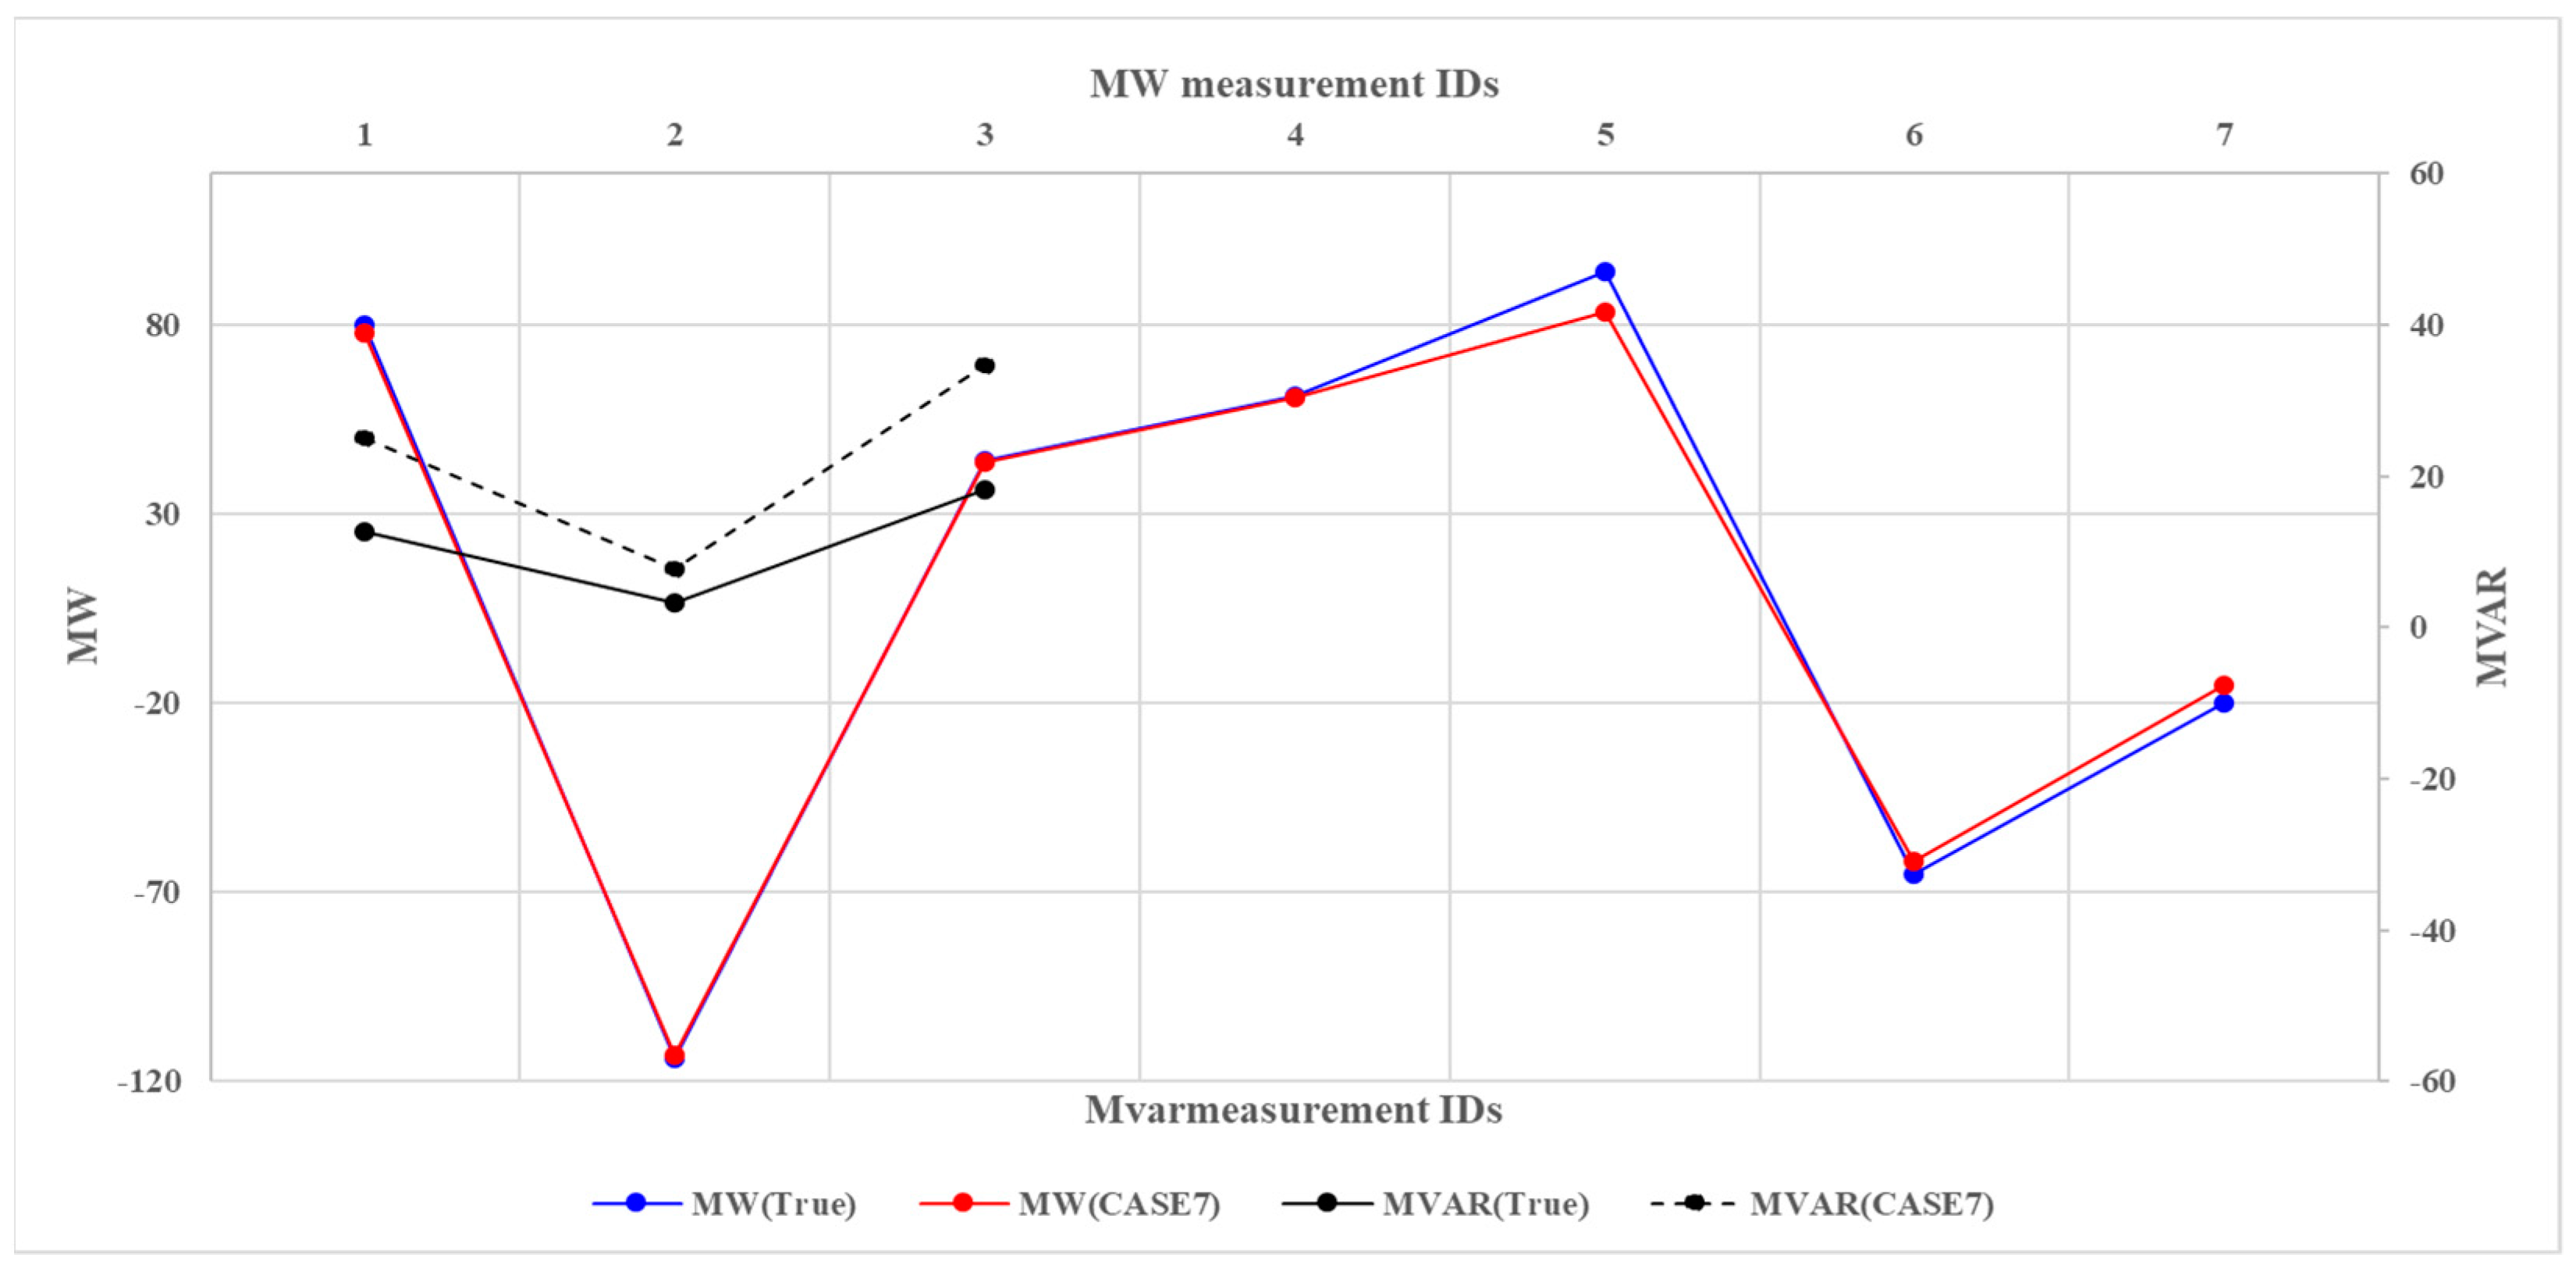
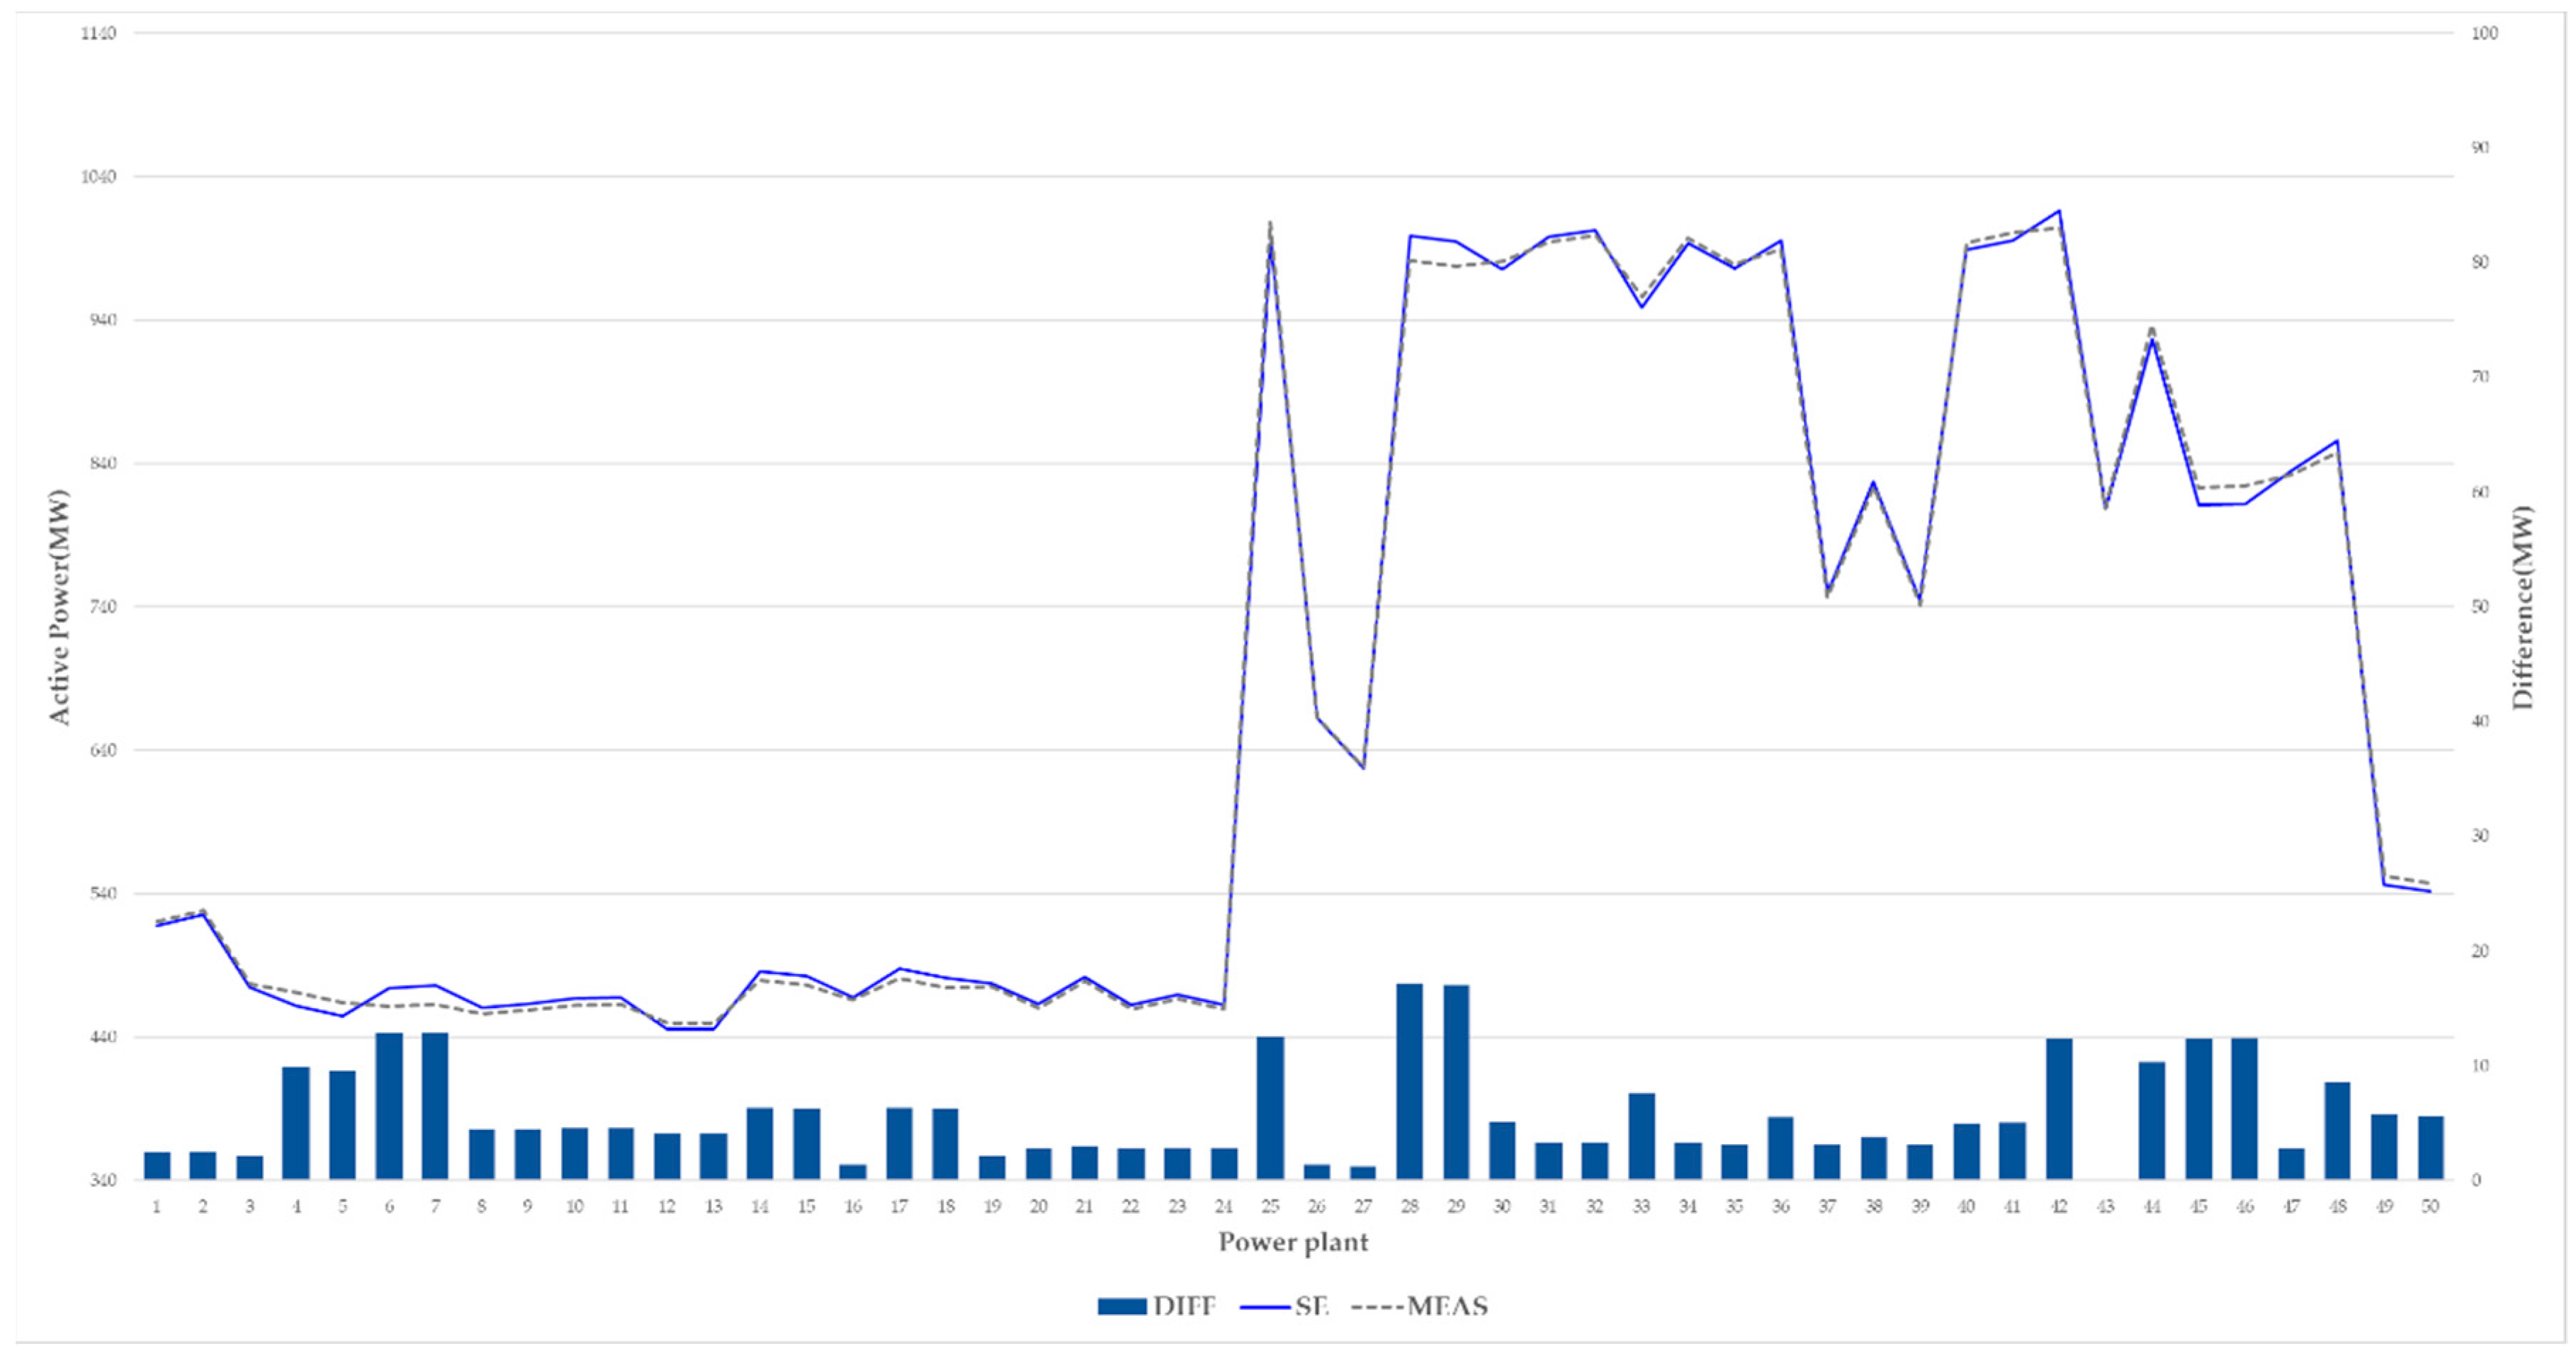
Finally, through static and dynamic tests, a comprehensive set of simulation results have shown that the proposed algorithm can provide accurate power system estimations. A static test was also performed to validate the individual function of the state estimation based on a modified IEEE 18-bus test system. Also, a comparative study among the proposed algorithm, PowerFactory, and measurement is performed. Furthermore, the dynamic test results exhibited good agreement between the solution of the state estimation and the telemetered data with some variances and severe events. The validation test for assessing the performance requirements based on ERCOT is carried out. Although the measurement consists of a set of data received from SCADA and RTU, the state estimation was simulated for different meter suspects ranging from 3% to 10%. For the suspect data from 3% to 10% of 4320, the rate of convergence has decreased from 97% to 88% with small difference between the estimated value and measurement.
The limitations of the methodology implemented in this paper and various simulation is detailed below:
  • The proposed algorithm based on the WLS technique, inner and outer bad data processing, pseudo measurement processing, and topology error processing, etc. has advantage of fast execution speed, convergence and computationally easy. However, the WLS technique is sensitive to the initial condition and the data quality of measurement. In order to solve these problems, pseudo measurement and topology error processing should be applied.
  • The dynamic test is analyzed using a set of measurements received from SCADA and RTU. Especially, a variety of analyzes of cases involving measured renewable energy with various penetration level was lacking. The installed capacity of renewable energy is 19,700 MW. Most of the renewable energy is the distributed generation connected to distribution system.
  • As renewable energy expanded, the effect of the components associated with renewable energy will be increasing in the platform of the EMS. Every time state estimation is performed, the results of state estimation could be changed because of the large variability of renewable energy. To deal with this situation, a robust algorithm is needed.
To enhance the accuracy and performance of the proposed algorithm, the future research of this paper is described as follows:
  • The WLS method based on a full coupled gain matrix, QR decomposition, and PMU will be studied. Full gain matrix and QR decomposition should increase the numerical stability and convergence characteristics.
  • The extensive case study for increasing penetration of renewable energy will be analyzing after various sets of measurements received from electric utility.
  • To create the input data with high penetration and various power system conditions, the replica data creation based on a real time digital simulator (RTDS) will be considered.

Author Contributions

Conceptualization, methodology, investigation, and software, Y.-S.C.; validation, formal analysis, and data curation, Y.-H.C.; writing, Y.-S.C. and Y.-H.C. All authors have read and agreed to the published version of the manuscript.

Funding

This research received no external funding.

Institutional Review Board Statement

Not applicable.

Informed Consent Statement

Not applicable.

Data Availability Statement

Not applicable.

Acknowledgments

This work was supported by “Human Resources Program in Energy Technology” of the Korea Institute of Energy Technology Evaluation and Planning (KETEP), granted financial resource from the Ministry of Trade, Industry & Energy, Republic of Korea. (No. 20194010201760).

Conflicts of Interest

The authors declare no conflict of interest.

Appendix A

Table A1 shows the requirement for modeling the renewable energy. Renewable energy consists of generator, transformer and transmission line.
Table A1. Power flow model of the renewable energy.
EquipmentListContents
GeneratorCapacity(Mbase)Farm Capacity
Active/Reactive powerMeasured data
P min/maxMax = Installed Cap, Min = 0
Q min/max ± P m a x tan ( cos 1 P F )
Control modeVoltage control
Power factorPV 1.0, Wind 0.95
Target voltageMeasured data
ZsourceFault contribution
- Wind 0.67: Rated current*1.5 times)
- PV 1.0: Rated current*1 times)
TransformerImpedance/TapImpedance (~6%), Tap Ratio
LineImpedanceImpedance (If data none, the impedance of 20 km line apply)
Figure A1 shows the modified IEEE 18 bus test system based on PowerFactory which should be compared the validation of the proposed algorithm.
Figure A1. Modified IEEE 18-bus test system based on PowerFactory.
Energies 14 02301 g0a1

References

  1. Korea Power Exchange. Recent Power System Issue. In Proceedings of the 51th KIEE Summary Conference, Yongpyeong, Korea, 15–17 July 2020. [Google Scholar]
  2. Ministry of Trade, Industry, and Energy. In Proceedings of the 9th Basic Plan of Electricity Supply and Demand [Draft], Sejong-si, Korea, December 2020.
  3. Wu, F.F.; Moslehi, K.; Bose, A. Power System Control Center: Past, Present, and Future. Proc. IEEE. 2005, 93, 1890–1908. [Google Scholar] [CrossRef] [Green Version]
  4. Darshana, U.; Srinivas, S. SCADA (Supervisory Control and Data Acquisition) Systems: Vulnerability Assessment and Security Recommendations. Comput. Secur. 2020, 89, 1–18. [Google Scholar]
  5. Marco, T.; Ruggero, C.; Luca, S.; Grazia, B. Smart Grid State Estimation with PMUs Time Synchronization Errors. Energies 2020, 13, 5148. [Google Scholar]
  6. Junjian, Q.; Kai, S.; Wei, K. Optimal PMU Placement for Power System Dynamic State Estimation by Using Empirical Observability Gramian. IEEE Trans. Power Syst. 2015, 30, 2041–2054. [Google Scholar]
  7. Ziad, M.A.; Seyed-Ehsan, R.; Mohammad, S.J.; Foad, H.G.; Shady, H.E.A.A. Dual Enhancement of Power System Monitoring: Improved Probabilistic Multi-Stage PMU Placement with an Increased Search Space & Mathematical Linear Expansion to Consider Zero-Injection Bus. Energies 2018, 11, 1429. [Google Scholar]
  8. Jovicic, A.; Gabriela, H. Linear State Estimation and Bad Data Detection for Power Systems with RTU and PMU measurements. IET Gener. Transm. Distrib. 2020, 14, 5675–5684. [Google Scholar] [CrossRef]
  9. Costa, S.; Albuquerque, A.; Bez, D. An Estimation Fusion Method for Including Phasor Measurements into Power System Real-time Modeling. IEEE Trans. Power Syst. 2013, 28, 1910–1920. [Google Scholar] [CrossRef]
  10. Khazraj, H.; Silva, F.M.F.D.; Bak, C.L. Bad Data Detection and Identification for State Estimation: An Enhanced Strategy. In Proceedings of the CIGRÉ Symposium, Dublin, Ireland, 29 May–2 June 2017. [Google Scholar]
  11. Hwang, M.D.; Brewer, B. Using State Estimation for Parameter and Model Error identification. In Proceedings of the IEEE Power Energy Society General Meeting, Minneapolis, MN, USA, 25–29 July 2010; pp. 1–5. [Google Scholar]
  12. Jian, C.; Sarma, N.D.R.; Garcia, F.; Sills, A.; Shrestha, P.; Mohanadhas, T.D.; Weatherly, J.; Mortensen, T.; Dumas, J. ERCOT’s Experience in Identifying Parameter and Topology Errors using State Estimator. In Proceedings of the IEEE Power Energy Society General Meeting, Minneapolis, MN, USA, 25–29 July 2010; pp. 1–5. [Google Scholar]
  13. Yuzhang, L.; Abur, A. A Highly Efficient Bad Data Identification Approach for Very Large Scale Power Systmes. IEEE Trans. Power Syst. 2018, 33, 5979–5989. [Google Scholar]
  14. Yanbo, C.; Feng, L.; Shengwei, M.; Guangyu, H.; Qiang, L.; Yanlan, F. An Improved Recursive Bayesian Approach for Transformer Tap Position Estimation. IEEE Trans. Power Syst. 2013, 28, 2830–2841. [Google Scholar]
  15. Pires, R.C.; Mili, L.; Lemos, F.A.B. Constrained Robust Estimation of Power System State Variables and Transformer Tap Positions under Erroneous Zero-Injections. IEEE Trans. Power Syst. 2014, 29, 1144–1152. [Google Scholar] [CrossRef]
  16. Soman, S.A.; Khaparde, S.A.; Pandit, S. Computational Methods for Large Sparse Power Systems Analysis-An Object Oriented Approach; Springer Science & Business Media: Berlin/Heidelberg, Germany, 2002. [Google Scholar]
  17. WECC. WECC Wind Plant Dynamic Modeling Guideline; WECC: Salt Lake City, UT, USA, 2014. [Google Scholar]
  18. WECC. Solar Photovoltaic Power Plant Modeling and Validation Guideline; WECC: Salt Lake City, UT, USA, 2019. [Google Scholar]
  19. Cho, Y.S. A Novel Approach to Enhance the Accuracy of Network Topology Optimization. Elecr. Power Compo. Systems. 2017, 45, 131–146. [Google Scholar] [CrossRef]
  20. Monticelli, A. State Estimation in Electric Power Systems: A Generalized Approach; Springer: Boston, MA, USA, 1999. [Google Scholar]
  21. Abur, A.; Exposito, A.G. Power System State Estimation-Theory and Implementation; Marcel Dekker Inc.: New York, NY, USA, 2004. [Google Scholar]
  22. Wood, A.J.; Wollenberg, B.F.; Sheble, G.B. Power Generation, Operation, and Control; Wiley: New York, NY, USA, 2014. [Google Scholar]
  23. Cho, Y.S.; Jang, G.S. New Technique for Enhancing the Accuracy of HVDC systems in State Estimation. Int. J. Electr. Power Energy Syst. 2014, 54, 658–663. [Google Scholar] [CrossRef]
  24. Power System Test Case Archive. 1993. Available online: http://www.ee.washington.edu/research/pstca/pf14/pg_tca14bus.htm (accessed on 15 April 2021).
  25. PowerFactory, DigSILENT. 2020. Available online: https://www.digsilent.de/en/ (accessed on 15 April 2021).
  26. Noda Operating Guide. State Estimator Standards and Telemetry Standards; ERCOT: Austin, TX, USA, 2019. [Google Scholar]
  27. Dinesh, S.N.; Liang, Z.; Wei, S.; Matthew, V.; Soumen, G.; Mani, S.; Gordon, L.; Chiang, H.D.; Hua, L. State Estimator for CA ISO Market and Security Applications-Relevance and Readiness. In Proceedings of the IEEE Power Energy Society General Meeting, Pittsburgh, PA, USA, 25–29 August 2008; pp. 1–8. [Google Scholar]
Figure 1. Application structure of REMS.
Energies 14 02301 g001
Figure 2. State estimation database.
Energies 14 02301 g002
Figure 3. Network analysis structure in the REMS.
Energies 14 02301 g003
Figure 4. Locations of the analog points in KEPS.
Energies 14 02301 g004
Figure 5. Connectivity model of three-winding transformer [19].
Energies 14 02301 g005
Figure 6. Flowchart of the topology error processing associated with transformer.
Energies 14 02301 g006
Figure 7. State estimation structure.
Energies 14 02301 g007
Figure 8. Modified IEEE 18-bus test system including renewable energy.
Energies 14 02301 g008
Figure 9. Comparison of MW and MVAR between true and Case 7.
Energies 14 02301 g009
Figure 10. Voltage magnitude among the true value, the proposed algorithm and PowerFactory.
Energies 14 02301 g010
Figure 11. Voltage magnitude of a 345-kV bus for the estimation results and measurements.
Energies 14 02301 g011
Figure 12. Generation for the estimation results and measurements of the 50 largest units.
Energies 14 02301 g012
Figure 13. Branch flow for the estimation results and measurements of the 50 largest trans. lines.
Energies 14 02301 g013
Figure 14. Branch flow between the estimation results and measurements for the SE 100 runs.
Energies 14 02301 g014
Figure 15. Generation between the estimation results and measurements for the SE 100 runs.
Energies 14 02301 g015
Figure 16. Estimation results and measurements for the branch flow in the Nam-Seoul division.
Energies 14 02301 g016
Table 1. The 9th Basic Plan for Long-Term Electricity Supply and Demand.
Source2019202020302034
Renewable15.819.357.978.1
LNG39.741.357.060.6
Coal36.834.732.629.0
Nuclear23.324.720.419.4
Table 2. Conditions of feasibility check for three winding transformer.
CASECB’s StateMeasurementTR State
1Close>ThresholdIn-service
2Close<ThresholdOut-of-service
3Open>ThresholdOut-of-service
4Open<ThresholdOut-of-service
5Previous SE ClosePrevious SE > ThresholdIn-service
Table 3. Measurements related to the transformer in Korea.
TR TypeS/S TypeWinding TypeTap Adjust.Metering Point of Pri. WindingMetering Point of Sec. Winding
P1Q1V1TapP2Q2V2
IGEN2TRXXXOXXXO
II765 kV3TROOOOOOOO
III345 kV3TROXXOOOOO
IV154 kV2TROXXOOOOX
O: Telemetered point, X: Non-telemetered point, Gen: Power plant.
Table 4. Scenario for validating the state estimation algorithm.
Scenario IDValidation FunctionDescription
AEstimation- Estimate the voltage and flow
- Range of suspect ratio * between 0% and 20%
BBad data processing- Identification and replacement of bad data
- Good data with wrong value
CTap position estimation- Identification and replacement of tap position
- Good data with wrong value
- Suspect data for tap position and Mw/Mvar
DComparative study- Compare the results of the proposed algorithm with existing method
* ratio = 100× (suspected measurement/all measurements). The measurement has a quality code, such as good and suspect.
Table 5. Estimated voltage magnitude and angle for Scenario A.
Bus Num.True ValueCase 1: Ratio * 0%Case 2: Ratio * 10%Case 3: Ratio * 20%
Mag.Ang.Mag.Ang.Mag.Ang.Mag.Ang.
11.0650.001.0650.001.0650.001.0650.00
21.045−3.521.045−3.521.045−3.521.046−3.42
31.012−10.591.012−10.591.012−10.591.011−10.75
40.986−8.960.986−8.960.986−8.970.987−9.22
50.998−7.260.998−7.260.998−7.260.998−7.44
60.942−12.560.942−12.560.942−12.560.940−12.81
70.976−10.050.976−10.050.976−10.050.979−10.29
80.979−10.050.979−10.050.979−10.050.982−10.28
90.979−9.740.979−9.740.979−9.740.981−9.98
100.944−14.220.944−14.220.944−14.220.942−14.40
110.934−14.210.934−14.210.934−14.210.932−14.42
120.967−10.040.967−10.050.967−10.040.966−10.33
130.905−13.520.905−13.520.905−13.520.903−13.77
140.946−9.170.946−9.170.946−9.180.943−9.31
151.000−1.810.999−1.820.999−1.840.995−1.86
161.000−0.611.000−0.610.999−0.640.995−0.65
171.010−9.921.010−9.921.010−9.921.009−10.10
180.970−8.210.970−8.220.970−8.210.969−8.50
* Suspect ratio (15/115 = 10%, 30/115 = 20%), Mag. (pu)/Ang. (degree).
Table 6. Estimated generation for Scenario A.
IJ. Num.True ValueCase 1: Ratio 0%Case 2: Ratio 10%Case 3: Ratio 20%
MWMVARMWMVARMWMVARMWMVAR
Gen1181.215.7181.215.7181.215.7179.115.1
Gen280.047.180.047.180.047.181.846.3
Gen335.01.235.01.234.81.034.90.3
Gen420.0−3.120.0−3.120.0−3.119.2−2.9
Gen550.05.850.05.950.05.949.95.6
Table 7. Estimated branch flow for Scenario A.
BR. Num.True ValueCase 1: Ratio 0%Case 2: Ratio 10%Case 3: Ratio 20%
MWMVARMWMVARMWMVARMWMVAR
LN1116.1−1.5116.1−1.5116.1−1.5112.6−1.8
LN367.03.267.03.267.03.269.63.8
LN1141.413.441.413.441.413.441.215.2
LN1427.30.727.30.727.30.727.31.1
TR126.318.326.318.426.318.326.618.9
TR272.839.772.839.772.839.671.733.4
Table 8. Results of the bad data processing for Scenario B.
#S/SW.ID *Meas. TypeTrue ValueCase 4Case 5Case 6Case 7
I Est.I Est.I Est.I Est.
1aMw80 79.7 80 80 77.8
bMvar12.7 12.7 12.82015.5 12.3
cVolt160.9 160.9152160.9152160.8 160.9
dMw−113.8−90−113.8 −113.8 −113.8 −113.2
eMw44.0 43.9 43.9 43.9 43.9
fMw61.14061.0 61.1 61.1 60.9
gMvar3.2303.1 2.68202.3 4.5
2hMw94.2 93.9 94.2 94.27583.5
ivolt155.8 155.9150156.0 156.0 155.5
jMw−65.1−40−64.8 −65.1 −65.1−45−61.8
kMw−20 −20.1 −20 −20−40−15.3
mMvar18.3 18.4 18.9 18.7 16.4
* Wrong measurement ID, Input value of the wrong measurement.
Table 9. Normalized residuals and sensitivity for the detection and replacement of bad data.
CaseW.IDNormalized
Residual
Sensitivity
Value ††
CaseW.IDNormalized
Residual
Sensitivity
Value ††
4d2.98−0.2396b1.17- *
f3.440.209 c2.850.057
g4.58−0.275 g2.806−0.177
j3.72−0.2337h3.42−0.235
5c2.880.058 j5.02−0.304
i1.0- * k2.01- *
* Normalized residual below a threshold of 2.5, Equation (4), †† Equation (7).
Table 10. Results of the bad data processing for Scenario C.
TR Num.W.ID *Meas. TypeTrue ValueCase 8Case 9Case 10Case 11
I Est.I Est.I Est.I Est.
1oTap11511911 111611
pVolt153.7 153.7 153.7 153.7150153.6
2qTap9 9795959
rVolt150.4 150.4 150.4150150.3150150.3
* Wrong measurement ID, Input value of wrong measurement.
Table 11. Sensitivity and tap position per iteration for Case 11.
Iter.TapSensitivity ValueAdjust. TapIter.TapSensitivity ValueAdjust. Tap
116Not conv. 15Not conv.
2160.2442−625−2.4429+3
310−0.0255+138−0.6034+1
411Full Conv. 49Full Conv.
Table 12. Scenario of a dynamic test on KEPS.
Scenario IDFunctionDescription
EEstimation- Estimate the voltage and flow
- Evaluate the performance based on ERCOT standard
FMetering accuracy- Analyze the system at different meter accuracy range
- 100 runs at both MW measurements of line
GSevere event- Perform the pseudo measurement processing and bad dataprocessing for severe events
- Suspect of all measurements in station or division
Table 13. Renewable energy model for a dynamic test.
TypeInstalled CapacityNum. of ModelsGenerationCapacity FactorConnection Voltage
Wind2161 MW621037 MW48%154 kV
Solar7122 MW1892849 MW40%22.9 kV
Table 14. Summary of the state estimation.
ItemResults
Number of iteration/Number of state variable9/8788
Number of bad data processing12
Largest bus mismatch of MW/Mvar7 MW/36 Mvar
Suspect rate3%
Table 15. Comparison between the measurements and the state estimation.
ItemMeasurementState EstimationDifference
Generation MW58,74858,7491
Generation Mvar10,87810,532345
Load MW57,47057,870400
Load Mvar10,6979728968
Table 16. State estimation performance requirements of ERCOT [26].
ItemDescription
Convergence98% of runs during a 1-month period.
Branch flowOn all transmission elements >100 kV, the difference between estimation and measurement shall be <10 MW or 10% of the associated emergency rating on at least 95% of samples measured in a 1-month period.
Critical flowThe difference between estimation and measurement shall be <3% of the associated emergency rating on at least 95% of samples measured in a 1-month period.
VoltageFor the 20 most important station voltage points, the telemetered voltage minus estimation shall be within 2% of the telemetered measurement on at least 95% of samples measured in a 1-month period.
Table 17. State estimation performance requirements of CASIO [27].
ItemDescription
SolutionChi-square percentile >90% and normalized residuals of measurement <3.
Negative load and
generation
The number of the negative load shall be <50. The summation of the negative load shall be <100 MW or the ratio between the negative load and the system load shall be <2%. The number of the negative generation units shall be <50, and the summation of the negative generation shall be <50 MW.
Table 18. Results for testing the performance requirements based on ERCOT.
ItemDescriptionRef.Results
Branch flowAll trans. elements ≥154 kV10% of emer. ratingMax: 2.17%
SE: 762/ME: 710[MW]
Critical flowAll 765 kV line & interface line
between metropolitan
3% of emer. ratingMax: 0.4%
SE: 1674/ME: 1637[MW]
VoltageAll voltages ≥345 kV2% of tele. voltageMax: 0.92%
SE: 754/ME: 761[kV]
Table 19. Performance of the state estimation for the metering accuracy.
ItemMeasurement Error
3%5%7%10%
Average of all transmission lines difference between estimation and telemetered data for MW2.972.982.993.0
Number of divergence34612
Average of largest bus mismatch for MW11.4211.2611.0710.80
Average of total generation difference between estimation and telemetered data for MW5.555.866.147.42
Table 20. Comparative results for severe events.
ItemDescriptionVolt. LevelUnitNumber of Suspect Station
43163
VoltageAverage of voltage difference between estim. and tele.345kV0.730.620.59
154kV0.971.031.08
Largest voltage differenceAllkV2.102.302.59
FlowAverage of flow difference between estim. and tele.AllMw2.364.2018.20
Mvar3.645.028.60
Largest flow differenceAllMw21.5130.99265.72
Mvar62.4245.3665.71
RatioRatio of good data-%969390
Publisher’s Note: MDPI stays neutral with regard to jurisdictional claims in published maps and institutional affiliations.

