1. Introduction
Permanent magnet synchronous motors are widely used in aerospace, computational numerical control (CNC) spindle drives, industrial automation, and other fields, which often require a wide speed range, due to their high power density [
1]. Flux-weakening and over-modulation are the mostly used methods to obtain a wide speed range for a motor drive system under certain voltage supply and current [
2].
The flux-weakening control strategies for a classical vector control system with two inner current loops can be roughly divided into three categories: feedforward strategy, feedback strategy, and hybrid strategy. The feedforward strategy, just as its name implies, feedforwards a compensation component calculated from steady voltage equations of motor into its magnetic current reference. The method in [
3] uses a motor equation to calculate current reference values and considers stator resistance voltage drop. In [
4], current reference values are calculated by the Newton–Raphson algorithm, and the control accuracy of current set-points can be improved. However, the feedforward strategy suffers limited accuracy, affected by motor parameters. Further, the feedback strategy is proposed to improve robustness of the system. It usually uses voltage amplitude error [
5], over-modulation voltage error [
6], and action time of the active vector in space vector modulation (SVM) [
7], which is not suitable for six-step operation, as feedback. Methods in [
6,
7] achieve a relatively high voltage utilization rate and therefore greater torque and speed output, as they use the voltage vector effectively in the over-modulation region. Several hybrid strategies are proposed by adding the feedback loop into the feedforward path [
8,
9] and improve performance of flux-weakening control, although the structure of them are comparatively complex.
In the last decades, as a direct AC–AC power converter, the indirect matrix converter (IMC) has drawn the attention of researchers on motor drive applications because of its advantages such as no intermediate energy storage, four quadrant operation, sinusoidal input and output waveforms, and adjustable input power factor [
10]. Compared with the traditional back-to-back dc-link converters, the control of the IMC is complex, but the absence of bulky electrolytic capacitors in the IMC is foreseen as a more reliable and compact solution for AC–AC power conversion [
11]. However, the maximum linear voltage transmission ratio (VTR) of the IMC is only 0.866, which makes the speed regulation range of the IMC-permanent magnet synchronous motor drive (PMSM) narrower than that of traditional AC–DC–AC converters, and limits its application in industry [
12]. Recently, the IMC has made great progress in over-modulation strategy. In [
13,
14], the over-modulation methods are realized by the linear superimposed principle, which can further improve VTR and reduce the output voltage harmonic components. The over-modulation method in [
15] based on predictive control is proposed to improve the input/output current performance, and VTR can reach 0.987. Although research on over-modulation of matrix converter (MC) has been carried out, few of them concern the flux-weakening control strategy of the IMC-surface mounted permanent magnet synchronous motor drive (SPMSM).
Due to no energy storage device existing in the DC link of the IMC, the input DC voltage of its inverter stage varies periodically, which increases the difficulty of flux-weakening control of the IMC-SPMSM. Moreover, in order to obtain higher VTR and better over-modulation performance, it is necessary to design over-modulation methods of the rectifier stage and inverter stage over-modulation synthetically, which is quite challenging work.
In this paper, firstly, an over-modulation method for the IMC-SPMSM to increase VTR to 1 with linear voltage gain is proposed. Then, by analyzing the particularity of flux-weakening control of the IMC-SPMSM, a coordinated operation mode of flux-weakening controller and rectifier stage modulation depth controller is designed, and a wide speed range flux-weakening control strategy based on voltage error feedback is proposed. For the motor system driven by the IMC, this paper combines over-modulation and flux-weakening control for the first time and applies them to this kind of system. We hope that the research can show some characteristics of this kind of system under the requirements of a wide speed range and provide a solution for broadening the speed range of the system.
2. Structure of Wide Speed Range Operation Control Strategy for IMC-SPMSM
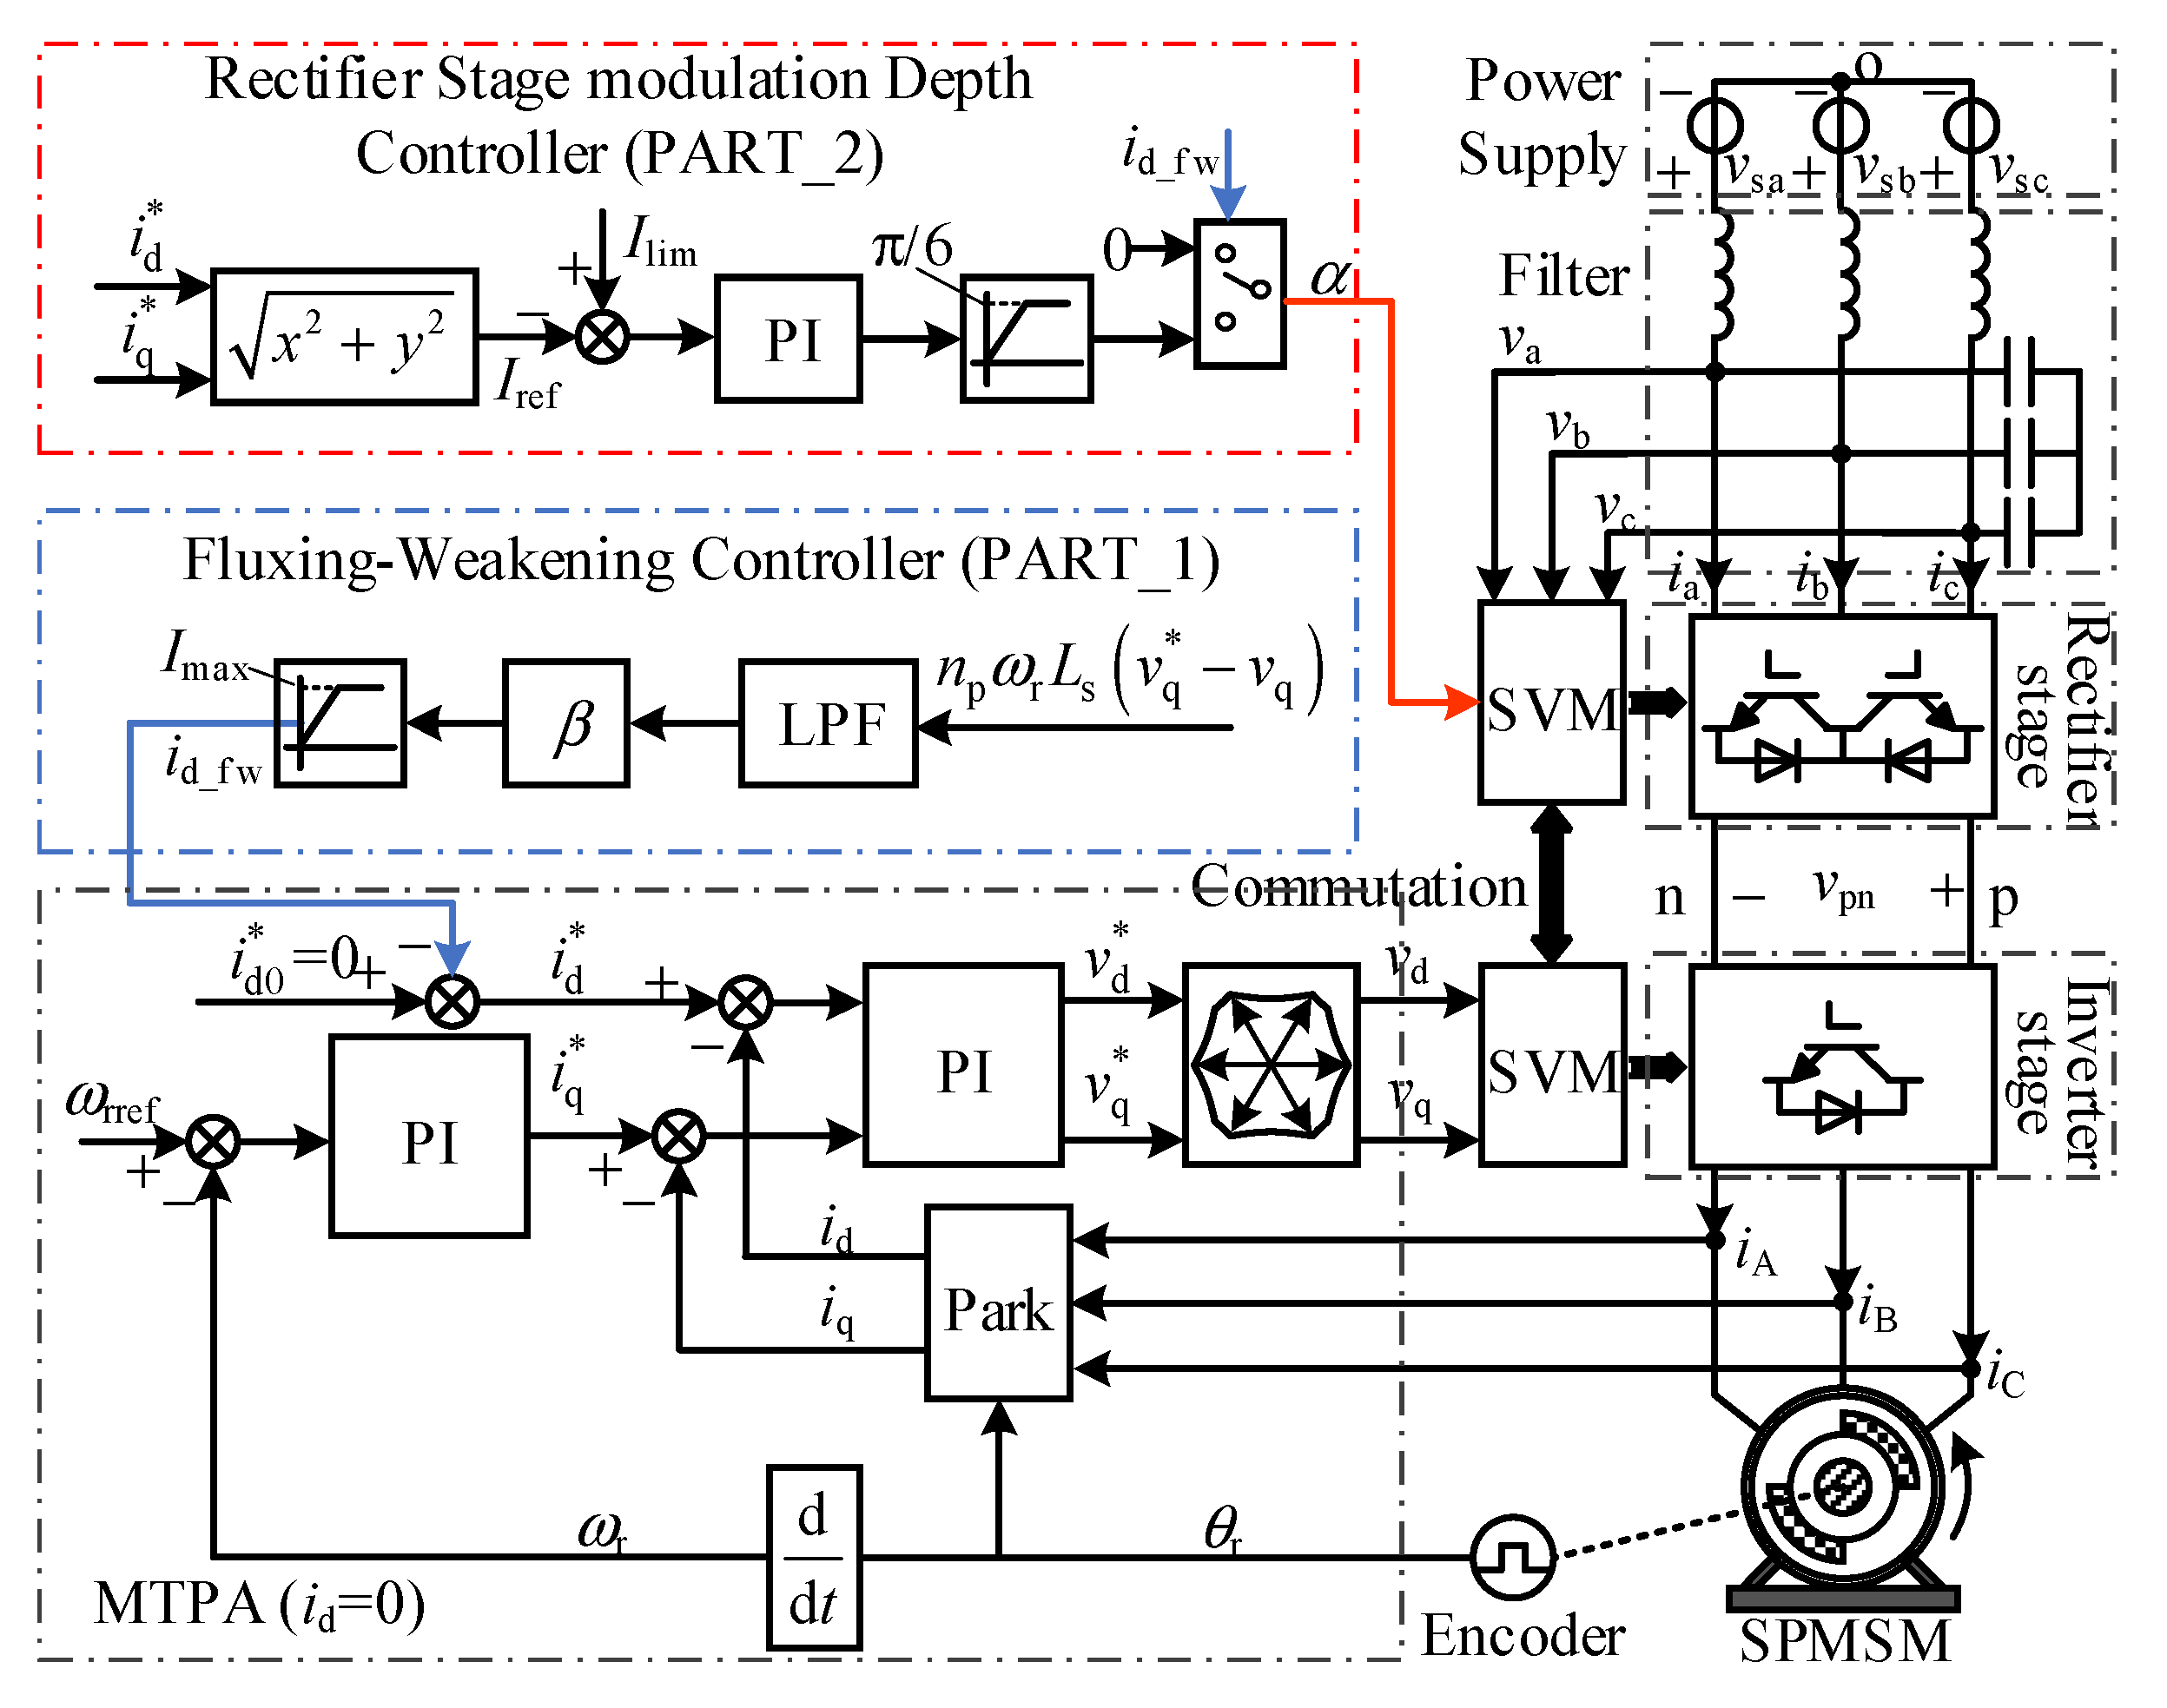
The structure diagram of the proposed wide speed range control strategy is shown in
Figure 1. When operating below the rated speed,
id = 0 vector control is used. For SPMSM, it achieves maximum torque per ampere (MTPA). Modulation of the rectifier stage is the SVM strategy without zero vector, and that of the inverter stage is the same as the SVM for two-level voltage source inverter (VSI) [
16]. When SPMSM operates above the rated speed, the flux-weakening control mode is adopted. The structure diagram of the proposed voltage error feedback flux-weakening control scheme of the IMC-SPMSM is shown in PART_1 of
Figure 1.
Modulations of the inverter stage and rectifier stage of the IMC switch between the linear region or the over-modulation region according to the operation requirements (speed reference value and load torque). Specifically, when output of the voltage error feedback fluxing-weakening controller (PART_1) is greater than 0, the flux-weakening control works and modulation of the inverter stage switches to minimum phase error over-modulation [
17]. When the output of the rectifier stage modulation depth controller (PART_2) is greater than 0, modulation of the rectifier stage switches from the linear region to over-modulation.
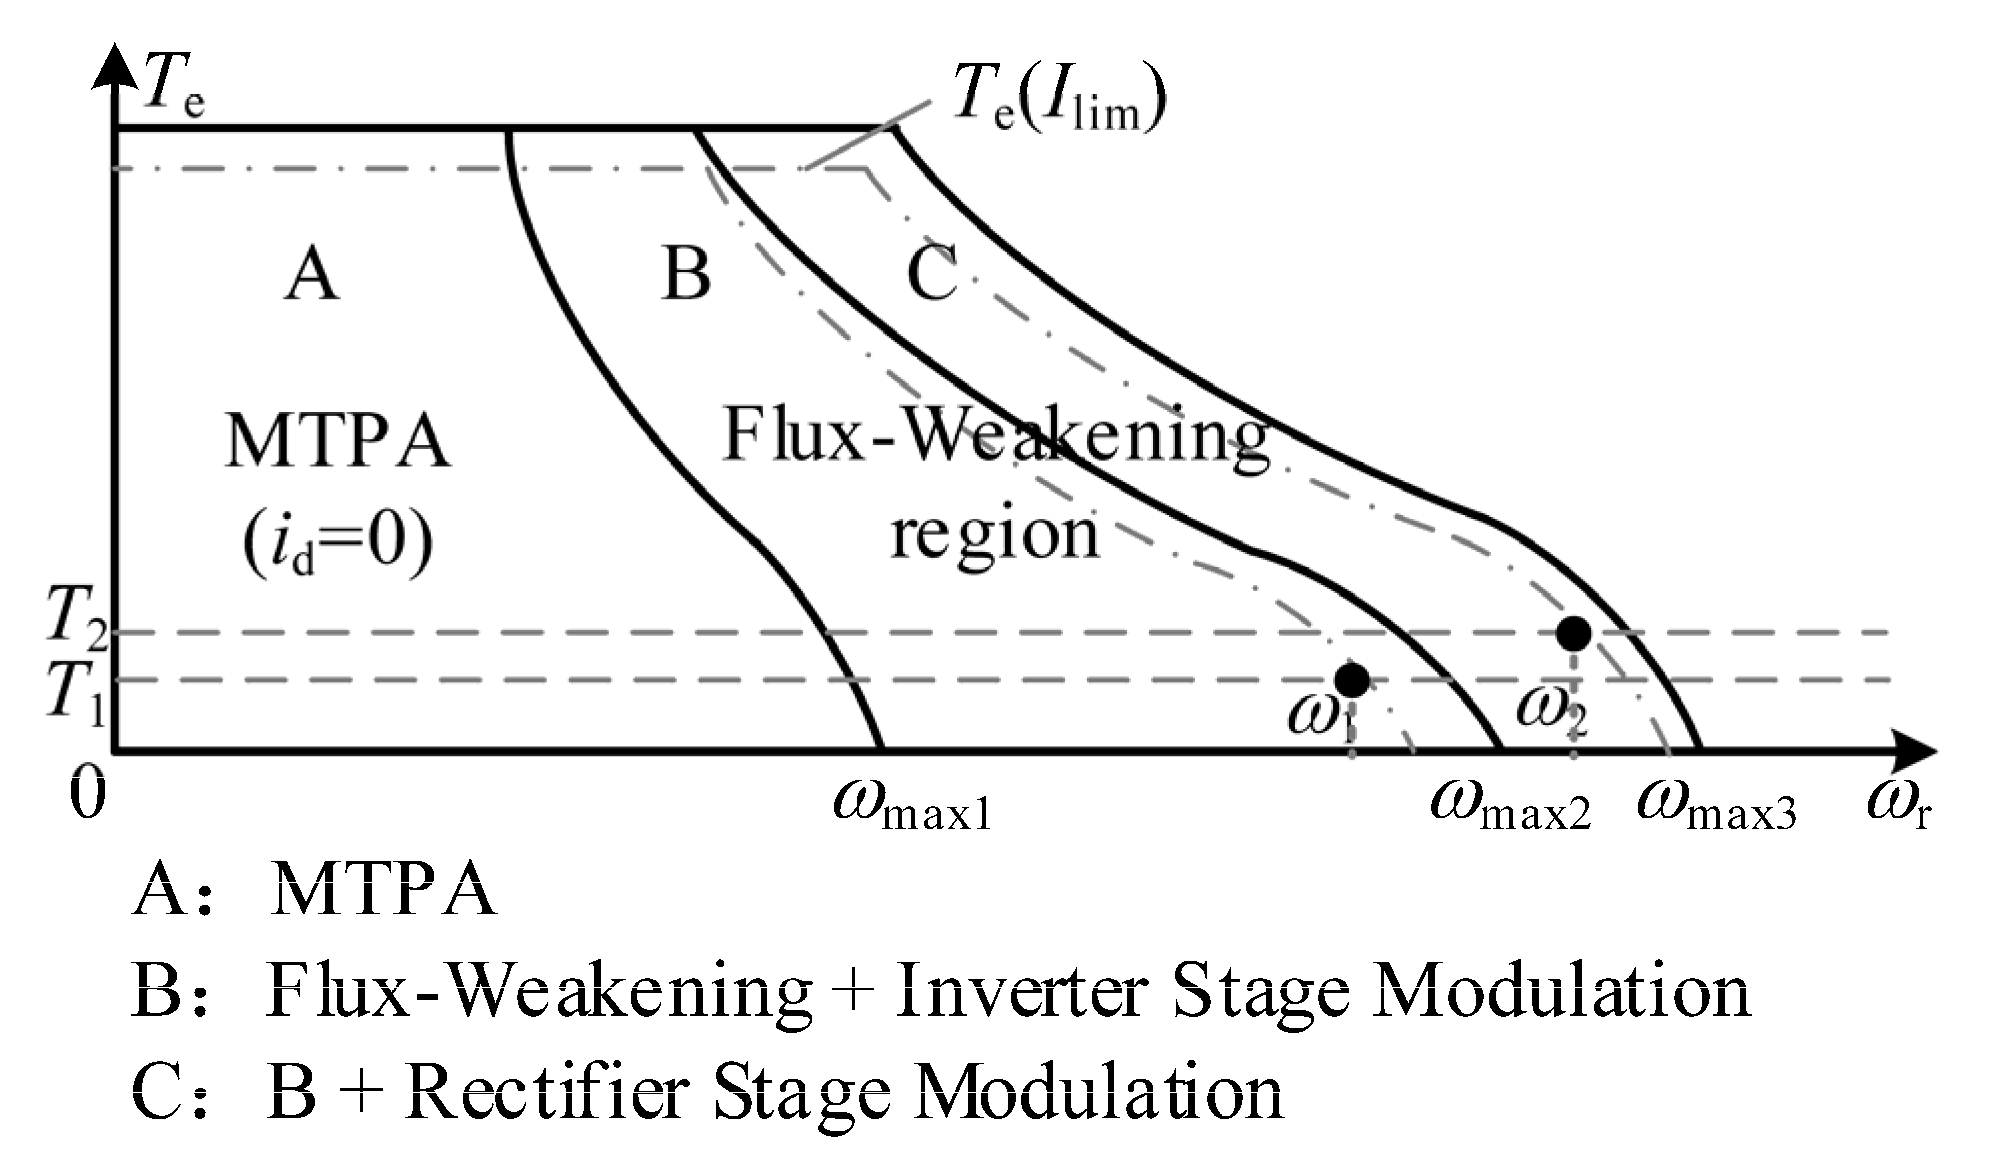
The speed regulation range of the proposed strategy is shown in
Figure 2, where
ωmax1,
ωmax2, and
ωmax3 are the maximum operating speeds that can be achieved in different regions.
Table 1 summarizes the control strategies and modulation methods that work in different regions (Y stands for working;
q stands for range of VTR).
3. Modulation Method of IMC-SPMSM
3.1. Rectifier Stage Modulation
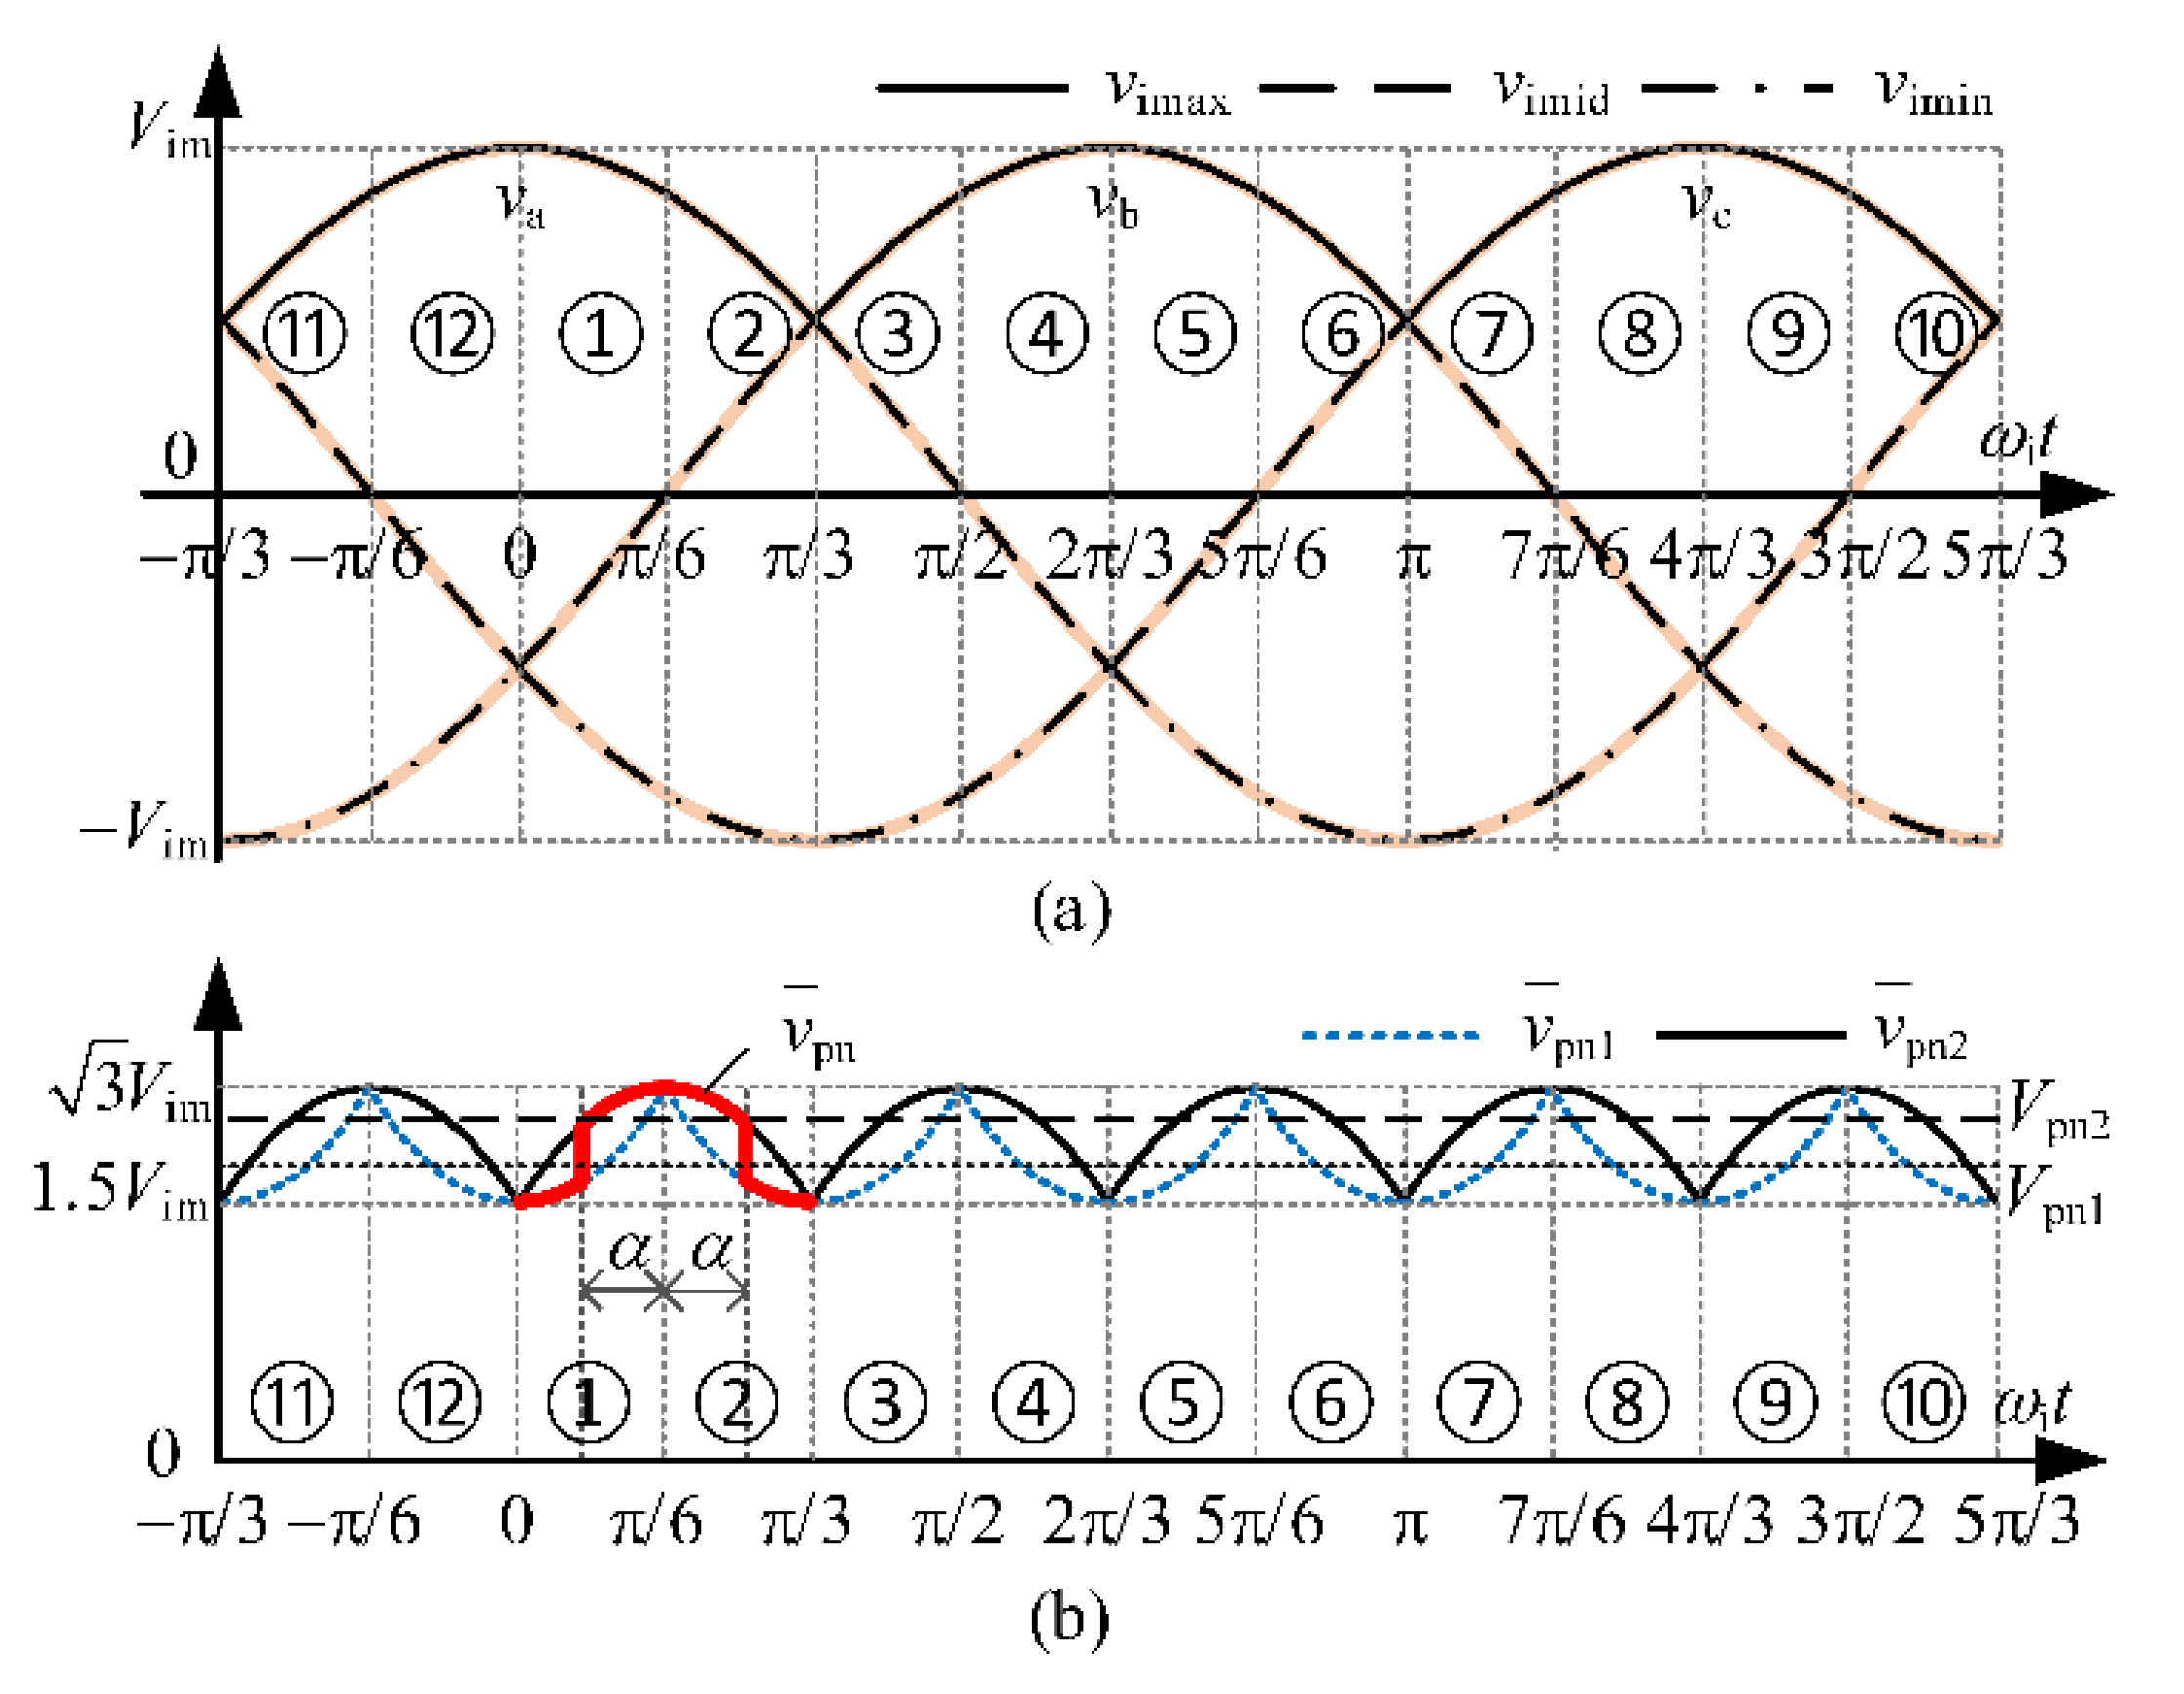
It is assumed that three-phase input voltage is
where
Vim and
ωi are amplitude and angular frequency of input voltage, respectively.
Define instantaneous maximum, intermediate, and minimum value of three-phase input voltage as
vimax = max{
va,
vb,
vc},
vimid = mid{
va,
vb,
vc}, and
vimin = min{
va,
vb,
vc}, respectively. The input voltages in the unique period can be divided into 12 sectors, as shown in
Figure 3a.
During each modulation cycle, dc-link voltage vpn varies in {Δvimax, Δvimid} as power devices switching on and off. Define modulation period of the IMC as Ts, the time of vpn = Δvimax is Tmax, and the time of vpn = Δvimid is Tmid, then 0 ≤ Tmax, Tmid ≤ Ts, Tmax + Tmid = Ts.
In this paper, modulation of the rectifier stage has two modes: CASE 1 and CASE 2. Defined as follows:
The average value of dc-link voltage in one carrier cycle,
, of CASE 1 can be derived as
of CASE 2 can be derived as
where
ki = 1, 2, …, 12 is the sector index of input voltage, corresponding to ①, ②, …, ⑫ in
Figure 3.
The waveform of
is shown in
Figure 3b. It can be seen that
and
varies periodically. The average values of them in each sector can be derived as
Based on CASE 1 and CASE 2, an IMC rectifier stage modulation strategy can be constructed as follows, where sector ① is taken as an example for demonstration.
Defining
α as the modulation depth angle of the rectifier stage, when
ωit ∈ [0, π/6 −
α ), CASE 1 is used for the rectifier stage modulation, and
is equal to
; when
ωit ∈ [π/6 −
α, π/6), CASE 2 is used for the rectifier stage modulation, and
is equal to
. According to area equivalence, there are
Substituting (6) and (8) into (11), we have
It can be seen from (12) that when
α ∈ [0, π/6], the average dc-link voltage
Vpn ∈ [9ln(3)
Vim/(2π), 3
Vim/π]. In particular, when
α = 0, only CASE 1 works. When
α = π/6 rad, only CASE 2 works. The calculation method of
α will be given in
Section 4.3.
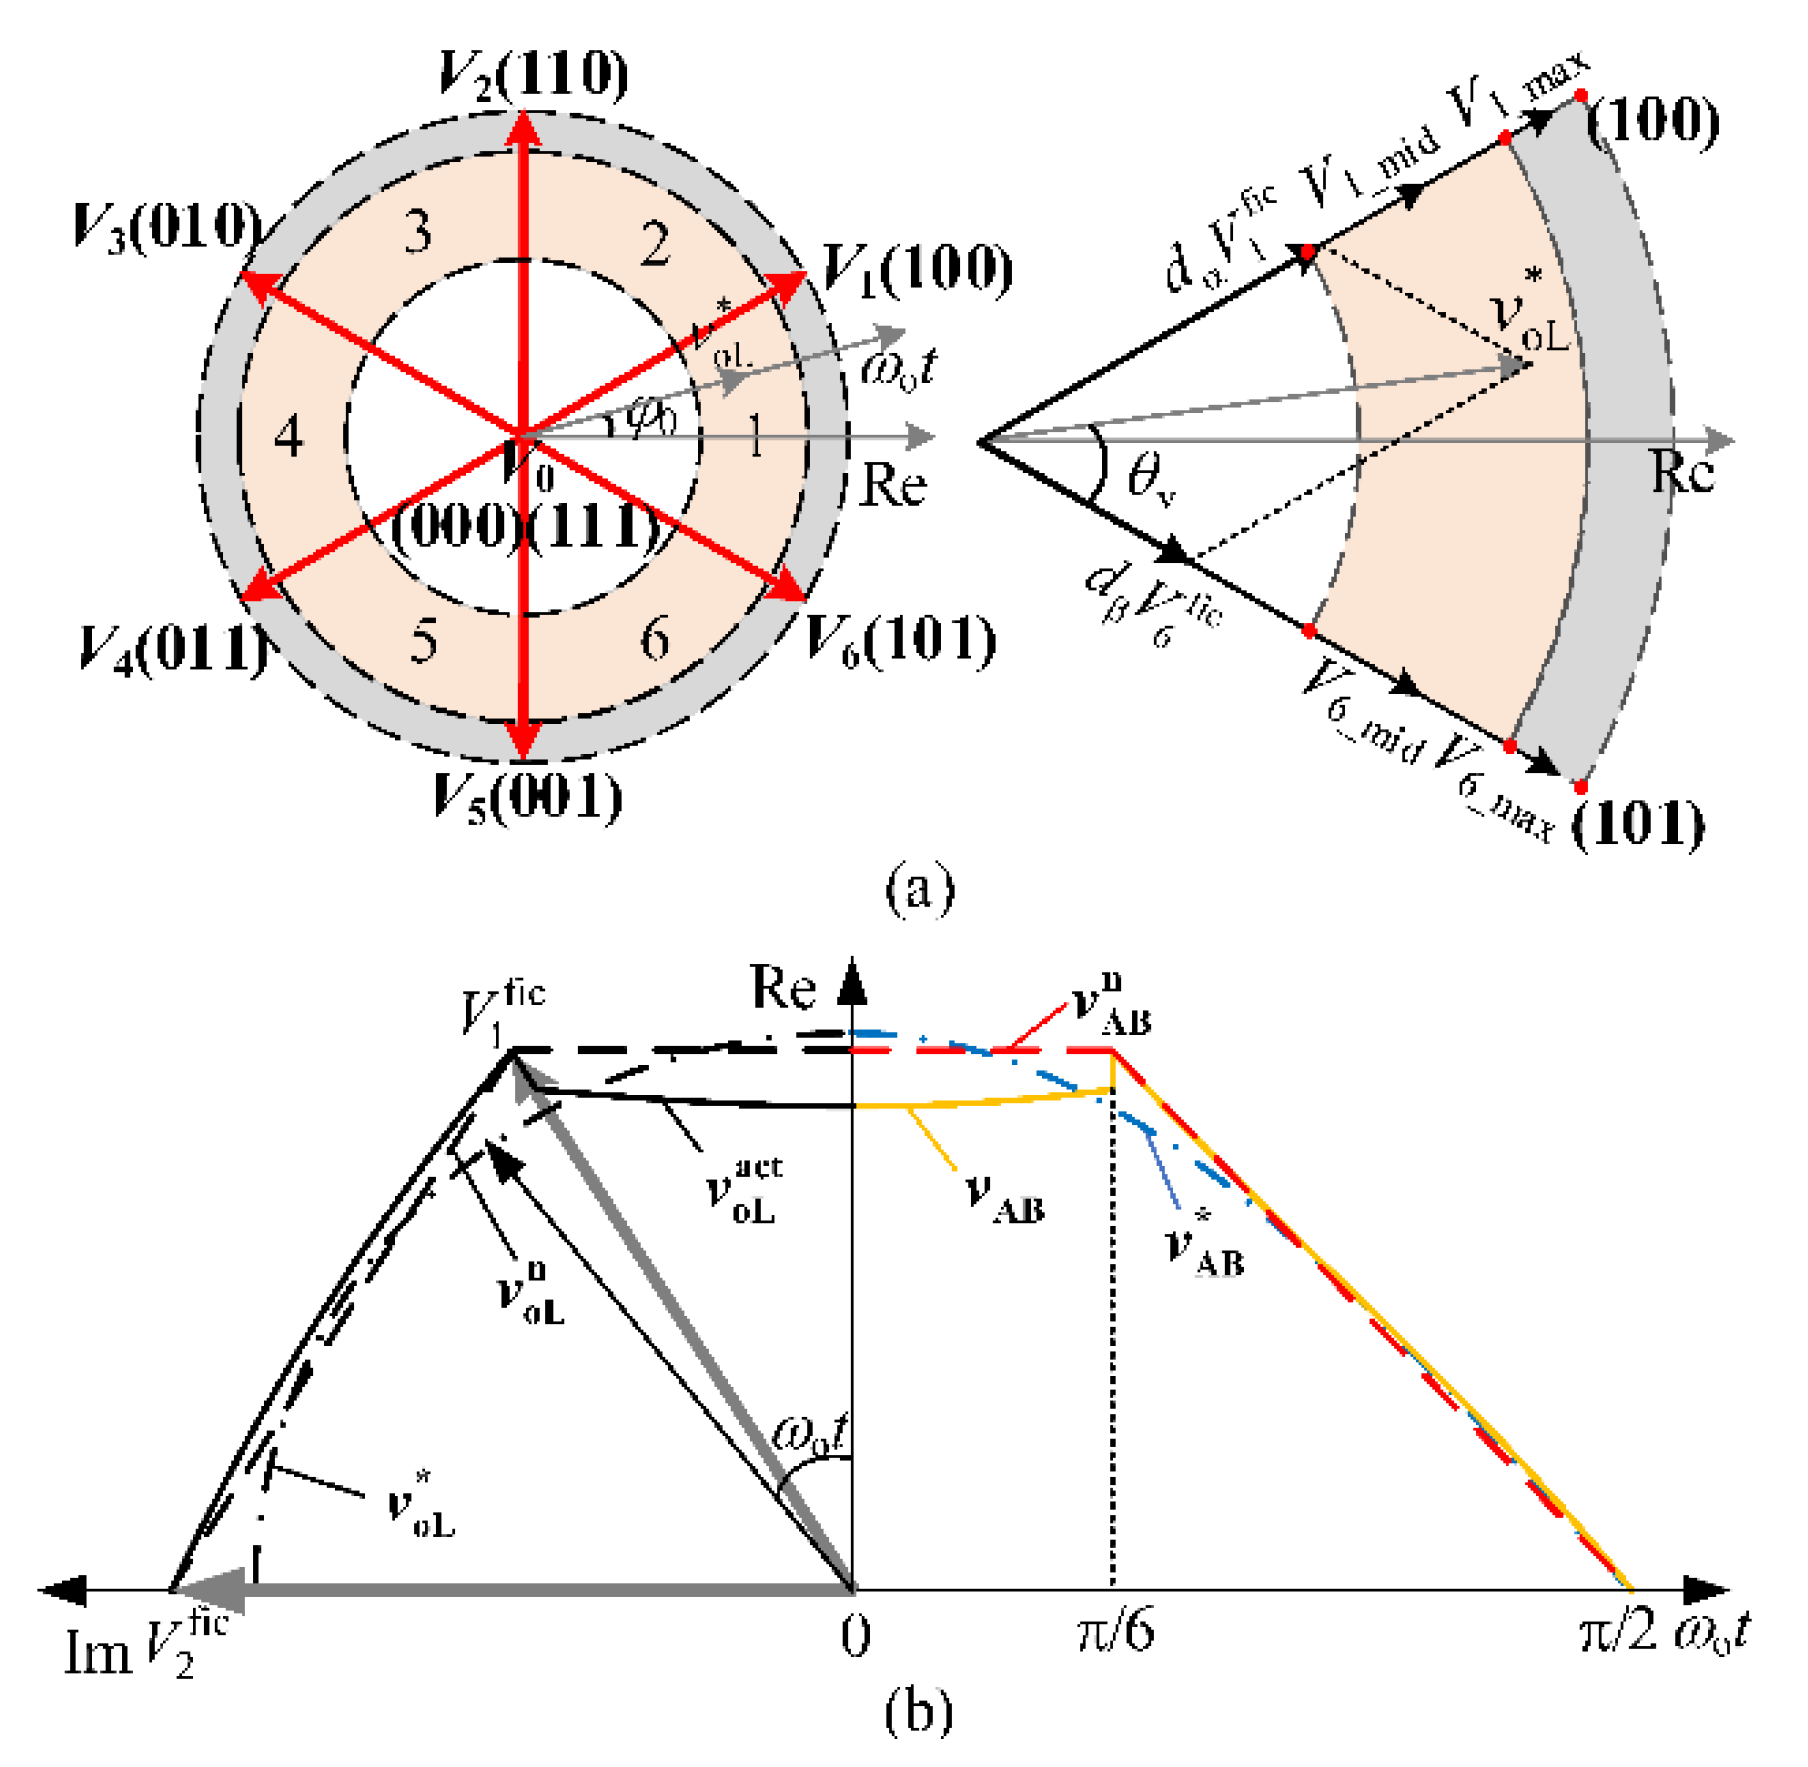
3.2. Inverter Stage Modulation
Space vectors and sectors of SVM for the inverter stage of the IMC is shown in
Figure 4a. There are six effective vectors
V1~
V6 with fixed spatial positions and varying amplitudes, and two zero vectors (uniformly labeled as
V0). The effective vectors divide the complex plane into six sectors. In
Figure 4,
φi is the input power factor angle,
φ0 is the initial phase angle of the output voltage,
km is the ratio of angular frequencies of output voltage and input voltage, i.e.,
km =
ωo/
ωi.
Since
vpn changes with the modulation process of the rectifier stage, amplitude of the effective vector
Vl also changes. Supposing that
Vl is equal to
Vl_max and
Vl_mid when
vpn is Δ
vimax and Δ
vimid, respectively, then equivalent basic voltage vectors can be derived as
where
is the amplitude of
and
;
l = 1, 2, …, 6 is the sector index.
When the reference output line voltage vector
is located in Sector 1, it can be synthesized from equivalent basic vectors
,
, and zero vector
.
where
dα,
dβ, and
d0 represent duty cycle of
,
, and
, respectively.
According to the volt-second balance,
dα can be expressed as
where
θv is the angle between
and
,
θv∈[0, π/3), as shown in
Figure 4a,
mv is the modulation ratio of output voltage, and
,
is the amplitude of
.
In over-modulation mode, the endpoint of
is located outside of the regular hexagon constructed by
Vlfic, and the minimum phase error over-modulation method is used for the inverter stage modulation. The output line voltage vector
is kept in phase with
, and its endpoint is located on the boundary of the regular hexagon (note: hexagon radius,
, is variable and not constant), as shown in
Figure 4b. Duty cycles of the minimum phase error over-modulation method can be expressed as
Expression of output voltage corresponding to
is as
Since varies periodically, it is extremely difficult to solve both fundamental voltage from Equation (17) and α required in the regulator stage modulation from Equation (12). In this paper, an approximate calculation method for fundamental voltage is given.
Replacing
in
with
Vpn gets
The resultant regular hexagon is shown in
Figure 4b with the dot dashed line.
Construct a vector
, keep it in phase with
, and locate its endpoint on the regular hexagon of the dot dashed line. Then, expression of
in the time domain can be derived as
Additionally, its waveform is shown in
Figure 4b as the curve of
. Then, the fundamental voltage amplitude of
can be derived from the Fourier series of Equation (19).
3.3. IMC High Voltage Transfer Ratio Modulation
In this paper, VTR is expressed as the ratio of output phase voltage amplitude,
Vom, and input phase voltage amplitude,
Vim:
From (9), (10), (20), and (21), VTR of the IMC reaches 0.954 and 1, respectively, when the rectifier stage uses CASE 1 and CASE 2 modulation, and the inverter stage uses the minimum phase error over-modulation.
Based on the above analysis, the IMC modulation region can be divided into three parts according to VTR: linear modulation region, over-modulation Region I, and over-modulation Region II.
(1) When 0 ≤ q ≤ 0.866, the IMC works in the linear modulation region. Only CASE 1 modulation mode is used in the rectifier stage, and the traditional SVM method is used in the inverter stage.
(2) When 0.866 < q ≤ 0.954, the IMC works in over-modulation Region I. Only the CASE 1 modulation mode is used in the rectifier stage, and minimum phase error over-modulation is used in the inverter stage.
(3) When 0.954 < q ≤ 1, the IMC works in over-modulation Region II. Both CASE 1 and CASE 2 modulation modes are used in the rectifier stage, and minimum phase error over-modulation is used in the inverter stage.
The process of the proposed modulation method can be described as follows. First, according to input voltage amplitude and expected output voltage amplitude, modulation modes of the IMC rectifier stage and inverter stage are determined, and α is calculated by (12), (20), and (21). Second, the switching time of the inverter stage is calculated by (15) or (16), and the switching time of the rectifier stage is calculated by (4), (5), and (7). These steps ensure the IMC achieves high VTR, which reaches the maximum of 1.
4. Control Strategy for Wide Speed Range Operation of IMC-SPMSM
4.1. Particularity of Flux-Weakening Control in IMC-SPMSM
In order to facilitate analysis, this paper makes the following assumptions: (1) the saturation of the motor core is ignored; (2) the motor back electromotive force waveform is sinusoidal; (3) the influence of remanence, eddy current, and hysteresis loss is not considered; (4) the rotor has no damping winding and the permanent magnet has no damping effect. In rotor field oriented rotating coordinates, the stator voltage equation and the electromagnetic torque equation of SPMSM can be expressed as [
18]
where
vd and
vq are d-q axes stator voltage;
id and
iq are d-q axes stator current;
Rs is stator resistance;
Ls is inductance of stator;
ωr is angular velocity of rotor; p is differential operator;
λ is amplitude of permanent magnetic flux linkage;
np is number of poles of motor;
Te is electromagnetic torque.
Considering the influence of the IMC capacity, input voltage, modulation method, and motor thermal rating, the voltage and current of SPMSM should meet the following constraints:
where
Vmax is the maximum voltage applied to motor stator winding and
Imax is the maximum current flowing in the winding.
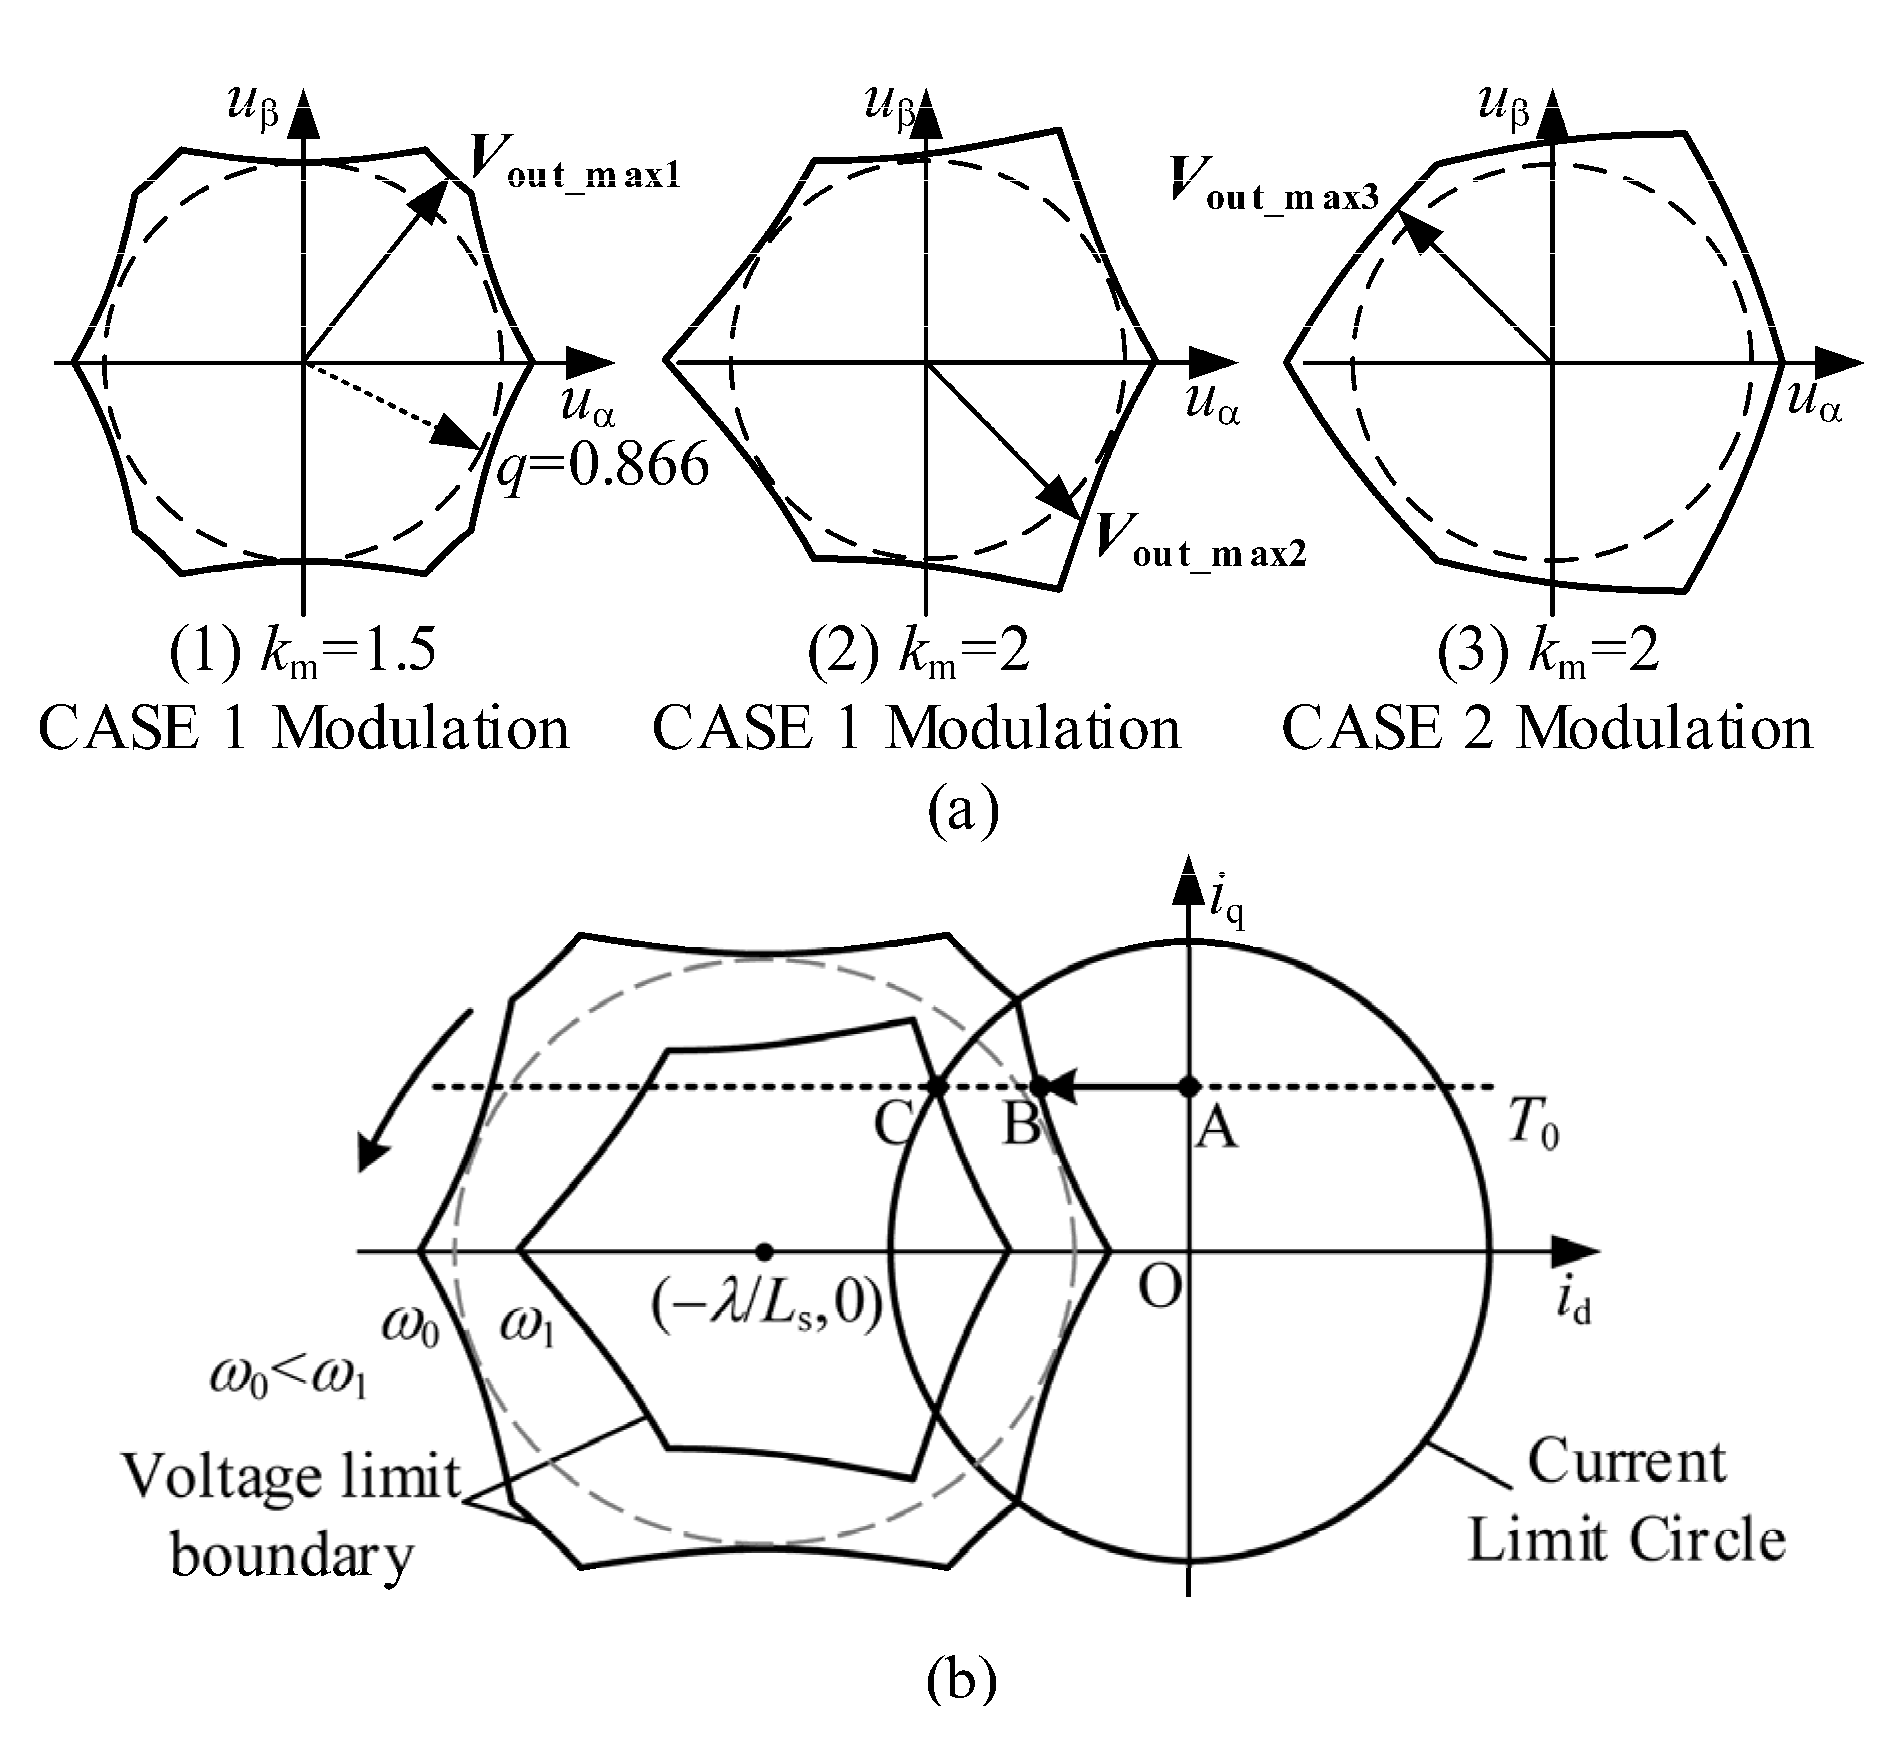
Unlike
Vmax of linear modulation, which is equal to 0.866
Vim, the instantaneous value of
Vmax varies with the phase angle of output voltage. The maximum output voltage vector
Vout_max can be obtained when the zero vector action time is 0. The trajectory of the endpoint of
Vout_max in the complex plane forms the voltage boundary of the IMC, and its amplitude expression is as follows [
19]:
From (6), (8), and (25),
Vout_max is related to the input power factor angle
φi, the output voltage initial phase angle
φ0,
km, and the modulation mode of the rectifier stage.
Figure 5a shows trajectories of the maximum output voltage vectors
Vout_max1,
Vout_max2, and
Vout_max3 under three different conditions with
φI = 0 and
φ0 = 0.
Ignoring the voltage drop on the stator resistance, the boundary of voltage and current vectors are drawn in the
id-
iq coordinates according to Equations (22)–(24) and (25), as shown in
Figure 5b. In the figure, the boundary of current is a limit circle centered at origin, and that of the voltage is some kind of symmetric polygon centered at (−
λ/
Ls, 0). The higher the speed is, the smaller the radius of the inner tangent circle of the voltage boundary is, and its shape varies in different speeds, as shown in
Figure 5b.
As a result, the complexity of the voltage boundary of the IMC-SPMSM under flux-weakening control, i.e., not only the complex shape (symmetric polygon) but also changing with output frequency, burdens the design of the flux-weakening control loop.
4.2. Flux-Weakening Controller Design
In order to make full use of the input voltage, the proposed flux-weakening control is based on voltage error feedback. The structure of the controller is shown in PART_1 in
Figure 1. Its input signal is the difference between q-axis voltage references before and after over-modulation. Its output signal is used to adjust the d-axis current of motor.
During the flux-weakening operation, the inverter stage of the IMC works with minimum phase error over-modulation, and the voltage difference before and after over-modulation can be expressed as
where
and
are voltage reference values of d and q axes from current regulators,
vd and
vq are the reference values of d and q axis voltage after over-modulation,
and
are reference values of d and q axis current under MTPA control.
To minimize the voltage error, a cost function is formulated as
By substituting (26) into (27), reference values of the d-axis and q-axis current in the flux-weakening region,
and
, can be deduced by the gradient descent method. Generally, for SPMSM drives,
changes slowly in the flux-weakening region, and its derivation can be regarded as zero. Derivations of
and
are as follows:
where
β is a constant greater than zero. By integrating the two sides of (28), we have
It can be seen from (29) that once Δ
vq beyond 0,
cannot restore to
due to the integral effect, i.e., control of the system cannot exit the flux-weakening operation region. Therefore, a first-order low-pass filter is used to replace the integrator, and the current reference of the flux-weakening region becomes
where
ωc is the cut-off frequency of the first-order low-pass filter.
In general,
ωc is set equal to the current regulator bandwidth, i.e.,
ωc =
ki/
kp, where
ki =
Rsωc and
kp =
Lsωc. The coefficient
β has an influence on the range of speed regulation and transient performance of the IMC-SPMSM. A bigger
β provides stronger flux-weakening ability and better transient performance for current control. Meanwhile, the maximum output torque and the maximum operating speed of the IMC-SPMSM decrease. To keep dimensions of (29) and (30) consistent,
β can be set as
where
ωrmax is the maximum operating speed that the motor can reach.
The operation point under the flux-weakening region can be determined as follows: in
Figure 5b, assuming load torque
T0, during SPMSM speeding up from the below rated speed to
ω0, the operating point enters the flux-weakening region at some instant, and then moves from Point A to B along the
T0 curve. Point B, which is the intersection of the voltage boundary and constant torque line, is actually a moving point, as the voltage boundary rotates with an angular velocity of
npωr in
id-
iq coordinates. From the derivation process of the current reference in (29), the flux-weakening controller based on (29) keeps the endpoint of the output voltage vector locating on the voltage boundary, so as to make full use of the maximum fundamental voltage output by the inverter stage to broaden the speed range of the IMC-SPMSM.
4.3. IMC Rectifier Stage Modulation Depth Controller Design
In
Figure 5b, Point C is the intersection of the current limit circle and voltage boundary, which implies the power limit of the inverter stage of the IMC-SPMSM. To further increase the speed of the motor, a possible way is to adjust modulation depth of the rectifier stage. As stated previously, modulation depth of the rectifier stage is determined by
α, the modulation depth angle of the rectifier stage. A greater
α results in deeper modulation of the rectifier stage, and greater output voltage of the IMC. Consequently, an over-modulation depth controller of the IMC rectifier stage is designed, whose structure is shown as PART_2 in
Figure 1. In the figure, the input signal of the controller is the amplitude of the stator current reference vector
Iref, and limit of the current,
Ilim (
Ilim <
Imax). The amplitude expression of
Iref can be expressed as
Then,
α is designed as an output of proportional-integral (PI) regulator to eliminate errors between
Iref and
Ilim:
where
kpi and
kii are the proportional and integral coefficients of the rectifier stage modulation depth controller.
The controller represented by (33) may be out of work in some conditions. For example, when the IMC is in over-modulation Region II and
α = π/6, the output current of the IMC has the most harmonics. The fundamental voltage can be obtained by Fourier expansion as
When the inverter stage is in the mode of minimum phase error over-modulation, the stator voltage vector moves along the voltage boundary. Assuming the
vpn is constant, then amplitude of the stator voltage vector can be expressed as [
20]:
where
A is the fluctuation coefficient of stator voltage in the over-modulation region.
Substituting (34) into (35), we have
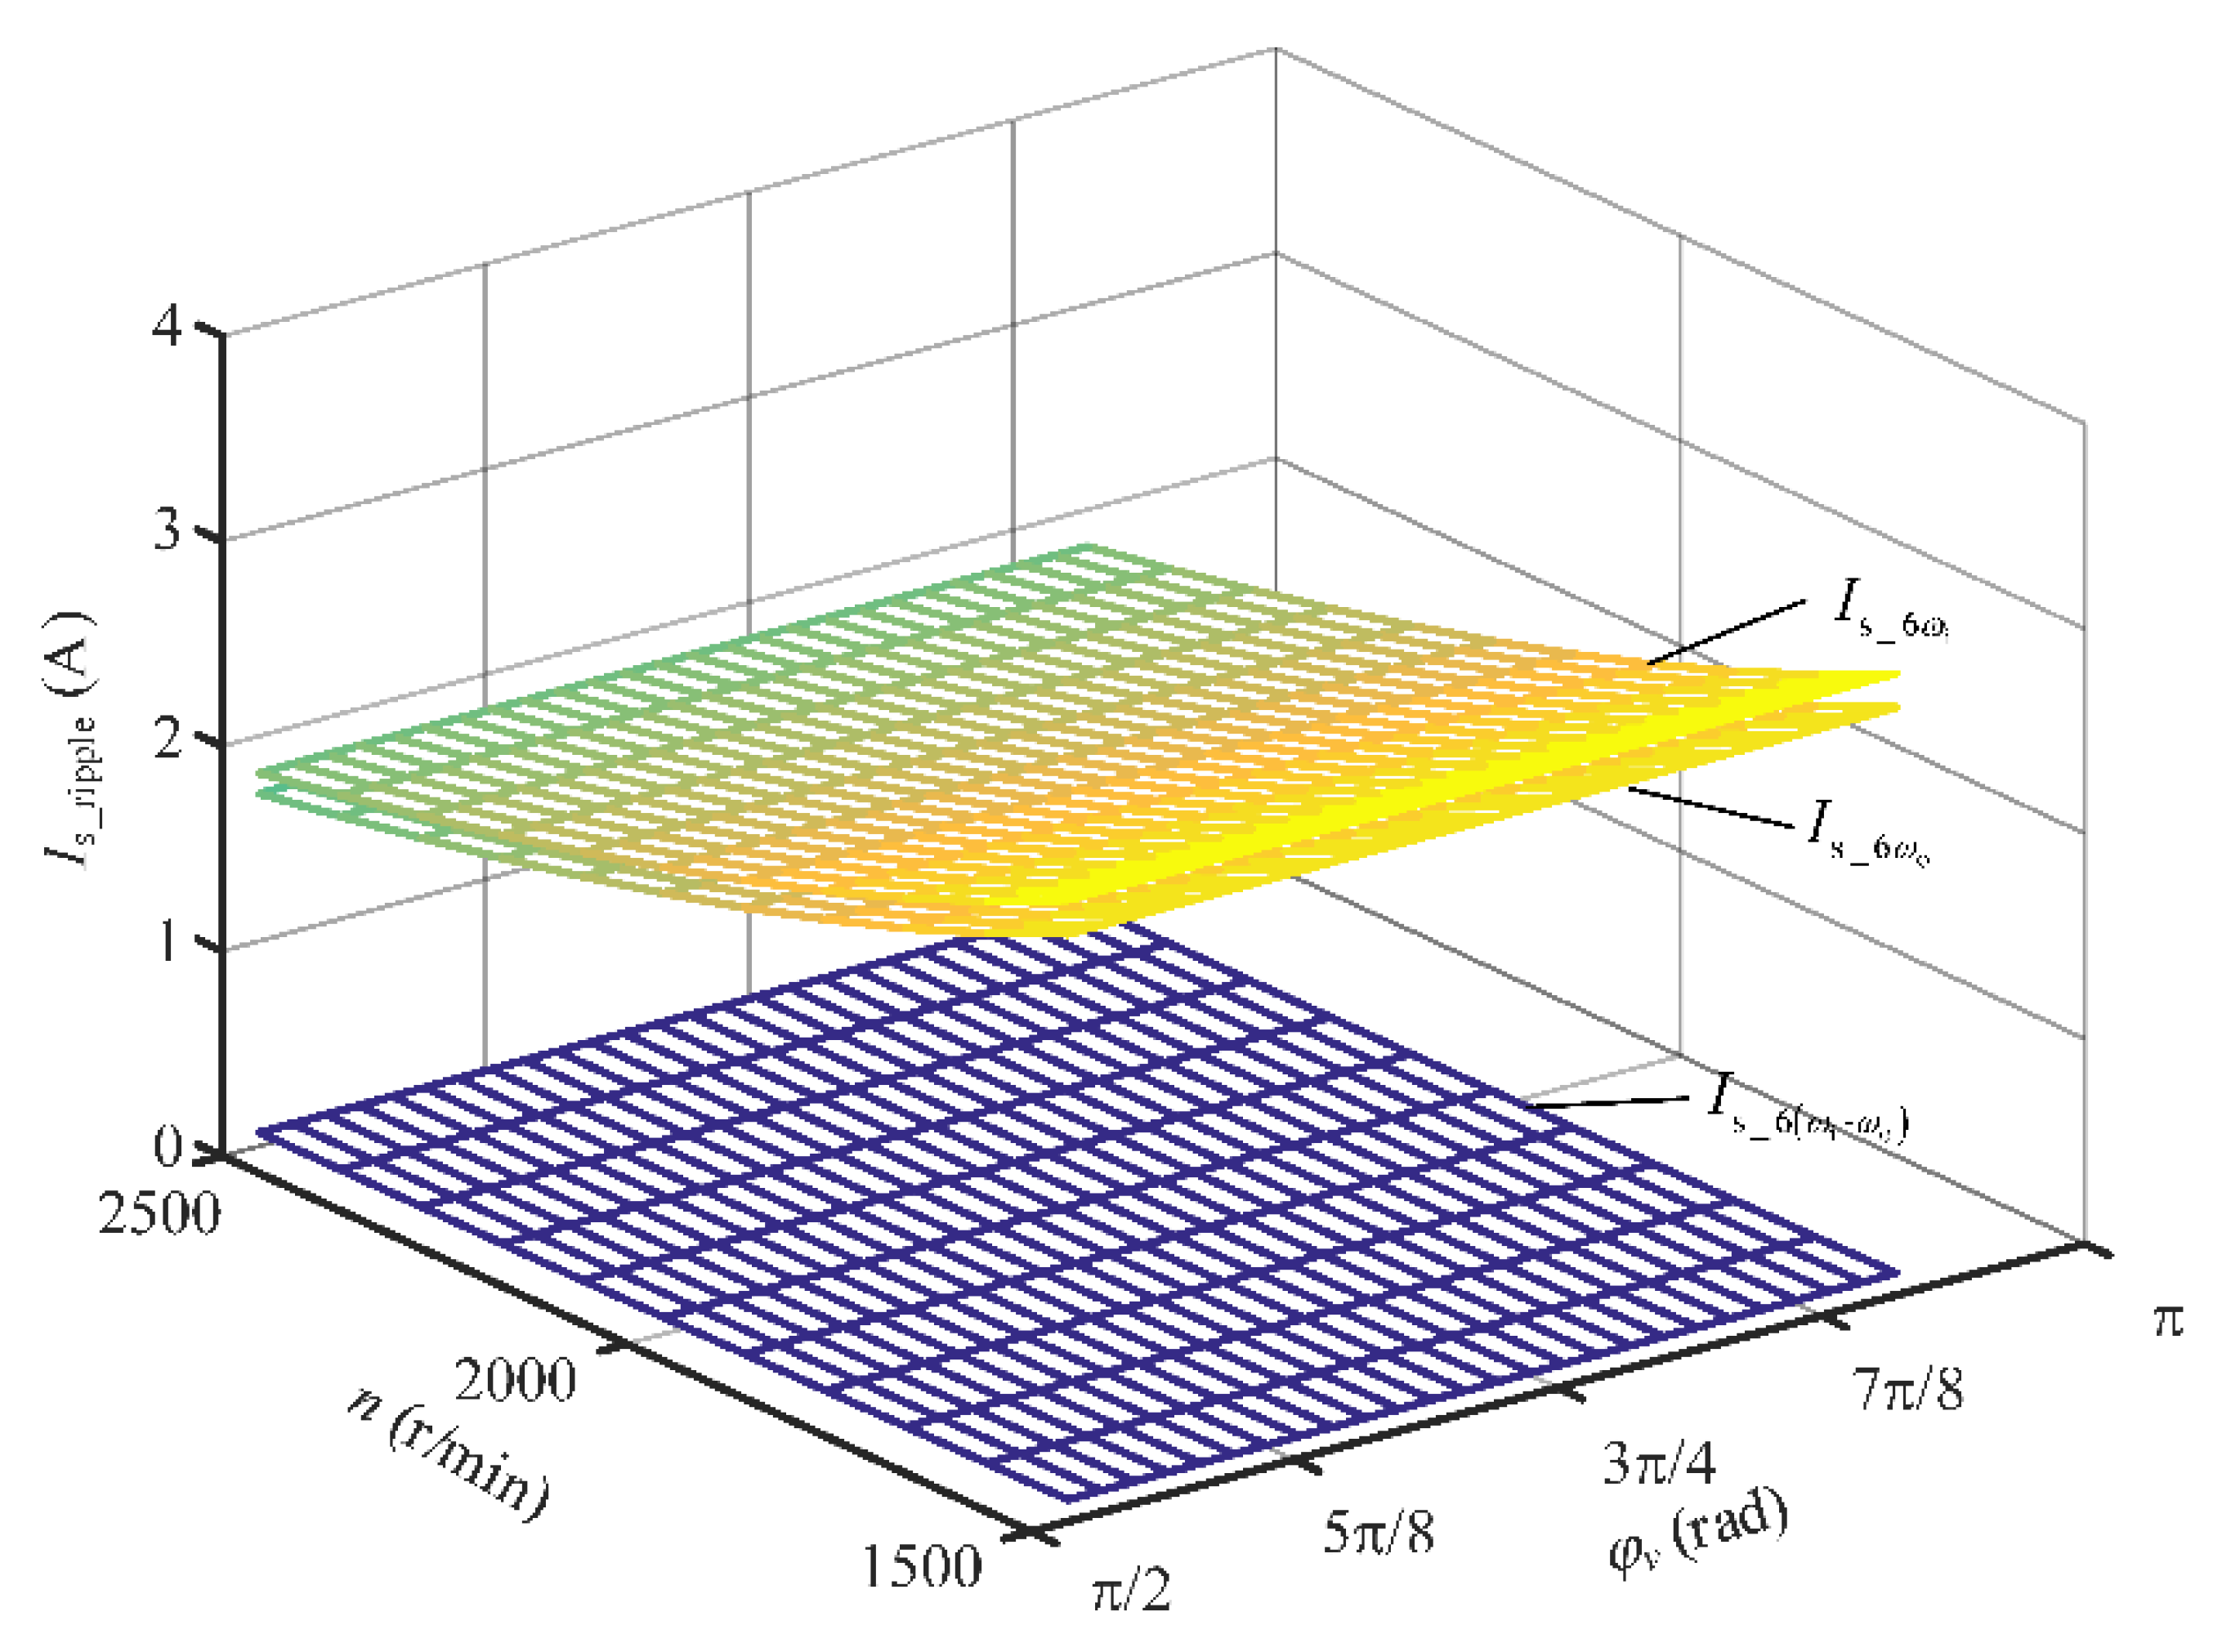
According to (36), frequencies of stator current harmonics caused by over-modulation are mainly 6ωo, 6ωi, 6(ωo − ωi), and 6(ωo + ωi).
Ignoring stator resistance, the relationship between stator currents and stator voltages in the steady state can be obtained from (22).
Taking frequency of 6
ωi as an example, and ignoring the change of stator inductance, the amplitude of the stator current harmonic is calculated as
where
φv is the angle between the stator voltage vector and d-axis,
Ism_6ωi is the amplitude of the current harmonic with a frequency of 6
ωi.
Other amplitudes of current harmonics such as Ism_6ωo, Ism_6(ωo−ωi), and Ism_6(ωo+ωi) can be similarly calculated. It should be noticed that if the difference between Ilim and Imax is less than peak value of those current harmonics, then the regulator tends to be saturated and output a constant α of π/6. As a result, the difference between Ilim and Imax is set to be greater than the current harmonic peak value by Imax−Ilim ≥ max{Ism_6ωi, Ism_6ωo, Ism_6(ωo−ωi), Ism_6(ωo+ωi)}.
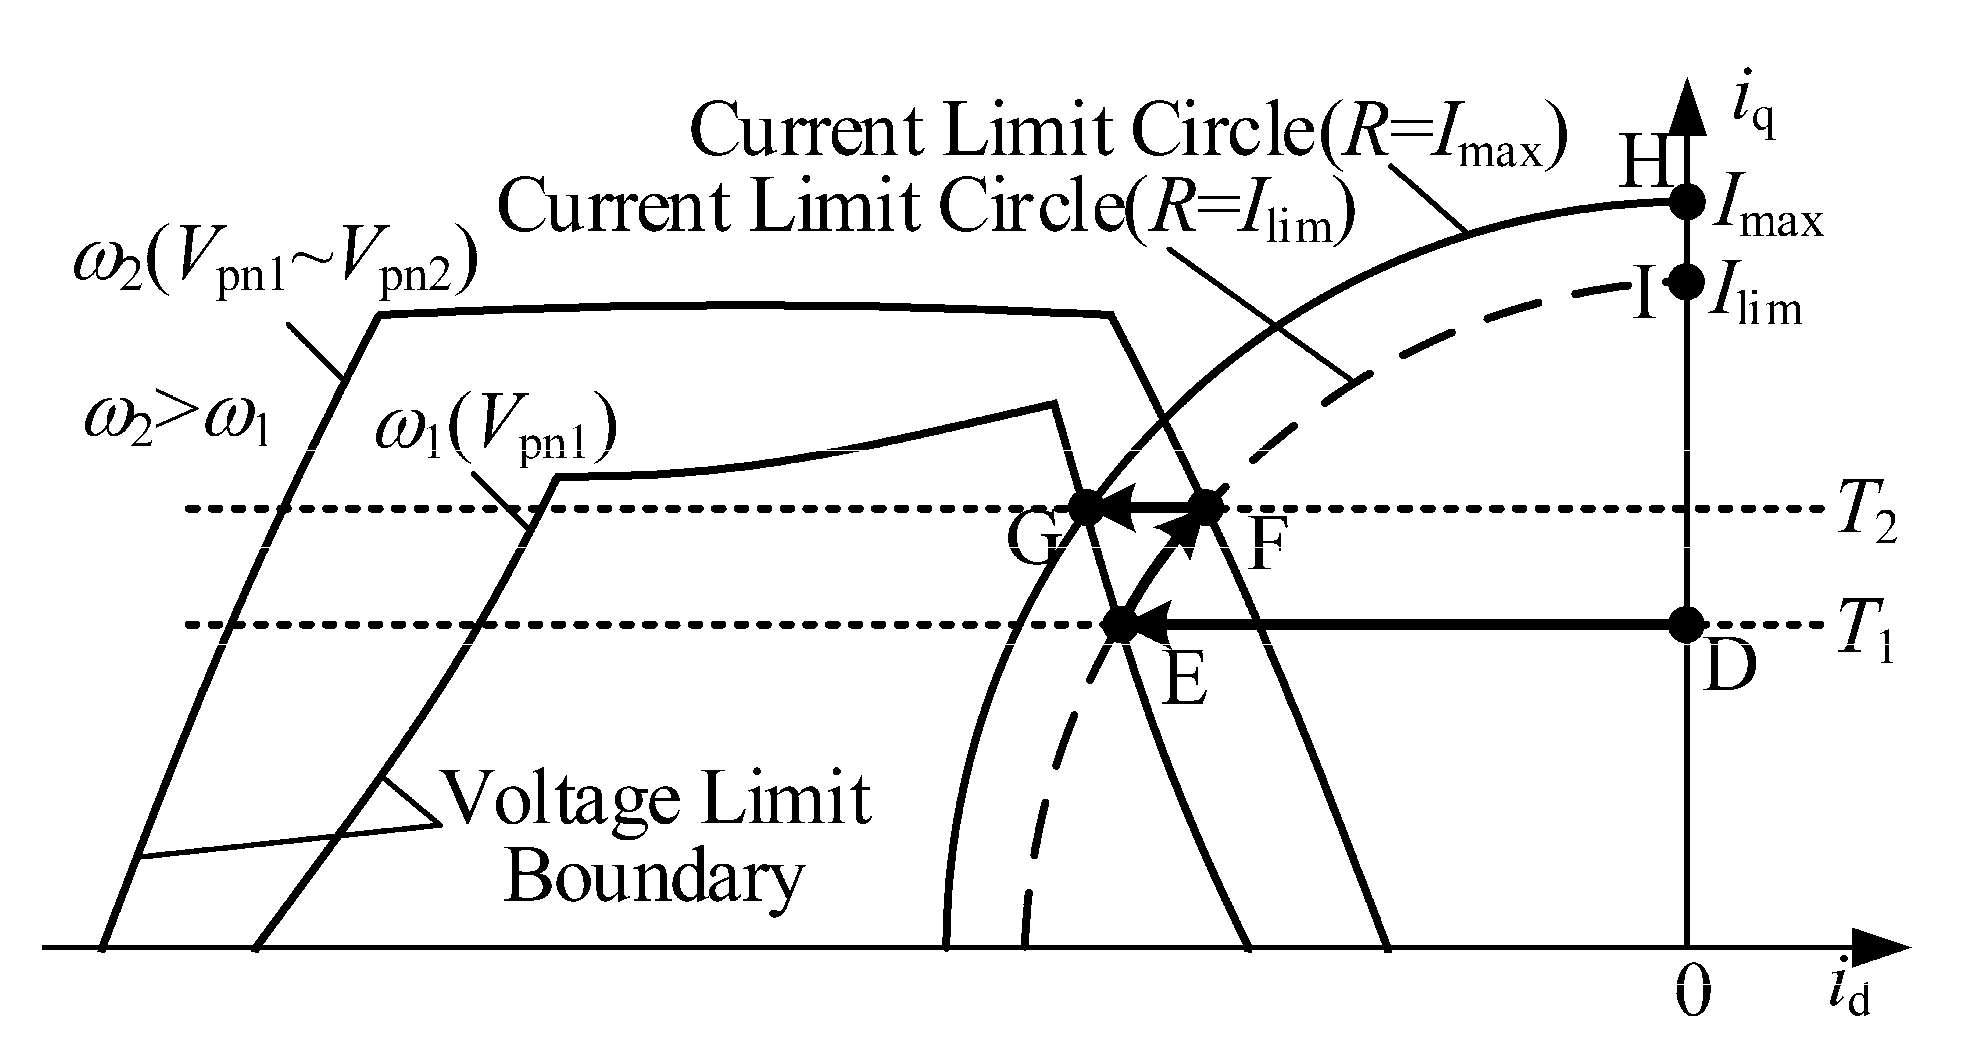
4.4. Analysis of Operation Point with the Proposed Flux-Weakening Control Strategy
Taking the speed-up and loading process of the IMC-SPMSM in the flux-weakening region as an example,
Figure 6 shows how the operation point of the system changes. In the figure,
ω1 and
ω2 represent rotor angular velocity and
ω2 >
ω1;
T1 and
T2 represent load torque and
T2 >
T1.
Assume the current operation point is located at Point E, i.e., speed of SPMSM is ω1 and load torque is T1. In the area of speed below ω1, Δvq ≥ 0 and Iref ≤ Ilim, and only PART_1 works. If speed and torque increase synchronously to ω2 and T2, respectively, the operation point moves to Point F along the arc of EF. During the process, Δvq ≥ 0, Iref > Ilim, the actual current of SPMSM reaches Ilim, and PART_2 works. As a result, when the endpoint of the stator current vector exceeds the current limit circle (R = Ilim, R is the radius of the limit circle), the rectifier stage modulation depth controller increases the output voltage of the IMC by increasing α, which means the voltage boundary enlarged and the endpoint of the current vector is pulled back to the current limit circle (R = Ilim).
PART_2 reaches saturation if α reaches the maximum value of π/6 at Point F. Then, the operation point moves to Point G along FG with speed increasing and the load torque unchanged by keeping the rectifier stage only working in the modulation mode of CASE 2.
It should be noticed that when operating at low speeds and heavy loads, such as the line segment HI in
Figure 6, the stator current may exceed the limit although SPMSM is not in the flux-weakening region. Then, the modulation depth controller adjusts
α to make the rectifier stage work in the over-modulation region, which is totally unnecessary and results in considerable harmonics in the voltage and current of SPMSM. Therefore, a step of judgement needs to be added in PART_2, as shown in
Figure 1. Polarity of the flux-weakening current
id_fw is used to determine whether
α should be set to zero or output of the regulator in PART_2.
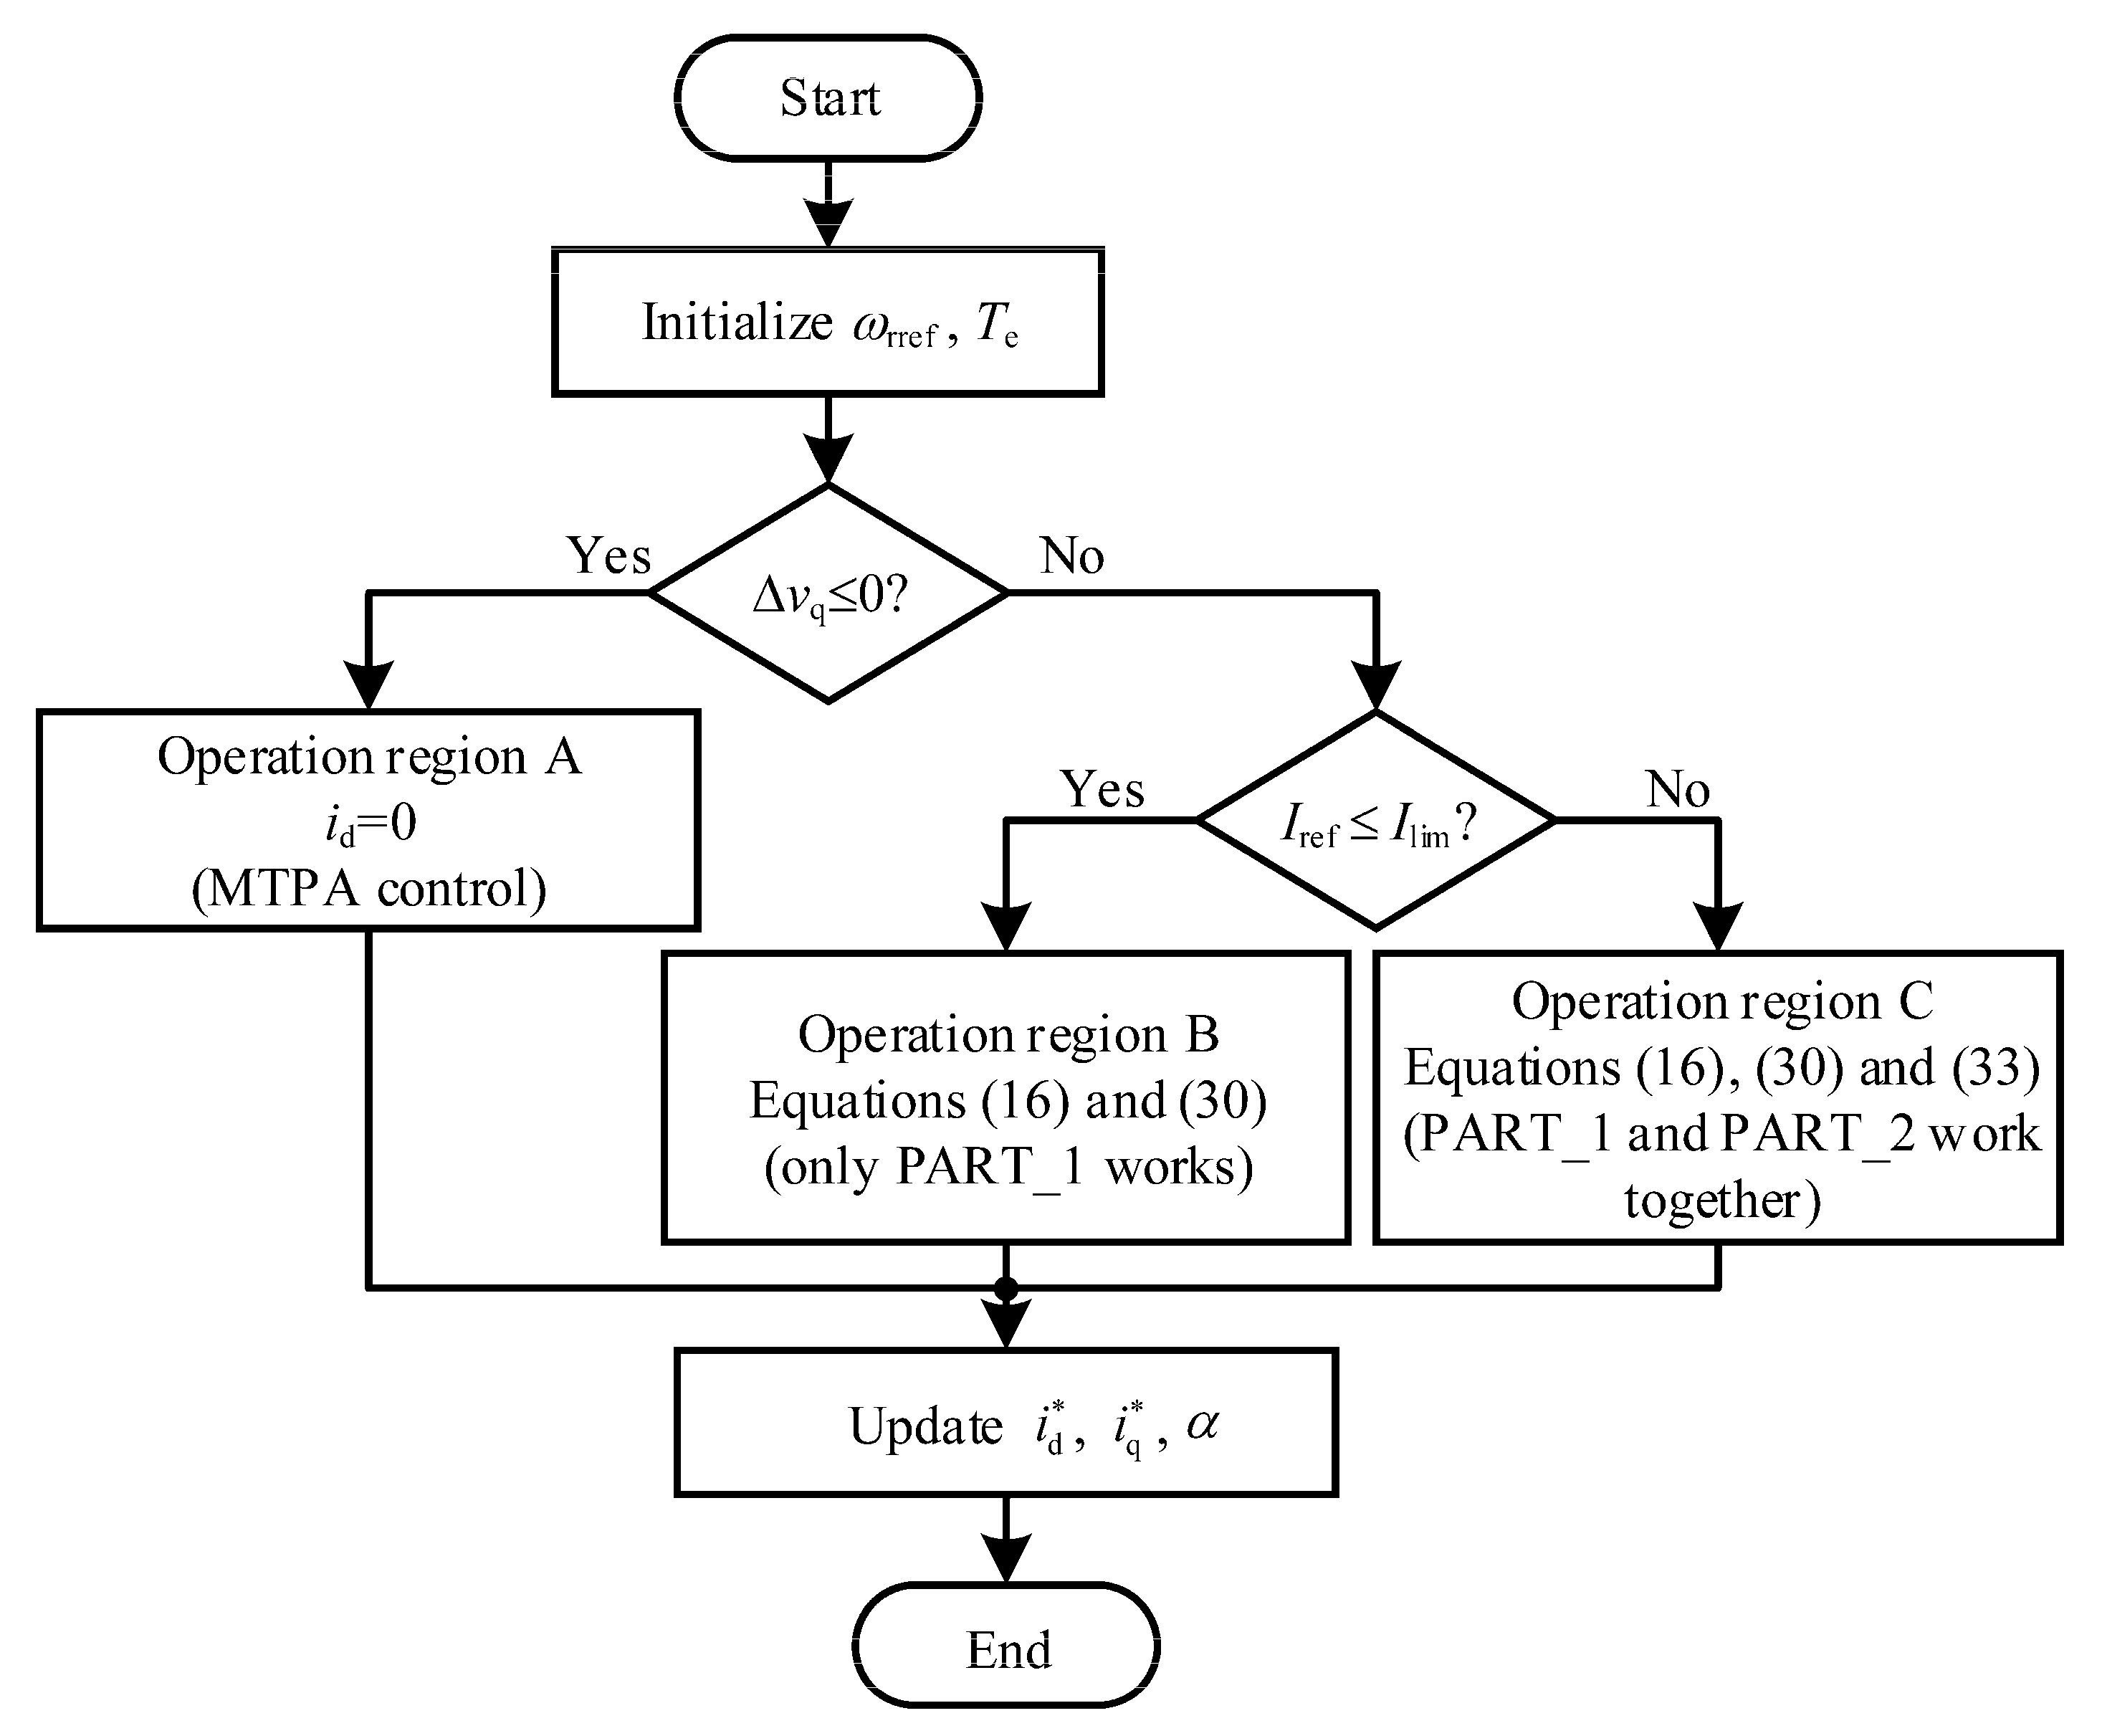
Based on the above analysis,
Figure 7 presents the flowchart of the proposed flux-weakening control strategy.
7. Conclusions
Aiming to improve the speed range for the IMC-SPMSM, a wide-speed range operation control strategy including over-modulation and flux-weakening control was proposed in this paper. The proposed strategy improves VTR of the fundamental output voltage of the IMC from 0.866 to 1 by coordinating over-modulation of both the rectifier stage and inverter stage. At the inverter stage, a flux-weakening controller was designed to control the d-axis current of SPMSM. Determination of a proportional coefficient of the flux-weakening controller, β, which affects both transient and steady-state performance of SPMSM, was discussed to tradeoff between load capacity and dynamic performance according to work conditions. At the rectifier stage, a modulation depth controller was designed to adjust the output voltage of the rectifier to further expand the speed regulation range. To avoid unexpected saturation, the current limit for the controller, Ilim, should be cautiously selected considering the harmonic current of SPMSM caused by over-modulation, as Ilim contributes to the threshold used to judge whether the modulation depth controller starts to work or not. In practice, the value of Ilim needs to be fine-tuned based on theoretical calculations as actual harmonics are hard to be precisely evaluated. Finally, experimental results verify feasibility of the proposed strategy. The maximum speed was nearly 35% higher compared with that of the MTPA strategy, and the setting time was also shortened, benefiting from the extra voltage margin by over-modulation of the rectifier stage. In the following research, we will further improve the prototype and test the proposed strategy under full voltage conditions. On the other hand, under flux-weakening conditions, strategy optimization considering load capacity and efficiency will also be the focus of the next step of research.


