Article

CFD-DEM Simulation of Spouted Bed Dynamics under High Temperature with an Adhesive Model

Institute of Nuclear and New Energy Technology, Tsinghua University, Beijing 100084, China
*
Author to whom correspondence should be addressed.
Energies 2021, 14(8), 2276; https://doi.org/10.3390/en14082276
Submission received: 11 March 2021 / Revised: 11 April 2021 / Accepted: 14 April 2021 / Published: 18 April 2021
(This article belongs to the Special Issue Fluid Flow Analysis of Spouted Beds)

Abstract

:
Particle adhesion is of great importance to coating processes due to its effect on fluidization. Currently, Computational Fluid Dynamics-Discrete Element Method (CFD-DEM) has become a powerful tool for the study of multiphase flows. Various contact force models have also been proposed. However, particle dynamics in high temperature will be changed with particle surface properties changing. In view of this, an adhesion model is developed based on approaching-loading-unloading-detaching idea and particle surface change under high temperature in this paper. Analyses of the adhesion model are given through two particle collision process and validated by experiment. Effects of inlet gas velocity and adhesion intensity on spouted bed dynamics are investigated. It is concluded that fluidization cycle will be accelerated by adhesion, and intensity of fluidization will be marginally enhanced by slight adhesion. Within a certain range, increasing inlet gas velocity will lead to strong intensity of particle motion. A parameter sensitivity comparison of linear spring-damping model and Hertz-Mindlin Model is given, which shows in case of small overlaps, forces calculated by both models have little distinction, diametrically opposed to that of large overlaps.

Graphical Abstract

1. Introduction

Spouted beds (SBs) have drawn much attention in recent years for a broad range of applications, such as coating [1], drying [2], biomass [3] or waste pyrolysis [4,5] and gasification [6]. In fact, these processes are conducted at high temperatures and particle adhesion can give way to severe operational problems, even causing bed de-fluidization [7]. Accordingly, it is necessary to study the adhesion process to better control the adverse effects of it.
Due to the high fluid-solid contact efficiency, especially for coarse particles in drying and coating processes [8,9,10], the spouted bed has unique characteristics as a prototype reactor for research. In addition to their ability to handle coarse particles, spouted beds also possess certain structural and flow characteristics that are very desirable in some chemical reaction systems because of their perfect particle periodic dynamics. For instance, a central spout formation, where the particles move upwards in a dilute phase, and a semi-packed bed annular space between the spout zone and the vessel wall, where particles move slowly downwards and radially inwards, are typical periodic dynamics phenomena. They are quite beneficial for particle coating.
CFD modelling has become a powerful tool for the study of multiphase flows with the development of computational power and the advance of numerical algorithms. There are two kinds of methods that are called the Eulerian-Eulerian approach (two-fluid model, TFM) and the Eulerian-Lagrangian approach (CFD-DEM) in general. In TFM, the kinetic theory of granular flows (KTGF) is used to describe the particle-particle interaction implicitly [11]. In contrast, in the CFD-DEM model, the particle interactions are calculated explicitly using Newton’s law, by tracking each particle or parcel. In both models, the closure items selected are extremely important, and influence the reliability and accuracy of simulation results. Recently a comparative study of these two models has been given in details, in terms of accuracy and computational effort [12]. It is indicated that the CFD-DEM model reproduces more accurately the spouted bed performance in particle scale which is important for particle coating simulation.
Our group has focused on the fluidized bed-chemical vapor deposition (FB-CVD) particle coating process for many years, especially the spouted bed dynamics with high temperatures. It is a process that applies gaseous substances to solids undergoing chemical reactions, transport reactions and producing solid deposits. The coating model based on CFD-DEM model is proposed to study the spouted bed coating process coupled with different deposition mechanism [13]. During the research process, it was found that numerous studies focused on the particle dynamics at room temperature [14,15]. However, particle spouted behavior in high temperature will be changed when the particle surface properties are changed. Besides, particles will become more adhesive during the coating process because of the coating layers. This is because particle contact force will be changed according to the surface properties of particles change [16], so in this paper, the adhesive model is developed to consider the changed particle surface, based on the detailed theoretical analysis of particle contact model, especially the particle approaching- loading- unloading-detaching process.
Current researches on contact models have already been extensively attempted, such as elastic contact model (Hertz theory), elastic-plastic contact model, visco-elastic contact model (spring-dashpot), adhesion contact model (Johnson-Kendall-Roberts model, JKR), and tangent stiffness model (Hertz-Mindlin) and so on [17,18,19]. The linear model was derived from a spring model, then developed into a spring-damping model [20]. Subsequently, Luding [21] developed it into a linear hysteresis model to describe the particle adhesion phenomenon. The linear model is of high flexibility, low calculation time cost and great convenience, and is often compared with the Hertz-Mindlin model as well as other normal force models [22]. The Hertz-Mindlin model is widely used in the simulation of various specific phenomena for the analysis of mechanism or process due to its perfect model system and clear physical mechanism, such as studies on the macroscopic mechanical parameters of limestone, the mechanical properties of corn stalk, the influence of rotor wake on sediment particles and so on [23,24,25]. There have also been some studies comparing the two models [18,26,27,28], but most of them are based on simulation results, rather than the model parameters. In this paper, for the first time we compare the typical contact force models from the perspective of the model equation parameters in details. Then, based on comparison results, an adhesion particle contact force model which is suitable for describing particle surface changed is developed, combining the linear hysteresis model, JKR model and heat conduction derivation under high temperature as a typical case. Also, the adhesion model is used to study the spouted bed dynamics under different adhesion intensity and gas velocity, which is also validated by experimental results.
The paper is organized as follows: the CFD-DEM model as well as the development of the adhesion model is presented in Section 2. A detailed comparison of linear spring-damping model and Hertz-Mindlin model based on the model equation parameters is listed in Section 3. In Section 4, the model is verified by experiments at first, and the effects of adhesion intensity and gas velocity on fluidization state are investigated respectively. Following the last part is the conclusions.

2. Mathematical Model

2.1. CFD-DEM Model

The mass/momentum conversation Equations (1)–(4) are listed as follows.
( ε ρ g ) t   +   · ( ε ρ g u )   =   0
( ε ρ g u ) t   +   · ( ε ρ g uu )   =   ε p     · ε τ g F p   +   ε ρ g g
τ g   =   ( λ g     2 3 μ ) ( · u ) I     μ ( ( u )   +   ( u ) T )
F p   =   1 V cell n = 1 n = N V p β ( 1     ε ) ( u     v p )
For an individual particle, its motion equation, i.e., Newton’s laws, are listed as (5) and (6). A multi-particle fluid drag force Di Felice model [29] is used as Equations (7)–(10). The drag scaling factor is also applied considering the nonuniformity effect of fluid drag on the particles inside and outside an agglomerate [30]. This particle contact force shown as Equation (11) can be calculated by linear spring model and Hertz-Mindlin model. A detailed comparison is given in the Section 3. In this paper, the flow field information is solved by commercial software Fluent 16.1 while the particle motion model is solved by User Defined Function (UDF) using in-house code.
m i v ˙   =   F C   +   F f   +   m i g
I i d ω dt   =   j = 1 n j c M ij
F f   =   ξ β ( u v p )
β   =   3 4 C D ε ρ g | u     v p | d p ε χ + 1
C D   =   ( 0.63   +   4.8 Re 0.5 ) 2
χ   =   3.7     0.65 exp ( ( 1.5     log 10 Re ) 2 2 )
F C   =   j ( F n   +   F t ) .

2.2. CFD-DEM with the Adhesion Model

Due to temperature rise, chemical reaction or coating in fluidized bed, a new surface of a particle may be generated by melting or corroding locally, resulting in the change of surface properties as shown in Figure 1. The liquid layer generated by melting under high temperature will decrease the elasticity and increase the plasticity of particles, thus making them adhesive. For simulating this phenomenon accordingly, an adhesion model can be developed based on the CFD-DEM frame.
The adhesion model in this paper is derived from Luding’s idea [30] and integrated with force relationships in JKR, as well as a derivation of phase transition due to high temperature. There are four stages in linear hysteresis model: approaching, loading, unloading, and detaching. At approaching stage, van der Waals force, which is the dominant force in nanoparticle simulation, can be negligible because of the large particle spouted here. At loading stage, the normal force is gradually increasing with normal overlap rising until the particle velocity decreases to 0. At the unloading stage, contact force and adhesion force work together, where particle velocity increases inversely and the overlap keeps down to 0. In other words, particles are rebounding. At detaching stage, adhesion force still exists and particles continue to set apart until liquid bridge rupture when the connection is suddenly broken, and the two particles are completely separated. In the JKR model, the breaking force is 5/9 of “pull off” force, while the adhesion force is 8/9 of that. Therefore, in Equation (20), when x2 = 1, the breaking force should be 5/8 of adhesion force.
Normal force at approaching stage is calculated by Equation (12):
F n ( δ )   =   0
Normal force at loading stage is calculated by Equation (13):
F n ( δ )   =   k load n δ n
Normal force at unloading stage is calculated by Equations (14)–(19):
F n ( δ )   =   { k unload n ( δ n δ p )   ,   F n     f ij , min ( 1     x 1 ) ( F adhesion )   +   x 1 f ij , min   ,   F n   <   f ij , min
x 1   =   δ n δ ij , min
k unload n   =   k load n 1     φ p
f ij , min   =   ( δ p d p   +   1 ) ( F adhesion )
δ ij , min   =   f ij , min k unload n   +   δ p
δ p   =   ( 1     k load n k unload n ) δ max
Normal force at detaching stage is calculated by Equations (20) and (21):
F n ( δ )   =   ( 1     x 2 ) (   F adhesion )   +   5 8 x 2 ( F adhesion )
x 2   =   δ n d c
The adhesion phenomenon of concern in this paper is closely relevant to the detaching stage, so this part is further modeled. It should be noted that adhesion between particles is controlled by a type of capillary force owing to a quite thin melting liquid layer as shown in Figure 1. Hence, adhesion force can be analogous to the capillary force model, in which the key parameter of liquid content is the same as liquid layer in our model. The adhesion model is relevant with temperature because of surface melting. The following is the modeling process of adhesion force with temperature.
Previous studies classified liquid bridge force into capillary term and viscous term [31,32], where lubrication effect (produced by viscous term) is quite small thus being ignored in this paper [33]. For original capillary force model, it is not solved directly in DEM [32]. Therefore, it is usually employed the form of contact angle and the rupture distance [31,33]. As aforementioned, the adhesion force can be shown as:
F adhesion   =   2 π R Γ ( cos θ 0 ) X V
X V   =   1     [ 1   +   2 V π RD 2 ] 0.5
where Γ is the surface tension, θ0 is the contact angle between liquid and grain surface. D is the gap between the spherical surfaces. Liquid content V is an important parameter in the capillary force model. In the melting process, assuming the thickness of liquid layer is quite thin, so the diameter of particles can be regard as constant as well as particle density. The heat transfer between gas and particles is fast, so the heat equilibrium is obtained:
d ( C 1 · M layer · T p   +   h · M layer )   =   d ( C 2 · q m · d T g )
where C1 and C2 are the specific heat capacity of particles and gas, respectively. ∆Tp and ∆Tg are the temperature change of particles and gas. h is latent heat of melting and qm is the mass flow rate of gas. Mlayer = NρV, N is the number of total particles. ρ is the particle density. V is the volume of liquid layer of for a single particle. Compared to the change of particle temperature, the gas temperature decreases very little, so it can be considered constant when simulating fluidization phenomenon. Here, we assume ∆Tp = ktemp∆Tg. The particles are in solid-liquid coexistence state, so the internal temperature of particles remains the same as the surface temperature. Finally, the liquid content can be obtained as follows:
V   =   C 2 q m T g     Q d C 1 N ρ k temp T g   +   hN ρ
where Q d is the energy loss due to heat dissipation. It should be noticed that the focus on the paper is the effect of adhesion on fluidization, while the rupture distance dc plays a crucial role in adhesion phenomenon. Therefore, dc should be selected properly. Consequently, a coefficient k1 is applied to the traditional capillary force model in the CFD-DEM simulation:
d c   =   k 1 ( 1   +   θ / 2 ) V 1 3
where k1 is changed according to the adhesion state.

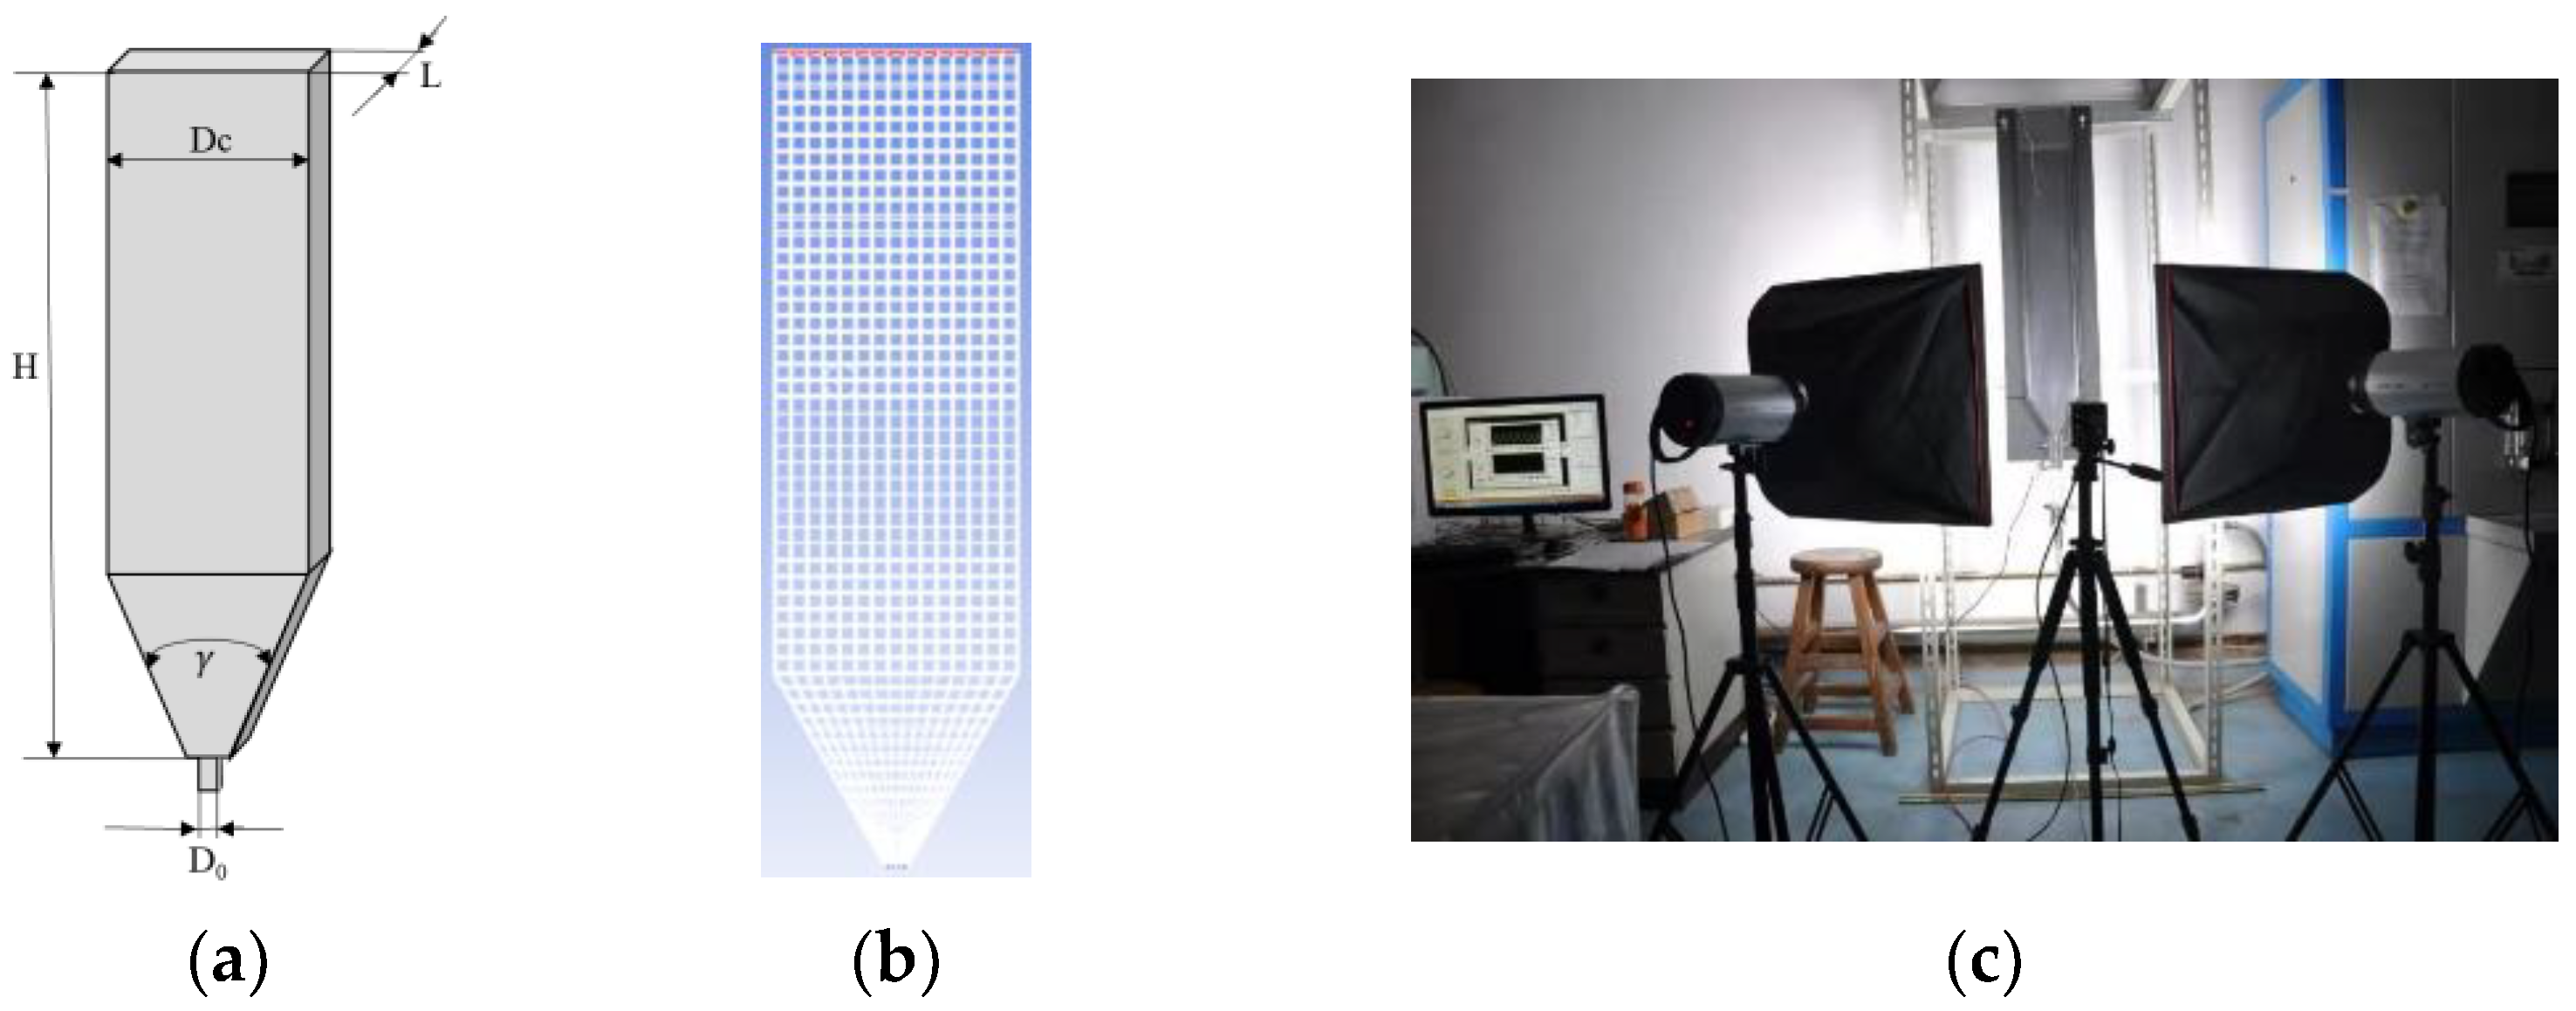
2.3. Geometry and Parameters

A typical 2D spouted bed is simulated here, as shown in Figure 2. Geometric parameters and all the conditions are shown in Table 1 and Table 2. The apparatus is composed of a cuboid and a conical body with a reverse cone angle of 60°. Total height is 500 mm. The bottom width of the cone is 15 mm while that of the cuboid is 150 mm. The jet inlet width is 9 mm. Overall thickness of the apparatus is 15 mm, which is 7.5 times the diameter of the particle, thus eliminating both the three-dimensional effect on bed thickness and wall friction effect. The apparatus is made of transparent plexiglass and the process can be recorded with a high-speed camera. The high-speed camera has a resolution of 1000 fps. To validate the simulation, a typical working condition is tested as follows. Particles are loaded into the spouted bed slowly. Particle loading is 100 mm. Compressed air is used as the source gas. Gas inlet flow rate is controlled and measured by the rotameter, which is adjusted to 26 m/s (inlet gas velocity) and the fluidization state is recorded by the high-speed camera when stabilization spouted state is achieved.

3. Comparison of Contact Force Models

A detailed comparison of linear spring-damping model and Hertz-Mindlin model is given as follows:
Normal force models were tested for particles with a radius of 0.001 m, and the results were shown in Figure 3 and Table 3. When normal overlap increases from 0 to 0.001 m, normal force calculated by linear model changes by about 5 N, while that of Hertz-Mindlin model (short for “H-M”) changes by about 13 N, which indicates normal force with H-M has a larger range. In the scale of small overlap (<0.3 r), the difference between two models is not obvious, while in the scale of large overlap (>0.6 r), the force (absolute value) calculated by the linear model is apparently lower than that of H-M. Figure 3 also illustrates that as relative normal velocity of particles increases, the critical point, at which the two models are equal, will shift to the upper right and the section between two critical points will broaden slowly. When the relative normal velocity is 90 m/s, the overlap at critical point is 0.3 r, and when the velocity decreases to 10 m/s, the overlap is about 0.24 r.
According to the Table 4, the two models were compared and analyzed with different tangential velocities as well as normal overlaps, as shown in Figure 4. Figure 4a suggests that tangential forces of both models show a linear relationship with tangential overlap, and the results are extremely consistent. However, with relative tangential velocity rising up, the difference between two models gradually gets obvious, and the result of H-M is slightly lower than that of linear model. It can be noted from Table 4 that the tangential force of the H-M is not only related to relative tangential velocity, but also connected with normal overlap, while it has nothing to do with the normal overlap in linear model. Therefore, Figure 4b explores the influence of various normal overlaps. As can be seen from the Figure 4b, when normal overlap is about 0.1 r, the results of the two models are in the best agreement. When overlap is minimal (<0.05 r), the results (absolute value) of H-M are lower than those of linear model, but the discrepancy is acceptable. However, when overlap is large (>0.6 r), the results (absolute value) of H-M are much higher than those of linear model, and this difference should be carefully considered.
Figure 5 shows relationships of forces and arms in two torque models where the red is H-M and the blue is linear model. Equations (27) and (28) represents linear model and H-M, respectively:
M ij   =   L i   ×   F t
M ij   =   μ r F n R ω
where Li is the distance from the point of contact to the center of the sphere, Ft is tangential force, μr is the coefficient of rolling friction Fn, is normal force, ω is angular velocity unit vector, R* is the equivalent radius.
Directions of the moments by these models are different. Fn is in the same direction as Li, while v = R*ω (linear velocity) is in the same plane as Ft. The angle among Ft and v is assumed to be θ. According to the right-hand rule and its geometric relationship, there is also an angle between torque M1 and M2, which is the same angle as θ.
In summary, both linear spring damping model and H-M can be expressed as “spring + damping”, but their coefficients are different. The former is constant, and the latter is relevant to the overlap. Forces calculated by both models have little difference when the overlap is small, but forces calculated by H-M are larger than those by linear mode when the overlap is big. Therefore, it is suggested that a proper kn of linear model should be selected according to the overlap range in the particle collision process. The value of kn with the highest probability of overlaps in the real collision process is appropriate. Torque of two models has an angle, which is equal to the angle between tangential force and linear velocity. As the particles used in this paper are glass beads, which have large stiffness and will not produce large overlap, a linear model will be adopted in the following simulation for its flexibility and simplicity for calculation.

4. Results and Discussion

In this part, the CFD-DEM model with and without the adhesion model are used to study the spout behaviors, which was validated by experiments at first. Subsequently, the effects of adhesion intensity and inlet gas velocity in spouted bed are investigated.

4.1. Spout Behavior Study Used CFD-DEM Model

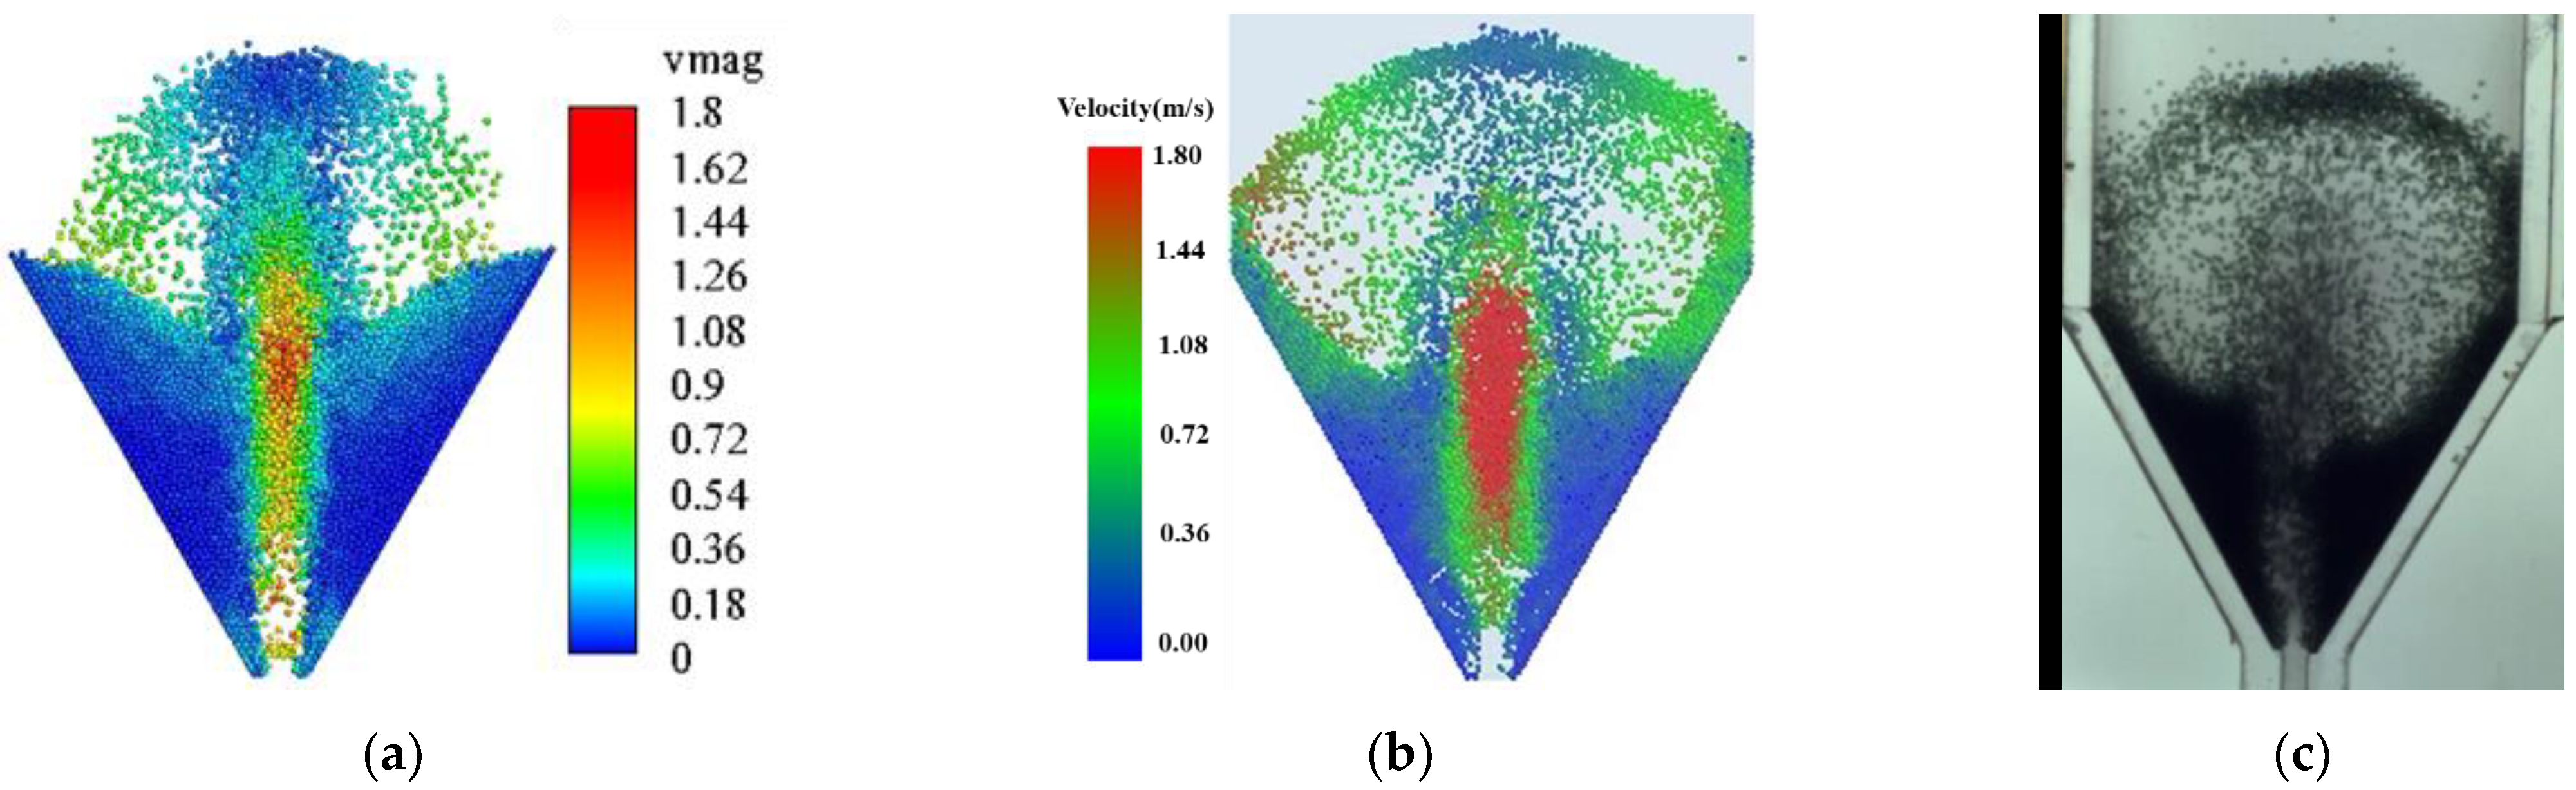
4.1.1. Validation by Literature and Experimental Results

The fluidization behavior of particles in the 2D spouted bed with different densities are studied by our group in previous studies [13]. It was found that the movement of glass beads had a bed oscillation cycle period of 165 ms in this literature. Therefore, our self-coded model is verified in two ways: comparing with previous simulation results by commercial software and experimental results.
The results calculated by the linear spring-damping model (self-coded), Hertz-Mindlin model (EDEM 12.6, DEM Solutions Ltd., Edinburgh, England; commercial software) and the experimental results are given from left to right as shown in Figure 6. The calculation parameters by Hertz-Mindlin model were the same as literature [13]. It can be seen clearly that the overall is relatively consistent, such as the shape of the inlet as well as the spouted flow, the location of the spouted neck and the approximate spouted height. The flow pattern of fluidization is almost the same, which can be divided into spouted zone, fountain zone and annular zone respectively.
However, the details are slightly different, such as the dispersion of particles in the fountain zone, and the depression of particle accumulation in the annular zone. These differences may be attributed to the different contact force model models (self-coded: spring-damping model, EDEM: Hertz-Mindlin model).

4.1.2. Periodicity

It has been pointed out that typical characteristics of spouted beds are the periodicity of the vertical component of particle velocity as well as pressure drop and their periodicity are in agreement in literature [34]. The flow patterns of particle fluidization, where the color represents particle velocity are given in Figure 7. During spouting, a spout neck (red circle) gradually moves upwards from inlet to fountain area and finally disappears on the top of fountain. The spout neck has a periodic motion as well, with a period of 154 ms, which is close to the bed oscillation cycle time in Zhao (160 ms) [34] but a little smaller than that of our previous work (165 ms) [13]. The slight difference may be attribute to the particle-to-fluid grid mapping relationship, resulting in a little difference of gas-solid drag force.

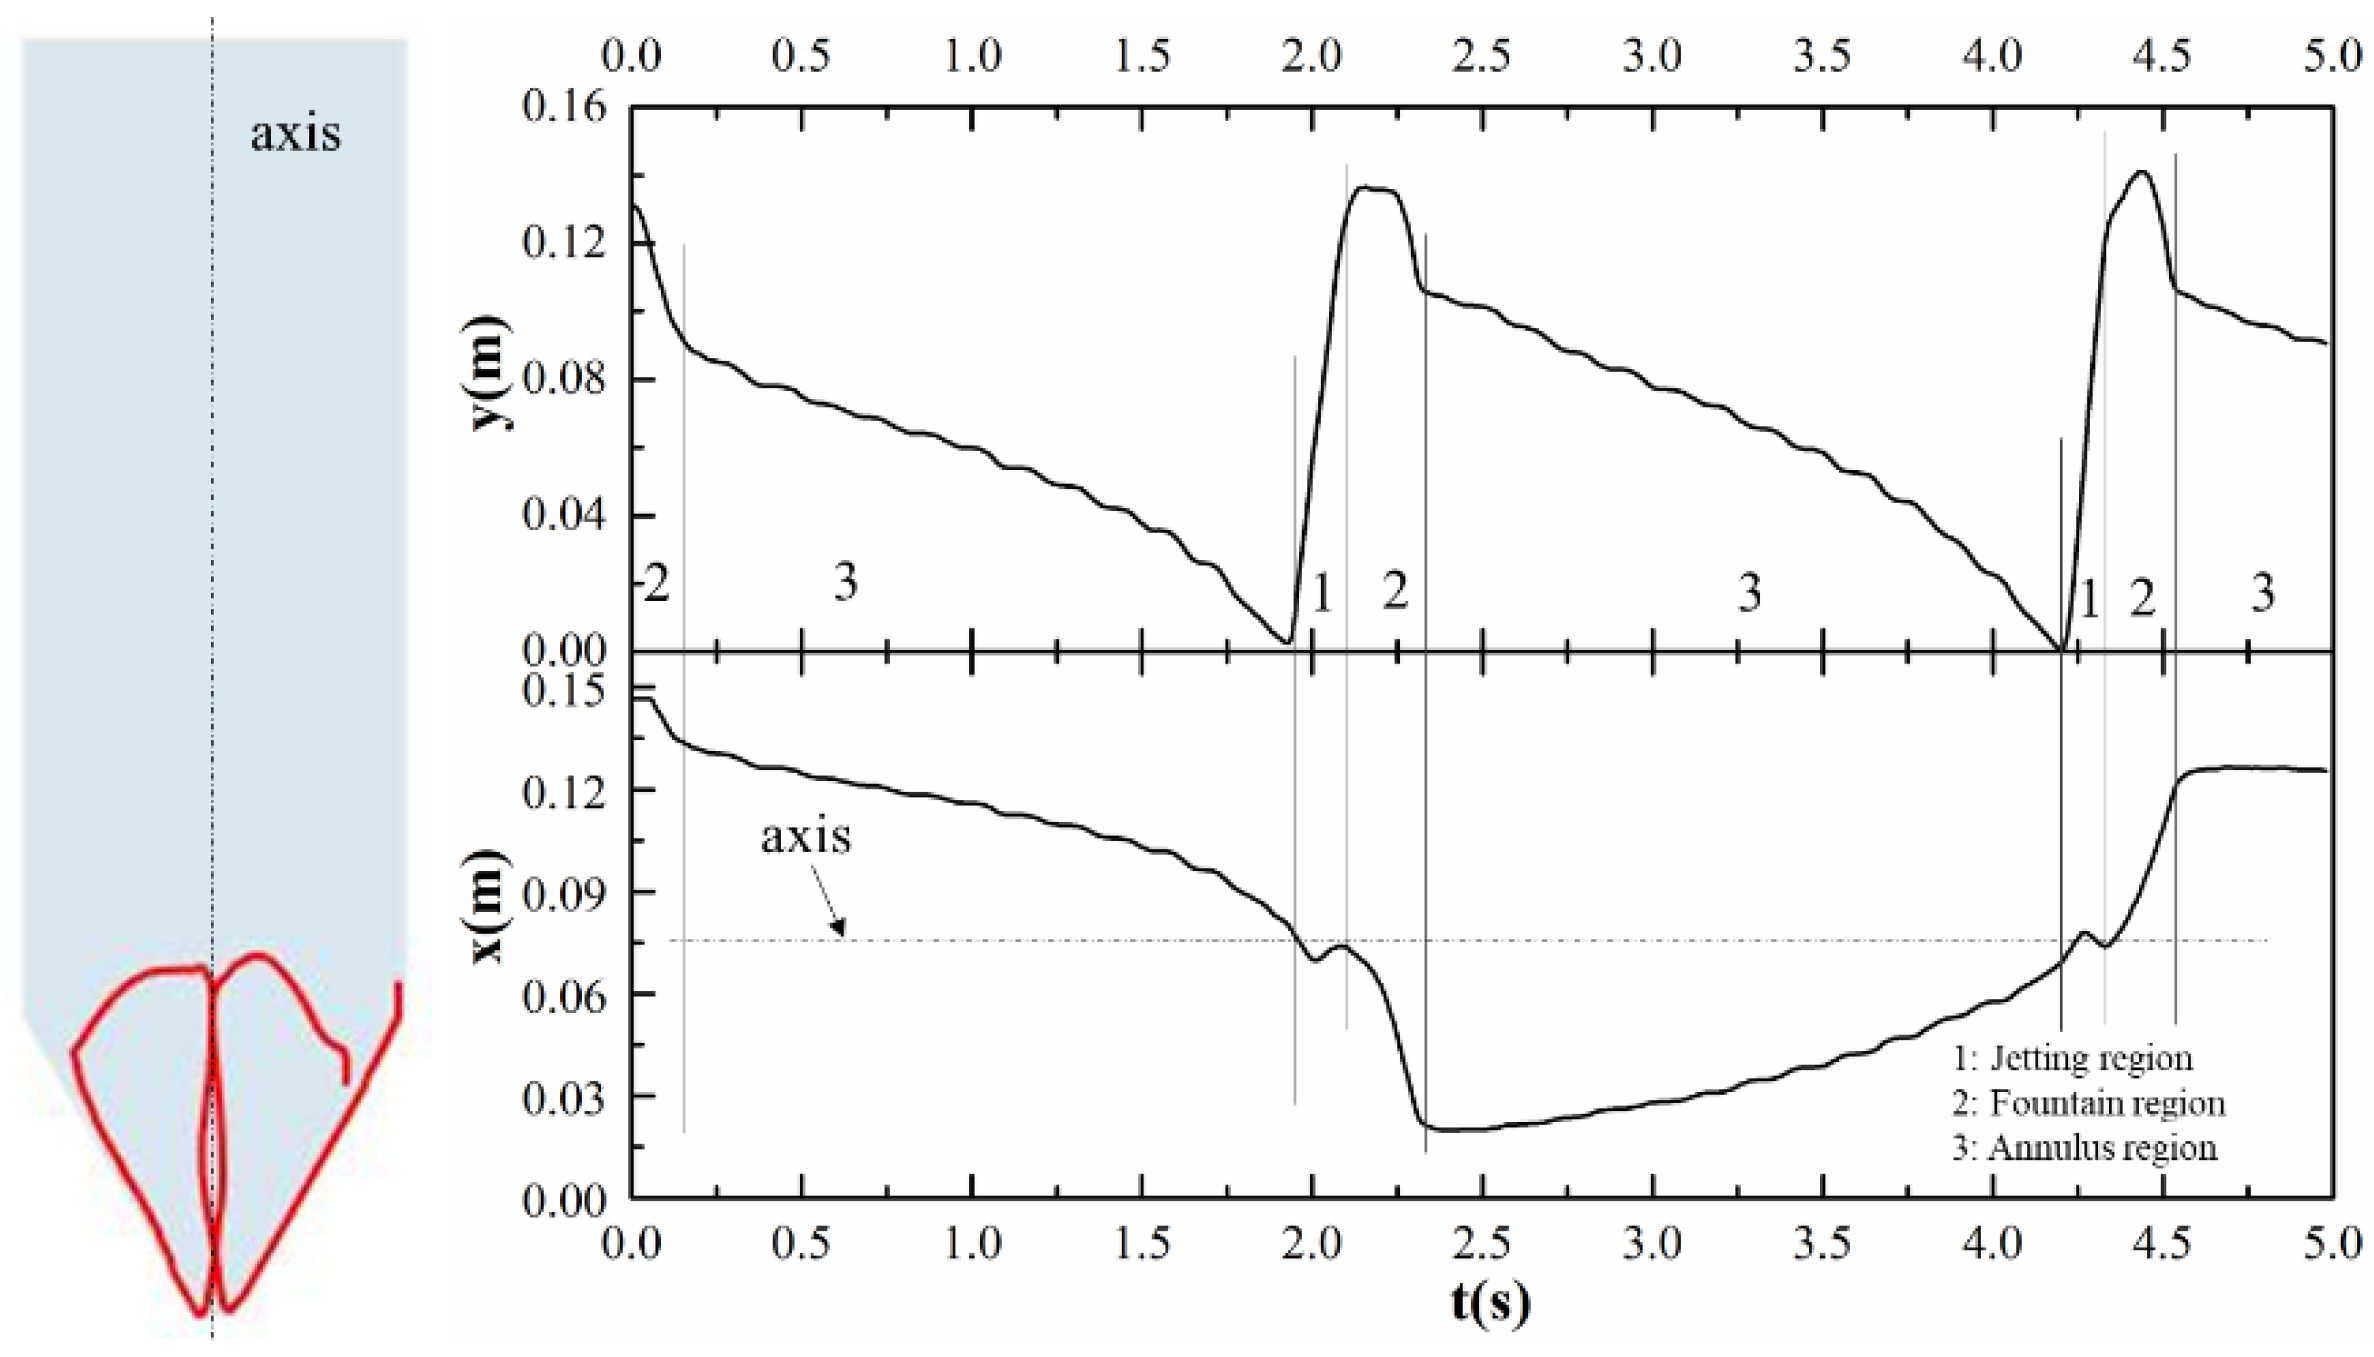
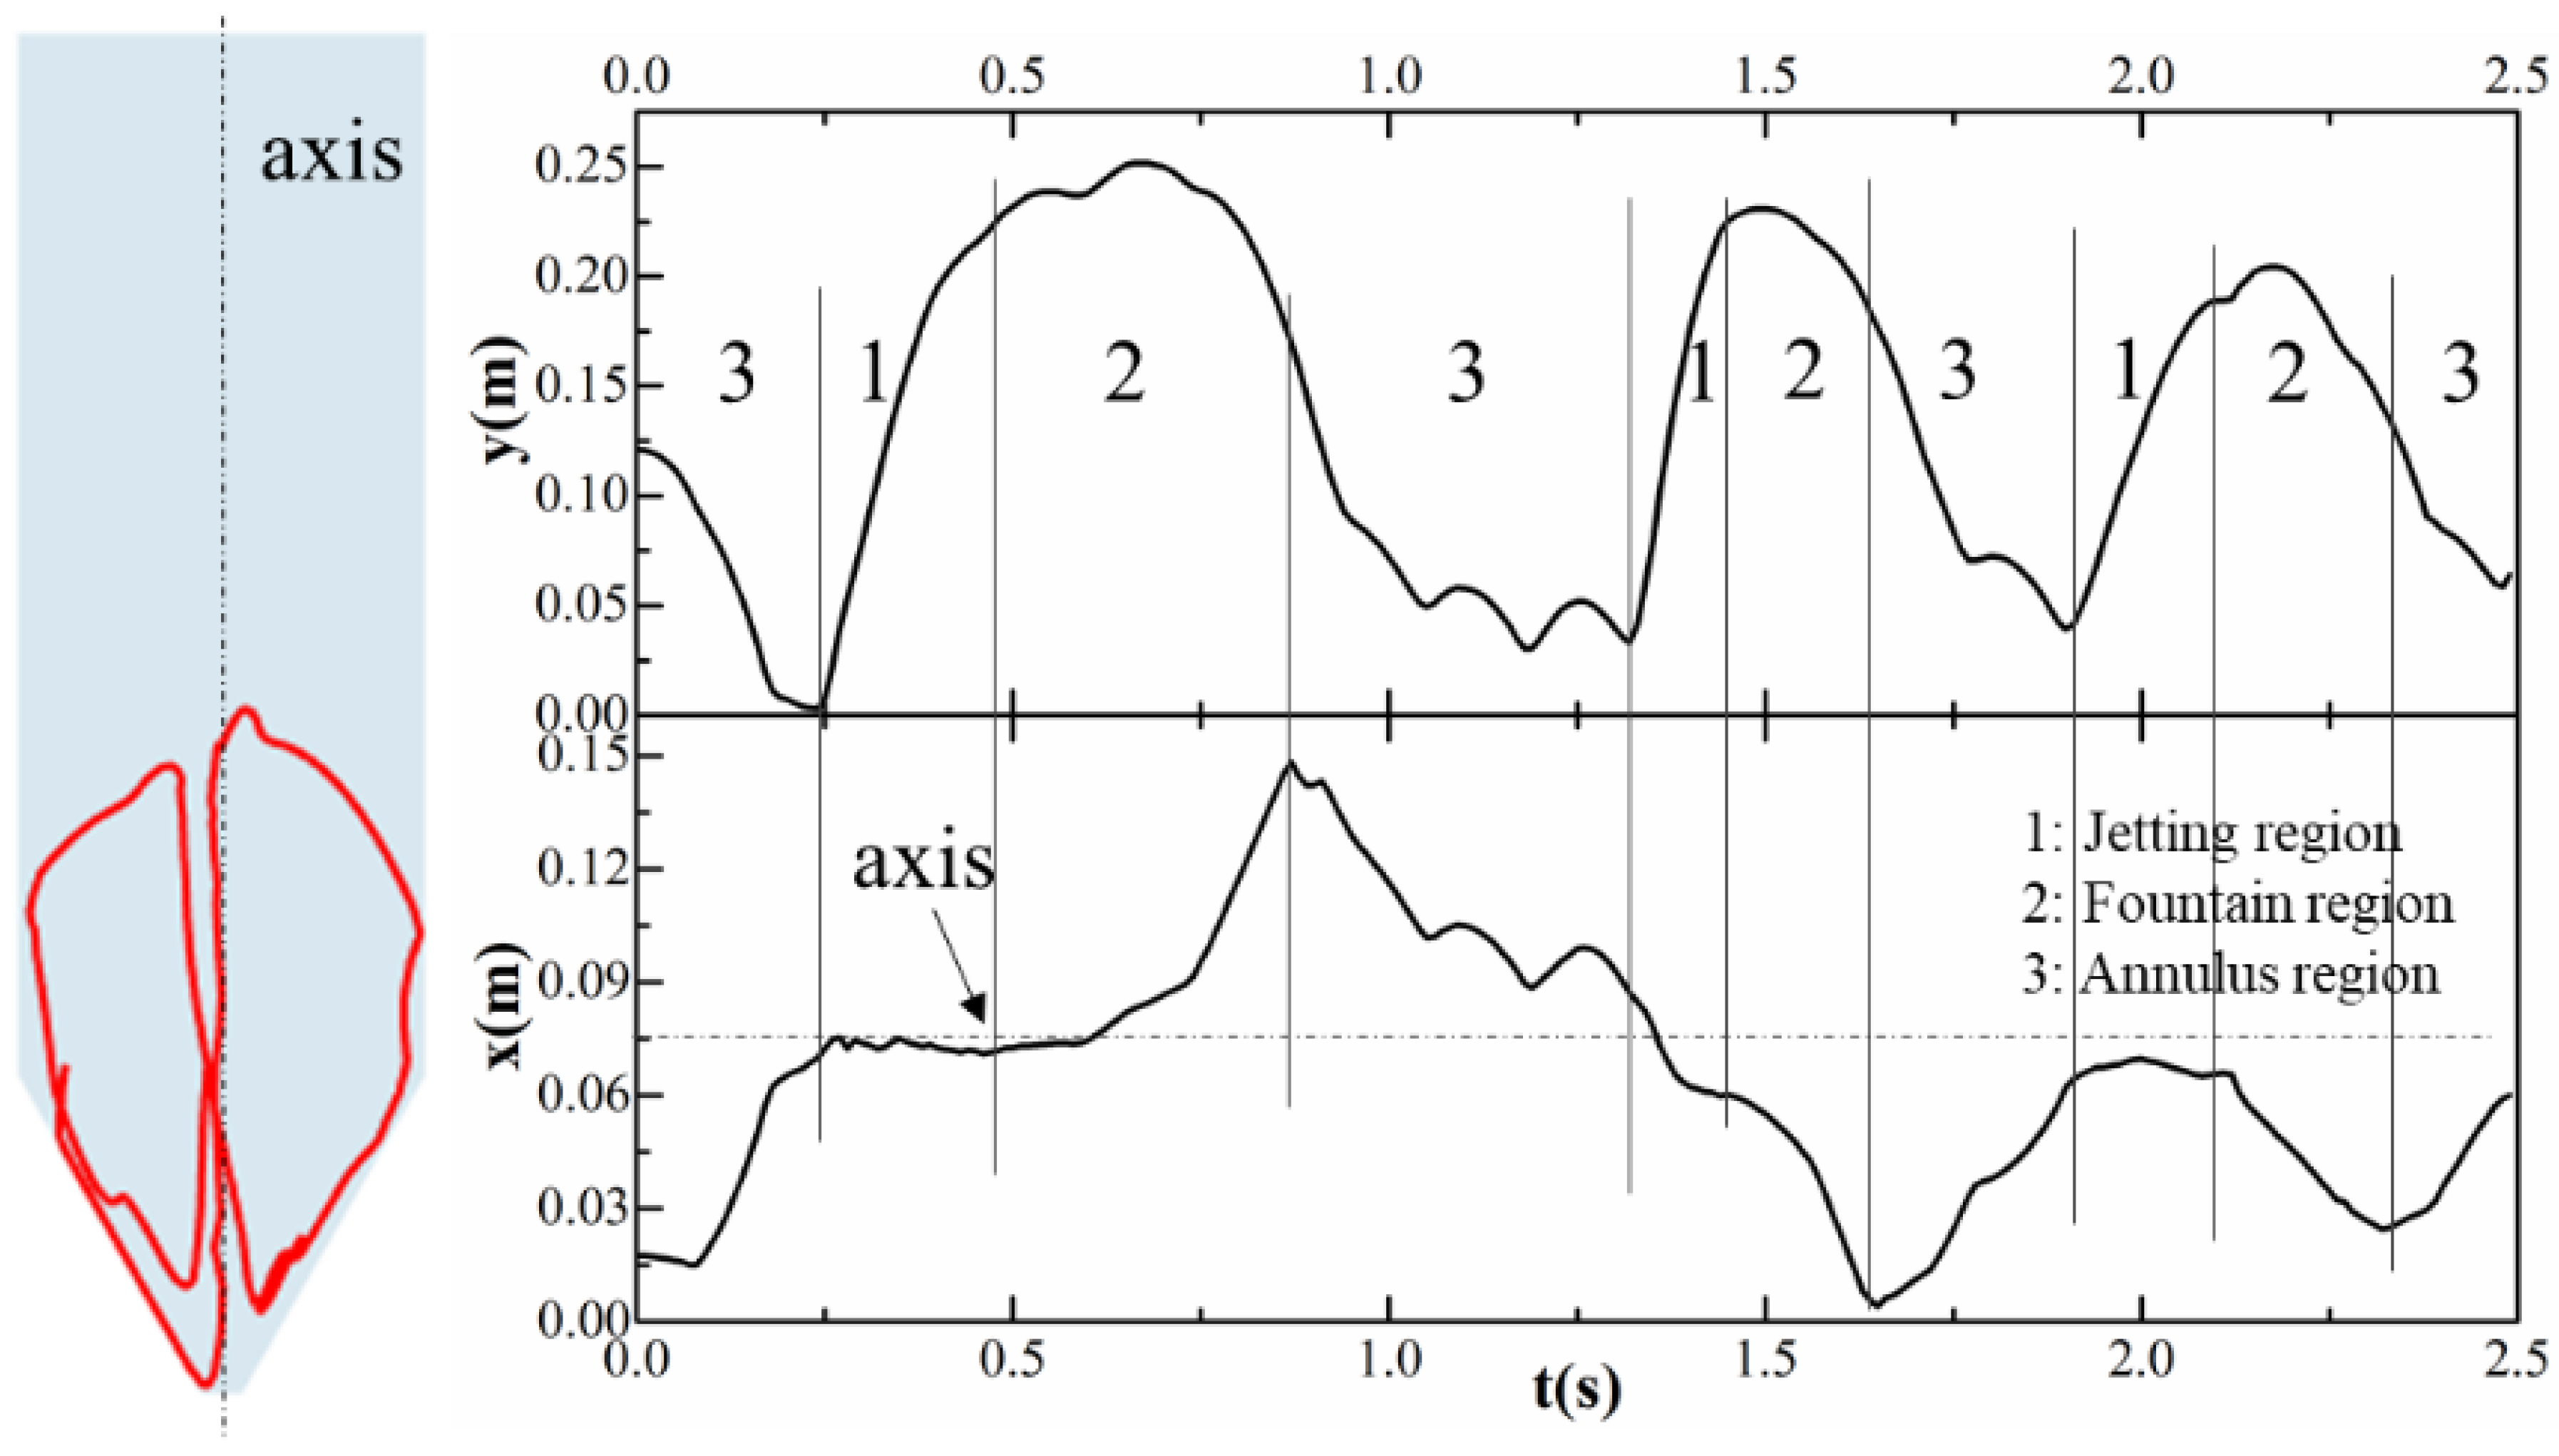
4.1.3. Particle Trajectory

The movement of a single particle can be obtained from CFD-DEM simulation results. Figure 8 shows a trajectory of a single particle. It can be clearly seen that the particle has passed through the spout zone, fountain zone and annulus zone. The residence times in each zone are also given in Figure 8. Also, periodicity can be found. The particle residence times are about 138, 220 and 1700 ms in the spout, fountain, and annulus zone, respectively. This result is related to the velocity characteristics of particles in each zone. It can be found that the flow pattern periodicity is close to the particle residence time in the spout zone. However, this periodicity of a single particle is not the same as that of flow patterns, because the flow pattern cycle is the statistical result of large number of particles, rather than a single particle.

4.2. Spout Behavior Study Used CFD-DEM Model with Adhesion Model

4.2.1. Adhesion Model Validation

The adhesion model is based on the Luding’s idea, which is a typical linear hysteresis model. Here, a head-on collision process of two particles with our model is obtained as shown in Figure 9. Here, dc is 2 μm and F adhesion is 8.2 × 10⁻⁴ N. The left is the Hooke term (fn, “a” series), and the right is contact force term (Fn, including damping, “b” series) with spring, partially latching spring and hysteresis models. The key difference between these models lies in the Hooke term. In Figure 9(a1), the loading stiffness is the same as unloading stiffness, while those are different in Figure 9(a2) due to collision loss. The model in Figure 9(a3) is complex, and the whole process is divided into four stages with different stiffness as mentioned above. The stiffness of each stage has its characteristic parameters, like energy loss, adhesion force and rupture distance. It can be found that the framework of our force model is consistent with that of Luding’s [16] and Liu’s model [25], but it has its own feature for adhesion. As seen from the Figure 9, the minimum force is not huge, and the rupture distance is quite long, which means particles are more likely to keep adhesion.
For validation of the adhesion model, the experimental results from the literature [33] is shown as Figure 10 where the density of particles is 2380 kg/m3, weight of particles is 86.1 g, number of particles is 4698, liquid content is 1.313 × 10⁻¹¹ m3, superficial gas velocity is 1.08 m/s (corresponding to inlet gas velocity is 18.24 m/s). The geometric structure used here is shown in Figure 2.
Figure 10 illustrates the longitudinal profile of vertical particle velocity along the spout axis by both experiment [33] and simulation. For the deduced part, C 1 is 0.966 kJ/(kg·K), C 2 is 1.142 kJ/(kg·K), q m is 15.48 m3/h, k temp is 10,000, ΔTp = 1000 K, h = 300 kJ/kg, Q d is a half of energy input, thus getting V = 1.790 × 10⁻¹¹ m3. All the curves have three similar stages under similar liquid contents (experiment: 1.313 × 10⁻¹¹ m3; simulation: 1.313 × 10⁻¹¹ m3 (Li et al. [35]), 1.790 × 10⁻¹¹ m3 (our work)): rapid acceleration (stage I), slow acceleration (stage II) and fountain (stage III). The following figures show the flow patterns of our adhesion model, which has higher spouted height compared with the results without adhesion model. The cycle time is about 110 ms, which implies that adhesion may accelerate cycle period.

4.2.2. Effect of Adhesion Intensity

The interaction force between particles will be changed by adhesion, thereby affecting the fluidization. In order to study the effect of adhesion on the fluidization, simulation results were obtained under different adhesion intensity using our model, as shown in Figure 11. It should be noticed that the temperature controls the liquid content, thus controlling the adhesion force.
It can be noted from Figure 11 that there are 7, 7.5, 7.5 cycles in 1 s in simulation results with no adhesion, slight adhesion and strong adhesion respectively, that means the bed oscillation cycle periods are in turn 143, 133 and 133 ms. This indicates that the adhesion will accelerate fluidization, and enhance intensity of fluidization. It is because adhesion can promote particle agglomeration. Under the same gas velocity, agglomerates strengthen the interaction on gas flow. Therefore, a larger contact force will be obtained, resulting in a higher spouted height and larger upward acceleration, so the periodic time is shortening.
There is a significant difference between spouted height within and without adhesion as shown in Figure 12a. The same tendency is reflected in the particle velocities from Figure 12b which further supports this argument. Particle fluidization with adhesion have obvious and regular fluctuations, while that without adhesion is relatively stable. It is suggested that slight adhesion will increase particle velocity as well as movement fluctuations. It is due to the enhancement of granular interaction on gas. As a result, particles are more likely to rise up. Besides, it is also seen from Figure 12b that adhesion will cause a phase difference in the vertical component of the velocity.
Compared with Figure 8, Figure 13 shows that there are still three stages, and the residence time of jetting region gets shorter as well as the annulus region. Residence times of each region are about 122, 174 and 674 ms in turn.

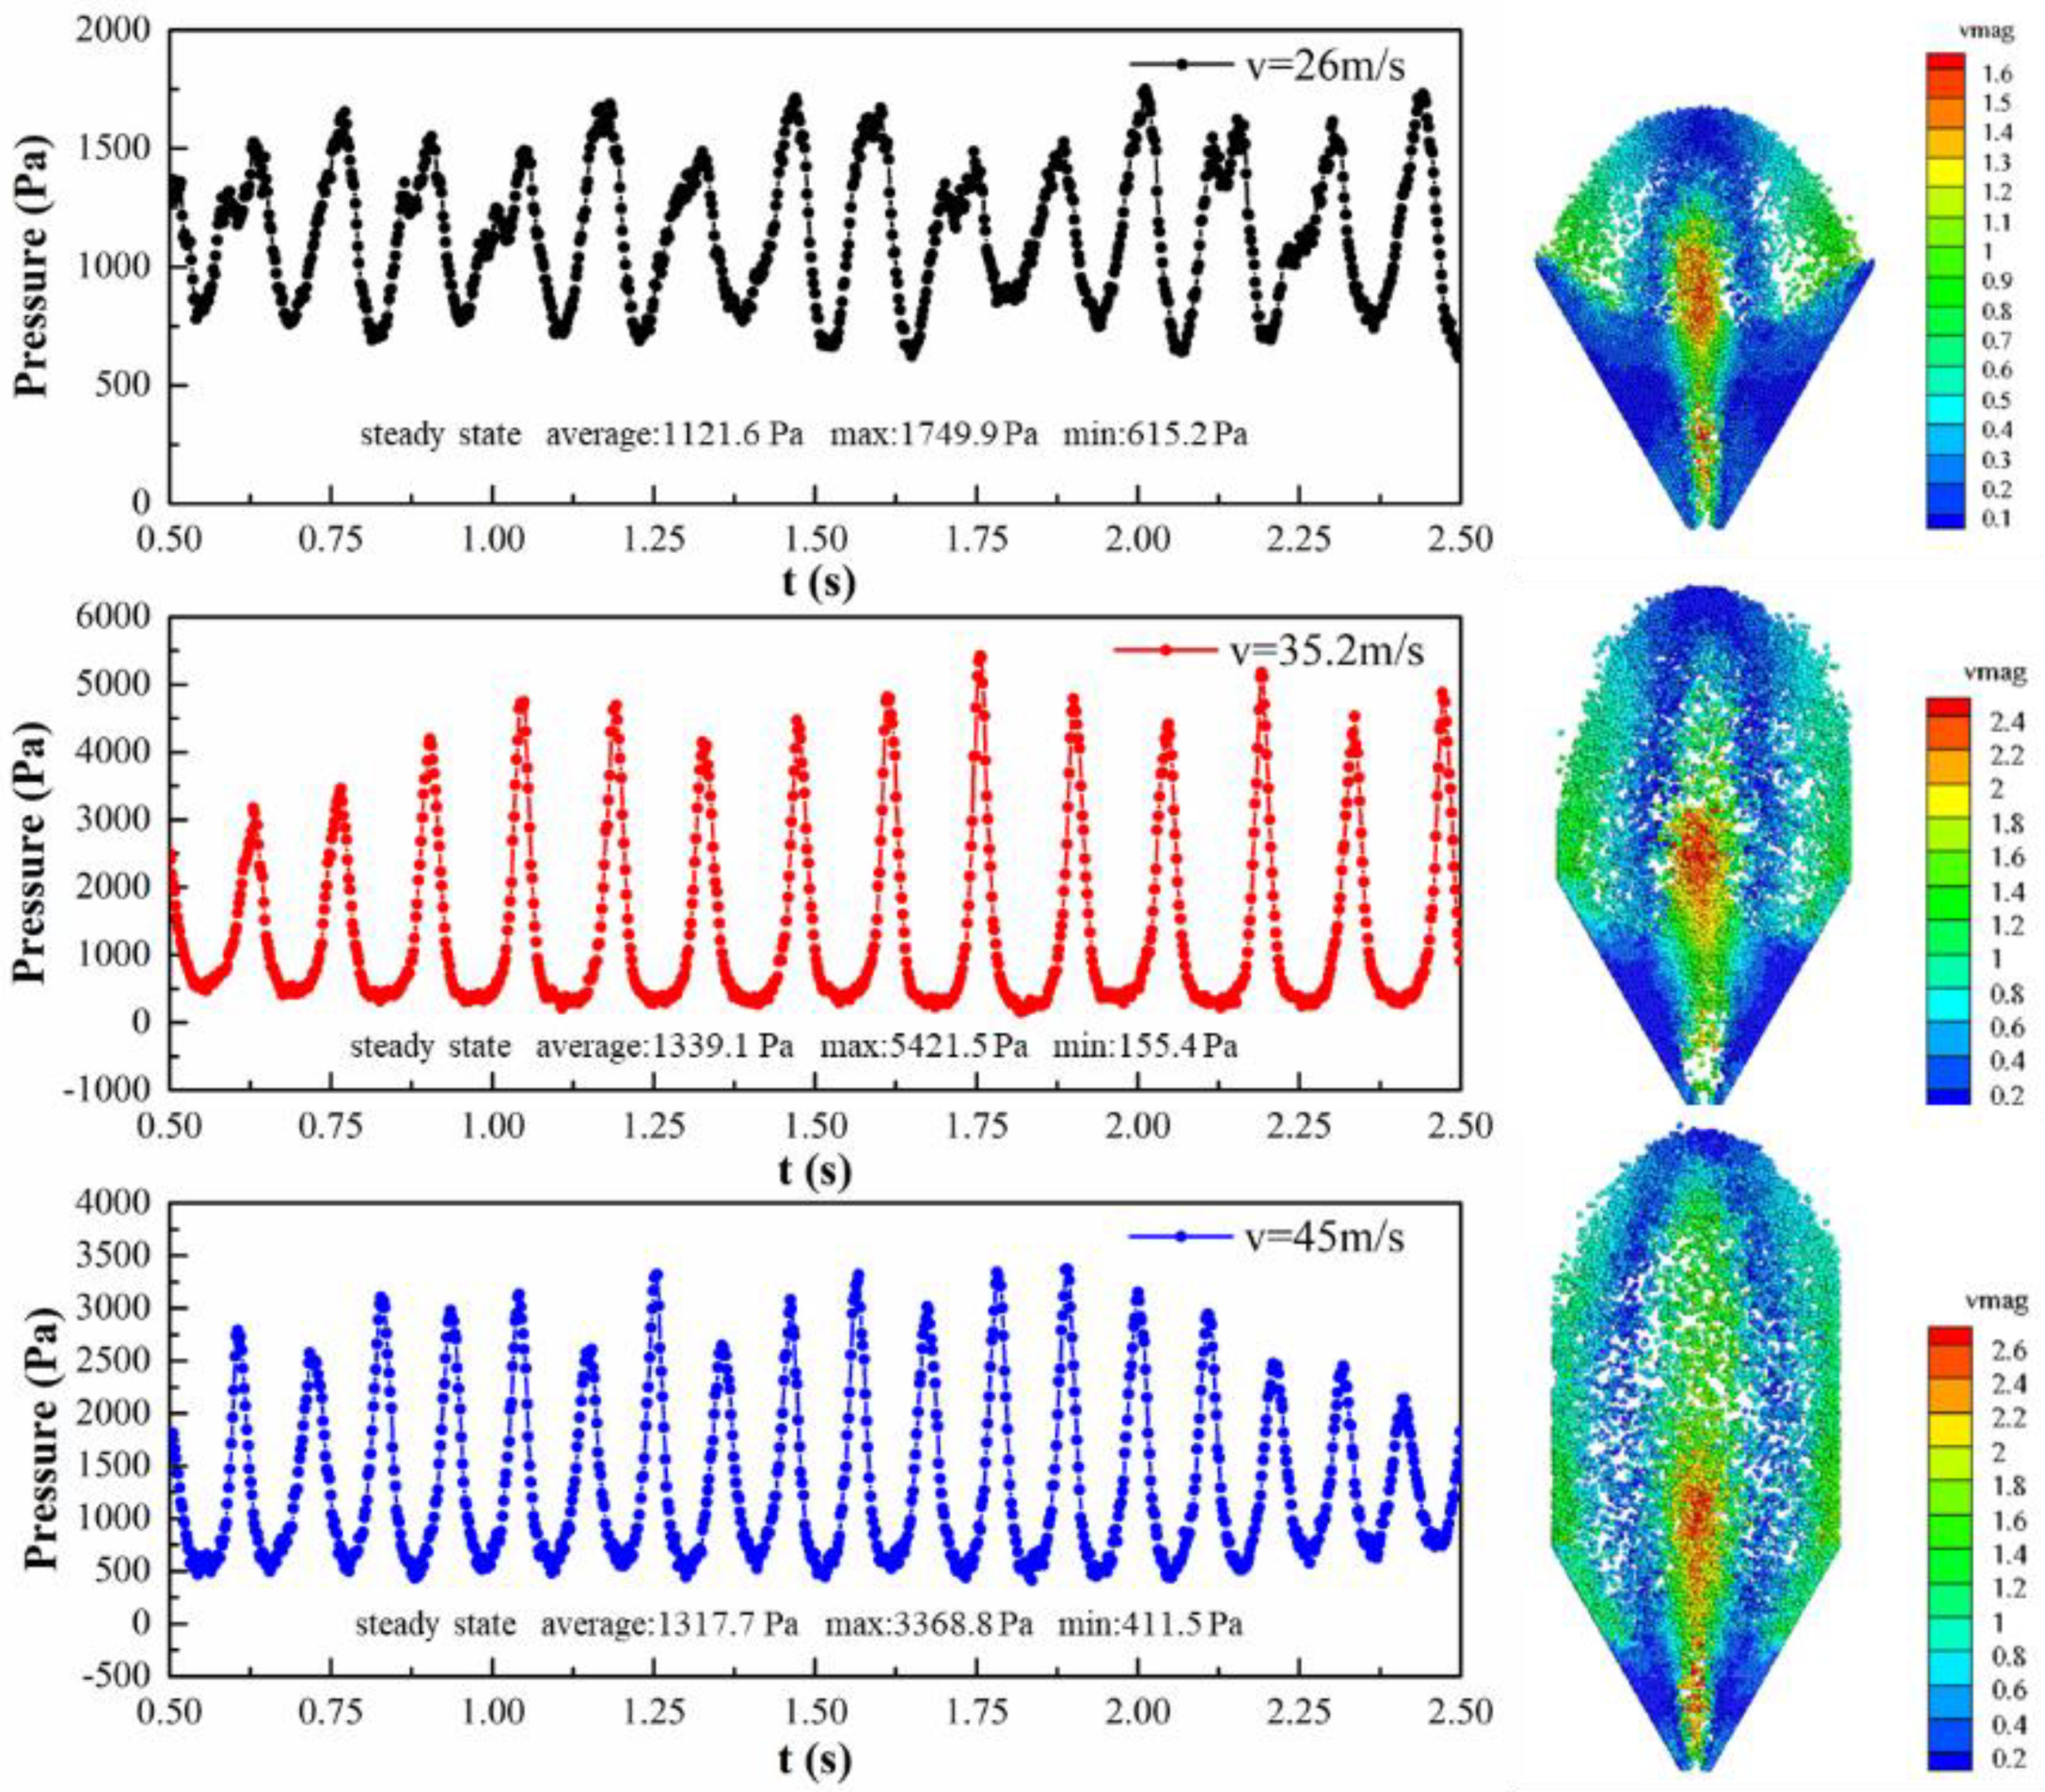
4.2.3. Effect of Inlet Velocity

In the spouted bed, the fluidization state is determined by not only the adhesion force (affecting the interaction force), but also the drag force. The effect of inlet gas velocity on fluidization was studied here.
It can be noted that in the adhesive state, the pressure drop cycle was more obvious by increasing inlet gas velocity, as shown in Figure 14. The reason is that increasing inlet gas velocity will enhance the drag force of particles. Therefore, particles behavior is much closer to the free spouting state where drag force is dominant. But in fact, there is still energy loss due to adhesion, even though the gas kinetic energy increase. The bed oscillation cycle periods at three cases are 111, 143 and 105 ms, respectively. Within a certain range, a higher gas velocity will lead to a higher spouted height, thus prolonging cycle time. In this case, both flow pattern and fountain width increase with gas velocity increasing.
It is found that the inlet gas velocity is positively relevant to the spout height at steady state, as shown in Figure 15a. It also suggests that a large gas velocity will cause a high initial holding pressure, which leads to a high spouted height of particles. However, the spouted height changes relatively smoothly at 26 m/s. For the three gas velocities, the final average spouted heights are about 0.175, 0.25 and 0.325 m, respectively.
Figure 15b shows total (the above) and vertical component (the below) of particle velocity at 26, 35.2, 45 m/s. It is obvious that high gas velocity will lead to high particle velocity at the steady state. High fluctuations in vertical velocity also occur at 35.2 m/s, indicating a strong intensity of particle motion. The cases of other two inlet gas velocities are relatively mild. Therefore, there is not a single trend in the effect of gas velocity on particles. The inlet gas velocity has a close impact on particle collision and mixing, suggesting that the drag force plays a significant role in fluidization of particles.
It can be seen from the Figure 16 that the residence times of each region are about 184, 277 and 357 ms, in turn. This indicates that in a certain scale, increasing inlet gas velocities can prolong the residence time in jetting region, making the spouted height higher, while the time in the annulus region is greatly reduced. It suggests that increasing inlet gas velocities makes the mixing of particles in different zones more effective.

5. Conclusions

An adhesion model is developed based on approaching-loading-unloading-detaching idea and particle surface change under high temperature in this paper. Analyses of the adhesion model are given through two particle collision process and validated by experiment. Effects of inlet gas velocity and adhesion intensity on spouted bed dynamics are investigated. A parameter sensitivity comparison of linear spring-damping model and Hertz-Mindlin Model is also conducted. Some conclusions can be put forth as follows:
  • Comparing the linear spring model with Hertz-Mindlin model, it is found that in case of small overlap, the forces calculated by both models have little distinction. In case of large overlap, the forces calculated by Hertz-Mindlin are larger than those of the linear model, and the distinction cannot be ignored. Thus, it is suggested that a proper k n of linear model should be selected according to the maximum probability of overlap in the particle collision process. There is an angle between torques of the two models, which is the same angle between tangential force and linear velocity.
  • An adhesion model with temperature is developed according to Luding’s idea and integrated with force relationships in JKR. It is validated by experiment results.
  • It is concluded that fluidization cycle will be accelerated by adhesion, and intensity of fluidization will be enhanced. The presence or absence of adhesion is of great difference.
  • In a certain adhesive state, the pressure drop cycle was more obvious and periodicity got longer with increasing inlet gas velocity. The fountain width and fountain height will increase as well. It also leads to strong intensity of particle motion.
  • The effect of the particle surface adhesion on the spouted state will be further studied by the adhesion model developed based on the energy loss and balance in the future.

Author Contributions

Conceptualization, M.L. and Z.C.; methodology, Z.C.; software, Z.C.; validation, Z.C. and M.C.; data curation, Z.C. and L.J.; writing—original draft preparation, Z.C.; writing—review and editing, Z.C. and L.J.; visualization, Z.C., L.J. and M.Q.; supervision, M.L.; project administration, M.L. and R.L.; funding acquisition, M.L. All authors have read and agreed to the published version of the manuscript.

Funding

This research was supported by Training Program Foundation for the Excellent Talents by Beijing Municipality (2017000020124G084), National Natural Science Foundation of China (Grant No. 91634113) and the National S&T Major Project of China (Grant No. ZX06901).

Acknowledgments

The authors thanks for the support of coding discussion of Liu Daoyin in Southeast University, China.

Conflicts of Interest

The authors declare no conflict of interest.

Nomenclature

acontact area of radius: m2
C1specific heat capacity of particles, J/(kg·K)
C2specific heat capacity of gas, J/(kg·K)
CDdrag coefficient of a particle
Dthe gap between the spherical surfaces, m
D0diameter of nozzle, m
Dcwidth of spouted bed, m
dcrupture distance, m
dpparticle diameter, m
E*equivalent Young’s modulus, Pa
ennormal coefficient of restitution between particles
en_wnormal coefficient of restitution between a particle and a wall
ettangential coefficient of restitution between particles
et_wtangential coefficient of restitution between a particle and a wall
Fadhesionthe adhesion force at overlap of zero, N
Ffinteraction force that the particle suffers from the surrounding gas, N
f ij , min the maximum magnitude of the cohesive force, N
Fnnormal contact force, N
F n d damping term of normal force, N
F n s spring term of normal force, N
Fpsource term, N
Fttangential contact force, N
F t d damping term of tangential force, N
Gshear modulus, Pa
G*equivalent shear modulus, Pa
hlatent heat of melting, J/kg
Hheight of spouted bed, m
H0particle loading, m
Ithe identity tensor
Iimoment of inertia, kg·m2
knnormal spring constant between particles, N/m
kn_wnormal spring constant between a particle and a wall, N/m
kloadloading stiffness, N/m
kunloadunloading stiffness, N/m
kttangential spring constant between particles, N/m
kt_wtangential spring constant between a particle and a wall, N/m
ktempthe ratio of particle temperature rising to gas temperature drop
Lthickness of spouted bed, m
Lithe distance from the point of contact to the center of the sphere, m
m*equivalent mass, kg
M1the torque calculated by linear spring damping model, N·m
M2the torque calculated by Hertz-Mindlin model, N·m
mimass of ith particle, kg
Mijtorque that the jth particle exerts on the ith particle, N·m
Mlayermass of liquid layer for total particles, kg
Nnumber of total particles
ppressure, Pa
qmmass flow rate of gas, kg/s
Qdenergy loss due to heat dissipation, J
Rradius of particles, m
R*equivalent radius, m
Reparticle Reynolds number
tCFDCFD time step, s
tDEMDEM time step, s
ugas velocity, m/s
Vvolume of liquid layer, m3
Vcellvolume of the CFD cell, m3
vfvelocity of inlet gas, m/s
vij,nnormal relevant velocity of i th and j th particles, m/s
vij,ttangential relevant velocity of i th and j th particles, m/s
Fccontact force, N
ncjnumber of contact particles
Vpvolume of a single particle, m3
vpparticle velocity, m/s
ΔTgtemperature change of gas, K
ΔTptemperature change of particles, K
Greek letters
β drag force coefficient, kg/(s·m3)
γ inverted cone angle
Γ surface tension, N/m
δ ij , min the particle overlap corresponding to f ij , min , m
δ max maximum overlap during collision, m
δ n normal overlap of two particles, m
δ p the permanent plastic deformation, m
δ t tangential overlap of two particles, m
ε local voidage
η n coefficient of particle normal dissipation, N·s/m
η t coefficient of particle tangential dissipation, N·s/m
θ the angle between tangential force and linear velocity
θ 0 contact angle between liquid and grain surface
λ g bulk viscosity of gas flow, Pa·s
ν Poisson’s ratio
μ cinematic viscosity of gas flow, Pa·s
μ r the coefficient of rolling friction
μ s coefficient of sliding friction between particles
μ s _ w coefficient of sliding friction between a particle and a wall
ξ drag scaling factor
ρ particle density, kg/m3
ρ g gas density, kg/m3
τ g stress tensor of gas
φ p plasticity index
ω angular velocity vector, 1/s

References

  1. Liu, M.L.; Chen, M.; Li, T.J. CFD-DEM-CVD multi-physical field coupling model for simulating particle coating process in spout bed. Particuology 2019, 42, 67–78. [Google Scholar] [CrossRef]
  2. Hattori, H.; Morimoto, T.; Yamaguchi, M.; Onezawa, T.; Arai, C. Drying of porous solid particles in various-shaped spouted bed with a draft-tube. J. Chem. Eng. Jpn. 2001, 34, 1549–1552. [Google Scholar] [CrossRef]
  3. Jose, M.J.S.; Alvarez, S.; Lopez, R. Modelling of drying of biomass wastes in a conical spouted bed dryer. Comput. Aided Chem. Eng. 2017, 40A, 517–522. [Google Scholar] [CrossRef]
  4. Makibar, J.; Fernandez-Akarregi, A.R.; Alava, I.; Cueva, F.; Lopez, G.; Olazar, M. Investigations on heat tranfer and hydrodynamics under pyrolysis conditions of a pilot-plant draft tube conical spouted bed reactor. Chem. Eng. Process. Process Intensif. 2011, 50, 790–798. [Google Scholar] [CrossRef]
  5. Artetxe, M.; Lopez, G.; Amutio, M.; Barbarias, I.; Arregi, A.; Aguado, R.; Bilbao, J.; Olazar, M. Styrene recovery from polystyrene by flash pyrolysis in a conical spouted bed reactor. Waste Manag. 2015, 45, 126–133. [Google Scholar] [CrossRef]
  6. Salam, P.A.; Bhattacharya, S.C. A comparative study of charcoal gasification in two types of spouted bed reactors. Energy 2006, 31, 228–243. [Google Scholar] [CrossRef]
  7. Zivkovic, V.; Kashani, M.N.; Biggs, M.J. Experimental and theoretical study of a micro-fluidized bed. AIP Conf. Proc. 2013, 1542, 93–96. [Google Scholar] [CrossRef]
  8. Farivar, F.; Zhang, H.; Tian, Z.F.; Gupte, A. CFD-DEM-DDM model for spray coating process in a Wurster coater. J. Pharm. Sci. 2020, 109, 3678–3689. [Google Scholar] [CrossRef]
  9. Grohn, P.; Lawall, M.; Oesau, T.; Heinrich, S.; Antonyuk, S. CFD-DEM simulation of a coating process in a fluidized bed rotor granulator. Processes 2020, 8, 1090. [Google Scholar] [CrossRef]
  10. Chen, T.; Ku, X.K.; Lin, J.Z.; Strom, H. CFD-DEM simulation of biomass pyrolysis in fluidized-bed reactor with a multistep kinetic scheme. Energies 2020, 13, 5358. [Google Scholar] [CrossRef]
  11. Bao, X.J.; Du, W.; Xu, J. An overview on the recent advances in computational fluid dynamics simulation of spouted beds. Can. J. Chem. Eng. 2013, 91, 1822–1836. [Google Scholar] [CrossRef]
  12. Moliner, C.; Marchelli, F.; Spanachi, N.; Martinez-Felipe, A.; Bosio, B.; Arato, E. CFD simulation of a spouted bed: Comparison between the discrete element method (DEM) and the two fluid model (TFM). Chem. Eng. J. 2019, 377, 120466. [Google Scholar] [CrossRef] [Green Version]
  13. Liu, M.L.; Wen, Y.Y.; Liu, R.Z.; Liu, B.; Shao, Y.L. Investigation of fluidization behavior of high density particle in spouted bed using CFD-DEM coupling method. Powder Technol. 2015, 280, 72–82. [Google Scholar] [CrossRef]
  14. Yue, Y.H.; Zhang, C.X.; Shen, Y.S. CFD-DEM model study of gas-solid flow in a spout fluidized bed with an umbrella-like baffle. Chem. Eng. Sci. 2021, 230, 116234. [Google Scholar] [CrossRef]
  15. Mema, I.; Padding, J.T. Fluidization of elongated particles-effect of multi-particle correlations for drag, lift, and torque in CFD-DEM. AIChE J. 2021, 67, e17157. [Google Scholar] [CrossRef]
  16. Qiang, S. Formation and Evolution of Particle Agglomerates in Gas-Solid Fluidized Beds; Zhejiang University: Zhejiang, China, 2018; p. 33. [Google Scholar]
  17. Horabik, J.; Molenda, M. Parameters and contact models for DEM simulations of agricultural granular materials: A review. Biosyst. Eng. 2016, 147, 206–225. [Google Scholar] [CrossRef]
  18. Yeom, S.B.; Ha, E.-S.; Kim, M.S.; Jeong, S.H.; Hwang, S.J.; Choi, D.H. Application of the discrete element method for manufacturing process simulation in the pharmaceutical industry. Pharmaceutics 2019, 11, 414. [Google Scholar] [CrossRef] [Green Version]
  19. Li, S.Q.; Marshall, J.S.; Liu, G.Q.; Yao, Q. Adhesive particulate flow: The discrete-element method and its application in energy and environmental engineering. Prog. Energy Combust. Sci. 2011, 37, 633–668. [Google Scholar] [CrossRef]
  20. Tsuji, Y.; Tanaka, T.; Ishida, T. Lagrangian numerical simulation of plug flow of cohesionless particles in a horizontal pipe. Powder Technol. 1992, 71, 239–250. [Google Scholar] [CrossRef]
  21. Luding, S. Cohesive, frictional powders: Contact models for tension. Granul. Matter 2008, 10, 235–246. [Google Scholar] [CrossRef] [Green Version]
  22. Yang, W.M.; Wang, M.X.; Zhou, Z.Q.; Li, L.P.; Yang, G.; Ding, R.S. Research on the relationship between macroscopic and mesoscopic mechanical parameters of limestone based on Hertz Mindlin with bonding model. Geomech. Geophys. Geo-Energy Geo-Resour. 2020, 6, 68. [Google Scholar] [CrossRef]
  23. Wang, N.; Yang, S.Q.; Zhao, T.T.; Cao, B.; Wang, C.W. Amending research on the expression of the contact force of the spindle barrel finishing based on EDEM simulation. Chin. J. Mech. Eng. 2020, 33, 83. [Google Scholar] [CrossRef]
  24. Zhang, T.; Zhao, M.Q.; Liu, F.; Tian, H.Q.; Wulan, T.Y.; Yue, Y.; Li, D.P. A discrete element method model of corn stalk and its mechanical characteristic parameters. Bioresources 2020, 15, 9337–9350. [Google Scholar] [CrossRef]
  25. Hu, J.P.; Xu, G.H.; Shi, Y.J.; Wu, L.B. A numerical simulation investigation of the influence of rotor wake on sediment particles by computational fluid dynamics coupling discrete element method. Aerosp. Sci. Technol. 2020, 105, 106046. [Google Scholar] [CrossRef]
  26. Jin, Q.; Zhang, J.N.; Ge, Y.; Gao, B. Ship Ice Resistance in polar brash/broken ice area based on discrete element method. Ship Eng. 2020, 42, 35–41. [Google Scholar]
  27. Lyu, J.; Park, J. Analysis of particle packing process by contact model in discrete element method. J. Korean Soc. Manuf. Process Eng. 2019, 18, 59–65. [Google Scholar] [CrossRef]
  28. Zhao, S.; Evans, T.M.; Zhou, X. Effects of curvature-related DEM contact model on the macro- and micro-mechanical behaviours of granular soils. Geotechnique 2018, 68, 1085–1098. [Google Scholar] [CrossRef]
  29. Difelice, R. The voidage function for fluid particle interaction systems. Int. J. Multiph. Flow 1994, 20, 153–159. [Google Scholar] [CrossRef]
  30. Liu, D.Y.; van Wachem, B.G.M.; Mudde, R.F.; Chen, X.P.; van Ommen, J.R. An adhesive CFD-DEM model for simulating nanoparticle agglomerate fluidization. AIChE J. 2016, 62, 2259–2270. [Google Scholar] [CrossRef]
  31. Guo, Y.; Curtis, J.S. Discrete Element Method Simulations for Complex Granular Flows. Annu. Rev. Fluid Mech. 2015, 47, 21–46. [Google Scholar] [CrossRef]
  32. Lian, G.P.; Thornton, C.; Adams, M.J. A theoretical study of the liquid bridge forces between two rigid spherical bodies. J. Colloid Interface Sci. 1993, 161, 138–147. [Google Scholar] [CrossRef]
  33. Zhu, R.R.; Li, S.Q.; Yao, Q. Effects of cohesion on the flow patterns of granular materials in spouted beds. Phys. Rev. E 2013, 87, 022206. [Google Scholar] [CrossRef] [PubMed]
  34. Liu, G.Q.; Li, S.Q.; Zhao, X.L.; Yao, Q. Experimental studies of particle flow dynamics in a two-dimensional spouted bed. Chem. Eng. Sci. 2008, 63, 1131–1141. [Google Scholar] [CrossRef]
  35. Zhang, H.; Li, S.Q. DEM simulation of wet granular-fluid flows in spouted beds: Numerical studies and experimental verifications. Powder Technol. 2017, 318, 337–349. [Google Scholar] [CrossRef]
Figure 1. Schematic of particle adhesion mechanism.
Energies 14 02276 g001
Figure 2. (a) Geometry (b) Mesh (c) Experiment apparatus of 2D spouted bed.
Energies 14 02276 g002
Figure 3. Normal force-normal overlap diagram of linear spring damping model and Hertz-Mindlin model at different relative velocities.
Energies 14 02276 g003
Figure 4. Tangential force-tangential overlap diagram of linear spring damping model and Hertz-Mindlin model (a) at different relative velocities; (b) at different normal overlaps.
Energies 14 02276 g004
Figure 5. Comparison of torque models.
Energies 14 02276 g005
Figure 6. Particle flow pattern of (a) linear spring-damping model by in-house code; (b) Hertz-Mindlin model by commercial software; (c) experimental results.
Energies 14 02276 g006
Figure 7. Flow patterns in spouted bed with CFD-DEM model.
Energies 14 02276 g007
Figure 8. Trajectory and residence time in each zone for a single particle without adhesion.
Energies 14 02276 g008
Figure 9. Force diagram of Hooke term (a1) by spring model; (a2) by partially latching spring model; (a3) by linear hysteresis model; force diagram of contact force (including damping) (b1) by spring model; (b2) by partially latching spring model; (b3) by linear hysteresis model during head-on collision of two particles.
Energies 14 02276 g009
Figure 10. The longitudinal profile of vertical particle velocity along the spout axis. Experimental data approximately estimates from literature [33].
Energies 14 02276 g010
Figure 11. Pressure drop and flow pattern at different adhesion state.
Energies 14 02276 g011
Figure 12. (a) Spouted height (b) Velocity of particles at different adhesion intensities controlled by temperatures.
Energies 14 02276 g012
Figure 13. Trajectory and residence time of each zone for a single particle with strong adhesion.
Energies 14 02276 g013
Figure 14. Pressure and flow pattern at different inlet velocities.
Energies 14 02276 g014
Figure 15. (a) Spouted height (b) Velocity of particles at different inlet gas velocities.
Energies 14 02276 g015
Figure 16. Trajectory and residence time of each zone for a single particle with inlet gas velocity of 32.5 m/s.
Energies 14 02276 g016
Table 1. Parameters of simulation.
Geometry Gas Properties
Diameter of nozzle ( D 0 )9 mmGas density ( ρ g ) 1.205   kg / m 3
Inverted cone angle ( γ ) 60°Gas viscosity ( μ )1.81 × 10⁻⁵ Pa·s
Width of spouted bed ( D c ) 150 mmParticle Properties
Height of spouted bed (H)500 mm Particle diameter ( d p ) 2 mm
Thickness of spouted bed (L)15 mmGranule density (ρ) 2600   kg / m 3
Simulation Loading ( H 0 )100 mm
Particle to Particle Particle to Wall
Normal spring constant (kn)800 (N/m)Normal spring constant (kn)800 (N/m)
Tangential spring constant (kt)228.57 (N/m)Tangential spring constant (kt)228.57 (N/m)
Normal coefficient of restitution (en)0.9Normal coefficient of restitution (en)0.9
Tangential coefficient of restitution (et)0.9Tangential coefficient of restitution (et)0.9
Coefficient of sliding friction (μS)0.2Coefficient of sliding friction (μS)0.2
Others
Number of particles (N)15,000CFD time step (tCFD)4 × 10⁻⁵ s
Velocity of inlet gas (vf)26, 35.2, 45 m/sDEM time step (tDEM)4 × 10⁻⁶ s
Table 2. List of all simulation conditions.
CaseLiquid Content
V (m3)
Rupture Distance
dc (m)
k1Temperature
T (°C)
Inlet Gas Velocity
v (m/s)
Adhesion
intensity
No adhesionSpring-dashpot model (room temperature)26
Slight adhesion2.798 × 10−197.111 × 10−7160026
Strong adhesion6.427 × 10−114.355 × 10−910−5160026
Gas velocityLow6.427 × 10−114.355 × 10−910−5160026
Medium6.427 × 10−114.355 × 10−910−5160035.2
High6.427 × 10−114.355 × 10−910−5160045
Table 3. Comparison of normal force models.
Item Linear Spring-Damping Model Hertz-Mindlin Model
Normal force F n   =   F n s   +   F n d   =   k n δ n   +   η n v ij , n F n   =   F n s   +   F n d F n s   =   4 3 E R 1/2 δ n 3/2
F n d   =   2 5 6 β S n m v ij , n
Relevant equations η n   =   2 ( m k n ) ln e n / π 2   +   ln 2 e n 1 E     1     ν 1 2 E 1   +   1     ν 2 2 E 2
1 R     1 R 1   +   1 R 2
E = 2(1 + ν)G
β   =   1n e n π 2   +   ln 2 e n
S n   =   2 E R δ n
Input parametersNormal spring constant (kn)
Normal coefficient of restitution (en)
Particle radius R1, R2
Particle Poisson ratio ν1, ν2
Shear modulus G1, G2
Final expression F n   =   k n δ n 2 ( m k n ) ln e n π 2   +   ln 2 e n v ij , n F n   =   4 3 E R 1/2 δ n 3/2     2 5 3 E 1 2 R 1 4 δ n 1 4 m 1 2 ln e n π 2   +   ln 2 e n v ij , n =   4 3 a E δ n     2 m 5 3 aE lne n π 2 + ln 2 e n v ij , n
Examplekn = 6388.8 N/m
en = 0.9·ηn = 0.0125
Fn = −6388.8δn + 0.0125vij,n
R1 = R2 = 0.001 m
ν1 = ν2 = 0.3
G1 = G2 = 107 Pa
F n   =   425920 δ n δ n   +   0.1141 δ n 1 4 v ij , n
Table 4. Comparison of tangential force models.
Item Linear Spring-Damping Model Hertz-Mindlin Model
Tangential force F t   =   k t δ t   +   η t v ij , t     F t   < μ s | F n | F t   =   f s | F n | δ t / | δ t |     F t     μ s | F n | F t   =   S t δ t F t d   =   2 5 6 β S t m v ij , t
Relevant equations           2 3     k t k n     1 η t   =   2 ( m k t ) ln e t / π 2   +   ln 2 e t S t   =   8 G R δ n
Input parametersTangential spring constant (kt)
Tangential coefficient of restitution (et)
Particle radius R1, R2
Particle Poisson ratio ν1, ν2
Shear modulus G1, G2
Final expression F t   =   k t δ t     2 ( m k t ) ln e t π 2   +   ln 2 e t v ij , t F t   =   8 G R δ n δ t     4 5 3 G 1 2 R 1 4 δ n 1 4 m 1 2 ln e n π 2   +   ln 2 e n v ij , t =   8 a G δ t     2 m 20 3 a G ln e n π 2   +   ln 2 e n v ij , t
Examplekt = 5261.3 N/m·μs = 0.3
et = 0.9·ηt = 0.0113
Ft = −5261.3 δt + 0.0113 νij,t
R1 = R2 = 0.001 m
ν1 = ν2 = 0.3
G1 = G2 = 107 Pa
F t   =   526130 δ n δ t   +   0.1036 δ n 1 4 v ij , t
Publisher’s Note: MDPI stays neutral with regard to jurisdictional claims in published maps and institutional affiliations.

