Article

Thermogravimetric Analysis of Solid Biofuels with Additive under Air Atmosphere

Department of Power Engineering and Turbomachinery, Faculty of Energy and Environmental Engineering, Silesian University of Technology, Konarskiego 18, 44-100 Gliwice, Poland
*
Author to whom correspondence should be addressed.
Energies 2021, 14(8), 2257; https://doi.org/10.3390/en14082257
Submission received: 17 February 2021 / Revised: 31 March 2021 / Accepted: 15 April 2021 / Published: 17 April 2021
(This article belongs to the Special Issue Biomass Based Renewable Energy Systems)

Abstract

:
The paper presents the combustion profile of selected fuels as a result of thermogravimetric analysis. The main purpose of this study was to investigate a mixture of different types of fuel and the influence of the use of a fuel additive on the combustion process profile. As a fuel additive, halloysite was used to investigate the thermogravimetric profiles. It was confirmed that the main combustion parameters such as ignition temperature, burnout temperature, and maximum peak temperature correlated accordingly with different combustibility indices such as the ignition index, the burnout index, and the combustion indices. Furthermore, the present study provided a comparison of selected methods for analyzing non-isothermal solid-state kinetic data and investigated the kinetics of thermal decomposition to describe the ongoing process. Two non-isothermal model methods (Kissinger and Ozawa) were used to calculate the Arrhenius parameters. The effect of heating rate and the addition of halloysite as a fuel additive on decomposition were studied.

1. Introduction

Combustion characteristics of fuel can be determined by using thermo-analytical techniques such as thermogravimetry (TG), derivative thermogravimetry (DTG), differential thermal analysis (DTA), differential scanning calorimetry (DSC), and thermomechanical analysis (TMA), which cover a wide range of applications in research and technical assessment of fuels. Thermogravimetric analysis (TGA) is one of the most favorable and effective techniques to determine the combustion profile of a fuel. TGA should be employed at a relatively low heating rate (<20 °C/min) because the actual temperature of the fuel sample may vary from the measured temperature of the fuel sample at higher heating rates (>20 °C/min). This is especially visible in the inherence of oxygen atmosphere when a high heating rate and/or larger fuel sample mass could carry on to ignition and uncontrolled combustion of the sample. Thus, TGA analyses are a useful tool to study devolatilization and combustion of fuels in kinetic aspects. In particular, four basic stages of combustion can be observed, such as moisture evaporation, devolatilization and volatiles oxidation, ignition, and fixed carbon combustion [1,2,3,4,5].
As shown in Table 1, a great deal of research carried out tests on combustion of coal, biomass, and sludges under different atmosphere conditions. Air is the most pervasive combustion atmosphere, but gas mixtures (O2/CO2 [6], O2/N2 [7,8]) and nitrogen [9,10,11,12,13] as inert gas are frequently used as well. Additionally, different heating rates were investigated in the range from 2.5 °C/min to 80 °C/min. The maximum treatment temperature most commonly used by the researchers was 1000 °C. In some investigations, as described in [8,11,12,13,14,15], the maximum treatment temperature did not exceed 950 °C.
To the authors’ knowledge, this was the first study on the thermogravimetric analysis of biomass mixed with halloysite additive. Authors also did not identify other studies on halloysite impact on thermal analysis (combustion process profiles—DTG, DSC, and TG) and kinetic analysis (by using Kissinger and Ozawa methods). Presented in Table 1, literature reports related to the TGA research focused on the burning of coal or different types of biomass without any fuel additives. The TGA research referred to a method commonly applied in combustion technology temperature treatment windows up to 1100 °C in different (oxidizer/inert) atmosphere conditions and heating rates. In the article, new kinetic data for fuel pre-mixed with halloysite were presented and discussed.
The main purpose of this study was to investigate a mixture of different types of biomass with an additive by thermogravimetric analysis. Furthermore, the present study provided a comparison of selected methods for analyzing non-isothermal solid-state kinetic data and investigate the kinetics of thermal decomposition to describe the ongoing process. The process was controlled by TG/DSC SETARAM LABSYSTM analyzer in an air atmosphere, and the thermal analysis curves were recorded at several linear heating rates. Two non-isothermal model methods (Kissinger and Ozawa) were used to calculate the Arrhenius parameters. The effect of heating rate and the addition of halloysite as a fuel additive on thermal decomposition were also studied.
TG and DSC curves allowed us to determine the thermal behavior of the fuel sample during the heating process at a fixed atmosphere. The main parameters which could be identified when determining the TG curve were ignition temperature (Ti), burnout temperature (Tf), and maximum peak temperature (Tp)—see Figure 1 [16,17,18,19,20]. Ti presented the temperature at which the sample begans to burn. According to [6,16,21,22], Ti could be determined by the intersection of the two tangents. The first tangent was parallel to the abscissae axis and at the same time was tangent to the TG curve, whereas the second tangent was determined on the TG curve at the point of maximum fuel mass loss rate. Tf presented the point at which fuel oxidation was finished, and it was defined as the temperature where sample mass loss corresponded to 98 wt% of the initial mass of the sample [22]. Tp could be identified by using a DTG curve, and it presented the maximum rate of mass loss of the sample [16,23]. These characteristic temperatures were correlated accordingly with different combustibility indices such as the ignition index (Di), the burnout index (Df), and the combustion indices S and Hf [13,16,23].
The value of the ignition index (Di) defined the thermal possibility of fuel combustion in the first stage determined by the amount of separated volatile compounds. The higher the Di value was, the more efficient and stable the combustion process was. Di was calculated from Equation (1).
D i = DTG max t p · t i
where:
  • DTGmax—the maximum combustion rate, wt%/min;
  • tp—the corresponding time of DTGmax, min;
  • ti—the ignition time, min [13,16,23].
The value of burnout index (Df) was defined as Equation (2).
D f = DTG max Δ t 1 / 2 · t p · t f
where:
  • Δt1/2—the time range of DTG/DTAmax = 0.5, min;
  • tf—the burnout time, min [13,16,23].
The combustion index S described the three main properties of fuel during the combustion process such as ignition, combustion, and burnout. The higher the value of this index was, the higher the combustion activity was. S was defined as Equation (3).
S = DTG max · DTG mean T i 2 · T f
where:
  • DTGmean—the mean combustion rate, wt%/min;
  • Ti—the ignition temperature, °C;
  • Tf—the burnout temperature, °C [13,16,23,24,25].
The combustion index Hf described the intensity and the rate of the combustion process. The lower the value of Hf was, the higher the combustion activity was. Hf was defined as Equation (4).
H f = T p · ln ( Δ T 1 / 2 DTG mean )
where:
  • Tp—the corresponding temperature of DTGmax, °C;
  • ΔT1/2—the temperature range of DTG/DTAmax = 0.5, °C [13,16,23,26,27,28].
Model-free methods are one of the various mathematical schemes to estimate kinetic parameters for thermal decomposition of fuel samples. These are defined based on evaluating the Arrhenius parameters and concern series of experiments performed at different heating rates [29].
The Arrhenius Equation (5) is a formula that can be used to determine the temperature dependence of the combustion reaction rates. This equation allowed us to determine the activation energy of a specific fuel type if a constant rate of reaction for at least two treatment temperatures was known. The energy of activation was always a positive value and did not depend on the treatment temperature and was a characteristic parameter of the reaction in a given phase. The higher the activation energy value was, the stronger the dependence of reaction rate from temperature was.
ln ( k ) = ln ( A ) E a R · T
where:
  • k—the rate constant, 1/s;
  • A—the pre-exponential factor, 1/s;
  • Ea—the activation energy, kJ/mol;
  • R—the gas constant, 8.314 J/(mol K);
  • T—temperature, K [24].
  • The Kissinger method is described by the following Equation (6) [2,3,4]:
ln ( β T p 2 ) = ln ( AR E a ) E a R · T p
where:
  • Tp—the peak temperature, K;
  • β—the heating rate, K/min.
This method allowed us to obtain the value of activation energy Ea from a plot of ln(β/Tp) against 1/Tp for a series of experiments at different heating rates β and where Tp was the peak temperature for the maximum reaction rate on the DTG curve. The activation energy Ea was obtained from the slope of the Kissinger plot [2,3,4,30,31].
  • The Ozawa method is described by the following Equation (7) [32]:
ln ( β ) = const 1.052 E a R · T p
To obtain the Ozawa plot, it was necessary to run several DTG experiments with different heating rates, observe the maximum reaction rate, and determine the peak temperature for each DTG curve. The value of activation energy Ea could be obtained from a plot ln(β) against 1/Tp. The activation energy Ea was determined from the slope of the Ozawa plot [30,31,32,33].

2. Materials and Methods

In order to present the changes of fuel properties against fouling and corrosion, the halloysite as fuel additive was used. The halloysite research related to boiler operation was described in [34,35], and detailed chemical analysis of halloysite used in the present research was presented in the [36].
Three samples of biomass (marked as BZ—herbaceous biomass, DM—miscanthus, DS—cereal straw) without additive (BZ0, DM0, DS0), three samples of biomass with the halloysite additive (BZ4, DM4, DS4), and one coal sample (WS—hard coal) as reference were investigated during the experiments. In Table 2, the analyses of used fuels are presented. Proximate and ultimate analysis results for original fuels (without additive) were carried out according to the international standards. In particular, proximate analysis was performed by weight method with the use of CZYLOK 22HM ceramic furnace according to standards for solid (PN-G-04560, PN-ISO 1171, PN-G-04516) and biomass fuels (PN-ISO 18134, PN-EN-ISO 18122, PN-EN-ISO 18123). Ultimate analysis was carried out according to PN/EN standards by the external accredited laboratory. The total contents of C, H, N, S were determined according to PN-EN ISO 16948:2015-07, PN-EN ISO 16994:2015-06 for biomass samples, and PN-G-04571:1998, PN-G-04584:2001 for coal sample with the use of the high-temperature combustion method with IR and the catarometric method. Cl content was measured according to PN-EN ISO 16994:2015-06 for biomass samples and DIN 51727:2001 for coal samples with the ion chromatography method. Na and K contents were determined using inductively coupled plasma optical emission spectrometry (ICP-OES). O content was determined using the calculation method. Finally, the LCV (lower calorific value) of tested fuels were determined by the calorimetric method according to the PN-ISO 1920 (for coal sample) and PN-EN 14918 (for biomass samples). Theoretical analysis for fuel-additive mixtures were calculated from the individual as-received fuel analysis and the halloysite additive analysis.
A sample of about 200 g of each fuel was crushed and sieved to obtain particle size distribution defined as 100% < 200 μm. The sample of each fuel was divided into two parts, and one of them was doped with halloysite (4 wt%). Then, prepared samples were separately mixed to obtain adequate homogenization.
Approximately 10 mg of sample was placed in 90 μL alumina crucible. Each sample was investigated under the same conditions (treatment temperature range and atmosphere). Experiments were carried out under non-isothermal conditions. Samples were heated from ambient temperature (25 °C) to 105 °C at a heating rate of 5 °C/min and then held for 10 min to complete the moisture vaporization. Next, they were heated up to 900 °C at different heating rates (5, 10, 15, 20 °C/min) and held at the final treatment temperature for 10 min to complete the burnout process. All experiments were performed under atmospheric air conditions. The airflow was controlled with an air pressure valve adjusted to 1.5 bar (the considered airflow is a function of air pressure, which should be adjusted with the air pressure valve according to the TGA analyzer operation manual). Additionally, blank experiments were performed to calibrate experiments.

3. Results

3.1. Thermal Analyses

Combustion profiles for presented fuels ((a) without halloysite and (b) with halloysite) are presented in Figure 2, Figure 3 and Figure 4, which show derivative thermogravimetric evolution curves (DTG), differential scanning calorimeter curves (DSC), and weight loss curves (TG) at heating rates of 20 °C/min.
The DTG profiles (Figure 2) obtained at a heating rate of 20 °C/min present the differences between coal and biomass samples, which were caused by a high content of cellulose, hemicellulose, and lignin in biomass. Additionally, coal thermal processing was characterized by a shorter DTGmax peak compared to biomass processing, which was induced by the devolatilization process, which proceeded more slowly. The maximum peak temperature (Tp) for the coal sample occurred in 535.2 °C, which was considerably higher than for the biomass samples range of 295.7–329.4 °C (Table 3). For tested biomass samples, the DTG curves had different profiles, which was related to various organic composition. A similar trend for biomass samples was noted in the article [16,30,37] showing similar tendency for DTG profiles. Comparing biomass with and without halloysite separately, the highest Tp occurred for DM0 and DM4, while the lowest values were for DS0 and DS4. Biomass samples without and with the addition of halloysite did not show significant divergences for DTG curves. However, the addition of halloysite increased the Tp value in the range of 1.9–3.4 °C (less than 1.2 %). Comparing the DTGmax for biomass samples with and without additive, a decrease in the range of 0.3–0.4 wt%/min (less than 3.2%) was noticed. The DSC profiles presented in Figure 3 show the experimental thermograms for the tested fuels. It was noticed that the thermal behaviors of coal and biomass samples during the combustion process were completely different. The benchmark DSC curve obtained from chemical reactions should have been a smooth, exothermic peak. In practice (combustion of solid fuels), the perfect DSC curve does not exist. It is caused by overlapping decomposition and oxidation reactions that occur at different temperature treatment ranges. In the case of the tested fuels, all observed DSC peaks were exothermic type. The first peak presented the combustion of volatile hydrocarbon compounds, while the final peak presented the combustion of fixed carbon. The TG results depicted the sample mass loss, which was significantly lower for coal than for biomass samples without additive (DM0 96.8% > BZ0 95.7 > DS0 92.6% > WS 87.3%). The similar observation was presented for biomass samples with halloysite (DM4 97.1% > BZ4 95.5% > DS4 90.6%). A distinctive result was observed for the comparison of the TG curves for DM samples without and with halloysite (DM0 and DM4). The addition of halloysite increased the inorganic content in the sample, which was reflected as higher ash content presented in the ultimate analysis. The obtained TG results for DM analysis presented an opposite phenomenon (an increase of the burnout residue by 0.31%). Increasing the heating rate (5, 10, 15, and 20 °C/min) strongly influenced the reactivity of all samples under the oxidative atmosphere. This caused the process to move towards higher temperature, and maximal mass rates were decreased. It can be explained by the creation of a volatile cloud that prevented oxygen absorption toward the material (biomass) and reduced the carbon balance sheet. Similar results were observed in studies by S. Dorge et al., which were described in the article, “Thermal degradation of Miscanthus pellets: kinetics and aerosols characterization” [38]. For lower heating rates (5, 10, 15 °C/min), the residue after combustion with halloysite had a higher mass than without the addition. The same tendency (higher combustion residue for samples with additive) was for the rest biomass samples (BZ and DS) at all heating rates (5, 10, 15, 20 °C/min). Additionally, the ignition temperature could be identified from the TG curves. Ti followed the same trend as the maximum peak temperatures, presenting higher values for coal (373.2 °C) than for biomass without additive (234.6–251.1 °C) and for biomass with halloysite (251.9–267.0 °C).
DTG and DSC curves obtained at different heating rates (5, 10, 15, 20 °C/min) for the selected fuels (WS, DS0, and DS4) are presented in Figure 5 and Figure 6. These profiles were in agreement with those found by Murredu et al. [16] during the combustion of coal and biomass samples under atmospheric air, which were obtained at different heating rates. The maximum value of the DTG curves increased with the increase of the sample heating rate, which influenced the higher value of the peak temperatures. Additionally, the percent rate of mass loss rose, and the heat transfer to the sample was uniform in experiments with a lower heating rate. In the case of coal, the DTGmax parameter was in the range of 2.8–4.5 wt%/min, whereas for biomass with and without halloysite, it was in the range of 2.8–12.7 wt%/min. As shown in Table 3, the maximum peak temperatures (Tp) of the coal sample were in the range of 443.6–535.2 °C, which was significantly higher than for biomass samples without additive (275.5–327.6 °C). This indicated that the maximum reaction rate of biomass samples occurred at lower temperatures compared to coal samples. The addition of halloysite slightly increased the above-mentioned parameters (by 1.6–4.1 °C). The ignition temperatures followed the same trend as the maximum peak temperatures, resulting in higher values for coal tests (range 354.2–373.2 °C) and indicating the lower reactivity compared to biomass. This may have been caused by a higher content of inorganic matter in the fuel (described as ash in Table 2), which possibly had an influence on heat transfer in the test chamber. The influence of ash content on the Ti could be observed by comparing the DM0 and the DM4 results, where the ignition temperature increased (by 2.4–7.0 °C) while the ash content increased (by 4 wt%) with the addition of halloysite. Compared to coal, biomass fuels had a lower content of carbon and a higher content of oxygen (Table 2), which resulted in different bonding energies and caused the earlier sample ignition. The burnout temperatures were dependent on the ignition temperatures, as the burnout process was initiated by the ignition process. Lower burnout temperatures (453.8–641.8 °C) for all tested biomass samples were the outcome of a reduced presence of burnout compounds compared to coal tests (528.4–822.1 °C). The consequence of varied burnout temperatures was the difficulty of burning samples, which caused a longer combustion time and a higher burnout temperature to complete the thermal conversion process.
The main combustion parameters such as Di, Df, S, and Hf are shown in Table 3. The ignition index (Di) value increased with the decrease of ignition temperature, suggesting that the amount of separated volatile compounds from the fuel was faster and the process was easier and more stable. Comparing all tested fuels, the highest value of Di was for biomass BZ0. For the biomass fuels, it was observed that the halloysite addition decreased the stability of the decomposition process (for example, at β = 20 °C/min for BZ0 Di = 5.1 × 10⁻⁴ wt%/min and for BZ4 Di = 5.0 × 10⁻⁴ wt%/min). The burnout index (Df) was dependent on the burnout temperature. The lower the Df value was, the more time and the higher treatment temperature were needed to complete the burnout at the same heating rate. Halloysite addition caused the Df decrease. The combustion index S had the same trend as Di, which corresponded to higher combustion activity with the rise of the value of the S index. S increased with the rise of maximum mass loss (DTGmax). The addition of halloysite caused a decrease of S, which corresponded to the decreased combustion activity (less than 7.0 × 10⁻⁸ wt%/(min−2·°C−3)). The S index was directly related to the peak temperature, which significantly influenced its value. Comparing all tested fuels, lower values of Hf were observed for fuels without additive, and the coal samples had a combustion index Hf almost twice as high as the biomass samples. Finally, the trend of Di and Df indices was in accordance with the S index, presenting higher values for biomass samples, thus confirming their better combustion properties. Additionally, as shown in Table 2 and Table 3, for high ash fuel, combustion properties worsened.
Murredu et al. [16] calculated the combustibility indices including the ignition index (Di), the burnout index (Df), and combustion indices S and Hf. The research was conducted for coal and biomass samples under atmospheric air and pure oxygen atmosphere. When the investigated samples were compared, the obtained Di, Df, and S indices for biomass had a value by an order of magnitude higher than for coal. Authors in article [16] observed that biomass samples were characterized by a better ignition performance than coal samples, which was verified with the combustion index Di. Di for coal samples under the air atmosphere was in the range of 8.5–7.0 × 10⁻³ wt%/(min3) and for biomass samples was in the range of 36.1–40.0 × 10⁻³ wt%/(min3). A similar observation was proven for Df index in the experiments conducted in air atmosphere treatment, where significantly smaller Df values were determined for coal samples Df < 2 × 10⁻⁵ wt%/(min−4) compared to biomass samples 43.4–53.5 × 10⁻⁵ wt%/(min−4)). S index was less than 9.7 × 10⁻⁸ wt%/((min−2·°C−3)) for coal samples and was in the range of 73.7–84.9 × 10⁻⁸ wt%/((min−2·°C−3)) for biomass samples (under air atmosphere treatment). An opposite to Di, Df and S indices observation was for Hf index (Hf value was lower for biomass than for coal samples). In the case of combustion, for all samples, the determined Hf value was lower than 2.4 × 10³ °C (coal samples: 2.0–2.4 × 10³ °C, biomass samples: 0.3 × 10³ °C). This confirmed the correctness of the results obtained by the authors of this article (Table 3) by showing a similar order of magnitude of the value and the same tendency for raw biomass samples.

3.2. Kinetic Analysis

Kinetic analysis was performed by using Kissinger and Ozawa methods. Activation energy calculations for both methods at the third peak (the highest peak) are presented in Figure 7 and Figure 8. Table 4 shows values for Kissinger and Ozawa methods obtained for three stages of sample combustion: I—evaporation, II—oxidation mass gain, III—thermal decomposition and burning (stages according to Figure 1 and main DTG peaks). Temperature ranges for these stages (boundary conditions) are presented in Table 4.
It was observed that the correlation coefficient R2 of the function was high (0.94 < R2 < 0.99) for both methods. It was concluded that all the results were well fitted, and both methods provided reliable values of activation energy. According to Kissinger and Ozawa models, values of ln(β/Tp) and ln(β) versus 1/Tp obtained at different heating rates were correlated linearly to determine the activation energy. The activation energy was defined as the minimum amount of energy that the reaction compounds needed to hold in order to initiate the reaction. The smaller the activation energy was, the earlier was the initiation of the reaction. It was assumed that, a normal temperature, reactions with activation energy of < 50 kJ/mol occurred instantaneously. As shown in Table 4, activation energy values calculated in line with the considered methods were in good accordance. It ws observed that biomass and coal samples presented totally different thermal behaviors. The coal sample had much lower Ea (52.2 kJ/mol) compared to biomass samples (130.9–208.1 kJ/mol). The higher activation energies for biomass samples were the reason for the energy demand to begin hemicellulose and cellulose degradation in II stage—see Table 4.
The experimental DTG profiles depicted four main peaks for biomass and three peaks for coal treatment. A similar trend for biomass samples was noted in the article [39] showing similar DTG profiles (four stages for biomass, for example, miscanthus: 0–180 °C, 180–340 °C, 340–410 °C, 410–450 °C). The first peak depicted the moisture evaporation, which was in the temperature range between 0 °C and 110 °C for all samples. The activation energy for biomass (68.3–229.3 kJ/mol) in this stage was much lower than for coal (1384.3–1449.9 kJ/mol). It confirmed that much less energy was needed for biomass to get the first reaction started. For biomass samples, the highest Ea was observed for DM0. It was explained as a result of its hard structure that also showed up during the grinding process. The addition of halloysite reduced Ea by almost a half. The second peak was observed during the oxidation process and presented the mass gain. It was in the temperature range between 110 °C and 240 °C for the coal sample, between 110 °C and less than 195 °C for DS and DM, and between 110 °C and 180 °C for BZ. Comparing the first and the second peaks, the coal sample showed about 40 times less Ea for the second peak. Additionally, despite DS4 (increase near to 60 kJ/mol) and BZ4 (increase near to 19 kJ/mol), all biomass samples needed almost half as much activation energy to react in this stage (comparing first and second peaks). The halloysite additive caused an increase of Ea in the case of DS and BZ. For the DM sample, the halloysite resulted in more than double Ea reduction. The third and the fourth peaks showed how the fuels behaved during thermal decomposition and burnout. In the case of biomass, it was clearly noticed that two peaks occurred as separated and, for the coal sample, these peaks overlapped, resulting in one extended profile. The third peak for the coal sample was in the temperature range between 240 °C and 850 °C. In this range, the activation energy for coal was equal to 52.2 kJ/mol for the Kissinger method and 67.6 kJ/mol for the Ozawa method. In the case of biomass, the third peak depicted mainly the burning of volatiles. Ea for this stage was in the range of 130.9–208.1 kJ/mol for the Kissinger method and 147.7–197.3 for the Ozawa method. Comparing biomass with and without halloysite at the third peak (Table 4), a clear trend of activation energy Ea for different fuels could not be determined. For the BZ sample, activation energy calculated for the Kissinger method increased by 77.2 kJ/mol (for BZ0 Ea = 130.9 kJ/mol, for BZ4 Ea = 208.1 kJ/mol. The same trend was observed for the DM sample (increased by 37.6 kJ/mol when comparing biomass with and without halloysite for the Kissinger method). On the other hand, the DS sample shows=ed a decrease in activation energy in the case of halloysite addition (decreased by 13.8 kJ/mol). The same trend for BZ and DM samples was the result of the similarity of the fuel composition (Table 2). The DS sample differed significantly from the other biomass samples. It had almost twice as much ash content and 10% less volatiles. Fuels with halloysite had a similar composition trend. The fourth peak for biomass samples was in the temperature range of 360–570 °C for DS, 370–600 °C for BZ, and 360–600 °C for DM. Obtained Ea were in agreement with those found by Murredu et al. [16] showing values in the range of 17.5–155.0 kJ/mol for the second peak and 16.2–237.0 kJ/mol for the third peak in the case of the biomass sample and 21.0 kJ/mol for the second peak of coal. The final peak (fourth) was responsible for the combustion of the biomass char and fixed carbon and minerals decomposition. For all biomass samples, the activation energy at this stage was below 73.1 kJ/mol. In the case of the Kissinger method, the addition of halloysite increased the Ea value by 42% for DS, 23% for BZ, and 15% for DM. For the Ozawa method, the activation energy for biomass had the same trend (increase for halloysite additive: 33% for DS, 16% for BZ, and 11% for DM).
In the research [34,35], the authors presented the method of adding halloysite pre-mixed with the biomass feedstock (4.0 wt%). Due to the fact that halloysite was ground and mixed with the fuel, thermogravimetric tests were conducted to prove that the selected share (4.0 wt%) of halloysite prevented the boiler from corrosion and sagging issues and did not deteriorate the kinetic parameters of the fuel. The research presented in the manuscript confirmed that feeding the halloysite pre-mixed with the biomass feedstock did not require technological changes in the boiler firing system.
To obtain a more accurate confirmation of the obtained results, additional calculations should be made for other methods for calculating kinetic parameters. An example of such a method is the differential iso-conversional method [40], which can be used as one of the most accurate methods of calculating kinetic parameters for biomass. The authors consider repeating the above calculations using the differential iso-conversional method in the future research.
Additionally, thermogravimetric analysis should be employed at a relatively low heating rate (<20 °C/min) because the actual temperature of the fuel sample may vary from the measured temperature of the fuel sample at higher heating rates (>20 °C /min) [1,2,3,4,5]. However, to show the most accurate kinetic results, tests should be conducted for several (four to five) relatively low heating rates (<8) and with a ratio of lowest to highest heating rate greater than 10 [41,42]. Such a research procedure will not lead to unexpected ignition and uncontrolled combustion of the sample.

4. Conclusions

In this article, three samples of biomass with and without halloysite additive and one coal were selected for kinetic experiments. Based on the obtained results, particular conclusions can be made:
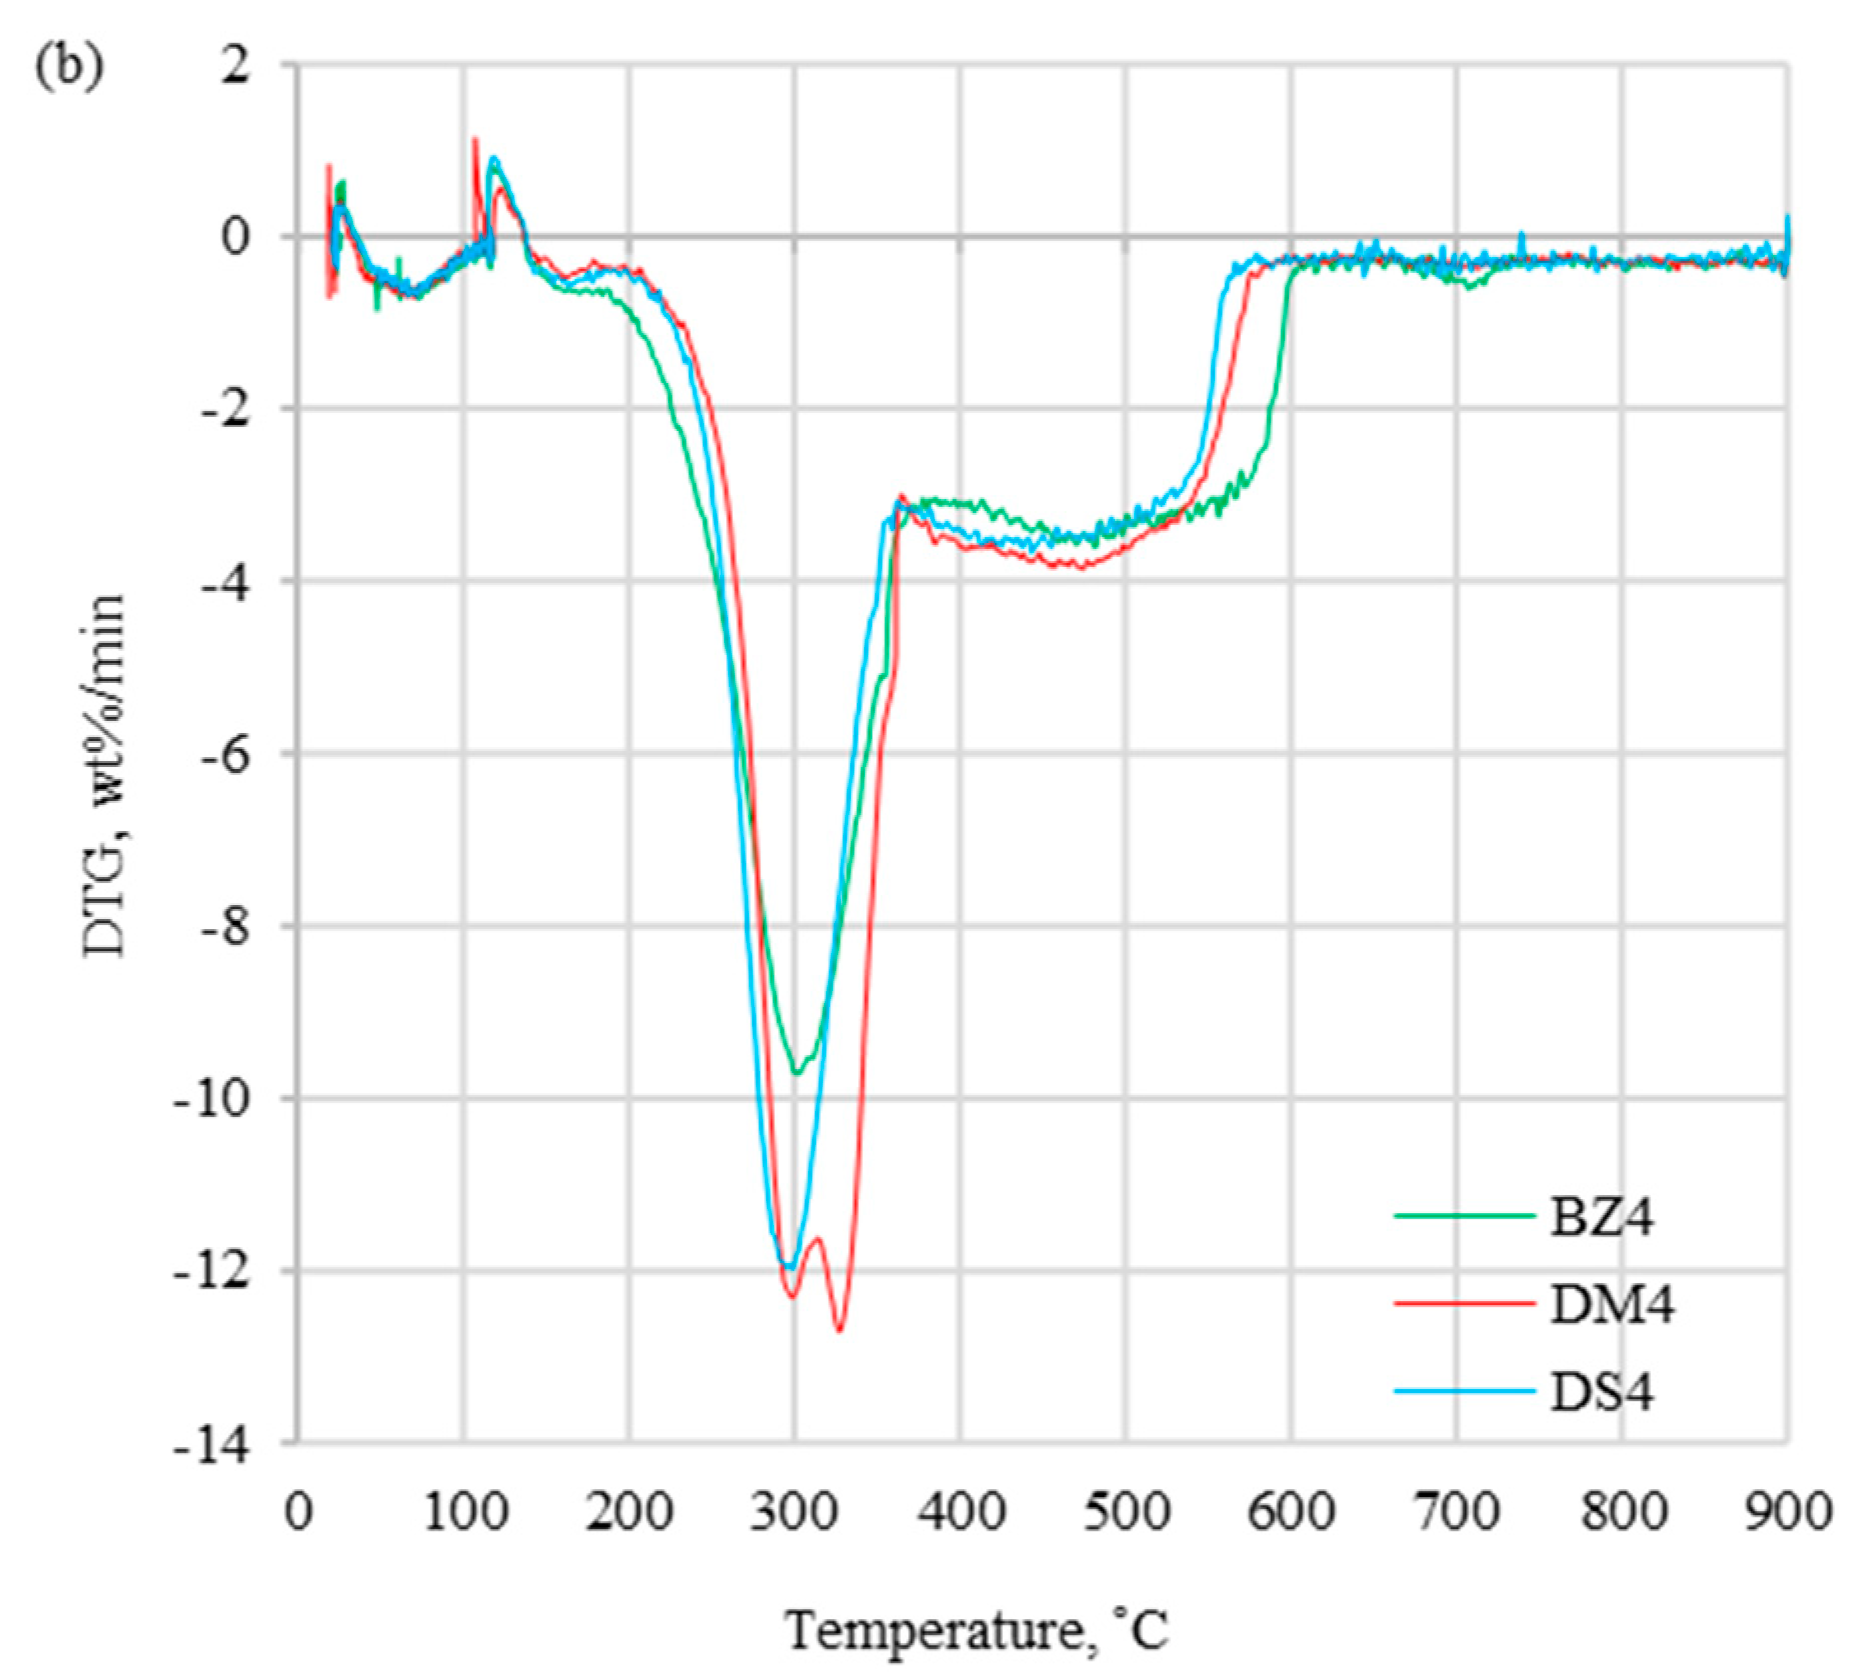
  • The DTG profiles obtained at 20 °C/min showed differences between coal and biomass, which were caused by a high content of cellulose, hemicellulose, and lignin in biomass samples. Additionally, coal treatment resulted in a smaller peak compared to biomass, which was a consequence of devolatilization, which progressed more slowly. The TG results informed about the general weight loss, which was significantly lower for coal than for biomass samples without additive (DM0 > BZ0 > DS0 > WS). A similar trend was observed for biomass samples with halloysite (DM4 > BZ4 > DS4).
  • The maximum value of the DTG curve increased with the increase of heating rates, which caused a higher value of the peak temperature. Additionally, the rate of weight loss rose, and the heat transfer test chamber was observed to be not as uniform as in tests with the lower heating rates (<20 °C/min).
  • For tested fuels, the ignition temperatures followed the same trend as the maximum peak temperatures, presenting the higher values for coal, which indicated lower reactivity compared to biomass. Additionally, higher values of burnout temperatures for coal resulted from the difficulty of burning of the samples, which caused a longer combustion time and a higher burnout temperature to complete the conversion process. The addition of halloysite slightly increased the main combustion temperatures (Ti, Tp, and Tf).
  • The trend of Di and Df indices was in accordance with the S index, presenting higher values for biomass samples, thus confirming their better combustion properties. Additionally, for fuels with more ash content, combustion properties worsened.
  • In the kinetic analysis, activation energy values calculated within the considered methods of Ozawa and Kissinger were in good accordance (0.90 < R2 < 0.98). It was possible to observe different thermal behaviors between biomass and coal samples. The experimental DTG profiles presented four main peaks for biomass and three peaks for coal. The activation energy, which corresponded to the moisture evaporation, was more than six times higher for coal than for biomass. The case of the maximum peak, which corresponded mainly to the burning of volatiles, was much lower for the coal sample than in the case of biomass samples (Kissinger: for biomass Ea = 130.9–208.1 kJ/mol and coal Ea = 52.2 kJ/mol, Ozawa: for biomass Ea = 147.7–228.4 kJ/mol and coal Ea = 67.6 kJ/mol). The higher activation energies for biomass samples were the reason of energy demand of hemicellulose and cellulose degradation initiation.
  • Due to the composition of fuels, the clear trend of activation energy Ea in all combustion stages for different fuels with and without halloysite could not be determined (Table 4).

Author Contributions

Conceptualization, J.W. and S.C.; methodology, J.W. and S.C.; formal analysis, J.W., S.C. and S.K.; investigation, J.W.; writing—original draft preparation, J.W. and S.C.; supervision, S.K.; writing—review and editing, J.W. and S.C. All authors have read and agreed to the published version of the manuscript.

Funding

The research presented in this work was performed within a project on “Process optimisation and valorisation of combustion by-products in the transition to a circular economy” (UPS-Plus) funded by The Foundation for Polish Science within the Team Teach Core Facility Programme (project ID: TEAM TECH CORE FACILITY/2017-3/3). Additionally, this research was co-funded by the Silesian University of Technology Statutory Research Fund.

Institutional Review Board Statement

Not applicable.

Informed Consent Statement

Not applicable.

Data Availability Statement

Data sharing is not applicable to this article.

Conflicts of Interest

The authors declare no conflict of interest.

References

  1. Skreiberg, A.; Skreiberg, Ø.; Sandquist, J.; Sørum, L. TGA and macro-TGA characterisation of biomass fuels and fuel mixtures. Fuel 2011, 90, 2182–2197. [Google Scholar] [CrossRef]
  2. Várhegyi, G.; Sebestyén, Z.; Czégény, Z.; Lezsovits, F.; Könczöl, S. Combustion kinetics of biomass materials in the kinetic regime. Energy Fuels 2012, 26, 1323–1335. [Google Scholar] [CrossRef] [Green Version]
  3. Slopiecka, K.; Bartocci, P.; Fantozzi, F. Thermogravimetric analysis and Kinetic study of poplar wood pyrolysis. In Proceedings of the Third International Conference on Applied Energy, Perugia, Italy, 16–18 May2011. [Google Scholar]
  4. Sait, H.H.; Hussain, A.; Ani, F.N. Pyrolysis and combustion kinetics of date palm biomass using thermogravimetric analysis. Bioresour. Technol. 2012, 118, 382–389. [Google Scholar] [CrossRef] [PubMed]
  5. López-González, D.; Fernandez-Lopez, M.; Valverde, J.L.; Sanchez-Silva, L. Thermogravimetric-mass spectrometric analysis on combustion of lignocellulosic biomass. Bioresour. Technol. 2013, 143, 562–574. [Google Scholar] [CrossRef] [PubMed]
  6. Niu, S.; Chen, M.; Li, Y.; Xue, F. Evaluation on the oxy-fuel combustion behavior of dried sewage sludge. Fuel 2016, 178, 129–138. [Google Scholar] [CrossRef]
  7. Lin, Y.; Ma, X.; Ning, X.; Yu, Z. TGA–FTIR analysis of co-combustion characteristics of paper sludge and oil-palm solid wastes. Energy Convers. Manag. 2015, 89, 727–734. [Google Scholar] [CrossRef]
  8. Magdziarz, A.; Werle, S. Analysis of the combustion and pyrolysis of dried sewage sludge by TGA and MS. Waste Manag. 2014, 34, 174–179. [Google Scholar] [CrossRef]
  9. Huang, C.W.; Li, Y.H.; Xiao, K.L.; Lasek, J. Cofiring characteristics of coal blended with torrefied Miscanthus biochar optimized with three Taguchi indexes. Energy 2019, 172, 566–579. [Google Scholar] [CrossRef]
  10. Gözde, G.; Korkut, A. Pyrolysis characteristics and kinetics of sour cherry stalk and flesh via thermogravimetric analysis using isoconversional methods. J. Therm. Anal. Calorim. 2020, 1–18. [Google Scholar] [CrossRef]
  11. Santos, V.O.; Queiroz, L.S.; Araujo, R.O.; Ribeiro, F.C.; Guimarães, M.N.; da Costa, C.E.; Chaar, J.S.; de Souza, L.K. Pyrolysis of acai seed biomass: Kinetics and thermodynamic parameters using thermogravimetric analysis. Bioresour. Technol. Rep. 2020, 12, 100553. [Google Scholar] [CrossRef]
  12. Laougé, Z.B.; Merdun, H. Pyrolysis and combustion kinetics of Sida cordifolia L. using thermogravimetric analysis. Bioresour. Technol. 2020, 299, 122602. [Google Scholar] [CrossRef] [PubMed]
  13. Bermejo, S.P.; Prado-Guerra, A.; Pérez, A.I.G.; Prieto, L.F.C. Study of quinoa plant residues as a way to produce energy through thermogravimetric analysis and indexes estimation. Renew. Energy 2020, 146, 2224–2233. [Google Scholar] [CrossRef]
  14. Shao, Z.; Ma, Y.; Wang, B.; He, L.; Zhang, Z.; Yue, C. Study of pyrolysis and combustion kinetics of oil sludge. Energy Sources Part A Recovery Util. Environ. Eff. 2021, 1–15. [Google Scholar] [CrossRef]
  15. Wang, G.; Zhang, J.; Shao, J.; Liu, Z.; Zhang, G.; Xu, T.; Lin, H. Thermal behavior and kinetic analysis of co-combustion of waste biomass/low rank coal blends. Energy Convers. Manag. 2016, 124, 414–426. [Google Scholar] [CrossRef]
  16. Mureddu, M.; Dessì, F.; Orsini, A.; Ferrara, F.; Pettinau, A. Air-and oxygen-blown characterization of coal and biomass by thermogravimetric analysis. Fuel 2018, 212, 626–637. [Google Scholar] [CrossRef]
  17. Zhou, C.; Liu, G.; Wang, X.; Qi, C. Co-combustion of bituminous coal and biomass fuel blends: Thermochemical characterization, potential utilization and environmental advantage. Bioresour. Technol. 2016, 218, 418–427. [Google Scholar] [CrossRef]
  18. Magdziarz, A.; Wilk, M. Thermogravimetric study of biomass, sewage sludge and coal combustion. Energy Convers. Manag. 2013, 75, 425–430. [Google Scholar] [CrossRef]
  19. Varol, M.; Atimtay, A.T.; Bay, B.; Olgun, H. Investigation of co-combustion characteristics of low quality lignite coals and biomass with thermogravimetric analysis. Thermochim. Acta 2010, 510, 195–201. [Google Scholar] [CrossRef]
  20. Kok, M.V. Temperature-controlled combustion and kinetics of different rank coal samples. J. Therm. Anal. Calorim. 2005, 79, 175–180. [Google Scholar] [CrossRef]
  21. Ma, B.; Li, X.; Xu, L.; Wang, K.; Wang, X. Investigation on catalyzed combustion of high ash coal by thermogravimetric analysis. Thermochim. Acta 2006, 445, 19–22. [Google Scholar] [CrossRef]
  22. Yang, Z.; Zhang, S.; Liu, L.; Li, X.; Chen, H.; Yang, H.; Wang, X. Combustion behaviours of tobacco stem in a thermogravimetric analyzer and a pilot-scale fluidized bed reactor. Bioresour. Technol. 2012, 110, 595–602. [Google Scholar] [CrossRef]
  23. Yan, Y.F.; Zhang, Z.E.; Zhang, L.; Zhang, L. Influence of coal properties on the co-combustion characteristics of low-grade coal and city mud. Glob. NEST J. 2014, 16, 330–339. [Google Scholar]
  24. Wang, C.; Zhang, X.; Liu, Y.; Che, D. Pyrolysis and combustion characteristics of coals in oxyfuel combustion. Appl. Energy 2012, 97, 264–273. [Google Scholar] [CrossRef]
  25. Wang, Y.; Hu, J.; Ran, J.; Zhang, L.; Pu, G.; Tang, Q. Experimental study on combustion and kinetic characteristics of mixed industrial sludge. Proc. CSEE 2007, 27, 44–50. [Google Scholar]
  26. Zhang, Y.; Guo, Y.; Cheng, F.; Yan, K.; Cao, Y. Investigation of combustion characteristics and kinetics of coal gangue with different feedstock properties by thermogravimetric analysis. Thermochim. Acta 2015, 614, 137–148. [Google Scholar]
  27. Gao, Z.; Fang, L.; Zhou, J.; Yan, W. Research on the combustion performance of blended coal in thermal-balance. Power Eng. 2002, 22, 1764–1768. [Google Scholar]
  28. Niu, S.; Lu, C.; Han, K.; Zhao, J. Thermogravimetric analysis of combustion. characteristics and kinetic parameters of pulverized coals in oxy-fuel atmosphere. J. Therm. Anal. Calorim. 2009, 98, 267–274. [Google Scholar] [CrossRef]
  29. Kongkaew, N.; Pruksakit, W.; Patumsawad, S. Thermogravimetric kinetic analysis of the pyrolysis of rice straw. Energy Procedia 2015, 79, 663–670. [Google Scholar] [CrossRef] [Green Version]
  30. Álvarez, A.; Pizarro, C.; García, R.; Bueno, J.L.; Lavín, A.G. Determination of kinetic parameters for biomass combustion. Bioresour. Technol. 2016, 216, 36–43. [Google Scholar] [CrossRef]
  31. Dhaundiyal, A.; Singh, S.B.; Hanon, M.M.; Rawat, R. Determination of kinetic parameters for the thermal decomposition of Parthenium hysterophorus. Environ. Clim. Technol. 2018, 22, 5–21. [Google Scholar] [CrossRef] [Green Version]
  32. Ozawa, T. New Method of Analyzing Thermogravimetric Data. Bull. Chem. Soc. Jpn. 1965, 38, 1881–1886. [Google Scholar] [CrossRef] [Green Version]
  33. Koga, N. Ozawa’s kinetic method for analyzing thermoanalytical curves. J. Therm. Anal. Calorim. 2013, 113, 1527–1541. [Google Scholar] [CrossRef]
  34. Kalisz, S.; Ciukaj, S.; Mroczek, K.; Kress, T.; Tymoszuk, M.; Wejkowski, R.; Pronobis, M.; Kubiczek, H. Impact of halloysite fuel additive on 650 t/h PC boiler co-firing biomass. Part I—Deposition characteristics. In Proceedings of the 12th International Conference on Boiler Technology, Szczyrk, Poland, 21–24 October 2014. [Google Scholar]
  35. Sobieraj, J.; Gądek, W.; Wnorowska, J.; Tymoszuk, M.; Kalisz, S. Improvement of the properties of combustion by-products from grate boilers. In Proceedings of the XV Konferencja Naukowo—Techniczna ’2019 MODERNIZACJA KOTŁÓW RUSZTOWYCH “Dostosowanie kotłów rusztowych do standardów emisyjnych LCP oraz MCP”, Szczyrk, Poland, 23–25 October 2019. [Google Scholar]
  36. Gądek, W.; Sobieraj, J.; Kalisz, S. Investigations of optimal additive dose for Cl-rich biomasses. In Proceedings of the The book of Abstracts of XXIV International Symposium on Combustion Processes, Wrocław, Poland, 23–25 September 2019; Pawlak-Kruczek, H., Hardy, T., Niedźwiecki, Ł., Eds.; pp. 51–52. [Google Scholar]
  37. Kopczyński, M.; Plis, A.; Zuwała, J. Thermogravimetric and kinetic analysis of raw and torrefied biomass combustion. Chem. Process Eng. 2015, 36, 209–223. [Google Scholar] [CrossRef] [Green Version]
  38. Dorge, S.; Jeguirim, M.; Trouvé, G. Thermal degradation of Miscanthus pellets: Kinetics and aerosols characterization. Waste Biomass Valorization 2011, 2, 149–155. [Google Scholar] [CrossRef]
  39. Jeguirim, M.; Dorge, S.; Trouvé, G. Thermogravimetric analysis and emission characteristics of two energy crops in air atmosphere: Arundo donax and Miscanthus giganthus. Bioresour. Technol. 2010, 101, 788–793. [Google Scholar] [CrossRef] [PubMed]
  40. Osman, A.I.; Young, T.J.; Farrell, C.; Harrison, J.; Al-Muhtaseb, A.A.H.; Rooney, D.W. Physicochemical Characterization and Kinetic Modeling Concerning Combustion of Waste Berry Pomace. ACS Sustain. Chem. Eng. 2020, 8, 17573–17586. [Google Scholar] [CrossRef]
  41. Osman, A.I.; Farrell, C.; Al-Muhtaseb, A.H.; Al-Fatesh, A.S.; Harrison, J.; Rooney, D.W. Pyrolysis kinetic modelling of abundant plastic waste (PET) and in-situ emission monitoring. Environ. Sci. Eur. 2020, 32, 1–12. [Google Scholar] [CrossRef]
  42. Vyazovkin, S.; Chrissafis, K.; Di Lorenzo, M.L.; Koga, N.; Pijolat, M.; Roduit, B.; Sbirrazzuoli, N.; Suñol, J.J. ICTAC Kinetics Committee recommendations for collecting experimental thermal analysis data for kinetic computations. Thermochim. Acta 2012, 590, 1–23. [Google Scholar] [CrossRef]
Figure 1. Schematic of TG and DTG curves (Ti—ignition temperature, Tp—maximum peak temperature, Tf—burnout temperature, I—evaporation, II—oxidation mass gain, III—thermal decomposition and burning, IV—burnout).
Energies 14 02257 g001
Figure 2. DTG curves for (a) fuels without halloysite and (b) fuels with halloysite at β = 20 °C/min.
Energies 14 02257 g002aEnergies 14 02257 g002b
Figure 3. DSC curves for (a) fuels without halloysite and (b) fuels with halloysite at β = 20 °C/min.
Energies 14 02257 g003
Figure 4. TG curves for (a) fuels without halloysite and (b) fuels with halloysite at β = 20 °C/min.
Energies 14 02257 g004
Figure 5. DTG curves for (a) WS, (b) DS0, and (c) DS4 at different heating rates.
Energies 14 02257 g005aEnergies 14 02257 g005b
Figure 6. DSC curves for (a) WS, (b) DS0, and (c) DS4 at different heating rates.
Energies 14 02257 g006aEnergies 14 02257 g006b
Figure 7. Activation energy calculation by Kissinger method for (a) fuels without halloysite and (b) fuels with halloysite.
Energies 14 02257 g007
Figure 8. Activation energy calculation by Ozawa method for (a) fuels without halloysite and (b) fuels with halloysite at third peak.
Energies 14 02257 g008
Table 1. Review of several previous studies on combustion characterization by thermogravimetric analysis (TGA) method.
FuelMax. Temp.
(°C)
Heating Rate
(°C/min)
AtmosphereReference
Sludge600
800
5; 10; 15; 20; 30Ar; airShao at al. 2021 [14]
Sour cherry stalk and flesh10005; 10; 20; 30; 40N2Gözde at al. 2020 [10]
Acai seed9005; 10; 15; 20N2Santos at al. 2020 [11]
Biomass (Sida)95010; 20; 30; 40; 50N2; airLaougé at al. 2020 [12]
Quinoa plant72710; 20; 40air; N2Bermejo at al. 2020 [13]
Australian coal and miscanthus100020N2; atmospheric airHuang at al. 2019 [9]
Bituminous coal, high sulphur sub-bituminous coal, high sulphur brown coal, stone pine wood chips, and eucalyptus100010; 20; 30; 40; 50atmospheric air; pure oxygen;Mureddu at al. 2018 [16]
Sewage sludge100020; 40; 60; 80atmospheric air;
21% O2/79% CO2;
30% O2/70% CO2;
40% O2/60% CO2
Niu et al. 2016 [6]
Chinese bituminous coal, corn, and sawdust100015; 60atmospheric airZhou et al. 2016 [17]
Waste biomass and coal6272.5; 5; 10; 20atmospheric airWang et al. 2016 [15]
Paper sludge and oil palm waste10002021%O2/79%; N2Lin et al. 2015 [7]
Polish coal and sewage sludge8001020% O2/80% N2Magdziarz et al. 2014 [8]
Polish coal, wood, oat, sewage sludge, and mixtures fuels100010; 40; 100atmospheric airMagdziarz et al. 2013 [18]
Wood demolition wood, coffee waste, glossy paper, and their mixtures9005; 20; 100Ar;
21% O2/79 % Ar
Skreiberg et al. 2011 [1]
Lignite coals and wood chips (oak), olive cake, and hazelnut shells110020atmospheric air Varol et al. 2010 [19]
Table 2. Results of analysis of investigated fuels.
Fuel Parameters in As-Received State
Parameter/SampleBZ0BZ4 *DM0DM4 *DS0DS4 *WS
LCV (MJ/kg)16.5215.7616.5215.8814.3713.6423.77
Moisture (wt%)9.209.3010.2010.3011.7011.803.90
Ash (wt%)3.837.833.867.869.1313.1313.8
Volatiles (wt%)68.1164.9869.2165.9961.1258.0334.37
Fixed Carbon (wt%)18.8617.8916.7315.8518.0517.0447.93
C (wt%)43.3441.3543.3441.6738.9837.0161.69
H (wt%)5.385.135.385.174.854.604.65
S (wt%)0.090.090.090.090.110.111.46
N (wt%)2.682.562.682.580.760.720.98
Cl (wt%)0.080.070.080.070.380.360.34
Na (wt%)0.030.030.020.020.070.070.34
K (wt%)0.910.900.490.471.261.210.31
O (wt%)34.4733.7633.8731.8732.7631.0912.53
* Theoretical (calculated) fuel state is presented.
Table 3. Main combustion parameters.
FuelβTitiTptpTftfDTGmaxDi·104Df·105S·108Hf·10−3
° C m i n °CMin°CMin°CMin w t % m i n w t % m i n 3 w t % m i n 4 w t % m i n 2 · ° C 3 °C
BZ05234.662.1276.370.4475.0110.24.31.10.87.81.4
10241.750.8291.956.0540.280.75.72.82.414.31.2
15247.447.0293.850.1604.670.87.84.14.620.51.1
20250.845.0301.247.5626.463.810.05.17.327.61.1
BZ45235.462.2286.572.5503.0115.82.81.00.54.81.4
10243.751.0296.056.3541.581.75.72.52.412.91.3
15248.147.0297.650.3609.671.27.64.14.419.41.2
20251.945.0303.247.6641.864.59.75.07.025.71.1
DM05251.165.4300.975.3466.2108.44.00.90.76.31.5
10256.452.3313.258.0504.477.17.42.63.217.51.3
15263.148.0322.152.0570.368.511.13.96.427.51.3
20264.645.7327.648.9582.061.612.75.19.235.51.2
DM45255.466.2308.576.5489.3113.03.80.90.75.31.5
10263.453.0314.558.1509.477.66.72.42.814.31.3
15264.848.2322.452.0573.768.89.93.95.723.91.3
20267.045.7329.449.0590.262.012.35.08.833.01.2
DS05241.763.5275.570.3453.8106.03.91.00.86.81.4
10249.251.6283.155.0481.374.87.22.63.317.71.2
15254.447.5290.149.8504.864.29.83.86.427.01.2
20257.445.3295.747.2541.759.512.34.99.636.11.1
DS45242.663.7277.870.7459.7107.13.71.00.86.11.4
10250.751.7284.755.1489.175.67.22.53.316.91.2
15255.247.5294.250.1510.064.59.83.86.326.51.2
20258.545.4299.147.4543.459.612.04.29.329.71.2
WS5354.269.3443.681.2528.4120.92.80.80.31.82.4
10360.462.7472.572.9587.385.53.71.50.93.42.1
15367.055.0519.265.1679.874.54.42.71.64.62.1
20373.250.6535.259.2822.173.64.53.52.04.12.1
Table 4. Activation energy (Ea) and correlation coefficient (R2) for tested fuels (I—evaporation, II—oxidation mass gain, III—thermal decomposition and burning—Figure 1).
Kissinger
IIIIIIFor all stages
1st peak2nd peak3rd peak4th peak
EaR2ΔTEaR2ΔTEaR2ΔTEaR2ΔTEa
kJ/mol-°CkJ/mol-°CkJ/mol-°CkJ/mol-°CkJ/mol
WS1449.90.900–11030.80.90110–24052.20.94240–850---1532.9
DS0147.50.930–11061.90.92110–195159.60.98195–36045.40.91360–570414.4
DS480.10.990–110144.40.98110–195145.80.96195–36064.30.90360–570434.6
BZ096.30.910–11077.30.98110–180130.90.95180–37036.80.90370–600341.3
BZ468.30.950–11087.30.95110–180208.10.96180–37045.00.91370–600408.7
DM0229.30.950–110104.50.97110–195131.20.99195–36030.30.90360–600495.3
DM495.20.970–11043.30.90110–195168.30.94195–36034.80.91360–600341.6
Ozawa
IIIIIIFor all stages
1st peak2nd peak3rd peak4th peak
EaR2ΔTEaR2ΔTEaR2ΔTEaR2ΔTEa
kJ/mol-°CkJ/mol-°CkJ/mol-°CkJ/mol-°CkJ/mol
WS1384.30.900–11035.70.90110–24067.60.96240–850---1487.6
DS0145.80.930–11065.40.94110–195197.30.99195–36055.10.90360–570463.6
DS481.51.000–110143.80.98110–195162.80.98195–36073.10.90360–570461.2
BZ097.10.930–11080.00.98110–180147.70.96180–37047.30.94370–600372.1
BZ470.50.960–11089.50.99110–180228.40.96180–37055.00.94370–600443.4
DM0223.50.950–110105.90.98110–195147.80.99195–36040.50.93360–600517.7
DM495.80.970–11047.60.90110–195186.90.95195–36044.80.95360–600375.1
Publisher’s Note: MDPI stays neutral with regard to jurisdictional claims in published maps and institutional affiliations.

