Abstract
Extraction of hydrogen from hydrocarbons is a logical intermediate-term solution for the escalating worldwide demand for hydrogen. This work explores the possibility of using a single membrane to accomplish both the catalytic dehydrogenation and physical separation of hydrogen gas as a possible way to improve the efficiency of hydrogen production from hydrocarbon sources. The present analysis shows that regions of pressure/temperature space exist for which the overall process is thermodynamically spontaneous (ΔG < 0). Each step in the process is based on known physics. The rate of hydrogen production is likely to be controlled by the barrier to hydrogen abstraction, with the density of H-binding sites also playing a role. A critical materials issue will be the strength of the oxide/metal interface.
1. Introduction
Extraction of hydrogen from hydrocarbons is a logical intermediate-term solution for the escalating worldwide demand for hydrogen. Hydrocarbons are rich in hydrogen and there is a massive existing infrastructure for obtaining hydrocarbons from fossil sources. A current challenge is that existing technology for extracting hydrogen from hydrocarbons and separating it from the byproducts is cumbersome and inefficient.
The present hydrogen market is predominantly supplied by steam reforming [1] of fossil-sourced hydrocarbons, which may be represented by the reaction,
CxHy + x H2O → x CO + (x + y/2) H2.
This reaction is carried out in stoichiometric excess steam (H2O(g)) and, consequently, some water vapor gets mixed with the products. Furthermore, the process is less than 100% efficient and side reactions lead to the production of a small quantity of carbon dioxide (CO2) [2]. The product is therefore a mixture of hydrogen (H2) and carbon monoxide (CO) called syngas but contains CO2 and water vapor (H2O) as well. The quantity of hydrogen produced can be increased by converting the CO product of the steam-reforming to CO2 with the water–gas shift reaction,
but this comes at the cost of consuming CO, which is a viable fuel, and increasing the production of CO2. The H2 is then separated from the product mixture in a separate step. In short, existing technology for hydrogen production is based on an inefficient multi-step process that contributes to greenhouse gas emissions.
CO + H2O → CO2 + H2,
Recently, an alternative strategy for hydrogen extraction and separation has been advanced that avoids some of the major inefficiencies of the steam reforming technology. The novel strategy is to extract the hydrogen from hydrocarbons by heterogeneous catalytic dehydrogenation of the hydrocarbons and then separate the hydrogen gas with a hydrogen-permeable membrane [3]. The overall reaction is,
CxHy → CxHy−2 + H2.
The efficiency of this approach is immediately obvious. There is no production of CO2. In fact, the only byproducts are unsaturated hydrocarbons (CxHy−2), which have commercial value. The extraction and separation are carried out in separate steps. Heterogeneous catalytic dehydrogenation is a widely used industrial process [4,5]. The second step, separation, is performed with a hydrogen-permeable metal membrane [6], placed within the vessel where the dehydrogenation is carried out by catalytic particles. Hydrogen gas produced by catalytic dehydrogenation then migrates to the metal, through which it permeates to a separate vessel. As a practical matter, the metal membrane can take the form of a coiled tube placed within the catalyst chamber. Constructing a membrane as a coiled tube dramatically increases the surface area that can be packed into a small volume and therefore increases the area of the membrane through which hydrogen can permeate, increasing throughput. Placing the interior of the tube under reduced pressure creates a concentration gradient, which drives the hydrogen through the membrane.
Despite the obvious advantages of obtaining hydrogen through catalytic dehydrogenation and membrane separation over the conventional steam reforming reaction, the former approach has not yet been widely adopted. A possible improvement on the strategy would be to accomplish both the catalytic dehydrogenation and physical separation of hydrogen gas with a single, dual-use membrane. The development of dual-use membranes could be assisted by modeling as there is a rich history of kinetic modeling of related processes, such as dehydrogenation of alkanes by chromia/alumina [7], and of hydrogen transport through membranes [8,9,10].
In this paper, we consider the prospects for the proposed modified scheme by examining the thermodynamic and kinetic considerations that govern the catalytic dehydrogenation and hydrogen separation by a dual-use membrane, using data from known systems as modeling input.
Figure 1 shows a schematic of catalytic dehydrogenation and hydrogen separation by a dual-use membrane. In addition to the reactants (R) and products (P), there are five distinct intermediates in the process (I1, I2, I3, I4, I5), which can therefore be described as taking place in six steps.
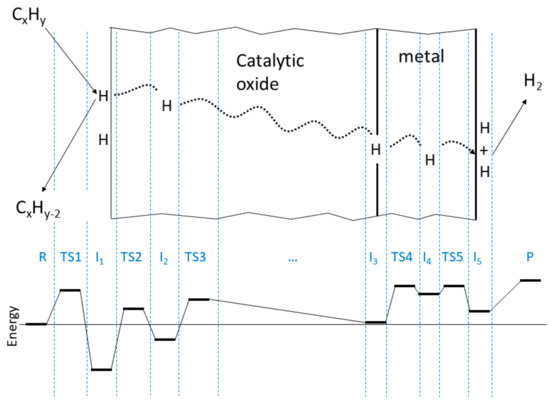
Figure 1.
(Top)—schematic of catalytic dehydrogenation and hydrogen separation by a dual-use membrane. (Bottom)—energy profile along the pathway of hydrogen abstraction and separation.
In step 1, reactant (R) interacts with the catalyst surface, producing one or more adsorbed H atoms (I1) and possibly an unsaturated hydrocarbon byproduct (CxHy−2, denoted U in the balance of this paper.) The energy barrier to this process is ().
In step 2, the adsorbed H atom moves from a surface site to a subsurface site, forming I2. The energy barrier to this process is ().
In step 3, the H in a subsurface site moves through the oxide bulk to the oxide/metal interface and enters an interface site (I3). The process involves traversing one (or likely several) energy barriers ().
In step 4, the H atom at an interface site moves from the interface to an interstitial or vacancy site in the metal bulk, forming I4. The energy barrier to this process is ().
In step 5, H moves from an interstitial or vacancy site within the metal bulk to the metal surface, forming surface-bound H (I5). The process involves traversing one (or likely several) energy barriers ().
In step 6, two surface-bound H atoms on the metal surface coalesce into H2, which desorbs into the gas phase (P). Depending on the metal or alloy used, there may or may not be an energy barrier () to this process.
A representative energy profile for the process, constructed from known systems representative of each step, is shown in the bottom of Figure 1. Energies of the critical points are given in Table 1 and discussed in the next section together with references to their sources.

Table 1.
Energies (in eV) of critical points in the energy profile for the hydrogen extraction and separation process. See text for explanation of parenthetical values.
2. Methods
2.1. Extraction of Energetic Data from the Literature
Dehydrogenation of alkanes is typically an overall endothermic process. Table 2 shows enthalpies for several representative dehydrogenation reactions.
Table 2.
Enthalpies of dehydrogenation for selected hydrocarbons (standard enthalpies except where noted).
Because these reactions are enthalpically unfavorable, manipulation of the temperature and reaction quotient is needed to render the overall process thermo-chemically spontaneous. A representative example is shown in Figure 2. Note that there are regions of pressure and temperature space for which the overall reaction is spontaneous, as revealed by a negative free energy of reaction. Such conditions are required for a practical hydrogen extraction and separation system. The enthalpy change for the overall reaction sets the endpoints of the representative energy profile of the process.

Figure 2.
Free energy of dehydrogenation of cyclohexane (in kcal/mol) as a function of temperature and reaction quotient. Note that there are regions of pressure and temperature space, e.g., high temperature and low H2 partial pressure, for which the overall reaction is spontaneous, as revealed by a negative free energy of reaction.
2.1.1. Step 1
In the first step of the process, a reactant hydrocarbon molecule interacts with the heterogeneous catalyst surface, resulting in the abstraction of one or more H atoms. Such catalysts are typically composed of ultra-dispersed transition metals (TM) on an alumina surface, but cubic aluminas possess catalytic activity for H abstraction in their own right. For alkanes, the calculations of Cai et al. [14] establish that the barrier to this process varies from 26 to 70 kcal/mole, (1.1–3.0 eV) and ΔE for the process may vary from being endothermic to being exothermic by as much as ΔE = −115.6 kcal/mol (−5.0 eV) for ethane and ΔE = −124.6 kcal/mol (−5.4 eV) for propane, depending on the degree of hydrogenation of the alumina and the specific alkane. The lowest activation barrier for ethane (~26 kcal/mole = 1.1 eV), which occurs on hydrogen-free alumina, is taken as a representative barrier for the present study, 1.1 eV. Setting the energy of the reactants as the zero of the energy scale for the overall process places the energy of TS1 at 1.1 eV. (The existence of rigorously hydrogen-free cubic alumina is dubious [15]. Nevertheless, the barrier is lower at low H content of the alumina.) When the I1 state is reached, H is bound to a surface oxygen atom. Rashkeev et al. [16] report that the energy of binding between H and a 3-coordinated surface oxygen (H-O(3)) is between 3.0 and 3.2 eV. The strength of H binding is substantially reduced in the presence of high levels of surface hydrogenation. In addition to 3-coordinated surface oxygens that can serve as H-binding sites, there are also 4-coordinated surface oxygen atoms on the 110C surface of γ-alumina [15]. (110C is the energetically preferred exposure [17].) The energy of H bound to one of the 4-coordinated surface oxygen atoms (H-O(4)) is 1.2 eV. Obviously, these sites remain essentially vacant until surface coverage of H is sufficiently high that the energetically preferred 3-coordinated oxygens are all occupied. At that point, the higher energy sites will begin to be populated and the energy of I1 is dramatically increased, as shown by the parenthetical value thereof in Table 1.
The presence of an ultra-dispersed TM catalyst can address the issues of the energy barrier and H trap in step 1. This is the reason that alumina-supported chromium is one of the most widely employed dehydrogenation catalysts [7,18,19,20,21]. For example, CrO3 clusters on the alumina surface both decrease the activation barrier to H abstraction and raise the energy of I1. Borisevich et al. [22] report the energy of reaction for interaction of ethane with CrO3/alumina to be −1.3 to −1.6 eV. Herein, the energy of I1 is set to the middle of this range, −1.45 eV. This is the lowest energy state along the entire extraction and separation pathway (in the absence of interface defects, vide infra). These energy features of step 1 give rise to the highest (rate-controlling) barrier and deepest potential well (H trap) along the energy profile for the process.
2.1.2. Step 2
Step 2 of the process involves movement of an H atom from a surface site on the catalyst to a bulk (subsurface) site (I2). The energy of I2 may be found by referencing the density functional theory (DFT) calculations of Rashkeev et al. [16], who reported that the binding energy of H at a bulk (subsurface) site is 2.1–2.3 eV and the binding energy of H at a 3-coordinated surface site is 3.0–3.2 eV, from which it may be deduced that I2 is 0.9 eV higher in energy than I1, i.e., E(I2) = −0.55 eV.
The energy barrier to step 2 depends on the specific surface site from which the step begins. According to Rashkeev et al. [16], from the energetically preferred 3-coordnated surface oxygen sites, the barrier to H movement into the bulk is = 1.9–2.1 eV. It follows that E(TS2) = E(I1) + 2.0 = 0.55 eV. If all 3-coordinated sites are occupied and some 4-coordinated sites are occupied, the step may begin from a 4-coordinated site where the energy of H binding is only 1.2 eV [16], rendering the barrier to forming I2 very small, ~0.1 eV.
2.1.3. Step 3
Once within the bulk, the energy barrier for H to hop from one site to another is = 1.4 eV [23]. Many such hops may be needed depending on the thickness of the oxide layer, but eventually, one such hop will transport the H atom to a site at the oxide/metal interface. This is step 3 of the process and it leads to I3. Combining this energy barrier with the energy of I2 places the energy of TS3 at 0.85 eV.
A representative value of the energy of I3 (H at an interface site) can be deduced from the DFT calculations of Rashkeev et al. [16]. They found the binding energy for H at an Al2O3/Al interface site to be 1.5–1.7 eV. Using the middle of this range places H at the interface +0.6 eV relative to H at a bulk site (I2). It follows that the energy of I3 = 0.05 eV. (The energy will certainly vary at other oxide/metal interfaces, but this value is taken to be representative for the present study.)
A very important caveat to the above analysis, however, is that if there is a lattice-mismatch defect at the interface, as shown schematically in Figure 3, H may be bound much more strongly. For example, Rashkeev et al. [16] report a binding energy of 3.5–3.7 eV for H at such a defect at the Al2O3/Al interface. Using the middle of this range sets the energy of I3 at −1.4 eV relative to that of I2 so E(I3) = −1.95 eV in the presence of interface defects. This is the source of the parenthetical value for the energy of I3 given in Table 1. Lattice-mismatch defects therefore can act as H traps along the transport pathway. Even more concerningly, multiple H atoms can accumulate at such a void, forming H2 molecules, and the formation of multiple H2 molecules at a single defect can form “hydrogen blisters”, initiating corrosion of the material and failure (e.g., delamination) of the interface [16]. Design of the membrane to avoid the formation of these hydrogen blisters will therefore be a key consideration. The metal must be selected not only to provide structural support for the catalyst while allowing H permeability, but also to form a strong, defect-free interface [24]. Otherwise, trapping of multiple H atoms leading to corrosion-inducing hydrogen blisters could arise.

Figure 3.
(a) Pd/alumina interface showing close lattice match. (b) Ni/alumina interface with lattice-mismatch defect circled in yellow. (O = red, Al = blue, Pd or Ni = silver/gray) Structures not optimized. Image by VESTA [25].
2.1.4. Step 4
In step 4, H atoms at interface sites enter the metal bulk, where they find local energy minima at interstitial and vacancy sites [26]. The energy of H at a bulk metal site may be obtained from the heat of absorption (ΔHab) of hydrogen into the particular metal. A commonly used metal for hydrogen separation is Pd. For H in Pd at low H content, ΔHab = −8.948 kcal/mol = 0.39 eV [27]. (ΔHad increases slightly as H content increases toward formation of the hydride PdH2 [27].) Given that the product H2 is at 1.42 eV, this absorption energy places I4 at 1.03 eV.
Once within the metal, diffusion of H from one bulk site to the next (step 5) proceeds by way of a barrier of a few tenths of an eV, depending on the particular metal. For Pd, the barrier is 5.2 kcal/mole = 0.22 eV [28]. Assuming that the energy at the apex of the barrier also applies to the interface → bulk diffusion step, the energy of TS4 is 1.25 eV and the activation energy for the interface → bulk step is = 1.2 eV, making the barrier to step 4 the second highest (or highest) along the entire H transport pathway, depending on the particular hydrocarbon and the presence of ultra-dispersed metal catalyst on the oxide surface.
2.1.5. Step 5
Eventually, H must migrate from the metal bulk to a surface site on the metal. As noted in the previous paragraph, the barrier is assumed akin to the hopping barrier to H diffusion through the metal bulk. It follows that = 0.22 eV and TS5 is at 1.25 eV. The energy of H at a surface site is given by the adsorbtion energy of H on the metal. The value depends on the specific metal and degree of surface coverage, but is ~24 kcal/mol = 1.01 eV for Pd at low H coverage [29]. Referencing this value to the product energy places I5 at 0.41 eV.
2.1.6. Step 6
In the last step in the process, 2 H coalesce into an H2 molecule and desorb from the surface. First-principles calculations of the potential energy surface (PES) for the reverse of this step find it to be barrierless [30]. Hence, the activation energy () of this step is the same as the endothermicity.
2.2. Discussion of Thermodynamic Considerations
The major energy barriers to hydrogen extraction from hydrocarbons and separation as H2 with a dual-use membrane occur in step 1, abstraction of H from the starting hydrocarbon by the heterogeneous catalyst, and, in the case of an interface defect, step 4, escape of H from an interface site into the metal bulk. Industrial chemists have decades of experience optimizing the first process by judicious selection of support and ultra-dispersed catalyst. The height of the energy barrier can be reduced and the energy depth of the surface bound state reduced (weaker binding). CrO3 is especially effective [22] in this role and a dual-use membrane will likely require alumina-supported CrO3 or another efficient dehydrogenation catalyst on the catalyst side.
Less is known about how to optimize the oxide/metal interface and interactions of H therewith. It is clear from the work of Rashkeev et al. [16], however, that judicious selection of the metal and Miller surfaces to achieve good lattice matching and avoid interface defects will be critical. H can accumulate at such defects, form H2 molecules and ultimately lead to hydrogen blisters that induce corrosion of the material and/or breakdown of the interface [16].
The use of metals for H separation is well studied [6]. A known problem is hydrogen embrittlement of the metal. Variations in the lattice constant with changes in the H concentration embrittle the metal, leading to cracking and decreasing the viable lifetime of the membrane [31]. This risk is mitigated by alloying the metal. PdTa [31] and VNi [32] have been reported to be successful in this regard. One mechanism by which alloying attenuates cracking is by shifting a relevant phase transition temperature out of the operating temperature range [33]. Alloying can also be used to modify the strength, corrosion resistance and hydrogen permeability of the material [6]. Other alloys, such as PdAg [34] and PdCu [35], have been employed in hydrogen separation membranes for such purposes.
2.3. Kinetic Analysis
For purposes of modeling, the hydrogen abstraction and separation process may be described as a sequence of steps, as shown schematically in Figure 1. It is assumed that in a practical system, the concentration (pressure) of the reactant will be held constant. Additionally, it is expected that the product H2 would be drawn off as soon as it is produced, rendering the last step irreversible. The overall mechanism may be written,
The energy barriers and frequency factors relevant to each of the rate constants associated with the six steps are collected in Table 3. The energy barriers are calculated from energy differences between adjacent critical points along the energy profile listed in Table 1.
Table 3.
Frequency factors and activation energies used in kinetic modeling.
The frequency factor associated with the rate constant for step 1, the hydrogen abstraction, is given by the collision frequency of reactant molecules with the heterogeneous catalyst surface. From basic kinetic theory of gasses, this frequency may be taken to be [36],
where is the density of reactant molecules and is the surface area with which they collide. The average velocity is temperature-dependent and given by,
where is the gas law constant, is Kelvin temperature and is the molar mass, here assumed to be that of ethane.
The frequency factors for rate constants () are vibrational frequencies for H bound to a surface oxygen (), bulk oxygen () or oxygen at an interface site (). A range of frequencies has been reported for such O-H vibrations [37,38,39], typically centered around 3300 cm−1, which is taken as a representative value here. The frequency factors for the rate constants () are all associated with H bound to a metal atom. A typical metal-hydride vibration of ca. 1400 cm−1 is assumed here [40]. Since these frequency factors have a much weaker influence on the kinetics of the system than the energy barriers, plausible deviations from these values for the vibrational frequencies are unlikely to have a meaningful impact on the conclusions presented here. It is also important to note that these frequencies are not easily manipulated by modification of the membrane design so considering radical deviations from these values is unlikely to be of practical interest.
2.3.1. Steady-State Analysis
The simplest approach to gain insight into the kinetic behavior of the proposed separation system is to write standard instantaneous rate expressions based on the mechanism given in Equation (4a–f) and assume steady-state conditions. The rate equations associated with the reaction mechanism Equation (4a–f) in the steady-state approximation are:
Here, denotes the rate constant associated with the th barrier, denotes the rate constant for traversing the same barrier in the reverse direction, denotes the concentration of the th intermediate species, is the concentration of R and is the concentration of the unsaturated hydrocarbon byproduct.
In the case that the reactant concentration (pressure) is kept constant, and the product is drawn off as soon as it is produced (as is assumed here), after a brief initial transient period, steady-state flow will be established. Under this condition, the rate of production of product () may be approximated by setting all derivatives in Equation (7) and solving for the rate of production of product in terms of only the rate constants and the reactant concentration (). Solving Equation (7a–d) for and substituting onto Equation (7f) yields,
If any one of the steps is effectively irreversible, the expression for the rate of production of the product greatly simplifies because only values corresponding to the irreversible step and those preceding it appear in the expression. In the present case, the first step is essentially irreversible (). Furthermore, in practice, under a constant flow of reactant, it is likely that U would tend to get carried away in the flow of gas since there would be no U upstream of the reactor. Correspondingly, here, it is assumed . This would also have the effect of rendering step 1 irreversible, but this is of no consequence here since the first step is already essentially irreversible. The rate of production of product simplifies to,
The overall reaction rate therefore results from a competition between the frequency factor for step 1 () and a probability factor arising from the abstraction barrier (). The frequency factor for step 1 is the collision frequency between the source gas and the catalyst surface as given in Equation (5). Rewriting the number density with the Ideal Gas Law,
It follows by substitution of Equations (6) and (10) into Equation (5) that the collision frequency depends only weakly on temperature,
For ethane at P = 100 Torr as the reactant gas, the frequency factor decreases by a factor of 1.5 when the temperature is increased from 300 K to 700 K. In comparison, the probability factor arising from the abstraction barrier increases by a factor of 3.6 × 10¹⁰. We may conclude that in this simple steady-state approximation, the abstraction barrier is in control of the rate.
2.3.2. Time-Dependent Analysis
A shortcoming of the model captured in the rate Equation (7) is that it neglects the possible influence of the finite number of H-binding sites, both on the catalyst surface and within the membrane bulk. In other words, the concentrations of the intermediate species cannot become arbitrarily large but are limited by the number of possible H-binding sites. Because the number of sites is limited, for a given intermediate, the probability of a step taking place depends not only on the concentration of that intermediate and the exponential Boltzmann factor arising from the energy barrier, but also on the probability that the site is vacant, where H will bind upon completion of the step. To account for the finite number of H-binding sites, each rate constant must be multiplied by the fraction of target sites that are vacant. For an intermediate Ii, if the total number of such sites is , the fraction of sites that is vacant is given by . This factor drives the rate of a step toward zero when the target H-binding sites approach saturation. When the finite number of H-binding sites is accounted for, the rate equations associated with the reaction mechanism shown in Equation (4) are:
Because the concentrations of the intermediate species () are not linearly independent in the set of Equation (12), an analytic steady-state solution is not available. Instead, a numerical time-dependent analysis may be applied.
In the time interval from the onset of H abstraction until steady-state flow is established, the intermediate concentration will be time-dependent. Here, this time dependence is found by numerical solution of the set of coupled differential Equation (12) using the Rosenbrock approach [41] as implemented in Maple [42]. For the present study, the values of the frequency factors and energy barriers listed in Table 3 are adopted. The density of interface sites is assumed to be equal to the density of surface sites, which is taken to be that of oxygen sites on the surface of cubic alumina [15,17], 12.5 nm−2. Additionally, it is assumed that Torr, T = 500 K and that P is drawn off as it is produced, which has the effect of rendering the last step irreversible.
3. Results
In Figure 4, the time dependence for select intermediate species is shown. Inspecting and on a short time scale (Figure 4a, 0...1000 s) reveals a manifestation of the fact that the first step is essentially irreversible and the second step is slow; increases to near saturation (12.5 nm−2 at ca. 300 s = 5 min.) before the concentration of I2 sites becomes appreciably populated. Consequently, only after I1 sites are saturated can the other intermediates increase appreciably in concentration. Figure 4b compares the concentrations of all intermediates on a log scale, where it may be seen that steady-state flow is approximately established ca. 600 s = 10 min. (On a linear scale, the curves do not become visually level, indicative of rigorously steady-state conditions, until ~106 s.) Note that I5 always exceeds I4 in concentration. This is a consequence of the very high energy of I4, which is set here by the heat of hydrogen absorption of Pd (vide supra). A metal with a higher heat of hydrogen absorption would likely increase the concentration of I4. The extensive literature on metal hydrides for hydrogen storage could be mined for promising candidates [43]. For example, decreasing the energy of I4 by 1.0 eV increases the steady-state concentration of I4 by an astounding 10 orders of magnitude. This has little impact on the rate of hydrogen throughput, however, because I4 is not associated with the rate-limiting step. By contrast, the density of surface sites appears to have a roughly linear effect on the rate.

Figure 4.
Abundance of selected species (in nm−2) over time. (a) I1—red, left vertical axis and I2—pink-dashed, right vertical axis. (b) I1—red, I2—pink-dashed, I3—yellow, I4—green and I5—blue-dashed (log scale). Note that steady-state flow is not achieved until ~600 s.
4. Discussion
It is interesting to consider the influence of interface defects on the kinetics. The presence of interface defects reduces the energy of I3 from 0.05 to −1.95 eV, with a commensurate increase in the subsequent energy barrier. Running the analysis with this change brings I3 to saturation (12.5 nm−2) ca. 106 s, but the rate of production of hydrogen product is essentially zero even after steady state is achieved. These deep wells along the reaction path serve as “traps” that slow the production of H2.
By contrast, the presence of 4-coordinated oxygen sites on the oxide surface that can bind H can significantly enhances the rate. These sites are 2 eV higher in energy than the 3-coordinated oxygen sites, which raises the energy of I2 to 0.45 eV and decreases the ensuing barrier to just 0.1 eV. If these sites can be engaged for catalysis, this change in the energy of I2 can increase the rate of production of H2 at 500 K by 6 × 108.
The predicted overall rate of hydrogen production at 723 K is around 1.3 nano-mole.s−1 for a 0.01 m2 membrane. Although the model is very crude (it is a pseudo-1D model, neglects collision orientation of the reactant with the surface, does not account for multiple transport paths sharing H-binding sites, etc.), it does suggest that modifications will be required to achieve a practical rate. A modification that enhances the engagement of the 4-cordinated oxygen sites on the oxide surface would appear to be especially useful. Under the same conditions, if the 4-coordinated oxygen sites are active, the predicted hydrogen production rate is 8.8 μmol.s−1. These production rates are low in comparison with the flux through a high-flux hydrogen separation membrane. Gielens et al. [8] have reported fluxes through Pd membranes of ~8 mmol.s−1 under similar conditions (0.01 m2 membrane, 723 K, pressure difference of 100 Torr). The observation that flux through a hydrogen separation membrane can be much higher than the flux predicted here is consistent with the present finding that the rate is more heavily controlled by the H abstraction step than the separation step, and it suggests that there is substantial room for enhancement of the proposed dual-use membrane system.
5. Conclusions
Thermodynamic considerations show that the production of H2 from hydrocarbons by abstraction and separation is an endothermic process, but can be made spontaneous by manipulation of the temperature and reactant quotient for the overall reaction (primarily drawing off product to greatly diminish the concentration of product, thereby rendering the reaction quotient less than the equilibrium constant).
Prospects for H abstraction and separation by a dual-use membrane hinge on the heterogeneous dehydrogenation catalyst and the oxide/metal interface. The catalyst should present a sufficiently low barrier to dehydrogenation to abstract H at an appreciable rate but bind H at the surface sufficiently weakly that the energy barrier to movement of H from a surface site to a bulk site in the oxide is not prohibitive.
The oxide/metal interface poses two issues. First, as a practical matter of great concern, the capture of multiple H atoms at interface defect sites can lead to the formation of H2 at the interface and ultimately to “hydrogen blisters” that initiate corrosion and structural failure of the interface [16]. Second, the presence of interface defects can present H “traps” and a high energy barrier to H transport along the reaction profile. This barrier will slow the movement of H through the membrane to near zero. The metal (or alloy) must therefore be selected not only to act as a structural support for the oxide catalyst while retaining H permeability, but also to form a strong, defect-free interface.
It is hoped that this work will stimulate more research into this attractive hydrogen separation technology, including experimental work to optimize hydrogen flux, and to address the materials challenges posed by the oxide/metal interface.
Funding
The present work was supported in-part by ACS-PRF-#58323-ND10, for which the author thanks the donors of the American Chemical Society Petroleum Research Fund.
Data Availability Statement
This study did not report any data beyond what is presented in the body of the manuscript.
Acknowledgments
The author thanks S. Wang for discussions of Ref. [22] and R. Farasat, N. Stuart and B. Rosen for critical reading of the manuscript.
Conflicts of Interest
The author declares no conflict of interest.
References
- García, L. 4—Hydrogen Production by Steam Reforming of Natural Gas and Other Nonrenewable Feedstocks. In Compendium of Hydrogen Energy; Subramani, V., Basile, A., Veziroğlu, T.N., Eds.; Woodhead Publishing: Oxford, UK, 2015; pp. 83–107. [Google Scholar]
- Hydrogen Production: Natural Gas Reforming; US Department of Energy, Office of Energy Efficiency and Renewable Energy: Washington, DC, USA, 2018.
- Papadias, D.D.; Lee, S.H.; Ferrandon, M.; Ahmed, S. An analytical and experimental investigation of high-pressure catalytic steam reforming of ethanol in a hydrogen selective membrane reactor. Int. J. Hydrogen Energy 2010, 35, 2004–2017. [Google Scholar] [CrossRef]
- Sattler, J.J.H.B.; Ruiz-Martinez, J.; Santillan-Jimenez, E.; Weckhuysen, B.M. Catalytic Dehydrogenation of Light Alkanes on Metals and Metal Oxides. Chem. Rev. 2014, 114, 10613–10653. [Google Scholar] [CrossRef]
- Trombetta, M.; Busca, G.; Rossini, S.; Piccoli, V.; Cornaro, U.; Guercio, A.; Catani, R.; Willey, R.J. FT-IR Studies on Light Olefin Skeletal Isomerization Catalysis. J. Catal. 1998, 179, 581–596. [Google Scholar] [CrossRef]
- Burkhanov, B.G.S.; Gorina, N.B.; Kolchugina, N.B.; Roshan, N.R.; Slovetsky, D.I.; Chistov, E.M. Palladium-Based Alloy Membranes for Separation of High Purity Hydrogen from Hydrogen-Containing Gas Mixtures. Platin. Met. Rev. 2011, 55, 3–12. [Google Scholar] [CrossRef]
- Airaksinen, S.M.K.; Harlin, M.E.; Krause, A.O.I. Kinetic Modeling of Dehydrogenation of Isobutane on Chromia/Alumina Catalyst. Ind. Eng. Chem. Res. 2002, 41, 5619–5626. [Google Scholar] [CrossRef]
- Gielens, F.C.; Tong, H.D.; Vorstman, M.A.G.; Keurentjes, J.T.F. Measurement and modeling of hydrogen transport through high-flux Pd membranes. J. Membr. Sci. 2007, 289, 15–25. [Google Scholar] [CrossRef]
- Ono, S.; Uchikoshi, T.; Hayashi, Y.; Kitagawa, Y.; Yeh, G.; Yamaguchi, E.; Tanabe, K. A Heterothermic Kinetic Model of Hydrogen Absorption in Metals with Subsurface Transport. Metals 2019, 9, 1131. [Google Scholar] [CrossRef]
- Deveau, N.D.; Ma, Y.H.; Datta, R. Beyond Sieverts’ law: A comprehensive microkinetic model of hydrogen permeation in dense metal membranes. J. Membr. Sci. 2013, 437, 298–311. [Google Scholar] [CrossRef]
- Spitzer, R.; Huffman, H.M. The Heats of Combustion of Cyclopentane, Cyclohexane, Cycloheptane and Cyclooctane. J. Am. Chem. Soc. 1947, 69, 211–213. [Google Scholar] [CrossRef]
- Steele, W.V.; Chirico, R.D.; Knipmeyer, S.E.; Nguyen, A.; Smith, N.K.; Tasker, I.R. Thermodynamic Properties and Ideal-Gas Enthalpies of Formation for Cyclohexene, Phthalan (2,5-Dihydrobenzo-3,4-furan), Isoxazole, Octylamine, Dioctylamine, Trioctylamine, Phenyl Isocyanate, and 1,4,5,6-Tetrahydropyrimidine. J. Chem. Eng. Data 1996, 41, 1269–1284. [Google Scholar] [CrossRef]
- Abdulwahed, M. Thermodynamic Analysis of Isobutane Dehydrogenation Reaction. Int. J. Thermodyn. 2015, 18, 213. [Google Scholar] [CrossRef][Green Version]
- Cai, S.; Chihaia, V.; Sohlberg, K. Interactions of methane, ethane and pentane with the (110C) surface of γ-alumina. J. Mol. Catal. A: Chem. 2007, 275, 63–71. [Google Scholar] [CrossRef]
- Sohlberg, K.; Pennycook, S.J.; Pantelides, S.T. The Bulk and Surface Structure of γ-alumina. Chem. Eng. Commun. 2000, 181, 107–135. [Google Scholar] [CrossRef]
- Rashkeev, S.N.; Sohlberg, K.W.; Zhuo, S.; Pantelides, S.T. Hydrogen-Induced Initiation of Corrosion in Aluminum. J. Phys. Chem. C 2007, 111, 7175–7178. [Google Scholar] [CrossRef]
- Knözinger, H.; Ratnasamy, P. Catalytic Aluminas: Surface Models and Characterization of Surface Sites. Catal. Rev. 1978, 17, 31–70. [Google Scholar] [CrossRef]
- Weckhuysen, B.M.; Schoonheydt, R.A. Alkane dehydrogenation over supported chromium oxide catalysts. Catal. Today 1999, 51, 223–232. [Google Scholar] [CrossRef]
- Korhonen, S.T.; Airaksinen, S.M.; Bañares, M.A.; Krause, A.O.I. Isobutane dehydrogenation on zirconia-, alumina-, and zirconia/alumina-supported chromia catalysts. Appl. Catal. A Gen. 2007, 333, 30–41. [Google Scholar] [CrossRef]
- Sattler, J.J.H.B.; González-Jiménez, I.D.; Mens, A.M.; Arias, M.; Visser, T.; Weckhuysen, B.M. Operando UV-Vis spectroscopy of a catalytic solid in a pilot-scale reactor: Deactivation of a CrOx/Al2O3 propane dehydrogenation catalyst. Chem. Commun. 2013, 49, 1518–1520. [Google Scholar] [CrossRef] [PubMed]
- Ostrovskii, V.E.; Kadyshevich, E.A.; Gostev, B.V.; Lapidus, A.L. An adsorption and calorimetric study of the interaction of hydrogen with chromium oxide. Russ. J. Phys. Chem. A 2008, 82, 1626–1632. [Google Scholar] [CrossRef]
- Borisevich, A.Y.; Wang, S.; Rashkeev, S.N.; Glazoff, M.; Pennycook, S.J.; Pantelides, S.T. Dual Nanoparticle/Substrate Control of Catalytic Dehydrogenation. Adv. Mater. 2007, 19, 2129–2133. [Google Scholar] [CrossRef]
- Sohlberg, K.; Pennycook, S.J.; Pantelides, S.T. Hydrogen Mobility in Catalytic Aluminas: Theory and Implications. Recent Res. Dev. Phys. Chem. 2000, 4, 71–81. [Google Scholar]
- Zhang, W.; Smith, J.; Evans, A. The connection between ab initio calculations and interface adhesion measurements on metal/oxide systems: Ni/Al2O3 and Cu/Al2O3. Acta Mater. 2002, 50, 3803–3816. [Google Scholar] [CrossRef]
- Momma, K.; Izumi, F. VESTA 3for three-dimensional visualization of crystal, volumetric and morphology data. J. Appl. Crystallogr. 2011, 44, 1272–1276. [Google Scholar] [CrossRef]
- Yokogawa Corporation of America. Application Note: Hydrogen Permeation, PROD #: 2018-01-2361; Yokogawa Corporation: Sugar Land, TX, USA, 2018. [Google Scholar]
- Nace, D.M.; Aston, J.G. Palladium Hydride. I. The Thermodynamic Properties of Pd2H between 273 and 345°K.1. J. Am. Chem. Soc. 1957, 79, 3619–3623. [Google Scholar] [CrossRef]
- Sholl, D.S. Using density functional theory to study hydrogen diffusion in metals: A brief overview. J. Alloy. Compd. 2007, 446–447, 462–468. [Google Scholar] [CrossRef]
- Christmann, K. Kinetics, energetics and structure of hydrogen adsorbed on transition metal single crystal surfaces. Bull. Sociétés Chim. Belg. 2010, 88, 519–539. [Google Scholar] [CrossRef]
- Wilke, S.; Scheffler, M. Potential-energy surface forH2dissociation over Pd(100). Phys. Rev. B 1996, 53, 4926–4932. [Google Scholar] [CrossRef]
- Peachey, N.M.; Snow, R.C.; Dye, R.C. Composite PdTa metal membranes for hydrogen separation. J. Membr. Sci. 1996, 111, 123–133. [Google Scholar] [CrossRef]
- Amano, M.; Komaki, M.; Nishimura, C. Hydrogen permeation characteristics of palladium-plated V-Ni alloy membranes. J. Less Common Met. 1991, 172–174, 727–731. [Google Scholar] [CrossRef]
- Shu, J.; Grandjean, B.P.A.; Van Neste, A.; Kaliaguine, S. Catalytic palladium-based membrane reactors: A review. Can. J. Chem. Eng. 1991, 69, 1036–1060. [Google Scholar] [CrossRef]
- Holleck, G.L. Diffusion and solubility of hydrogen in palladium and palladium-silver alloys. J. Phys. Chem. 1970, 74, 503–511. [Google Scholar] [CrossRef]
- Edlund, D.J.; Pledger, W.A.; Studebaker, T. Hydrogen-Permeable Metal Membrane and Hydrogen Purification Assemblies Containing the Same; IdaTech, LCC: Bend, OR, USA, 2003. [Google Scholar]
- Bromberg, J.P. Physcial Chemistry; Allyn and Bacon Inc.: Boston, MA, USA, 1980. [Google Scholar]
- Tsyganenko, A.A.; Filimonov, V.N. Infrared Spectra of Surface Hydroxyl Groups and Crystalline Structure of Oxides. J. Mol. Struct. 1973, 19, 579. [Google Scholar] [CrossRef]
- Tsyganenko, A.; Smirnov, K.; Rzhevskij, A.; Mardilovich, P. Infrared spectroscopic evidence for the structural OH groups of spinel alumina modifications. Mater. Chem. Phys. 1990, 26, 35. [Google Scholar] [CrossRef]
- Tsyganenko, A.A.; Mardilovich, P.P. Structure of alumina surfaces. J. Chem. Soc. Faraday Trans. 1996, 92, 4843. [Google Scholar] [CrossRef]
- Pelmenschikov, V.; Gee, L.B.; Wang, H.; MacLeod, K.C.; McWilliams, S.F.; Skubi, K.L.; Cramer, S.P.; Holland, P.L. High-Frequency Fe-H Vibrations in a Bridging Hydride Complex Characterized by NRVS and DFT. Angew. Chem. Int. Ed. 2018, 57, 9367–9371. [Google Scholar] [CrossRef] [PubMed]
- Rosenbrock, H.H. Some general implicit processes for the numerical solution of differential equations. Comput. J. 1963, 5, 329–330. [Google Scholar] [CrossRef]
- Maple. Maplesoft, a Division of Waterloo; Maple Inc.: Waterloo, ON, Canada, 2020. [Google Scholar]
- Sakintuna, B.; Lamari-Darkrim, F.; Hirscher, M. Metal hydride materials for solid hydrogen storage: A review. Int. J. Hydrog. Energy 2007, 32, 1121–1140. [Google Scholar] [CrossRef]
Publisher’s Note: MDPI stays neutral with regard to jurisdictional claims in published maps and institutional affiliations. |
© 2021 by the author. Licensee MDPI, Basel, Switzerland. This article is an open access article distributed under the terms and conditions of the Creative Commons Attribution (CC BY) license (https://creativecommons.org/licenses/by/4.0/).