Review

Thermal Monitoring and Simulation of Earthen Buildings. A Review

Sustainable Energy, Machinery and Buildings (SEMB) Research Group, INSPIRES Research Centre, Universitat de Lleida, 25001 Lleida, Spain
*
Author to whom correspondence should be addressed.
Generalitat de Catalunya Serra Húnter Fellow.
Energies 2021, 14(8), 2080; https://doi.org/10.3390/en14082080
Submission received: 12 March 2021 / Revised: 30 March 2021 / Accepted: 1 April 2021 / Published: 8 April 2021
(This article belongs to the Special Issue Advanced Buildings Thermal Monitoring)

Abstract

:
Since ancient times, raw earth has been used worldwide as a construction material. Today, it is well known for its good environmental properties of recyclability and low embodied energy along the production process. Earthen walls regulate the interior temperature of the buildings, providing comfortable temperatures with a very low carbon footprint. As a result of those advantages, earthen building techniques have been revived and used for contemporary architecture. The aim of this paper is to review the state of the art about the thermal behaviour of earthen building, including all the monitoring and simulation analysis of real earthen constructions up to now. The paper presents the different earthen techniques known nowadays, analysing the most important thermal parameters and the thermal comfort achieved with each technique. Regardless the wide differences among the analyzed cases, the authors conclude that earth building is a suitable solution in hot and arid climates, since it preserves the indoor temperature within the thermal comfort limits most part of the time without any active system.

1. Introduction. Earth Architecture in the World

The power of each civilisation has been represented by its architecture. The pyramids, the classic shrines, the medieval castles, the large Gothic cathedrals, the Baroque and Renaissance palaces, or some skyscrapers in the 20th and 21st centuries are examples of representative architecture which have not paid much attention to the interaction of form and energy, and to the bioclimatic approach, in general [1]. Nowadays some of this architecture requires the constant use of conditioned air or heating systems to achieve thermal comfort.
On the other hand, popular and vernacular architecture is the one connected to the environment. In this architecture, the aesthetics of the buildings are the less important, but the use of local materials and techniques guide the constructive design to save the meteorological conditions of the place in question. It is proven that in extreme climates, popular architecture has better thermal performance than representative and modern architecture [1].
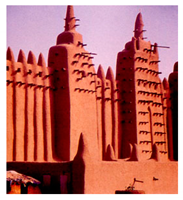
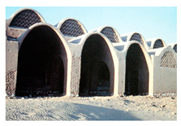
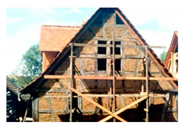
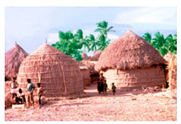
Earth constructions have been used worldwide for centuries, often surviving until the present. There is some archeological evidence of this fact, embodied in the adobe walls of Jericho, dating to 8300 BC or parts of the Great Wall of China that are over 2000 years old [2]. Despite its ancient origins, approximately 30% of the world’s population is currently living in earth-based housing [3,4,5,6].
Roux [6] states that the big empires in the ancient history like Egypt, Iran, China or Mesopotamia used adobe to build their dwellings. However, for some people nowadays these materials are related with poverty and non-developed countries. In some countries there are entire cities built with this material, which have more than three centuries of history, such as Cairo or Jerusalem. Furthermore, nowadays more than 150 UNESCO World Heritage properties around the globe are totally or partially built with earth [7]. Figure 1 shows the earth construction areas of the world according to [8].
These examples prove the viability of this type of construction, and certify that the earth construction technologies are a plausible alternative in the 21st century due to their long service life and applicability worldwide [3,5].
Although the industrialised countries have replaced traditional earth constructions by modern and highly technified materials during the last centuries, the interest in earth materials is also growing in these countries due to its sustainability at economic, social and environmental level. It seems to be a good solution for the environment, due to its low carbon footprint, low embodied energy, high thermal inertia and good hygroscopic features [3,4,5]. As an example at social and economic level, according to [9], dwelling needs in the developing countries can only be solved using natural and local materials and auto constructive techniques, which make the earth an optimal building material candidate.
Currently all the efforts regarding new constructions or refurbishments at any level or country are focused on reducing the embodied energy, obtaining the best thermal comfort performance. It is important to focus on the building envelope and to apply passive design strategies to increase the thermal comfort inside the building without any active HVAC system.
This review has different objectives. First, an updated classification of the different earth constructive techniques is presented. Second, this paper puts together the findings regarding the thermal comfort of the different earth construction techniques, in order to define the current state of research in this topic and propose future research. To accomplish with this second objective, thermal monitoring and thermal simulations studies are considered. Analysis and comparisons of thermal behaviour of earth constructions are also performed. The scope of the review is to present thermally monitored and simulated earthen buildings, being those ancient or new constructions, built in any of the earth construction techniques for both, in-use or experimental purposes.

2. Classification for Earth Constructive Techniques

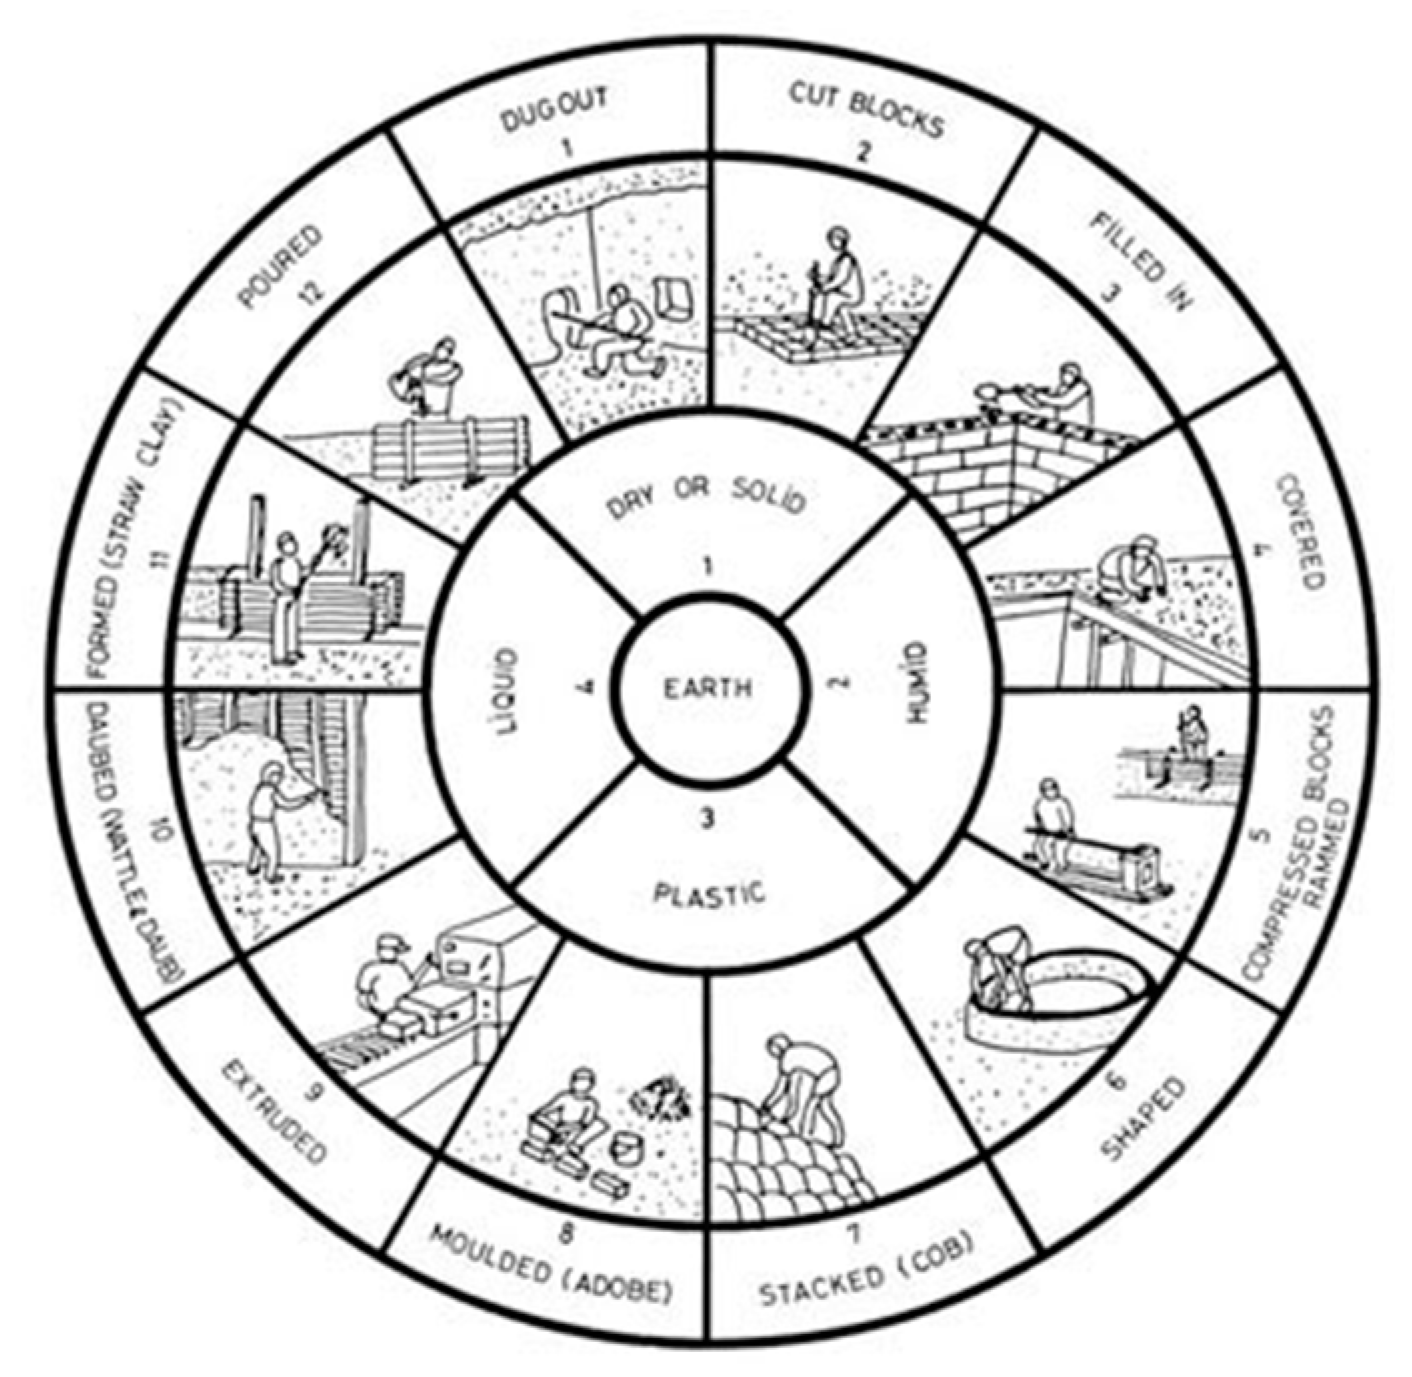
Two classifications have been found in the literature. The first one, provided by the Auroville Earth Institute [8] classifies the main earth techniques by the content of water in the mixture (Figure 2).
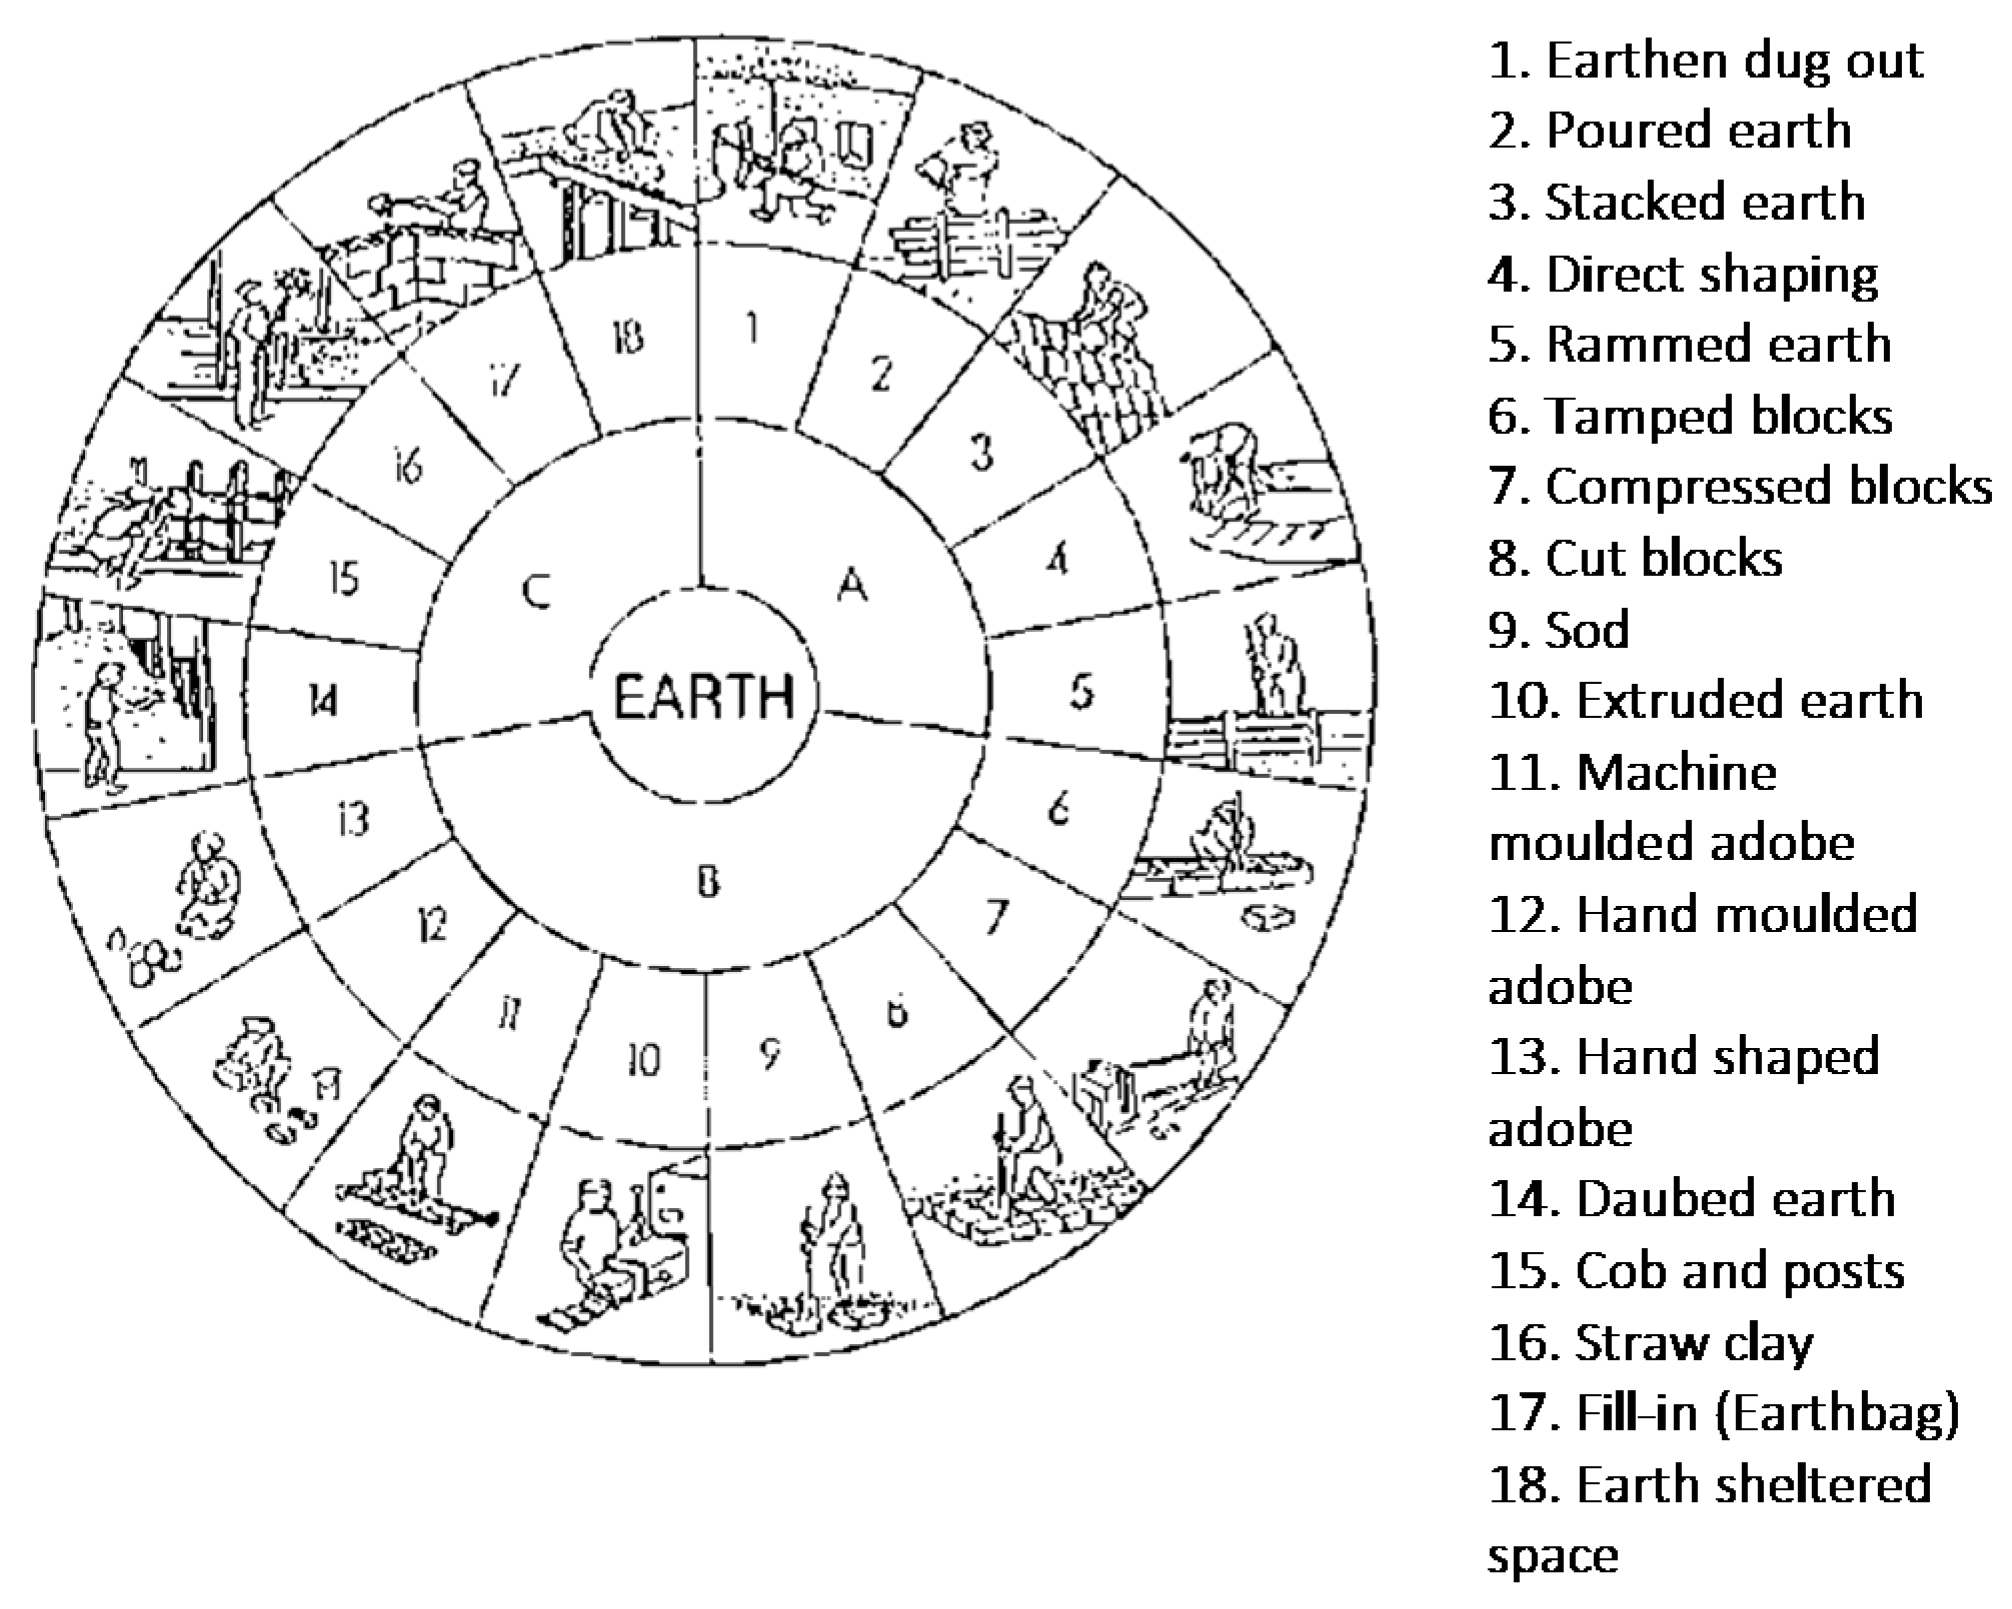
The second one, provided by Houben and Guilland [10], bases the classification in the load bearing system needed, as shown in Figure 3.
The Auroville Earth Institute classification presents four categories according to the state of the earth (Figure 2):
(1)
dry and solid corresponds to the earth in a completely solid state with no water added into the mixture;
(2)
humid stands for those techniques that contain a relatively low percentage of water, about 5% [11];
(3)
in the plastic category 15–30% of water is added [11] and
(4)
for the liquid category the earth is expected to be in a liquid state.
When looking at Houben and Guilland’s classification (Figure 3) three main groups (A, B, and C) are presented, according to the use of unbaked earth. This are in monolithic load-bearing form (A), in load-bearing masonry form (B) or in conjunction with a load-bearing structure (C).
When considering both classifications, it is seen that there is a direct correlation between the content of water of the mixture and the load-bearing system used for the earth construction. For techniques with low water content, the structure is hold by the earth itself in monolithic load-bearing form; as higher is the water content, a formwork during the construction or a fixed wooden or other load-bearing structure is needed.
Both earth techniques classifications are key references in literature however, they were presented decades ago and today new techniques must be incorporated. This is why, an update and a correlation based on both classifications is presented in this review. The classification presented in Table 1 considers similar techniques, adds new earth techniques and avoids the techniques where the earth is just used in the roof as passive design strategy, instead of the building enclosure.

3. Methodology

During the analysis, more than 100 scientific papers and conference articles related with raw earth construction were analysed. However, only the 57 articles directly related with monitoring and simulation thermal comfort have been considered. Most of the techniques presented in Table 1 are present in the Results section, however there are other techniques that are not included in that section because no literature is found within the scope and the objective of this study, although some of them are very well known techniques. For example, earth 3D printing is such a new technique for which some preliminary studies about the earth properties and small structural tests can be found but nothing related with thermal comfort or hygrothermal behaviour. Other examples are the direct shaping or the cut blocks. There is some literature [8,10] describing the techniques or locating some real examples of those construction techniques, but there are not studies concerning its thermal behavior. In the discussion section, comparison tables can be found.
According to the objective of the review, the literature was divided into two main groups:
(5)
MONITORING: Thermal monitoring of experimental buildings and in-use buildings.
(6)
SIMULATION: Thermal simulation of existing buildings and buildings designed exclusively for simulation.
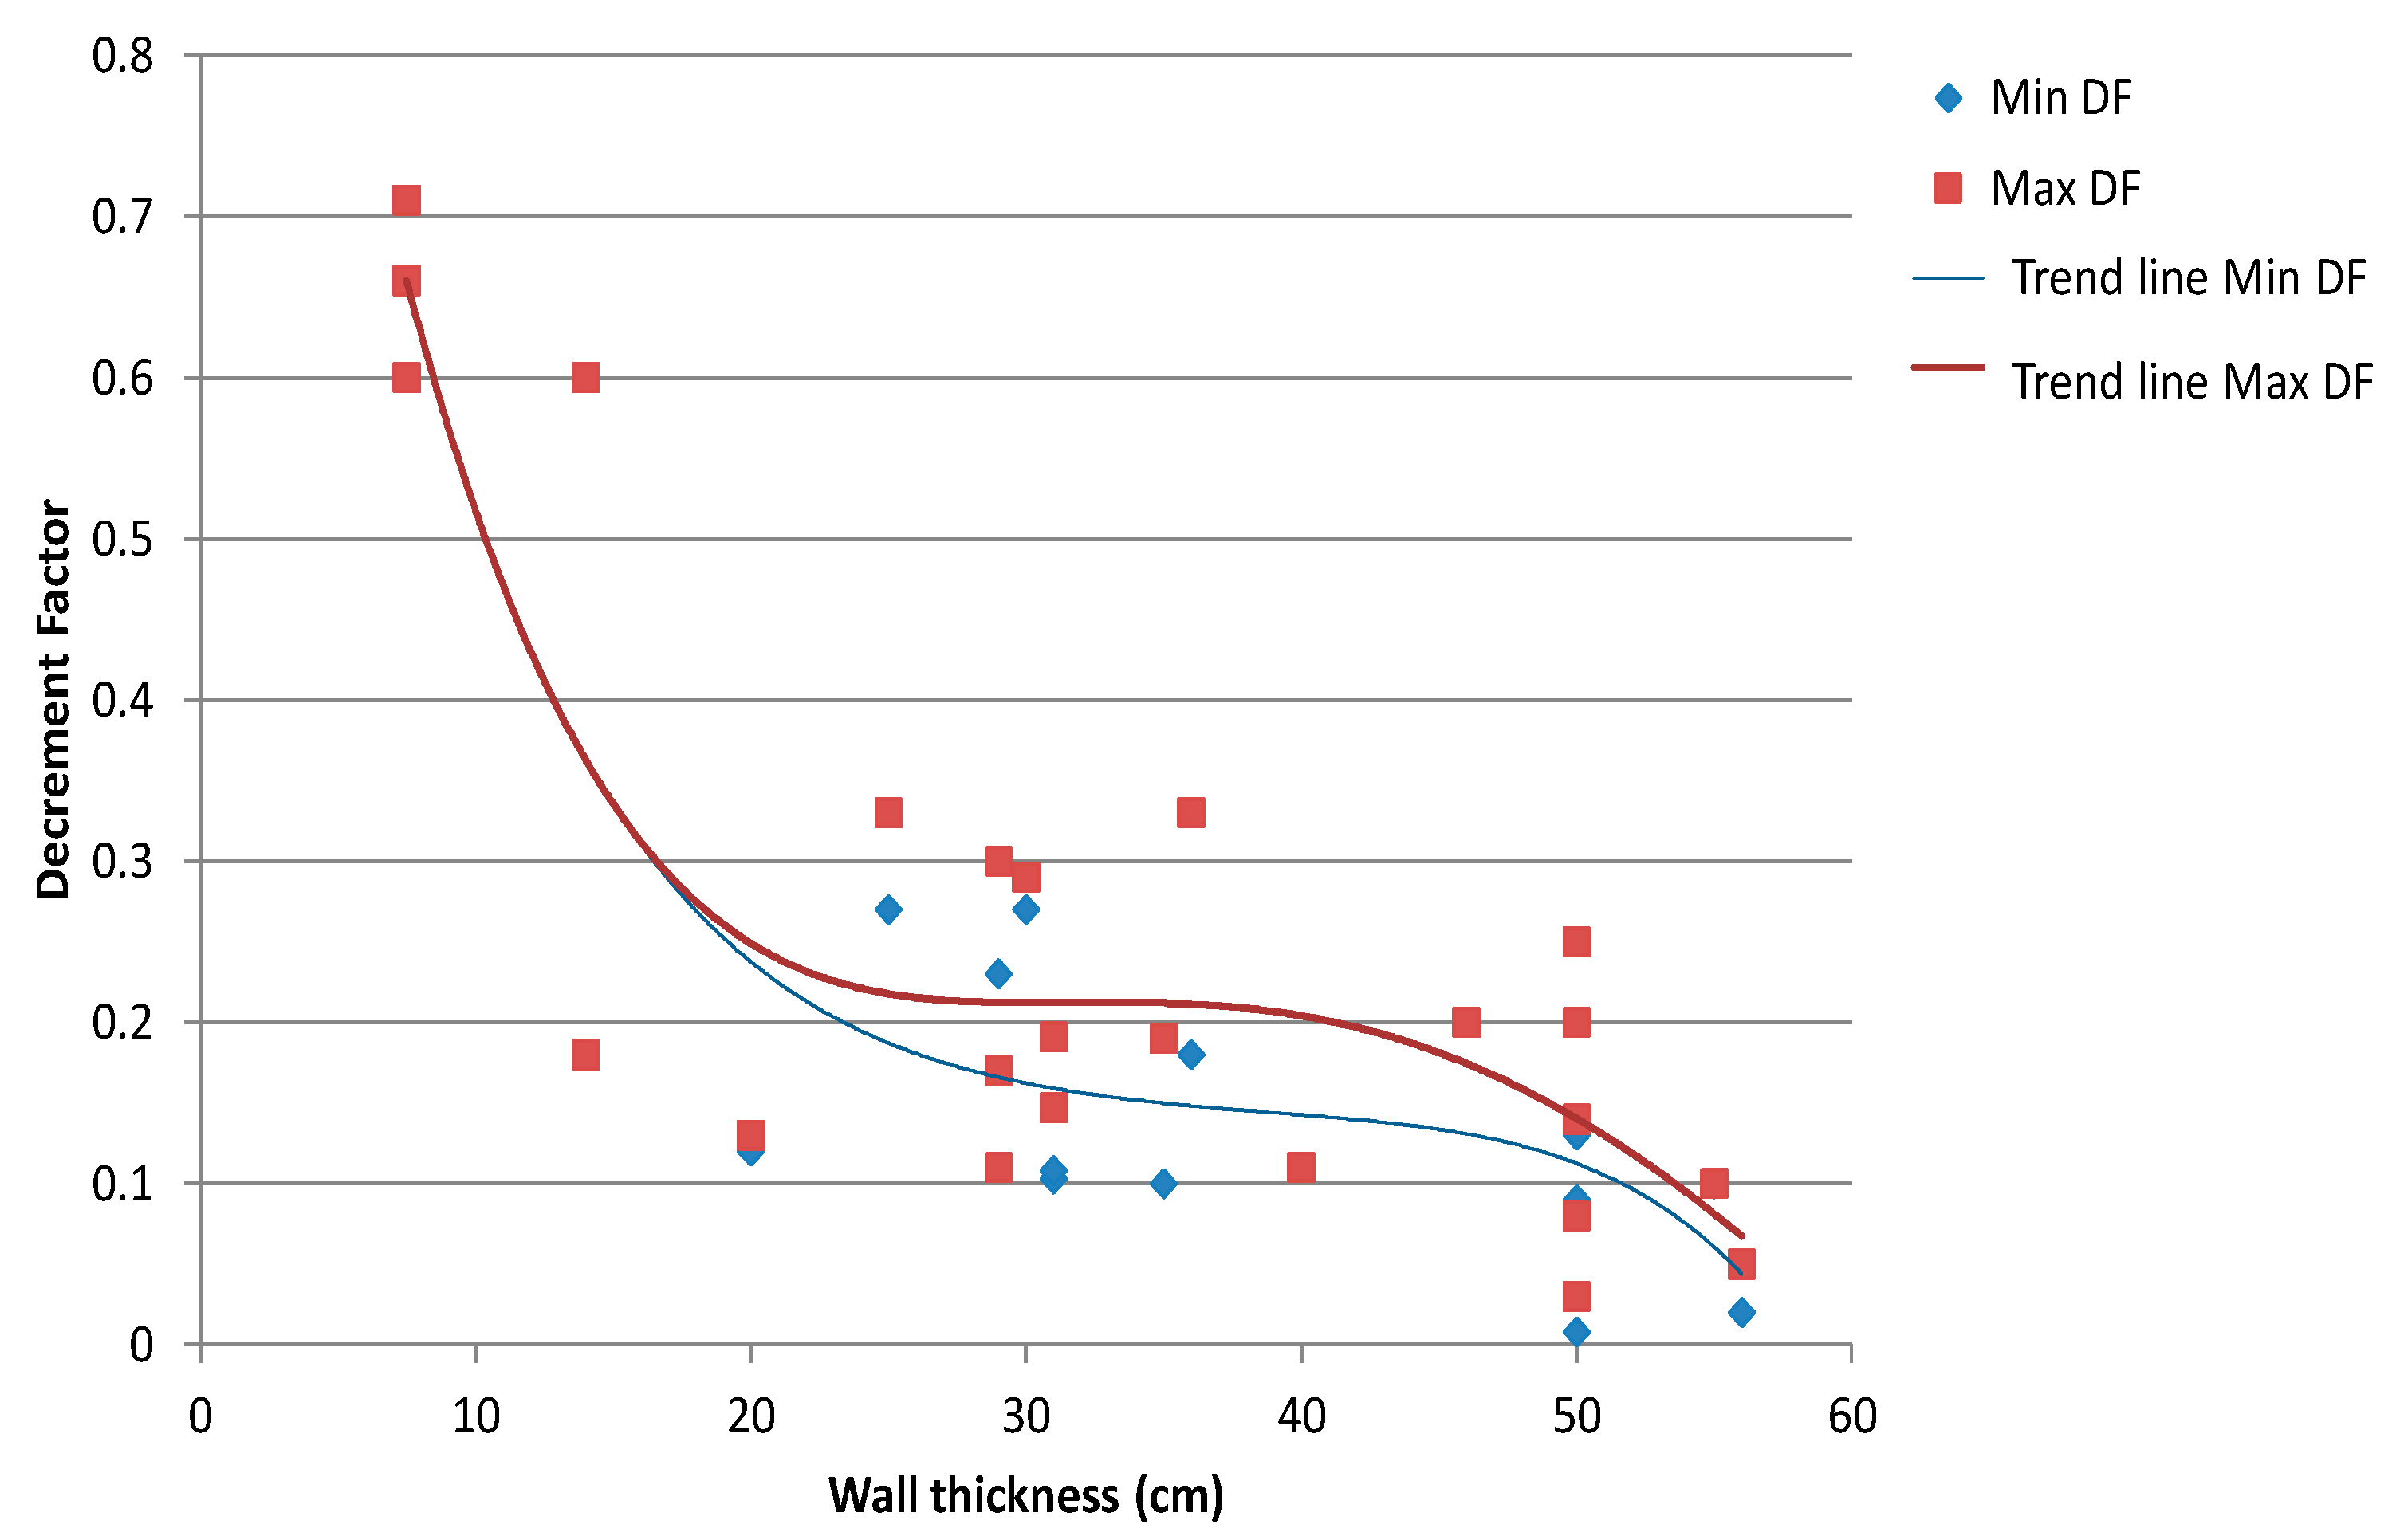
The relevant information extracted from each publication is: paper title, authors, scientific journal and publication year. The geographical location and climate are also considered, classifying the climate according to the Köppen and Geiger classification [12]. The building use is also an important parameter, distinguishing between in-use buildings and buildings only designed for simulation purposes. In the in-use buildings category prototypes and experimental buildings are also considered. In-use buildings are those buildings that have been in lawful use for a continuous period of at least six months within a period of three years or a relevant building; while an experimental building is the one that has only a research purpose. Monitoring procedure and/or software used have been also considered. Characteristics of the buildings such as wall thickness or dimensions as well as thermal parameters such as thermal conductivity of the wall and/or U-value are relevant for the analysis. Thermal lag, decrement factor and comfort degree in the building are also of interest for this paper. The thermal lag represents the time that elapses between the indoor air temperature maximum value and the outdoor maximum value. The decrement factor is defined as the reduction of the temperature range of both measures [13].

4. Results

Literature analysed is presented dividing monitoring studies from simulation studies. Inside each category, the technique order presented in Table 1 is followed. Main characteristics of the buildings studied and the technology used for monitoring or simulating as well as main results and conclusions are exposed. Comparison tables are found in the discussion section.

4.1. Thermal Monitoring

4.1.1. Earthen Dug Out

All the authors in this section monitored in-use buildings. Some used as wine cellars and others as residential buildings still in use nowadays.
Porras et al. [14] monitored a warehouse in-use underground building located in San Esteban de Gormaz (Spain), a location with an oceanic climate (Cfb). The volume of the construction is around 250 m3 and is excavated to an average depth greater than 10 m. The construction has a tunnel, a cave and a ventilation chimney. Access to the cave is achieved through a tunnel vaulted section 1 m wide, 2.2 m height, 8.5 m in length and with an angle of inclination of 65%. The monitoring has been divided into two periods: cold period (Text < Tint) and warm period (Text > Tint). No information on thermal lag, decrement factor or thermal comfort is presented. The authors conclude that thermal stability with zero energy consumption is reached in the cave despite the extreme outdoor temperatures.
Sadoughi et al. [15] monitored five traditional Iranian buildings, called shavadan, located in Dezful (Iran) and corresponding to a hot semi-arid climate (BSh). The buildings and the corresponding depth from the courtyard’s level are the following: #1 Shah Rokn-al-Din Mosque (9 m); #2 Shah Rokn-al-Din School (8.8 m); #3 Lab-e-Khandagh Mosque (7.25 m); #4 Nilsaz House (6.5 m) and #5 Nadali House (8 m). The indoor air temperature, from June 1st to December 21st, monitored for buildings #1, #2 and #4 ranged between 15.4 and 24.2 °C, 22.3 and 26.8 °C, and 17.3 and 26.4 °C, respectively; whereas the outdoor temperatures ranged between 13.1 and 47.6 °C. The decrement factors for buildings #1, #2 and #4 were 0.38, 0.13, and 0.26, respectively. The indoor air temperature for buildings #3 and #5 was monitored during August 15th to December 21st. The temperature range for building #3 was 18.5–25.4 °C and for #5 was 22.3–24.9 °C. The outdoor temperatures during this period ranged between 11.1 and 49.8 °C for #3 and between 9.8 and 48.5 °C for #5. The corresponding decrement factors for buildings #3 and #5 are 0.18 and 0.07, respectively. The results show that the indoor air temperature of the shavadan is less influenced by the outdoor temperature. The authors conclude that this stability confirmed the effectiveness of this type of underground constructions.
Mazarrón et al. [16] monitored different existing and functioning in-use wine-cellars in Ribera del Duero (Spain), with Mediterranean continental climate (Csb). The buildings are: #1 a basement below ground level and other facilities; #2 an earth-sheltered construction on ground level but completely sheltered by earth and #3 an underground construction that has been dug straight out of the soil. Building #1 has a cask warehouse of 50 × 17 m2 and the height is 6 m. The longest aisle runs north-east to south-west. All the walls are in contact with earth and there are ventilation openings at two heights on the south-east wall. Building #2 has vaulted tunnels of 13 m wide at the lowest point, and 10 m high in the centre of the arch. The beginning of the nave leads to the exterior and the end “runs into” the earth. The warehouse is 90 × 13 m2. It has several ventilation chimneys distributed along the length of the nave. Finally, building #3 has a tunnel of 100 m long and over 4 m high. Because it is dug in a hill, the average depth varies between 10 and 20 m. The walls leave the bare earth visible as it was excavated. The temperature and relative humidity of the construction was monitored during four years (2006–2009). The decrement factors obtained were 0.33, 0.18 and 0.10 for building #1, #2 and #3, respectively; and the thermal lags were 38, 58 and 51 days for buildings #1 #2 and #3, respectively. The optimal comfort interval is considered as 8–15 °C; >60% RH. During the four years of investigation, the underground construction (#3) was inside this interval 100% of the time, the earth-sheltered construction (#2) the 80% and the basement (#1) only 58% of the time. The study concluded that in areas with large temperature variations, deep underground constructions (>10 m) present the highest capacity to reduce outdoor climate variations and maintain thermal stability all year round. The earth-sheltered construction seems to be the best alternative to the underground construction.
Another article by Mazarrón et al. [17] monitored two underground wine cellars located in the same Ribera del Duero region of Spain. Cellar #1 was monitored during 4 years (2006–2009) and cellar #2 during 2 years (2008–2009). Cellar #1 has a cave area of nearly 10 m2 and a height of 2.4 m dug out at a depth of 2.3 m. There is a chimney for natural ventilation. Cellar #2 has an area eight times larger (84 m2), the ceiling is 9 m deep and the cellar high is 2.5 m. It has also a ventilation chimney in the middle of the cellar. The monitoring results were used to validate the numerical model. No information on the monitoring is presented but comparing the results, a R2 score, of 0.99 and a root mean square error (RMSE) of 0.3 °C is obtained for cellar #1 and a R2 of 0.85 and a RMSE of 0.2 °C is obtained for cellar #1.
Mazarron et al. [18,19] monitored three wine cellars located in Morcuera (Spain) with Mediterranean continental climate (Csb). Cellar #1 has a main cave of 6 m2 and 1.9 m high coated with bricks and a secondary one to one side. The canyon length is almost 9 m and has a 22° slope. It is reinforced with stonework. The cellar ceiling is 3.1 m deep. Cellar #2 has the same distribution as cellar #1. The canyon is 6.5 m long reinforced with stone and has a 30° slope. Cellar #3 is facing north; it has a linear layout with a cave of around 12 m2 and a more than 7 m long canyon and a 31° slope. The monitoring was conducted in 2006 and 2007). The daily, weekly and monthly average values for the air temperature amplitude obtained were 0.2, 0.7 and 2.3 °C for #1; 0.7, 1.6 and 3.4 °C for #2, and 0.2, 0.7 and 2.1 for #3, respectively.
Guerrero et al. [20] also monitored traditional and still in use, wine cellars located in Morcuera (Spain) and exposed to a Mediterranean continental climate (Csb). The authors monitored two wine cellars of different construction type: a top wine cellar (#1) and a bottom wine cellar (#2). Cellar #1 is 16.2 m long and it is excavated in the hillside with no inclination. The façade is made of stones and there is no ventilation chimney. Cellar #2 is 14.7 m long and it is deep under the ground 3.4 m. To access de cellar there is an 8 m long canyon with a slope of 47%. There is a ventilation chimney in the end of the cave. The monitoring period was from 1 July to 7 July, at a time step of 5 min. In cellar #1 the indoor temperature became stable at 11.8 °C having a thermal amplitude of 0.8 °C. In the results section, the authors obtained a decrement factor for cellar #1 of 0.04. In cellar #2, the indoor temperature in the end of the cave remains constant at 9 °C during all the monitoring period although the outdoor temperature varies from 9.8 to 29.4 °C with a thermal amplitude of almost 20 °C. In both cellars, the relative humidity registered was 100% during all the monitoring period.
Zhu et al. [21] monitored an underground cave dwelling located in Miaoshang (China). The area corresponds to a semi-arid climate (BSk). The studied cave dwelling has nine cave rooms surrounding a dug out courtyard along different directions, with the depth of 7.5 m and plane size of 12 m2. A yaokang—an adobe stove to keep the air temperature stable— is installed in the cave rooms. The adobe bricks used in the yaokang are 0.4 × 0.25 × 0.05 m3 and they maintain the heat from cooking to create a comfortable thermal environment inside. The bottom of the kang body is paved with adobe, about five layers in height. The stove is located in the middle front wall of the kang, where it is more convenient to add fuel. During winter analysis the yaokang maintains the indoor air temperature at 10 °C or more, whilst the outdoor temperature ranges from −9.5 to 8.7 °C, obtaining a decrement factor of 0.46. During summer the decrement factor obtained is 0.19. The authors conclude that the cave dwellings with coupled yaokang heating and the massive building envelope adapt themselves to the local climate very well.
In another article, Zhu et al. [22] monitored four caves rooms of the underground cave dwelling located also in Miaoshang (China). The four caves selected are facing north (#1), south (#2), east (#3) and west (#4). To monitor the external conditions, a weather station was installed on the ground next to the building. Air temperature and relative humidity were recorded at different locations of the courtyard (along the depth 0.8, 2.3, 3.8, 5.3 and 6.8 m away from the door; and along the high 0.6, 1.1 and 1.7 m above the floor) and the four cave rooms. The peak temperature of the ground level is deceased by 3 °C in the courtyard because of the underground design. Inside the caves, the average decrement factor during summer is 0.21. The authors conclude that indoor temperature stayed within a comfort range without any active heating or cooling system.
Zhao et al. [23] monitored a four-hole cliff side cave dwelling located in Gongyi (China), where the climate is considered monsoon-influenced humid subtropical (Cwa). The cave dwelling is 7.6 × 3 m2 and the south façade is made of red bricks with the inner wall coated with plaster. The monitoring was conducted during the winter and summer of 2018, in time steps of 10 min. An indoor air temperature and relative humidity sensor was located at 1.7 m height, in the center of the cave dwelling. During the summer analysis the decrement factor obtained was 0.25; and during the winter analysis 0.10. The authors also analysed the influence of air temperature stratification inside the cave dwelling. During summer, the air temperature was higher next to the south façade due to the solar heat gain, and decreased with the depth (30.8–26 °C, respectively); and during winter the highest temperature is recorded in the deepest and highest part of the cave and decreased to the south façade where the entrance is located (12.6–8.7 °C, respectively). The authors conclude that cliff-side cave dwellings adapt themselves to the local climate very well.
Wang et al. [24] monitored a typical courtyard style cave dwelling located in Jiang Yao Zu (China), where the climate is considered humid continental influenced by monsoon (Dwa). The dwelling was built against a south-facing hill slope and has three courtyards on different levels along the hillside. The top-courtyard was the only one measured and it is surrounded by five cave rooms, to its north; three to the east and west, and two to the south. The courtyard is approximately 19.5 × 14.4 m2, and the cave rooms were 3–3.8 m high and have 1 m of earth covering the ceiling. The monitoring period was during wintertime of 2000. The authors monitored an occupied cave room and an unoccupied cave room obtaining decrements factors of 0.057 and 0.4, respectively. It is important to notice that the occupied cave room has higher average temperature (14 °C) than the unoccupied cave room, although the thermal amplitude is higher for the occupied cave room. For a period of 24 h, the authors obtained a thermal lag of 0.58 h for the courtyard. The authors conclude that due to the huge thermal inertia, the indoor air temperature is rather stable. Temperate heating activities, such as cooking, will be able to keep indoor air temperature above 11 °C during the night and 16 °C during daytime.

4.1.2. Earthbag

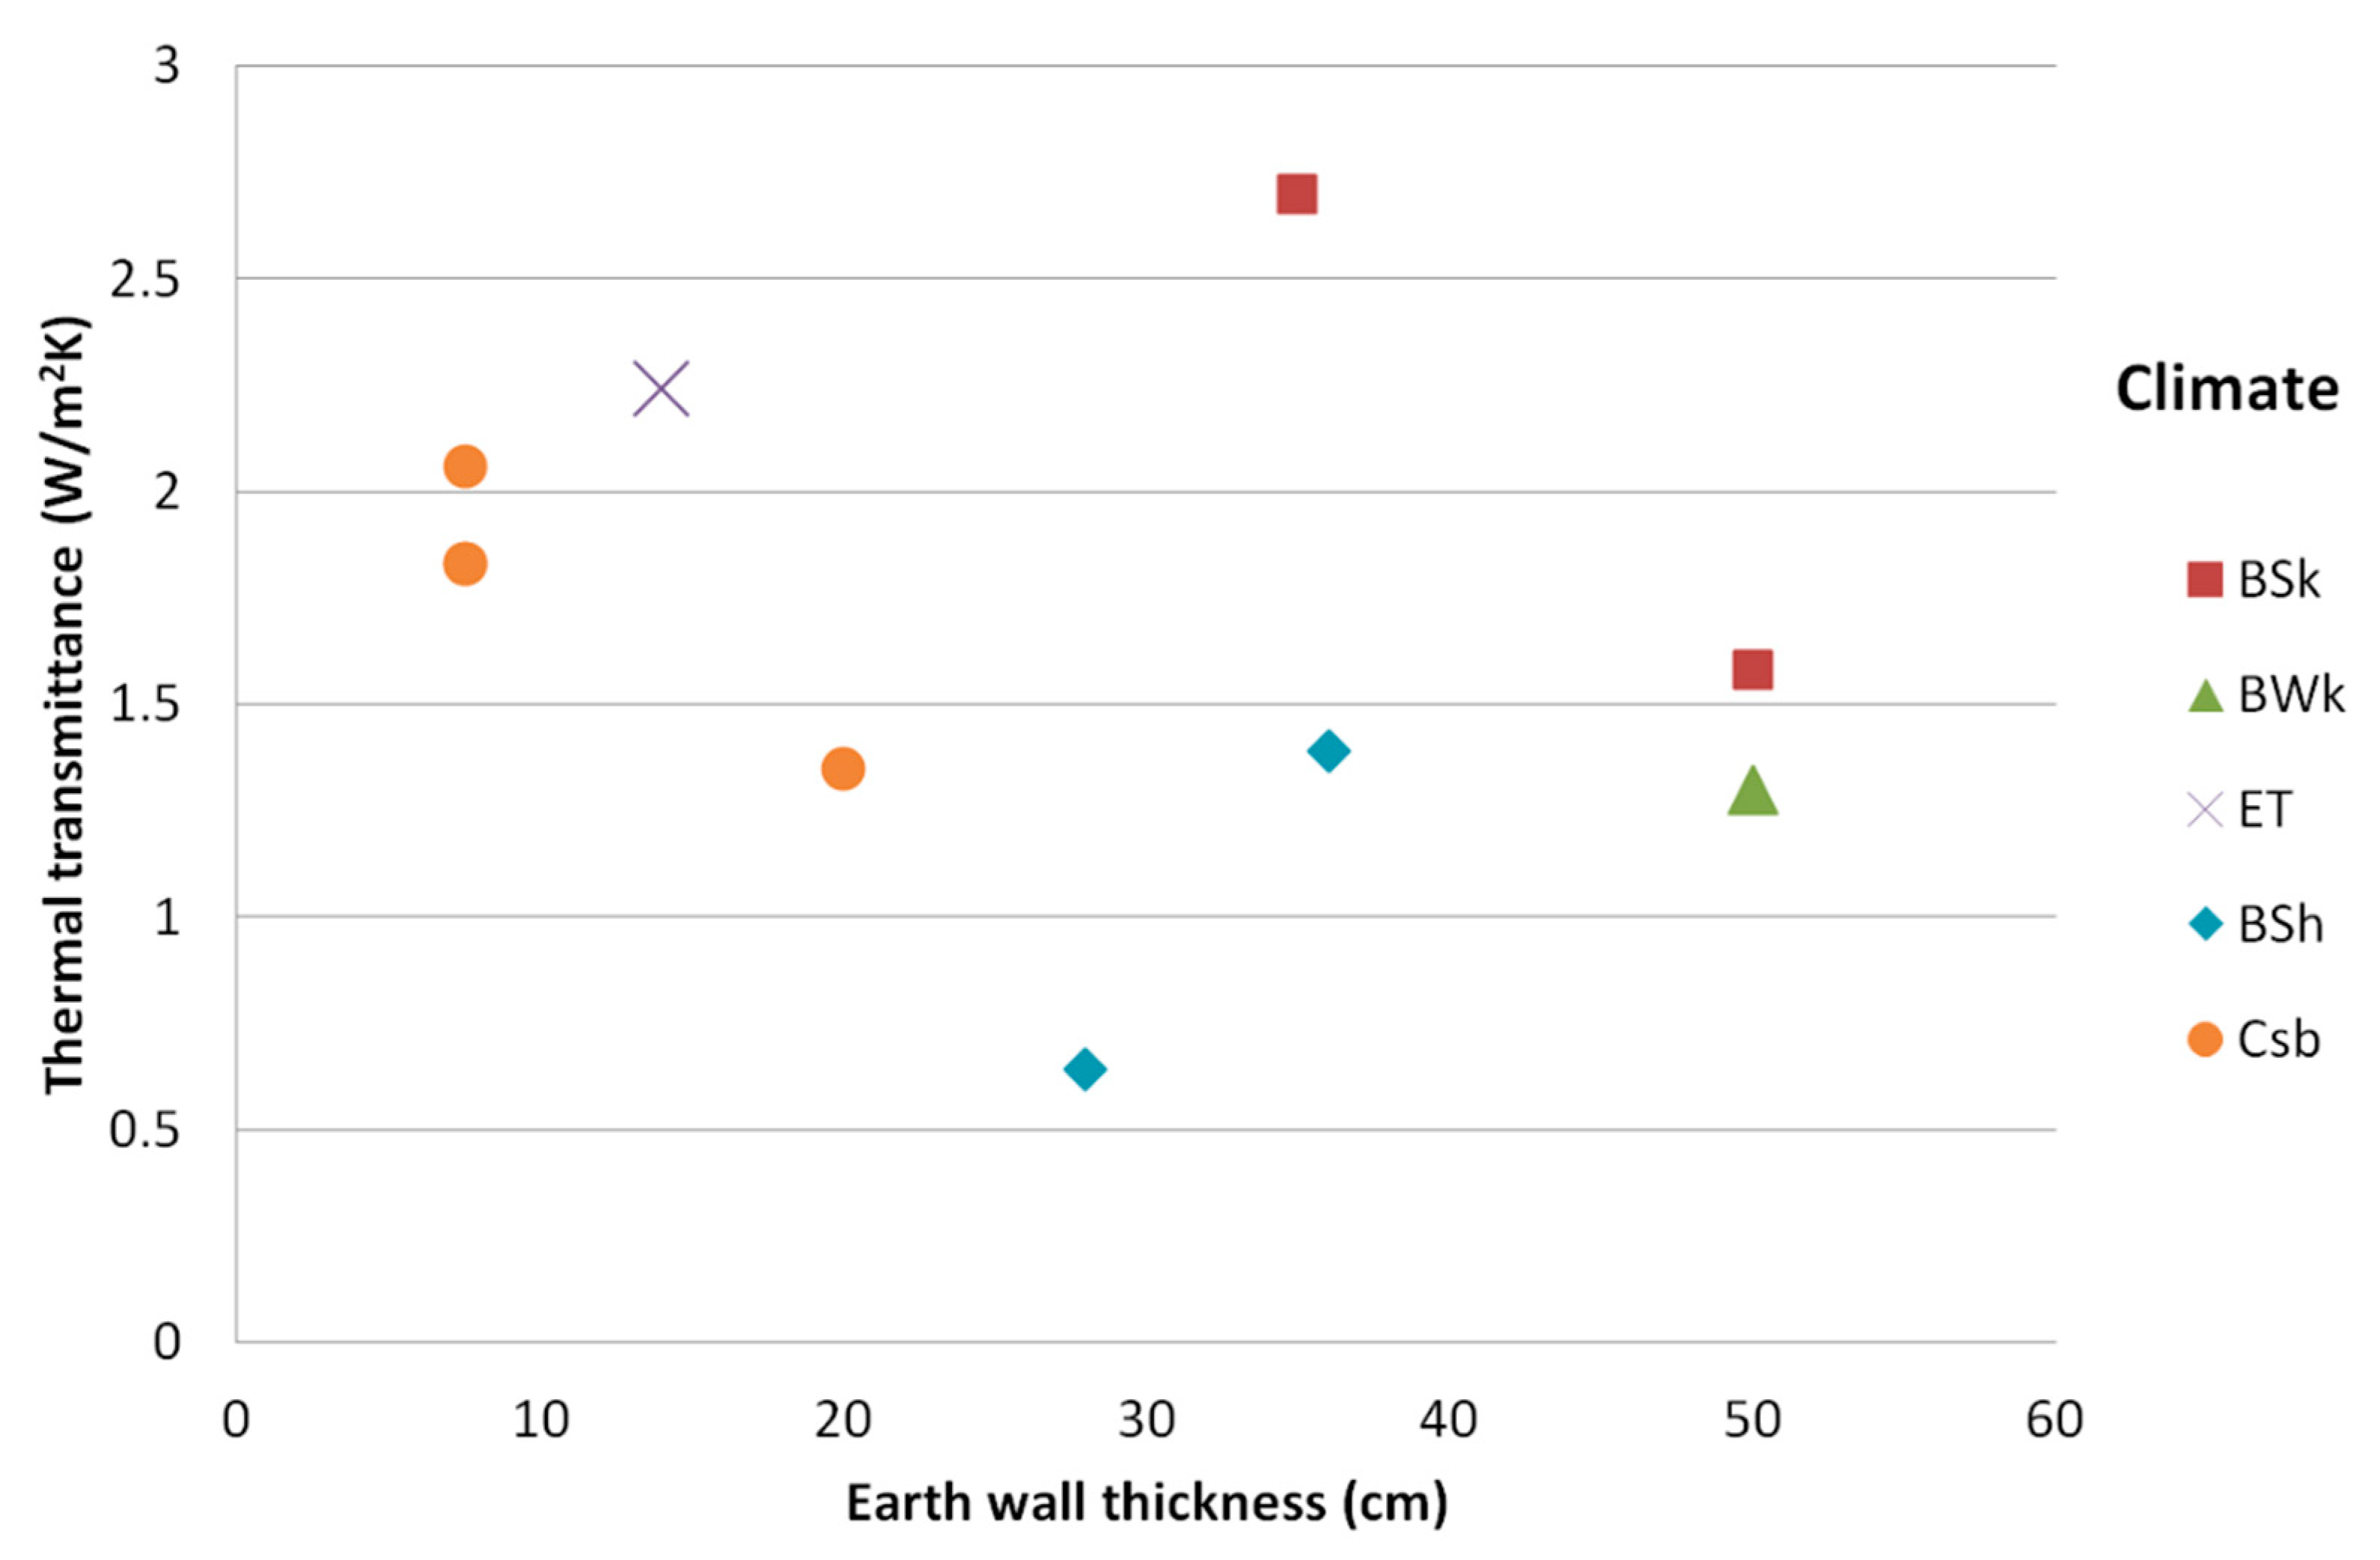
Rincón et al. [13] present an experimental earthbag building located in Lleida (Spain); corresponding to a Mediterranean continental climate (BSk). The earthbag prototype has a dome shape of 3 m of diameter and a high of 3.3 m. The walls consist of different earthbag thicknesses—70 cm for the buttress, 35 cm for the wall and 28 cm for the roof—and an exterior lime mortar coating of 0.4 cm. The monitoring has been conducted under different scenarios: (1) air stratification, (2) free floating temperature with no ventilation, (3) natural cross ventilation, and (4) winter controlled temperature. The air stratification scenario shows an increase of 1.4 °C and 2.8 °C, from the bottom to the top of the dome, in summer and the equinox, respectively. The authors calculated the thermal lag and the decrement factor for winter, equinox and summer solstice, during the free floating scenario. Values between 8–9 h for the thermal lag are obtained, as expected from the theoretical results (8.1 h). Moreover, the theoretical result for the decrement factor is 0.12, and the values obtained from the monitoring analysis are 0.12, 0.19 and 0.10, for winter, equinox and summer solstice, respectively. According to [13], night ventilation, from 8 p.m. to 8 a.m., takes advantage of the cooler temperatures at night to decrease the average temperature of the earthbag building, making it an appropriate passive strategy for cooling. In addition, a 24 h ventilation in summer was tested. Experimental results showed that this is not a good cooling strategy since thermal loads provided during midday and afternoon hours were too high to be compensated during night and first morning hours. The controlled temperature scenario in winter is obtained by a heater providing a fixed indoor temperature of 21 °C inside the dome. Within this scenario the experimental thermal transmittance of the wall was calculated, obtaining 2.7 W/(m2·K). In addition, Ref.[13] assesses comfort conditions in the earthbag dwelling applying the ASHRAE Standard 55 Adaptive [25] comfort model during summer. The analysis resulted that most of the points are either within the comfort adaptive range or only a bit above the upper limit (0.5–3 °C) or slightly below the lower one (0.5 °C). Concluding that the earthbag dwelling has a good thermal performance during summertime in hot semi-arid climates. However, the authors observed that in Mediterranean continental climates, despite the passive design strategies it requires a heating system during wintertime to achieve the desired thermal comfort levels.

4.1.3. Rammed Earth

In-Use Buildings

Soudani et al. [26] monitored a real house occupied by five persons, located in Saint-Antoine l’Abbaye, in Isère (France) with a temperate oceanic climate (Cfb). It has a living area of 150 m2, over two floors, a cold attic and its envelope is composed of four non-insulated load bearing walls of rammed earth, exposed to the south, east and west, and a north-oriented timber-frame wall. The non-insulated rammed earth walls are 50 cm thick and 3 m high. 2.5% of lime was added to the soil before compaction to improve its resistance against water. The thermal conductivity was measured in the laboratory obtaining 2.4 W/(m·K) just after manufacturing and 0.6 W/(m·K) when the rammed earth was completely dried. The authors covered the monitoring from March 2013 to June 2015. According to the results the authors concluded that for all seasons the thermal lag varies from 6 to 9 h and the decrement factor from 0.09 to 0.2.
Allinson et al. [27], monitored a stabilized rammed earth building located in Leicestershire (UK), with a temperate oceanic climate (Cfb). The wall has an inner and outer layer made of 175 mm of stabilized rammed earth (crushed ironstone quarry waste and grit sand) and a 50 mm layer of extruded polystyrene insulation. The monitoring period was during one full year. Weather conditions were taken from a personal weather station 7 km south of the rammed earth building. The authors do not provide information on thermal comfort but the experimental thermal conductivity (for a dried sample) of the rammed earth wall is 0.643 W/m·K.
Taylor et al. [28] monitored a curved office building oriented to the south, with load bearing 300 mm thick rammed earth walls. It has two floors with a long corridor in the middle and offices in both sides (typically 10.5 m2). The building is located in Thurgoona Campus of Charles Sturt University in Albury-Wodonga (Australia), corresponding to a humid subtropical (Cfa) climate. The authors do not provide thermal parameters but they present a wide study on the thermal comfort of the offices. Thermal comfort under summer conditions was analysed by monitoring three offices. The ground floor office (Office A) was within the ASHRAE [25] thermal comfort range with 73% of the time having an average temperature of 23.7 °C; the other two offices located in the first floor, had an average temperature of 1–2 °C higher, but the one located in the northwest corner (Office C) had a median temperature 1.3 °C higher than Office B, which had the window opened 22% of the time. The authors stated that Offices B and C are between comfort zones longer than Office A, 76% and 81%, respectively, although they recorded temperatures upper and lower the limits of comfort zone. The authors conclude that just 13% of the time, Office A reached the comfort limits indicating that the heating system failed often. For Offices B and C, the average temperatures were approximately 1.8 °C higher than Office A, being within the limits of the comfort zone 69% of the occupied hours for Office B and 70% for Office C.
Another author that monitored rammed earth buildings in Australia is Soebarto [29]. In this case the houses are located in Willunga, about 50 km south of Adelaide corresponding to a cold dry-summer (Csb) climate. Soebarto presents three constructions: House A (occupied by two people mainly on weekends and at night time) corresponds to a 104 m2 of 220 mm of external rammed earth blocks and 110 mm internal rammed earth bricks; House B (occupied by one person) corresponds to a 96 m2 construction using rammed earth blocks of 330 mm and 220 mm for external and internal walls, respectively; and House C (occupied by five people) has 175 m2, the external walls are 110 mm rammed earth bricks exposed internally and clad externally with a fibre cement sheet, an R2 insulation and a 25 mm air gap in between. In any case there is a mechanical cooling system and a portable heater (House A and B) and a gas heater (House B) was used occasionally during monitored time. In addition, in House C there is a solar heat storage system in the roof and ducted to the rooms. The purpose of monitoring the building was to calibrate the simulated model; it does not provide thermal information. The author confirms the results from other studies on the performance of similar wall material. She concludes that using insulated rammed earth walls a reduction of 29% is obtained in terms discomfort degree hours annually compared to uninsulated rammed earth walls.
Palme et al. [30,31] monitored a real rammed earth house located in San Pedro de Atacama (Chile), corresponding to a cold desert climate (BWk). The monitored house has 50 cm thick rammed earth walls and an earth roof of 15 cm thick. It has single glazed windows and wood doors. The theoretical thermal transmittance of the wall is 1.3 W/(m2·K) and 2.3 W/(m2·K) is considered for the earth roof. Temperature and relative humidity were measured inside and outside the building. Results show that in summertime the rammed earth assures a high decrement factor: 0.14 with only 1.5 °C oscillation, whereas in wintertime the decrement factor obtained is 0.13, almost the same as for summer. The authors conclude that results confirm the suitability of earth as a construction material in terms of thermal decrement, thermal lag, insulation properties, and solar radiation gain.
Balaguer et al. [32] monitored a real rammed earth house located in La Serranía, a region in the northwest of the province of Valencia (Spain) from 24 June to 23 August 2017. The climate in this region corresponds to a cold semi-arid climate (Bsk). It is a 345.5 m2 dwelling, distributed in three floors with low proportion of openings on the façades, consisting of a rammed earth wall with gypsum and cement mortar with a total thickness of 50 cm and a U-value of 1.58 W/(m2·K). The thermal lag observed is 5–8 h when exterior temperature surface is increasing and 1–2 h when it is decreasing. The maximum oscillation of the indoor surface temperature is a twelfth of the oscillation of the exterior temperature, which provides a decrement factor of 0.08. The authors also emphasize the correlation between the tendency of the exterior temperature and the interior temperature, when a sudden temperature change happens. The earth buildings have a high thermal inertia so the influence of the external weather trends inside the building is noticed after 2–6 days.

Experimental Buildings

In Spain, Serrano et al. [33] studied two prototype buildings located in Barcelona (#1, Mediterranean central coast climate, Csa) and #2 in Puigverd de Lleida (Mediterranean continental climate, Csa/Cfa). Prototype #1 has 2.48 × 2.15 × 2.50 m3 inner dimensions and #2 has 2.40 × 2.40 × 2.40 m3 inner dimensions. The wall thickness is 50 cm and 29 cm, respectively. The prototypes were analyzed under free floating conditions in two representative days (summer and winter). The inner south wall surface temperature in #1 is very constant along the day; 2 °C of thermal amplitude during summer and 0.5 °C for winter period. However the external surface temperature changed by 5 °C in summer and 1 °C in winter for the days studied. On the other hand, the inner surface wall of prototype #2 has 3.5 °C of thermal amplitude in summer and 5 °C in winter periods, whilst the thermal amplitude in the outer surface walls is 15 °C in summer and 17 °C in winter. It denotes a high thermal inertia, having decrement factors of 0.2 and 0.25 for summer and winter periods in #1, and 0.23 and 0.3 for #2. The authors conclude that in spite of the thermal amplitude of the outer surface temperature along the day, the temperature of the inner southern surface wall tends to be constant in both cubicles.
In another study, Serrano et al. [34] monitored seven cubicles of 2.40 × 2.40 × 2.40 m3 located in Puigverd de Lleida (Spain) with a Mediterranean continental climate, Csa/Cfa. Two of them were built with sustainable construction systems based on the use of raw earth and wood. Cubicle #1 (rammed earth, RE) has a load-bearing rammed earth walls of 29 cm and cubicle #2 (insulated rammed earth, IRE) has the same construction as RE, but the walls are insulated with natural wood fibers panels of 6 cm and 1 cm of natural coating based on clay and straw. The cubicles were monitored under free floating condition and using a set point of 21 °C in summer and winter periods. Free floating results during summer period show high indoor thermal amplitude between day-night for #1 and amplitude less than 1 °C for #2. Controlled indoor temperature results show a higher consumption for the non-insulated cubicles (#1) than for the insulated (#2). According to the winter period analysis, the inner thermal amplitude is highly influenced by the outdoor conditions. For #1 the inner thermal amplitude is about 1–2 °C with a decrement factor of 0.17; cubicle #2 has an inner thermal amplitude lower than 1 °C with a decrement factor of 0.11. The authors conclude that the electrical energy consumption during this period was very high in all the cases, but it is important to highlight that the lowest energy consumption was registered in #2 (IRE) cubicle. They also state that traditional materials as earth and wood, which are sustainable and environmentally friendly materials, can be adapted to the current constructive requirements, because as it is proved in this study the IRE cubicle has similar thermal behavior as a conventional construction system insulated with extruded polystyrene.
Beckett et al. [35] studied two houses with identical floor plans and orientation located in Kalgoorlie-Boulder in Western Australia with an arid climate (Bwh). The houses were constructed to promote beneficial passive solar behavior and high thermal mass walls. #1 has a 30 cm thick monolithic rammed earth wall and #2 has a 30 cm thick insulated rammed earth walls in the kitchen and bathrooms. Temperatures and relative humidity are collected from the walls, surfaces and inner spaces within a time step of 5–10 min. Results show a decrement factor between 0.103–0.191 for #1 and 0.108–0.147 for #2. According to the thermal lag, values within the range 0.364–1.5 h for the #1 and 0.480–0.949 h for #2 were found. The authors noticed that those values are below the literature ones but they suggest it might be caused by the spatial structure of the house, because in the literature a single space is monitored or simulated and in this case it was a real house distribution.

4.1.4. Compressed Earth Blocks

Miño et al. [36] analysed a residential unit from Zumbahua (Ecuador) where the climate in this region is considered to be tundra climate (ET). The residential unit is built with compressed stabilised earth blocks (CSEB), but no information of the type of stabilizer used is provided. The CSEB walls have a theoretical thermal transmittance (U-value) of 2.24 W/(m2·K), composed by 14 cm thick and a plaster coating with an unspecified thickness. In the results section Miño et al. obtained a decrement factor of 0.6 and a thermal lag of 2.5 h when it is considered the maximum indoor temperature, but the minimum indoor temperature is reached 1 h after the outdoor minimum temperature.
Ouedraogo [37] analysed the thermal phase shift time and the damping factors of building walls to assess thermal comfort in a building located in Burkina Faso, a country with a hot semi-arid climate (BSh). In his study, Ouedraogo analysed the combination of earth with other materials like paper or cement, for constructing the compressed earth blocks (CEB). The thickness of the CEB analysed is 14 cm, except for those with double sheet walls (28 cm), and the thermal conductivity varies from 0.588 W/(m2·K) for the earth with paper, 0.644 W/(m2·K) for only the earth, 0.671 W/(m2·K) for the earth with cement and paper, and 0.742 W/(m2·K) for the earth with cement. The percentage of the different materials in the mixture is not provided by the author. Ouedraogo concluded that the best thermal performance is achieved with double sheet walls with insulation since they have large thermal phase shift time, low damping factors and the weakest internal thermal amplitudes. He obtained decrement factors in the range of 33.54–44.3% and thermal lags of 6–7 h, being the optimum solution the mixture of earth with paper.
Brambilla et al. [38] monitored, during summer 2016, a prototype located in Fribourg (Switzerland), with an oceanic climate (Cfb). The dimensions of the prototype are 6.2 × 3.2 × 3.11 m3, and the exterior wall is composed by a 14 cm wooden structure, with 18 cm of insulation and 14 cm of compressed earth blocks (0.79 W/m·K). The prototype represents an office building, so similar internal gains profiles have been considered using timed light garlands. The average indoor thermal amplitude is 3.1 °C, the decrement factor is 0.18 and the thermal lag 2 h. Local thermal comfort has been assessed with SIA 180:2014 [39]. The authors conclude that all of the occupied hours are inside the appropriate comfort domain and the use of CEB walls can reduce internal temperatures up to almost 3 °C, maintaining comfortable indoor temperatures.
Zhang et al. [40] studied the hydrothermal characteristics of the compressed earth blocks and then monitored three rooms of an existing residential building located in Turpan (China) where the climate is considered as desert (Bwk). The exterior walls are earth blocks 400 mm thick with a 15 mm thick external cement-lime mortar. The locations of the rooms studied are at ground floor, semi-underground level and first floor. The monitoring period was from 1 August to 4 August 2016. Not much information on the thermal behaviour is provided since the monitoring was only used to validate the numerical model, but in the results section, the authors state that the obtained thermal amplitudes are about 2.5 °C for room 1, 0.5 °C for room 2 and 2 °C for room 3.

4.1.5. Adobe

Regarding adobe studies, some authors have monitored in-use buildings and others experimental prototypes only for research purposes.

In-Use Buildings

Palme et al. [30,31] monitored a real house in San Pedro de Atacama (Chile), with typical hot dry days and cold nights all year, corresponding to a cold desert climate (BWk). The house analyzed is a family dwelling composed of a bedroom and a small lavatory. The enclosure of the building is built with 30 cm thick adobe walls, a rammed earth roof of 15 cm and wooden doors. Indoor and outdoor temperatures and relative humidity were monitored. During summer time 2012, results show a thermal lag lower than 3–4 h with an oscillation of just 1.5 °C. Regarding the decrement factor, a value of 0.29 is obtained. During winter time, the internal temperature amplitude is 6 °C, oscillating from 12–18 °C. The decrement factor obtained is 0.27, almost the same as summer time, but in this case the thermal lag is closed to zero because as reported in [41], for colder external temperatures the solar heat gain through a glazed surface is the responsible of increasing the indoor temperature. As a principal conclusion, the authors confirm the goodness of earth as a construction material in terms of thermal decrement, thermal lag, insulation properties, and solar radiation gain-use.
Another study that monitored an adobe in-use building is Desogus et al. [42,43]. The authors monitored a private residential building in Serramanna (Italy) corresponding to hot-summer Mediterranean climate (Csa). The experimental data were recorded during summer 2010 at 10 min intervals. They collected the indoor temperature of the living room (floor area of 24.5 m2) and the bedroom (floor area 14.7 m2). Applying the standard ISO 13,786 [44], the authors present the dynamic thermal characteristics of 40 cm thick adobe walls (theoretical values), as the following: thermal transmittance equal to 0.127 W/ (m2·K); decrement factor of 0.098 and a thermal lag of 14.5 h. However the results obtained from the monitoring are: 0.11 for the decrement factor and no value is specified for the thermal lag. The authors also analyzed deeply the thermal comfort using the Fanger method [45] and the results show that in the living room 99% of the time the indoor conditions are within the comfort limits and for the bedroom 87% of the time. They conclude that the adobe-made building has proven to be able to maintain satisfactory levels of thermal comfort and internal temperatures close to the design set points of air conditioning systems.
Zhang et al. [46] monitored a quadrangle adobe dwelling in the province of Gansu (China) with a semi-arid to continental climate, BSk or BWk. The thickness of the wall is not specified and the monitoring period goes from December 8th–30th. The decrement factor of the building is 0.265. The authors emphasised the high relation between the indoor and the outdoor temperature. The thermal lag is 1 h for the west wall. The Predicted Mean Vote (PMV) method to assess thermal comfort indicates it to be very poor, since, according to this method the thermal comfort falls into the -2 category (cool). The authors conclude that the adobe dwelling holds poor indoor thermal comfort and that heat transfer coefficients of walls and roof go out of limits, significantly.
Martín et al. [47] monitored a traditional adobe building located in Navapalos (Spain), with a warm-summer Mediterranean climate, Csb. The south façade, except one stone part, is made of a juniper wall columns filled with adobe blocks (U = 1.35 W/(m2·K)) of 40 × 20 × 15 cm3 and 1 cm plaster. The openings are wooden framed with single glazed and most of them are oriented to the south. The monitoring was conducted for both, the summer period and the winter period. The average decrement factor during wintertime is 0.12 and during summertime is 0.13. Regarding the relative humidity, most of the time it is monitored between the comfort limits (30–70%), having some spots upper this comfort during wintertime and some below the limit during summertime. The authors assessed the thermal comfort by means of cumulative distribution function (CDF). The results show an indoor CDF almost vertical, which is typical of buildings with high thermal inertia. The cross point between the indoor and outdoor CDF is 7 °C for winter and 21 °C in summer, it means that there are more registered values above 7 °C in winter and above 21 °C in summer inside the adobe building than outside. In the conclusions, the authors state that the indoor environment in the adobe house is inside comfort zone during summer but below the comfort limits during winter.
Chel et al. [48] monitored a passive house located in New Delhi (India) with a semi-arid climate, Bsh. It consists of six rooms (three inverted U-shaped rooms and three dome shaped rooms) constructed with adobe and stabilized mud block bricks with a total thickness of 36 cm, and U-value of 1.39 W/(m2·K). Two representative days were selected to assess the thermal behaviour during winter and summer. Because of their sun-exposed areas the dome shaped rooms have higher indoor temperatures (by 1–2 °C) than the U-shaped rooms. The experimental results show that the average decrement factor is 0.33 and 0.28 for winter and summer, respectively. However, peak values of 0.28 for harsh winter and 0.18 in summer were reached.
Algifri et al. [49] monitored two traditional Yemeni adobe houses (55 cm adobe + 0.5 cm of mud plaster) of the same plinth area and cubic volume, located in two Yemeni cities: Sieyoung (Case #1) and Lahaj (Case #2), BWh in both cities. The results are presented for 24 h analysis in summer and winter. The thermal lags in the south façade for #1 are 12–15 h and 12–14 h and for #2 are 12–16 h and 17 h for both summer and winter periods, respectively. Regarding the decrement factor, following the same order, the results obtained are 0.01 for both summer and winter for case #1, and 0.02 and 0.05 in case #2. The authors conclude that the thermal amplitude of the inner surface in any case is higher than 0.5 °C, except from the roof which is 3.8 °C.

Experimental Buildings

Heathcote [41] monitored a one space prototype building of 4 m2, with 250 mm thick adobe walls stabilized with bitumen. The roof was insulated with R3. The author presented a theoretical thermal conductivity for the 250 mm adobe wall of 0.82 W/(m·K). The building is located in Australia, but the exact location and the climate are not specified. According to the solar irradiance of the adobe building, the author assumes a thermal lag of 8 h having the maximum internal temperature at 5 pm. The internal temperature analysis is presented for both, summer performance and winter performance. In summer the thermal amplitude of the internal temperature is 4 °C. The thermal lag obtained is about 5–6 h between the maximum external temperature (2 pm) to the maximum internal temperature (7–8 pm), whilst the decrement factor is 0.27 having a maximum indoor temperature of 26.9 °C. The winter analysis shows that when the outside temperature is relatively low there is a very little heat gain through the earth walls and the indoor temperature is driven by the solar heat gain through the glazing, as the thermal lag is reduced to 3–4 h. The amplitude of the indoor temperature is about 4 °C and the decrement factor in this case is 0.33. The author concludes that thermal resistance of the wall increases exponentially with thickness but he recommends not increasing the wall thickness more than 450 mm. Another option is considering adding a polystyrene layer (50 mm) in the center of the wall, having a thermal resistance equivalent to a brick veneer wall with R1.5 insulation.
Meneses et al. [50] analyze three prototypes of one space area of 1 × 1.35 × 0.75 m3, with adobe bricks of 11.25 × 7.5 × 3.75 cm3. Different adobes are tested in each prototype: #1 adobes produced in the lab, #2 adobes taken from a demolished construction in Aveiro (Portugal) and repaired in the lab and #3 adobes produced in the lab adding 2% cork. The experimentation was conducted during May (warm-summer Mediterranean climate Csb). The results presented correspond to the experimental days: 1, 5, 10, 13, 21. After three weeks of experiments, the thermal lag of the prototypes are 3 h 16 min, 2 h 17 m and 2 h 05 min, corresponding to prototypes #1, #2, #3, respectively. Following the same order the decrement factor is 0.71, 0.66 and 0.6. In the result section the authors calculate the U-value of the prototypes using the RCCTE [51] and the DIN EN ISO 6946 [52], obtaining the following values: 2.06 W/(m2·°C) and 2.22 W/(m2·°C) for #1; 1.83 W/(m2·°C) and 1.95 W/(m2·°C) for #2 and 1.47 W/(m2·°C) and 1.65 W/(m2·°C) for #3.
Michael et al. [53], presented the monitoring results of a 50 cm thick adobe wall located in Cyprus with a hot semi-arid (BSh) climate. They obtained a thermal lag of approximately 5 h within a period of 24 h, having the maximum internal surface temperatures around 8 pm, while maximum external surface temperatures around 3 pm. The decrement factor is below 0.05 both for summer (0.03) and winter (0.008). The authors conclude that the high thermal lag and the low decrement factor confirm the stability in the interior environment of adobe structures.

4.1.6. Extruded Earth

Fgaier et al. [54] monitored a 20 m2 one space prototype using unfired clay bricks of 22.2 × 10.4 × 6 cm3, with a density of 1788 kg/m3, and a thermal conductivity of 0.9 W/m·K in the Lille (France) area, corresponding to an oceanic climate, Cfb. The thickness of the walls varied from 46 cm to 60 cm. Measurements were taken from 26 July 2012 to 12 July 2013 in the northeast wall (46 cm) and the southeast façade (60 cm). A decrement factor of about 0.2 and a thermal lag of 10 h are obtained. The authors noticed changes in the thermal behaviour in the beginning and at the end of the measurement period. They highlight the influence of the drying masonry decreasing approximately 3 °C the indoor temperature, increasing the feeling of comfort. In addition, the prototype reached −5 °C in the indoor wall during cold periods which shows that unfired clay bricks are not a good insulating material.

4.1.7. Poured Earth

Aranda-Jiménez et al. [55] are the only authors who monitored a poured earth in-use building. The building monitored is a prototype of sustainable housing designed for the city of Tampico, Tamaulipas at Mexico, with a tropical savanna climate (Aw). Surface interior and exterior temperatures were registered during 9 months. In their work the monitoring of the month of August is presented. The poured earth walls are 0.25 m thick and have not presented neither structural problems, nor deterioration or disintegration, and they have endured by the inclement winter and two weeks of continuous rain. The results show a thermal lag of 1 h and a difference between internal and external temperatures of approximately 8 °C, but with some peaks up to 12 °C. The authors also present an experimental value for the thermal transmittance equal to 0.71 W/(m2·K) for the wall.

4.1.8. Earthship

Freney et al. [56] monitored an Earthship building in Taos, New Mexico, with a warm-summer humid continental climate (Dfb). The authors recorded the indoor air temperature at an interval of 1 h during 2012. The Earthship has 160 cm thick and a thermal transmittance of 0.613 W/(m2·K). In the results section the authors obtained a decrement factor of 0.13 during summertime and 0.33 for wintertime.
Ip et al. [57] monitored The Brighton Earthship, located in Brighton (UK) with a temperate oceanic climate (Cfb). The authors recorded the indoor air temperature at an interval of 1 h during 2004–2005. The exterior wall construction is made from tyres filled with rammed earth with a thickness of 100 cm. The authors obtained a decrement factor of 0.37 during summertime and 0.625 for winter period. Ip et al. studied the thermal comfort of the building according to the ASHRAE 55 adaptive comfort model [25]. The authors conclude that the monitored results show that for 80% of the time the bedroom air temperature was very comfortable, between 20 and 24 °C. Only briefly early in the morning, for less than an hour, were the coldest temperatures experienced, followed by a steady rise in temperature until comfort level was attained. This indicates that active heating is unnecessary as the temperature naturally rises to the comfort range.

4.2. Simulations

4.2.1. Earthen Dug Out

Porras et al. [14] simulated the same building located in San Esteban de Gormaz (Spain) presented in the previous section. The CFD software used for the simulation was STAR-CCM + and the natural ventilation was estimated to be 0.37 ACH for cold periods and 0.3 ACH for warm periods. The simulation shows for the cold period, an intense natural ventilation coming from the bottom of the tunnel that conditions the space. The average air velocity inside the underground construction is 0.035 m/s while in the cave is 70% less. In the warm period, the average air velocity inside the underground construction is 0.012 m/s while in the cave is 83% less. The authors conclude that due to the thermal inertia of the surrounding terrain, the underground building tends to maintain the temperature fairly homogeneous at 10.5 °C throughout the year.
Mazarrón et al. [17] simulated with EnergyPlus the two underground wine cellars located in Ribera del Duero described in the previous monitoring section. The geometry of the constructions is simplified as the following: cellar #1 is 5 × 2 × 2.4 m3 and cellar #2 is 20 × 4.2 × 2.5 m3. Both models have four openings for the chimney and openings in the door with the same size as the real ones. They also have an entrance gallery with an adiabatic envelope. The weather data is taken from the EnergyPlus data base and the exterior air temperature was modified with a nearby weather station located in Soria. In addition, the models were tested in 20 different locations to cover as many climates as possible. The selected regions are the following: Bordeaux, Burgundy, Loire Valley (France); Torino, Foggia, Sardinia (Italy); Rioja, Cádiz (Spain); Northern California, Southern California, Pacific Northwest (United States of America); Porto, Lisbon (Portugal); Melbourne, New South Wales (Australia); Cape Town (South Africa); Frankfurt, Wuttemberg (Germany); Santiago de Chile (Chile) and Vienna (Austria). The decrement factor oscillates between 0.19 and 0.35 (average 0.28) for cellar #1 (mean depth 3.5 m) and between 0.05 and 0.11 (average 0.08) for cellar #2 (mean depth >10 m). The thermal lag varies between 39 and 63 days (average 49) for cellar #1 and between 63 and 92 (average 78) for cellar #2. The authors conclude that for any location a desired annual variation of temperature can be obtained by adjusting the depth of the cellar according to the thermal properties of the ground. Amongst the studied cases, the annual range of interior temperature in less deep cellars only surpasses 10 °C in 2 out of 20 locations, and remains lower than 5 °C in all deeper cellars.
Zhu et al. [22] simulated the underground cave dwelling located in Miaoshang (China) previously discussed in the monitoring section. The model was developed with Sketchup software and only cave #1 (facing north) was modelled. The weather data were taken from Lushi country (about 90 km away from Miaoshan) and EnergyPlus was used for the simulation. To validate the model, the results predicted were compared to the experimental data from summer 2016, srping 2016 and winter 2017. The authors evaluate the annual dynamic behaviour obtaining that the outdoor temperature ranges from −14.9 to 36.9 °C whilst the indoor cave temperatures range from 5.6 to 31.2 °C. They also evaluate the annual thermal performance of the cave dwelling obtaining a 42.8% of the whole year in comfort zone II according to the Chinese standards [58]. The average deviations between monitored and simulated results were 0.54%, 3.08% and 3.1% for summer, winter and spring, respectively. The authors conclude that climate responsive strategies used in ancient underground cave dwellings are still applicable and they can certainly be used in modern building designs.
Zhao et al. [23] simulated with EnergyPlus the four-hole cliff side cave dwelling located in Gongyi (China) previously defined in the monitoring section. The weather data were taken from an “.epw” weather file of Zhengzhou city (Gongyi city belongs to Zhengzhou city). To validate the model, the normalized mean bias error (NMBE) and the coefficient of variation (CV) of the root mean square bias error (RMSE) were assessed. The values obtained for the NMBE were 0.6% (summer) and 2.6% (winter) and the CV (RMSE) values were 4.1% (summer) and 6.1% (winter). All those values are below the maximum requisite specified of 25% by ASHRAE [25]. The authors used the simulation to calculate the thermal transmittance and the thermal lag of the cave roof, the south façade and the interior wall obtaining the following values: 0.067, 1.72 and 0.2 W/(m2·K) for the thermal transmittance, respectively and 360.15, 10.06 and 109.04 h for the thermal lag, respectively. The authors conclude that according to the thermal comfort the cave dwelling is in comfort zone II for 52.5% of the year according to Chinese standards [58], mainly between May and November.
Wang et al. [24] predicted the indoor air temperature of the cave dwelling monitored in Jiang Yao Zu (China) and previously defined in the above section. The U-value used for modelling the cave rooms were 5, 2.33 and 1.56 W/(m2·K) for the window, door and earth wall, respectively and the ventilation ratio was defined as 0.43 ACH. The deviation between predicted and monitoring data was 1.7% for the courtyard mean daily temperature; 16 and 8.5% for the south and west cave dwelling daily mean temperature, respectively. The air temperature amplitude for the courtyard was less than 10 °C for both monitoring and predicted studies, in particular 9.98 and 9.21 respectively with a deviation of 8.4%. The thermal lag for the courtyard predicted was 0.5 h. In the conclusions, the authors encourage architects, designers, developers and local governments to re-evaluate courtyard style cave dwelling and many other traditional dwellings, particularly on their merits of sustainability.
Asadi et al. [59] conducted a simulation of a real house located in Yazd (Iran) corresponding to a tropical and subtropical desert climate (Bwk). The simulation was conducted under free floating conditions with natural ventilation without any heating or cooling equipment as the real situation of the studied house. The geometry was modelled with ECOTEC and imported to EnergyPlus v8.0. The energy performance was conducted for the hottest day and the coldest day. During summer the underground spaces obtained indoor air temperatures of about 19–25 °C, closed to comfort range and decrements factors of 0.03–0.08. For winter, indoor air temperatures of the underground spaces are almost constant around 14 and 17 °C, so the decrement factor is not calculated. But it is important to notice that although the indoor air temperature does not change during the day, the outdoor air temperature has a range of 9.5 °C from −7.5 to 2 °C. The monitoring to validate the model was during July. The root mean square errors (RMSE) obtained are 0.26, 0.19, 0.84 and 0.97 for the wind catcher room, cellar, coastal and Panjdari, respectively. The authors conclude that the RMSE is not significant, which indicates there is a good agreement between predicted and observed data.

4.2.2. Earthbag

Rincón et al. [13] used the EnergyPlus v.8.8 software to simulate the earthbag prototype monitored in Spain, mentioned in the previous section, in order to first validate the model and also to test different passive strategies to improve the thermal performance. The monitoring and simulation results showed a good match, discrepancies of 1 °C, in the temperature behaviour. The base infiltration considered is 0.5 ACH and the night natural ventilation 10 ACH. The authors also present a comparison between the monitored prototype and the same construction without glazed surfaces. The influence of the direct solar radiation is reflected in the thermal lag and the decrement factor. Those parameters are presented for three different periods of the year: winter solstice, equinox and summer solstice. For the simulated prototype, the thermal lags are 8 h, 7 h and 6 h and the decrement factor 0.17, 0.16 and 0.14, respectively for the three periods. Another comparison presented in this paper is the increase in the peak interior temperature due to the glazed surface of 1.31, 1.37 and 0.52 °C corresponding to the winter solstice, equinox and summer solstice, respectively; and the decrease of the heating energy consumption of −2.3% and −8.9% for the winter solstice and the equinox, respectively. Moreover, a thermal comfort assessment is presented according to the ASHRAE Standard 55 adaptive comfort model [25]. Simulation results confirm the good performance of the Earthbag building to achieve thermal comfort in hot climates since all the internal operative temperatures are between the limits of thermal comfort.
Another article by Rincón et al. [60] simulates and compares an earthbag dwelling in Burkina Faso (Bsh climate) adding different passive design strategies as roof shading and night cross ventilation, using the EnergyPlus software. This study presents a decrement factor of 0.15 around the equinox. For the simulated prototype without glazed surfaces, the thermal lags are 7 h, 8 h and 7 h and the decrement factors 0.13, 0.14 and 0.16 for winter solstice, equinox and summer solstice, respectively. Referring to the thermal lag and the decrement factor, the results are similar to the theoretical values calculated. Results also show that with the passive design strategies, the earthbag dwelling obtained an increase of 94% the hours the prototype meets the comfort zone according to ASHRAE Standard 55 Adaptive Comfort model [25]; and a 99% better performance in discomfort degree-days compared to the traditional adobe Burkinabe building.
Desideri et al. [61] simulate a modified earthbag residential unit, located in Sagarmatha National Park (Nepal) with a monsoon-influenced humid subtropical climate (Cwa). This modified earthbag is proposed by Geiger [62] and it consists of dividing the bag into two compartments, of which the exterior part is filled in with insulation, and the interior part with soil for a total thickness of approximately 33 cm and a transmittance of 0.220 W/(m2·K). Although this study does not add valuable information of thermal comfort, the primary energy demand for heating and the supply via solar system is calculated. Results showed that it has a higher demand than the straw-earth solution tested, but using 13 commercial solar panels can supply the total amount of 15,878 MJ needed for heating the low-energy residential unit.
Fivos [63] simulates an earthbag building to analyse ventilation, lighting and insulation, and conducts environmental evaluations. The simulation consists of one space earthbag construction with the ECOTEC software concluding that the earthbag construction consumes 23% less heating and cooling energy than a conventional insulated construction [64]. Moreover, the study shows that the materials recycling, the construction cost, the embodied energy and energy used are lower in this type of construction than in conventional ones, which gives the opportunity to the people to build their homes in an ecological and economical way.
After simulations with PHOENICS, Zhao et al. [65] state that dome roofs have a better ventilation effect than flat ones when they share the same inner wall length. This study does not provide information on thermal comfort, but in the results section the authors state that dome shape increases the heat radiating area and decreases the artificial lighting because of a major surface for windows and skylight.

4.2.3. Rammed Earth

Palme et al. [31] simulate the rammed earth dwelling previously monitored considering 0.4 ACH in the ECOTEC software. The simulation considers one year hourly data and obtains 6475 h of overheating and 539 h of undercooling having almost 70% in total discomfort degree hours according to ASHRAE standards. Palme obtained an extreme thermal decrement of about 80% and a thermal lag of more than 14 h, for the rammed earth dwelling. As a principal conclusion, the authors state that real houses’ performance studies confirm the heuristic goodness of earth as a construction material in terms of thermal decrement, thermal lag, insulation properties, and solar radiation gain use.
Stevanovic [66] simulated with EnergyPlus different thickness of stabilised rammed earth (SRE) wall combined with external insulation to meet the law 2010/31/EU, for a single-family house in Belgrade, Serbia. The climate for Belgrade is humid subtropical (Cfa), and the simulated house has a gross area of 83 m2. The author presents three cases without insulation varying the rammed earth wall thickness from 30, 40, 50 cm, and maintaining the ventilation in 0.7 ACH. The U-Value considered for each case is 2.07, 1.76 and 1.54 W/(m2·K), respectively. In the three cases the monthly average temperature is almost the same, slightly higher for the 50 cm wall, and the three cases are about 5 °C constantly above the external temperature throughout the year considering the simulation in free floating conditions. There is no information about the decrement factor or thermal lag during the day.
Another study that combines monitoring and simulation of a stabilised rammed earth (SRE) building is Allinson et al. [27]. The building consists of one space room of 8 m2 of floor area, with 2.5 m walls made of two layers (inner and outer) of 175 mm of SRE and 50 mm of extruded polystyrene insulation between. The building is located in Leicestershire (UK), corresponding to temperate oceanic climate (Cfb). The software used for the simulation was WUFI Plus v1.2. The simulated period last one full year (2009) and the historical weather data were obtained from a personal weather station, located approximately 7 km south of the building. The ventilation rate considered is 1.5 ACH because the building had some leaks by design. Monitored and simulated results present a good match, with little discrepancies of about 1 °C for high temperatures. The authors conclude that simulated results showed that the SRE walls significantly reduced the amplitude of relative humidity fluctuations during both the summer and winter. They suggest that future work should focus on how SRE materials might be intelligently optimised for moisture buffering.
Dong et al. [67,68] simulate with AccuRate a single space room of rammed earth house with a total floor area of 96 m2. Elsewhere, Dong et al. [69] propose a parametric study considering the following four parameters that can affect the heat exchange in the house for different climates: window size, window shading, ventilation and thermal mass (wall thickness). Dong et al. basic model has 200 mm thick rammed earth walls, with a 10% of window/wall area ratio (WWR), no shading and 25% of the total wall surface with windows, for rate ventilation. The material properties considered are taken from AccuRate library: thermal conductivity of 1.25 W/m·K, heat capacity of 1940 kJ/m3·K, overall heat transfer coefficient of 5.75 W/(m2·K), and solar heat gain coefficient of 0.69. In this paper, the authors simulate the indoor temperatures of the basic model house in different climates over a whole year period. The climates chosen are: Hot semi-arid (Bsh), warm-summer Mediterranean (Csb) and temperate oceanic (Cfb).
In addition Dong et al. propose a fully optimised model to be compared with the basic one. Thermal lags and decrement factors of both models and for three locations and climates in Australia (Longreach (Bsh), Adelaide (Csb) and Ballarat (Cfb) are presented.
Decrement factors and thermal lags values are better for the basic model than for the parametric study. However, it is important to mention that for the basic model only one week in winter and another week in summer were considered while in the parametric study optimum values for one complete year were calculated. According to the ASHRAE Standard 55 adaptive [25] the results obtained for each climate are: 37% over the upper limit for Bsh; almost half of the time beyond both of the upper and lower acceptability limits for Csb and more than 70% under the lower limit for Cfb.
Taylor et al. [28] used TRNSYS in a rammed earth building to validate the model with the monitored results (explained in previous sections). This study tests also three strategies to reduce the temperature in summer: (1) increasing the night ventilation rate; (2) adding insulation; and (3) using a hydronic cooling system. Applying all three strategies combined, an average reduction of 3 °C was obtained, being below the limit of the ASHRAE comfort zone for 75% of the time. The authors also investigate two strategies to decrease the heating consumption and improve thermal comfort during winter: (1) installing wall and glass insulation; (2) reducing infiltration. Results show a reduction of the total heat energy equal to 84%. The authors conclude that a key aspect in the design of this type of buildings remains in heat exchange between the building and its surroundings so it receives the heat needed during winter and does not overheat during summer.
Soebarto [29] studied three real rammed earth houses simulating them with ENERWIN-EC [70] and using the monitored data of the real constructions (presented before in the monitoring section) to calibrate the models. In the simulations, the author studied the thermal behaviour adding wall insulation in House A and B, and removing it from House C, to compare the three constructions with the same wall characteristics. The thermal properties of the walls were calculated based on literature, obtaining decrement factors for House A, B and C of 0.714, 0.374, 0.189 and thermal lags of 2.81, 6.16 and 9.30 h, respectively. The natural ventilation was estimated to be 0.8 ACH in all three houses. The simulations were conducted in free-run mode, but in reality some portable heaters were used occasionally and there was no way to reflect this on the simulation. Thus, the correlation coefficient (R2) in winter was only calculated for House B as no heater was ever used. The R2 obtained were 0.828 for winter in House B and 0.987, 0.897 and 0.984 during summer for Houses A, B and C, respectively. In the results section, the authors state that changing the external walls composition showed an average increase of the indoor temperature of 4.9 °C for winter when the insulation is added; but in the case of summer by removing the insulation 1 °C is decreased for houses A and B, and up to 2.5 °C for house C.
Beckett et al. [35], also simulated the monitored houses explained in the above sections. In the simulated results, they obtained average decrement factors of 0.145–0.427, depending on the house space for the insulated rammed earth house and 0.119–0.425 for the rammed earth. Regarding the thermal lag, values within the range of 0.357–5.75 h for the #1 and 0.69–3.4 h for #2 were found. These low results are similar to those obtained in the monitored analysis. The authors suggest the complexity of the house, since it is not a single space room but a complete house with different spaces, as the reason for the differences with other publications.

4.2.4. Compressed Earth Blocks

The same authors that monitored the compressed earth blocks dwellings in Ecuador and Burkina Faso, Miño et al. [36] and Ouedraogo [37] respectively, also simulated the behaviour of the construction in order to assess the thermal comfort and validate the model with the experimentation.
In the case of Miño et al. [36], the authors used EneryPlus for the simulation, obtaining an R2 between the monitored and the simulated data of 0.89, with an error (RMSE) of 1.1 °C. Moreover, Miño et al. present two additional cases with the same envelope, but testing different passive solutions to improve the thermal behaviour. In the first one, the internal heat gains and schedules are changed to reflect the common usage conditions of rural housing in the region; and the second, is adding a ceiling of timber infill with earth, and the improvement of the dwelling airtightness to a medium level. Through the implementation of these strategies during the cold months in the Equatorial Andes, the average indoor temperature rises up to 2 °C and the amplitude is decreased by 4.2 °C. Those results agree with previous studies by the same author that show earthen constructions having a higher thermal stability among un-insulated lightweight systems. The author finally concludes that although 75% of the total hours were under the range of adaptive thermal comfort [71], any change in users attitude was noticed.
Ouedraogo [37] validates the model and presents the errors MBD and RMSD calculated for the decrement factor and the thermal lag. He obtained a correlation for the decrement factor of less than 2.5% for the MBD and less than 10% for the RMSD, for all the prototypes tested (earth, earth with paper and earth with paper and cement), and a correlation of about 5.6% and 9.3% for the MBD and RMSD respectively, for the thermal lag. Concluding that the theoretical and experimental values are concordant and similar to the bibliography [72,73,74] and therefore the model used for simulation is well-suited.
In addition, there is a study conducted by Hema et al. [75], that simulates the behaviour of a CEB wall, located in Ouagadougou, Burkina Faso, and compares it to the behaviour of a concrete wall. This study is focused on the heat passing through the inner surface of the CEBs wall and the evolution of humidity flow through the inner side of each component. The CEBs wall lets in more moisture, which helps regulate the radiant temperature of the walls. The purpose of this work is to study the use of this surface moisture flow to improve the radiant temperature of the walls and to consider adiabatic cooling of the indoor hot air through its contact with the wetter wall. The authors conclude that compressed earth blocks are more permeable to mass transfer than walls made of hollow concrete blocks.
Wati et al. [76] simulate a compressed stabilised earth block (CSEB) wall with EnergyPlus under the Garoua (Cameroon) climate conditions (Am climate) and compare it with a CSEB with 8% of sawdust (ES) and the CSEB with 45% of pozzolan (EP). The decrement factor and the thermal lag are presented for wall thickness of 5 to 45 cm. For a thickness of 30 cm, thermal lags obtained for ES and EP walls are 4.21% and 16.14% in exceed compared to the EB wall, respectively, and the decrement factor is 0.6 (EB), 0.3 (ES) and 0.2 (EP).
In another article by Wati et al. [77], the authors simulate an office building in three different locations in Cameroon: Garoua (Am climate), Douala and Yaoundé (Aw climate). The wall characteristics are obtained from a Simulink model, a library of validated building model [78]. The building consists of four offices and a corridor. Each office has 25.2 m2 with a high of 2.85 m. The infiltrations considered are 0.35 ACH, the window wall ratio (WWR) is fixed at 30% and human and electrical heat gains are considered. As [76] the simulation was made for CSEB, CSEB-ES and CSEB-EP. The analysis was made fixing the indoor temperature at 24.5 °C. The authors conclude that the annual cooling required for a 14 cm thick CSEB-EP wall is smaller than that of the CSEB wall by 3.10%, 3.58% and 5.41% in the cities of Yaoundé, Douala and Garoua, respectively. Running in free floating condition and increasing ventilation rate during night-time from 0.35 to 4.35 ACH reduces the cooling energy requirement by 12.6%, 13.6%, and 13.9% for CSEB, CSEB-ES, CSEB-EP walls, respectively.
Zhang et al. [40] simulated the same residential building described in previous sections located in Turpan (China). The simulation was conducted using the EnergyPlus software. The authors compare the behaviour of the earth blocks (400 mm thick) and the fired brick (300 mm thick) using the data provided by manufacturers. The minimum air infiltration considered was 0.5 ACH, but during summer the windows were opened from 10 pm to 7 am, in this case the ventilation considered was 2.5 ACH. The simulation model was run from August 1st to August 4th in order to validate the model against the monitored data. The results from the simulation were consistent with the corresponding measured results, and the authors state that the minor discrepancies were due to the residents’ activity because it was not considered in the simulation. With the validated model, the authors compared the behaviour of the earth brick and the fired brick during the coldest week in the year. During wintertime, the highest difference obtained is regarding the relative humidity; in the earth brick the maximum is lower than 40% whilst in the fired bricks goes above 50%. Also the amplitude of the relative humidity is 1.5 higher in the fired bricks (20%) than the earth bricks. According to the temperature, the air temperature of the earth brick room is usually about 2 °C higher than the fired brick room, so the thermal amplitude of the earth brick is lower than the one for the fired brick room (15 °C). During summertime the fired earth brick is always about 3.5 °C higher than the earth brick but in both cases the room air temperature is above 30 °C. In addition the authors calculate the energy heating consumption during the heating period (Oct-Apr). For the earth brick building the consumption obtained was 16.789 kW·h, which is significantly lower than the 21.222 kW·h obtained for the fired brick building.

4.2.5. Cob

Collet et al. [79] simulated a modern building with TRNSYS, with the climatic conditions of Rennes (France) where the climate is considered oceanic (Cfb). The building consists of 32 dwellings of 65.7 m2 each, where the north front and the east and west gables are made up of 20-cm-thick concrete blocks, 10-cm-thick insulation and 1-cm-thick plaster. The south façade is tested with cob and insulated cob walls. There are also two efficient buildings, based on the conventional construction, where the windows, the ventilation, and the north-, east- and west-facing walls have been improved. Also 1.4 m deep balconies are added in the south-facing façade in one of them. The flow rate of the natural ventilation of each dwelling is 60 m3/h. The results show that the thermal balance of the wall and the annual heating loads decrease as the cob thickness wall increases, reducing a 64% and 9% respectively, with an increase of 30 to 80 cm the cob wall thick. Regarding the efficient building with the balconies, it is proved that cob walls should not be shaded since the heating loads of the efficient building without balconies are higher than those with the balconies. However the simulated temperatures without balconies reached up to 28–29 °C, so the use of solar protection on glazing is necessary during summer. The main conclusion of the authors is that a 50 cm thick cob wall facing south has the same thermal behaviour as an insulated concrete block wall with 7–9 cm of insulation, even though the European Standard aims at banning the use of those types of walls whereas their thermal behaviour is satisfactory. Moreover adding insulation to those cob walls it can face any direction and still comply with the standards.
Zeghari et al. [80] simulate a single residential house with two floors within different climatic zones including France and UK, places with an oceanic climate (Cfb). The house consists of two floors and the wall heat losses are investigated using building heat losses simulation software, which is not specified. The envelope is made by two cob types and an external lime coating. The cob types used are insulation cob made with bio-based materials (λ = 0.1 W/m·°C) and construction cob (λ = 0.494 W/m·°C). All the study is based on EN 12831 and NF P52612 standards included in the software. To accomplish with the French thermal regulations RT2012 the thickness of the building must be 350 mm of insulation cob and 300 mm of construction cob. The results are compared to a conventional concrete building. When considering both as un-insulated buildings, cob has less wall heat loses than the conventional building (a reduction of 40%), whereas when considering the insulated building, the thermal losses are nearly close, which means cob can be a natural alternative to conventional construction materials.

4.2.6. Adobe

Rincón et al. [60] simulate a residential building located in Ouagadougou (Burkina Faso) corresponding to Hot semi-arid climate (Bsh). The simulation consists of a traditional adobe dwelling using the EnergyPlus software and testing several passive design strategies of bioclimatic architecture used in hot semi-arid climate. Those strategies are: night ventilation (4 ACH, and 0.5 ACH for free floating due to air infiltration), roof shading and night ventilation with the roof shading. The traditional dwelling has a net floor area of 15.9 m2 and adobe walls of 2.7 m high and 15 cm thick with a thermal conductivity of 0.95 W/m·K. The roof is built with a 3 mm iron sheet. The decrement factor resulted higher than 1. In this paper, Rincón et al. propose a parameter to assess the thermal comfort using the ASHRAE 55 Adaptive comfort model, called discomfort degree days (DDD) to capture the level of discomfort. A comparison of the different scenarios simulated for the adobe dwelling is presented, showing the difference between the hours of discomfort and the discomfort degree days. The best thermal performance is obtained for the dwelling with both passive design strategies (roof shading and night ventilation) applied. However, the strategy that contributes the most to the thermal comfort is the roof shading, since the results do not change much applying the night ventilation (+1%), probably due to the hot climate. In terms of the hours of discomfort and the discomfort degree days, a reduction of 37% and 77% is observed, respectively.
Palme et al. [31] simulate a residential building located in San Pedro de Atacama (Chile), where the climate corresponds to a cold desert (BWk). The authors used the ECOTEC software to simulate the dwelling presented in previous sections. It is considered 0.4 ACH and they calculate the total number of hours of discomfort (5500 h, following the adaptive discomfort model) in overheating and undercooling conditions. In this study results show three times more hours of discomfort for overheating. They also present a decrement factor of 55% and a thermal lag of 8 h, concluding that adobe is a proper technique for desert climates.
Chel et al. [48] also simulate the monitored passive house presented in previous sections to determine the annual energy saving potential of the passive house in different Indian locations (New Delhi, Bangalore, Jodhpur, Mumbai and Srinagar). The simulations results were found in good agreement with the experimental observed data of indoor temperature. It is observed a correlation coefficient and root mean square percentage error in the range of 0.97–0.98 and 0.2–3%, respectively. The heating and cooling energy saving potential of the passive house were estimated as 1481 and 1813 kW·h/year, respectively. And saving potentials for the different locations simulated were determined as 3294, 1082, 3318, 2798 and 7435 kW·h/year for New Delhi, Bangalore, Jodhpur, Mumbai and Srinagar, respectively.
In previous section Zhang et al. [46] proved that quadrangle adobe dwelling comfort is poor in the province of Gansu (China) with a semi-arid climate (Bs). Therefore a simulation of three schemes is proposed to improve the thermal comfort and energy saving. Those schemes are: #1 changing the layout to decrease the external wall; #2 changing the envelope adding 50 mm of colloid powder polyphenylene granule mortar plastered on the outside surface and 35 mm on the inside; #3 is a combination of #1 and #2. The authors used the FLUENT software for the simulation and the results show an average increase of the indoor temperature of 1.46 °C, 1.26 °C and 0.22 °C for schemes #3, #2 and #1 respectively, and energy savings of 42.17% for #3, 38.6% for #2 and 15.11% for #1. However, the authors conclude that taking both the economical and the energy saving solutions into consideration, scheme #1 is the best option whilst scheme #3 is the worst one.

4.2.7. Extruded Earth

Azhary et al. [81] studied experimentally the thermal characterisation of three different types of unfired clay bricks. Those sample analysis were used as the envelope of a tertiary building simulated using the DesignBuilder software. The building consists of a 288 m2 area with a natural ventilation of 36 m3/h located in Marrakech (Morocco), where the climate is subtropical semi-desert (Bsh). The results are presented for a week in January and a week in July. The three types of unfired clay behave quite similar. The average decrement factor is 0.33 during wintertime and up to 0.58 during summertime. The authors state that decrement factor reached 0.2, concluding that unfired clay is a good insulation in summer since the indoor temperature did not exceed 34 °C whilst the external temperature exceeded 46 °C.

4.2.8. Straw Clay

Toguyeni et al. [82] present a standard house located in Ouagadougou (Burkina Faso), with a hot semi-arid climate (Bsh). The authors use TRNSYS 16.1 to compare the monthly thermal load of two standard houses for residential use (50.02 m2 of floor area). Both units have a non-insulated roof, but one counts with 20 cm clay wall and the other with 20 cm wall made with a clay–straw (3%) composite. The thermal conductivity of the walls is taken as 2.12 and 0.53 W/m·K, respectively. The simulation indicates that the clay straw wall, consumes 8% less energy than the standard clay wall in annual basis. There is no information about the thermal lag or the decrement factor of the walls.

4.2.9. Earthship

Freney et al. [56], simulate the building monitored exposed in previous sections in order to validate the model and test the construction in different climates. EnergyPlus and Design Builder are the software used for the simulations. The locations selected to test the validated model are: Paris (Cfb), Albacete (BSk), Seville (Csa), Valladolid (Csb), and London (Cfa). Freney et al. observed that during the coldest months, the simulated temperature was often 2 °C higher than the monitored, which leads to think of an incorrect assumption of the ground temperature. However, the RMSE obtained of 6.3% is within the values suggested by [83]. The second part of the study was to test the Earthship in different European locations and climates, and evaluate the thermal comfort according to the ASHRAE 55 model. In London and Paris the results are similar. The simulation shows indoor air temperature below the acceptable limits during winter and a perfect performance during summertime. This behaviour is consistent with the performance of the Brighton Earthship [57], monitored and explained in previous sections. For the three Spanish locations, Seville, Valladolid and Albacete, the simulation indicates a thermal comfort condition through the whole year; just some few spots indicate an average maximum indoor temperature higher than the limits during summertime. According to the results, those climates are suitable to build with this type of building technique.

5. Discussion

In this section a summary of the most important thermal parameters are presented and discussed, according to the earth construction technique and the type of analysis: monitoring or simulation. All earth constructive techniques are discussed except for the poured earth (reference #13), for which only one reference was found.

5.1. Earth Dug Out

A total of twelve papers have been considered, all of them for in-use buildings. Five of them compare monitored and simulated results, six of them present results for monitoring, and one of them focuses exclusively on simulation. Several papers are located in Spain, where the cave buildings are mostly used as wine cellars. Four papers are located in China, where the buildings have a residential use, and two papers are located in Iran. The wine cellars are dug out at a deep of about 8–9 m, accessible with a tunnel. In the case of residential buildings, the cave rooms are located surrounding a courtyard in all cardinal orientations. The climate of those locations varies between Arid, Temperate and Continental.
The articles related with monitoring of earth dug out technique (Table 2) presented a varied compendium of analyzed issues -such as the monitoring period, the depth of the cave, the volume of the space, or the number of occupants- but with some common results. Most of the articles presented results on the decrement factor and the thermal amplitude. It is seen that the decrement factor ranges from 0.04 to 0.38, depending on the year season and the occupation. The thermal amplitude ranges 2.6 to 9.1 °C in the wine cellars [15], and 7–8 °C for the occupied cave dwelling, whilst in the unoccupied cave construction is 0.65 °C. Only one article, wine cellar case, presents results about the thermal lag and the thermal comfort [16], obtaining 28 to 58 days and having values between 58–100%, respectively.
When analysing simulation studies parameters such as simulation software, ventilation, U-value, thermal transmittance, and thermal comfort standards play a key role. As presented in Table 3, all the case studies are in-use buildings located in arid climates (China, Iran), temperate climates (China, Spain) and continental climates (China). Three of them are wine cellars and the others, cave dwellings with a courtyard. The common software used for the simulation is EnergyPlus with the support of Sketchup or ECOTEC. Just one author [24] considered the ventilation ratio in simulations with a value of 0.43 ACH. There is no average U-value observed because each earth building studied has very different configurations and characteristics. As it happens in the monitoring section, the results on the decrement factor vary depending on the studied period, obtaining values between 0.03 for summer period or 0.42 corresponding to an annual behaviour. It is not possible to compare the results on thermal lag because some authors indicate it for an annual base (in days) and others for a daily base (in hours).
In four out of six studies, a monitoring analysis has been used to validate the model. In all the cases the model has been validated obtaining a maximum average deviation, R2 value, of 16%. Two articles [22,23] asses the thermal comfort, according to the Chinese Standard GBT50785-2012, and obtaining 42.8% and 52.3% of the time in comfort Zone II, respectively.
Finally, when comparing thermal parameters for monitoring and simulation it is seen that no common pattern is observed. For example, in [17] neither the decrement factor nor the thermal lag are provided in the monitoring part of the paper while this information is presented in the simulation section. Decrement factor varies from 0.21 in the monitoring to 0.42 in the simulation in [22]. No comparison is possible because no monitoring period is provided while in the simulation authors state that the decrement factor takes into account the annual behaviour. Thermal comfort is provided only in four papers (one monitoring and three simulation). Results show that thermal comfort interval is large going from 28% to 100%. Three papers show comfort values between 42.8% and 58%.

5.2. Earthbag

A total of five articles about earthbag building are presented in this section. All of them present results about energy simulation but only one is in addition presenting monitoring results (Table 4).
Three of the articles, the ones located in Spain and Burkina Faso for semi-arid climate and Nepal for humid subtropical climate, provide complete information about the energy simulation (Table 5). However, for the other two studies [63,65] neither location and climate nor building use and thermal parameters are presented. EnergyPlus, Ecotec and Phoenics were the used to conduct the simulations.
In all the cases the building has a dome shape. There is no common pattern for the wall thickness, ranging from 33 cm to 70 cm. In consequence, the U-value is very different for each building. In terms of decrement factor and thermal lag, the simulated and monitored results presented in [13] are quite similar and have a good match with the results presented in [60], obtaining decrement factor values between 0.14–0.19 for winter, equinox and summer, and thermal lags around 8 h. The three authors presenting thermal comfort results used the ASHRAE 55 Adaptive Comfort. All of them obtained a good performance for the earthbag building in hot climates, in addition according to [60] earthbag is 94% better in terms of hours not meeting comfort, and 99% better in discomfort degree-days, than the traditional adobe Burkinabe dwelling.

5.3. Rammed Earth

There is a total of seventeen rammed earth building articles, eight of them are both thermally monitored and simulated. Most of the rammed earth buildings analysed are located in Spain or Australia, where the main climates are temperate and arid. From all the buildings analysed, nine are in-use buildings and the others experimental prototypes.
The building characteristics and the monitoring results of rammed earth constructions are presented in Table 6. The monitoring was conducted under free floating conditions in the articles [33,34,66]. The articles [33,34] test experimental prototypes also under indoor air controlled temperature.
It is very difficult to compare the thermal performance because authors used different thickness of the walls and U-values. Moreover, there are some cases where there is also insulation on the walls. The most commonly analyzed wall thickness for rammed earth was found to be 30–50 cm, which can be reduced to 11–30 cm when thermal insulation is applied. The wall thermal transmittance is specified in two articles [30,31,32], presenting similar values of 1.58 and 1.3 W/(m2·K). The conductivity is presented in [26,27] with very similar values of 0.6 and 0.643 W/(m·K) when it is completely dried.
There is a general consensus in dividing the thermal performance between summer and winter, and obtaining values for the decrement factor of 0.14–0.23 and 0.1–0.25, respectively. The thermal amplitude varies between cases from < 1 °C to 2 °C during winter. The thermal comfort is only analysed by one author [28] according to the ASHRAE Standard 55 adaptive comfort, obtaining values between 73–81% in summer.
Analysing the simulation results, different parameters such as simulation software and ventilation ratio are presented (Table 7). No common software is used to simulate the rammed earth buildings and there is no consensus for the ventilation ratio, ranging from 0.4 [30,31] to 1.5 ACH [27]. The building structures vary from simple structures of one space building to complete houses of many rooms and occupants, so it is very difficult to obtain thermal patterns. The thickness of the raw rammed earth walls varies from 22 cm [29] to 50 cm [30,31,66]. There are other authors who suggest adding insulation [27,35] or air gap between layers [29]. All the authors took the U-values and the thermal properties of the rammed earth walls from the literature and [29] used those values to calculate the decrement factor and the thermal lag. Another author used the validated model to simulate the same building for different climates [67]. The results are divided for summer and winter. The thermal comfort is assessed by the ASHRAE Standard 55 adaptive comfort model, except from [66] who used 2010/31/EU. For Arid climates the discomfort is reduced about 70% compared to concrete blocks according to [30] and just 37% of overheating is obtained by [67]. Similar values of 75% of comfort are presented by [28]. For temperate climates the results are lower and the rammed earth building shows 50–70% of discomfort according to [67].

5.4. Compressed Earth Blocks

Seven articles have thermally analyzed the compressed earth blocks (CEB) building technique, three of them with both monitored and simulated analyzes. Three of the analysed constructions (one simulated and the other two both simulated and monitored) are in-use buildings, the rest are experimental buildings. The locations of the cases are very different, with Tundra, Temperate, and Arid climates.
The building characteristics and the thermal parameters of the monitored CEB cases are presented in Table 8. The monitoring period is only specified by two authors [38,40] and it was conducted in summer 2016 in both studies. However, comparisons are difficult since climates and wall characteristics are different. Just one author [38], described the building dimensions and specified the thermal comfort standard SIA 180:2014 used to assess the thermal comfort. The thickness of the CEB walls is 14 cm for three out of the four cases, but insulation or coatings are added in some case. There is no common pattern observed related to the decrement factors or the thermal amplitudes values, because they depend on the monitoring period, the building structure and as suggested by [40], on the building floor as well.
The thermal performance and the building characteristics of the CEB simulated studies are presented in Table 9. The authors who specified the software coincide using EnergyPlus [36,40,76]. Three authors propose wall thickness of 14 cm. The base ventilation ratio set up goes from 0.35 to 0.5 ACH and the monitoring results have been used to validate the simulated model in two studies [36,37]. Decrement factor and thermal lag parameters are only presented by [76]. Thermal comfort for simulated CEB is only provided by [36], assuring that a CEB simulated building located in Tundra climate would be under the limits of thermal comfort zone 75% of the time.

5.5. Cob

Thermal monitoring studies with cob construction technique have not been found. Two authors simulate in-use cob buildings located in different places but both with Oceanic climate (Table 10). The thickness of the cob wall is between 30 and 80 cm in the thirty-three analyzed buildings. Basic air infiltration is only provided by [79] and the thermal transmittance by [80]. No thermal comfort analyses have been performed with this construction technique.

5.6. Adobe

From the authors that conducted a thermal analysis of an adobe building, there are a total of thirteen monitoring studies (five of them correspond to experimental buildings). There are also four simulated studies and all of them are in-use buildings. There is only one simulated study that does no conduct a monitoring analysis to validate the results. The locations of the adobe buildings are very different but they correspond to Temperate and Arid climates.
The building characteristics and the thermal parameters of the monitored adobe cases are presented in Table 11. Most of the authors monitored the building during summer period and three other authors monitored during winter time. The most used adobe wall thickness for in-use buildings is 40–56 cm without insulation, and the thermal transmittance ranges from 1.35 W/(m2·K) for 40 cm to 1.39 W/(m2·K) for 36 cm of adobe wall. There is one author [50] who analysed the U-value according to the RCCTE and the DIN EN ISO 6946, for an experimental prototype. The decrement factor, thermal lag and the thermal amplitude vary according to the year season and the wall thickness; there is no clear pattern since each study characteristics are very different. Only three authors have assessed the thermal comfort with three different methods: Fanger’s method, the predicted mean vote (PMV) method, and the cumulative distribution function (CDF) [43,46,47]. Two of them conclude that thermal comfort is achieved, in the case of [42] between 87–99% of the time; but [46] obtained values of thermal comfort under the thermal limit, being too cold to get comfortable.
The thermal performance and the building characteristics of the adobe simulated studies are presented in Table 12. The software used for the simulation is specified in three out of four studies, and there is no common consensus, since each author uses different software. The wall thickness varies from 15 to 30 cm and the base ventilation rate used by the authors is similar (0.4–0.5 ACH). There is only one author who provide an statistical analysis between monitored and simulated results [48], obtaining a good match. Decrement factor and thermal lag are presented just by one author as well [30]. The thermal comfort has been assessed by the ASHRAE 55 adaptive comfort model, and in addition, [60] also analysed the Discomfort Degree Days (DDD).

5.7. Extruded Earth

There are only two authors that conduct a thermal analysis of an extruded earth building, one monitored (Table 13) and the other simulated (Table 14). Both locations and climates are different and there is only information on the building use for the monitoring study. The monitoring study was performed during one year and the thermal lag obtained is 10 h. It is important to highlight that a good match is obtained for the decrement factor, with a value of 0.2 for both the simulation in summer and the monitored. In addition, the simulation presents a decrement factor of 0.33 for the winter period.

5.8. Straw Clay

There is only one simulated study of a straw clay in use building, done with TRNSYS (Table 15). It is located in Burkina Faso, which corresponds to hot semi-arid climate climate. The thickness of the building and the U-Value are presented. No specific value for the thermal lag or the decrement factor is provided.

5.9. Earthship

Two in-use earthship buildings were thermally monitored (Table 16). One study also simulates the building in different climates and locations, and verifies the model with the monitored analysis (Table 17). The decrement factors obtained by the two monitoring cases are very different for both summer and winter: in the case of [57] values obtained are almost twice the ones in [56]. From the information presented by the authors it is not possible to explain such a difference. The thermal comfort is achieved 80% of the time in summer and winter, according to the ASHRAE 55 Adaptive comfort, as mentioned by [57].
Considering all the earth techniques and studies included in this review, it is observed that the thermal transmittance ranges between 1.3–2.1 W/(m2·K) in the majority of the cases, but as presented in the following Figure 4, there are not enough case studies to draw conclusions about the relation of the thermal transmittance with the earth wall thickness and the climate.
Another key observation is the relation between the decrement factor and the thickness of the earth wall presented in Figure 5. There is a significant reduction of the decrement factor for earth wall between 10–20 cm thick. From 20 to 50 cm the decrement factor is stabilized in a range of 0.13–0.21.
The following Figure 6 presents the decrement factor according to the Köppen and Geiger climate classification. The thermal monitoring cases took place mainly in arid and semi-arid climate (group B), and Mediterranean climate (group Cs). Within these climate locations, the earth construction techniques that achieved the lowest decrement factor were adobe, dug out earth, and rammed earth (all below 0.3).

6. Conclusions

A literature review on thermal monitoring and simulation analyses for earth buildings has been presented. The literature review includes a complete list of the earth building techniques, including both traditional and modern. The review presents mainly scientific articles and some conference papers related with thermal comfort in earth buildings. From the 59 presented papers, in 71.2% the earth building is monitored, while in 59.3% it is simulated. Just over a third (36%) of the papers present simultaneously thermal monitoring and simulation. From all the techniques considered in this paper, rammed earth is the most studied for both monitoring (14 studies) and simulation (12 studies). Adobe has 17 studies, 13 of them monitoring, and earthen dug out has 17 studies, six of them simulations.
The information found in the literature review has been firstly explained per building technique and secondly divided in thermal monitoring analyses and thermal simulations. The data are summarized and structured by the building location and climate, the use of the building, the thickness of the earth wall, the thermal transmittance or conductivity of the earth wall, the decrement factor, the thermal lag and amplitude, and the achieved period of thermal comfort in the earth building. In addition, the monitoring analyses compile information such as the monitoring period. The simulation analyses compile information such as the software simulation used, the verification of the model by monitored data, and the considered level of ventilation in the building.
The results of this literature review indicate that:
  • Although complete information regarding architectonic characteristics of earth building techniques is found in the literature, just partial information related to thermal performance of both monitored and simulated earth buildings exists. It is also conclude that for some earth techniques presented in Table 1, thermal performance information is not found. Thus, there is a gap of information regarding the thermal comfort in these techniques.
  • Although a large number of studies monitoring or/and simulating earth construction buildings are published, little uniformity exists when collecting data for making comparisons.
  • No thermal analyses have been found within the scope of this study for earth techniques such as cut blocks, direct shaping, stacked earth, daubed earth, or the newest technique, the earth 3D printing. It is necessary to study those technologies in order to provide knowledge to the scientific community regarding the thermal performance of these techniques.
  • There is a general consensus in literature that a key aspect for using the earth as a construction material is the thermal inertia provided to the building. This thermal inertia is not enough for cold climates to achieve the thermal comfort but it is proved to be enough, combined with other passive design strategies, to meet the thermal comfort without any active system for hot climates.
  • Most of the locations of the earth buildings corresponded to arid and temperate climates according to Köppen and Geiger classification, which it is proved according to the literature to be suitable climates for earth constructions. This is due to its high thermal inertia that decreases the high thermal amplitude of the exterior temperatures, presenting decrements factors around 0.2 for the major part of the earth techniques.
  • To assess the thermal comfort, ASHRAE 55 adaptive comfort model is the common standard used. For arid and temperate climates, earthbag, rammed earth and dugout constructions are the ones with higher levels of thermal comfort, obtaining values above 70% of the time within the limits of thermal comfort.
From the literature review about thermal monitoring, it can be concluded that:
  • When monitoring earth buildings indoor and outdoor temperatures are always measured. A large number of authors also recorded relative humidity, solar radiation and air velocity.
  • Neither common equipment nor common monitoring methodology has been used, which complicates an objective comparison of the results. It is necessary to establish a common methodology for monitoring earth buildings.
  • There is no consensus about the minimum period for conducting monitoring experiments.
  • Rammed earth, adobe and dug out earth buildings are the techniques which there is more information on the literature regarding the thermal comfort assessment. However they are just partially studied, other parameters such as the water content or the building occupation are also involved in the thermal comfort.
  • One of the main gaps concerning the monitoring of earth buildings, is the occupation. There is no information of the effect on the thermal comfort because of the occupation of the earth building. In the majority of the cases this occupation is not even mentioned.
From the literature review about thermal simulation, it can be concluded that:
  • There is no homogeneity in the software used to simulate earth buildings, however EnergyPlus is the most used software.
  • Base values of air infiltration of 0.4–0.8 ACH were considered.
  • The numerical models that have been validated, present high coincidences with the monitoring results.
One of the main limitations of the earth building simulations is the convenience of an experimental study to validate the numerical model. This is not always possible and there are many simulated studies without the correspondent experimental study. Not having proper standards and using unverified models to assess the thermal comfort are the main limitations Future research would include:
In order to make more precise comparisons on the thermal behaviour and thermal comfort of the different earth construction techniques, it is necessary that the scientific community agrees on which are the key parameters. For these reasons, the authors encourage to create a clear standard on how to monitor an earth building, and which parameters must be registered and under which conditions.

Author Contributions

Conceptualization, L.R.; methodology, L.R., I.M. and A.C.; formal analysis, I.M.; investigation, A.C., L.R., I.M.; resources, A.C., and L.R.; data curation, A.C.; writing—original draft preparation, A.C. and L.R.; writing—review and editing, I.M. and L.R.; visualization, I.M.; supervision, I.M. and L.R.; project administration, L.R.; funding acquisition, L.R. and I.M. All authors have read and agreed to the published version of the manuscript.

Funding

The work was partially funded by the Catalan Government under grant agreement (2017 SGR 659).

Acknowledgments

Ariadna Carrobé would like to thank the Secretaria d’Universitats i Recerca del Departament d’Empresa i Coneixement de la Generalitat de Catalunya for her research fellowship.

Conflicts of Interest

The authors declare no conflict of interest.

References

  1. Coch, H. Bioclimatism in Vernacular Architecture. Renew. Sustain. Energy Rev. 1998, 2, 67–87. [Google Scholar] [CrossRef]
  2. Graham McHenry, P., Jr. Adobe and Rammed Earth Buildings. In Design and Construction; The University of Arizona Press: Tucson, AZ, USA, 1984. [Google Scholar]
  3. Costa, C.S.; Rocha, F.; Velosa, A.L. Sustainability in Earthen Heritage Conservation. Geol. Soc. Lond. Spec. Publ. 2016, 416, 91–100. [Google Scholar] [CrossRef]
  4. Hall, M.R.; Casey, S. Hygrothermal behaviour and occupant comfort in modern earth buildings. In Modern Earth Buildings; Woodhead Publishing, Elsevier: Cambridge, UK, 2012; pp. 17–40. ISBN 978-0-85709-026-3. [Google Scholar]
  5. Hoff, E.C. Appraisal of the Sustainability of Compressed Stabilized Earthen Masonry. University of Nebraska-Lincoln. December 2016. Available online: https://digitalcommons.unl.edu/archengdiss/43/ (accessed on 7 April 2021).
  6. Roux Gutiérrez, R.S. Los Bloques de Tierra Comprimida (BTC) En Zonas Húmedas; Plazay Valdés, S.A., Ed.; Universidad Autónoma de Tamaulipas: Tamaulipas, Mexico, 2010; ISBN 978-607-402-188-2. [Google Scholar]
  7. UNESCO. Earthen Architecture in Today’s World; UNESCO: Paris, France, 2013; ISBN 978-92-3-001236-6. Available online: http://whc.unesco.org/en/series/36/ (accessed on 7 April 2021).
  8. Auroville Earth Institute. Available online: http://www.earth-auroville.com/ (accessed on 27 April 2020).
  9. Birkhäuser, G.M. Building with Earth: Design and Technology of a Sustainable Architecture; Walter de Gruyter: Berlin, Germany, 2012; p. 198. [Google Scholar]
  10. Houben, H.; Guilland, H. Dossier Investing in People Country Reports: Mali, Western Samoa. In The Courier; 1996; Volume 159, Available online: http://www.nzdl.org/cgi-bin/library?e=d-00000-00---off-0hdl--00-0----0-10-0---0---0direct-10---4-------0-0l--11-en-50---20-about---00-0-1-00-0--4----0-0-11-10-0utfZz-8-00&cl=CL2.6.1&d=HASH01b7347bee24dda0b5908b86&gt=2 (accessed on 7 April 2021).
  11. Maldonado, C.A. Evaluación del Comportamiento Térmico de los Domos de Superadobe en Climas Fríos. Master’s Thesis, Universitat Politècnica de Catalunya, Catalonia, Spain, 2014. [Google Scholar]
  12. Rubel, F.; Kottek, M. Observed and Projected Climate Shifts 1901-2100 Depicted by World Maps of the Köppen-Geiger Climate Classification. Meteorol. Z. 2010, 19, 135–141. [Google Scholar] [CrossRef] [Green Version]
  13. Rincón, L.; Carrobé, A.; Medrano, M.; Solé, C.; Castell, A.; Martorell, I. Analysis of the Thermal Behavior of an Earthbag Building in Mediterranean Continental Climate: Monitoring and Simulation. Energies 2019, 13, 162. [Google Scholar] [CrossRef] [Green Version]
  14. Porras-Amores, C.; Mazarrón, F.R.; Cañas, I.; Villoría Sáez, P. Natural Ventilation Analysis in an Underground Construction: CFD Simulation and Experimental Validation. Tunn. Undergr. Space Technol. 2019, 90, 162–173. [Google Scholar] [CrossRef]
  15. Sadoughi, A.; Kibert, C.; Sadeghi, F.M.; Jafari, S. Thermal Performance Analysis of a Traditional Passive Cooling System in Dezful, Iran. Tunn. Undergr. Space Technol. 2019, 83, 291–302. [Google Scholar] [CrossRef] [Green Version]
  16. Mazarrón, F.R.; Cid-Falceto, J.; Cañas, I. Ground Thermal Inertia for Energy Efficient Building Design: A Case Study on Food Industry. Energies 2012, 5, 227–242. [Google Scholar] [CrossRef]
  17. Mazarrón, F.R.; Cid-Falceto, J.; Cañas, I. An Assessment of Using Ground Thermal Inertia as Passive Thermal Technique in the Wine Industry around the World. Appl. Therm. Eng. 2012, 33–34, 54–61. [Google Scholar] [CrossRef]
  18. Mazarron, F.R.; Canas, I. Exponential Sinusoidal Model for Predicting Temperature inside Underground Wine Cellars from a Spanish Region. Energy Build. 2008, 40, 1931–1940. [Google Scholar] [CrossRef]
  19. Mazarrón, F.R.; Cañas, I. Seasonal Analysis of the Thermal Behaviour of Traditional Underground Wine Cellars in Spain. Renew. Energy 2009, 34, 2484–2492. [Google Scholar] [CrossRef]
  20. Cañas Guerrero, I.; Martin Ocaña, S. Study of the Thermal Behaviour of Traditional Wine Cellars: The Case of the Area of “Tierras Sorianas Del Cid” (Spain). Renew. Energy 2005, 30, 43–55. [Google Scholar] [CrossRef]
  21. Zhu, J.; Tong, L. Experimental Study on the Thermal Performance of Underground Cave Dwellings with Coupled Yaokang. Renew. Energy 2017, 108, 156–168. [Google Scholar] [CrossRef]
  22. Zhu, J.; Tong, L.; Li, R.; Yang, J.; Li, H. Annual Thermal Performance Analysis of Underground Cave Dwellings Based on Climate Responsive Design. Renew. Energy 2020, 145, 1633–1646. [Google Scholar] [CrossRef]
  23. Zhao, X.; Nie, P.; Zhu, J.; Tong, L.; Liu, Y. Evaluation of Thermal Environments for Cliff-Side Cave Dwellings in Cold Region of China. Renew. Energy 2020, 158, 154–166. [Google Scholar] [CrossRef]
  24. Wang, F.; Liu, Y. Thermal Environment of the Courtyard Style Cave Dwelling in Winter. Energy Build. 2002, 34, 985–1001. [Google Scholar] [CrossRef]
  25. American Society of Heating, Refrigeration and Air-Conditioning Engineers, Inc. ANSI/ASHRAE Standard 55-2013. Thermal Environmental Conditions for Human Occupancy; ASHRAE Headquarters: Atlanta, GA, USA, 2013. [Google Scholar]
  26. Soudani, L.; Woloszyn, M.; Fabbri, A.; Morel, J.-C.; Grillet, A.-C. Energy Evaluation of Rammed Earth Walls Using Long Term In-Situ Measurements. Sol. Energy 2017, 141, 70–80. [Google Scholar] [CrossRef]
  27. Allinson, D.; Hall, M. Hygrothermal Analysis of a Stabilised Rammed Earth Test Building in the UK. Energy Build. 2010, 42, 845–852. [Google Scholar] [CrossRef]
  28. Taylor, P.; Fuller, R.J.; Luther, M.B. Energy Use and Thermal Comfort in a Rammed Earth Office Building. Energy Build. 2008, 40, 793–800. [Google Scholar] [CrossRef]
  29. Soebarto, V. Analysis Of Indoor Performance Of Houses Using Rammed Earth Walls. In Proceedings of the Eleventh International IBPSA Conference, Glasgow, UK, 27–30 July 2009. [Google Scholar]
  30. Palme, M.; Guerra, J.; Alfaro, S. Thermal Performance of Traditional and New Concept Houses in the Ancient Village of San Pedro De Atacama and Surroundings. Sustainability 2014, 6, 3321–3337. [Google Scholar] [CrossRef] [Green Version]
  31. Palme, M.; Guerra, J.; Alfaro, S. Earth of the Andes. Comparing Techniques and Materials Used in Houses in San Pedro de Atacama. In Proceedings of the 28th International PLEA Conference, Lima, Peru, 6–9 November 2012. [Google Scholar]
  32. Balaguer, L.; Vegas López-Manzanares, F.; Mileto, C.; García-Soriano, L. Assessment of the Thermal Behaviour of Rammed Earth Walls in the Summer Period. Sustainability 2019, 11, 1924. [Google Scholar] [CrossRef] [Green Version]
  33. Serrano, S.; Rincón, L.; González, B.; Navarro, A.; Bosch, M.; Cabeza, L.F. Rammed Earth Walls in Mediterranean Climate: Material Characterization and Thermal Behaviour. Int. J. Low-Carbon Technol. 2017, 12, 281–288. [Google Scholar] [CrossRef] [Green Version]
  34. Serrano, S.; de Gracia, A.; Cabeza, L.F. Adaptation of Rammed Earth to Modern Construction Systems: Comparative Study of Thermal Behavior under Summer Conditions. Appl. Energy 2016, 175, 180–188. [Google Scholar] [CrossRef] [Green Version]
  35. Beckett, C.T.S.; Cardell-Oliver, R.; Ciancio, D.; Huebner, C. Measured and Simulated Thermal Behaviour in Rammed Earth Houses in a Hot-Arid Climate. Part A: Structural Behaviour. J. Build. Eng. 2018, 15, 243–251. [Google Scholar] [CrossRef] [Green Version]
  36. Miño-Rodríguez, I.; Naranjo-Mendoza, C.; Korolija, I. Thermal Assessment of Low-Cost Rural Housing—A Case Study in the Ecuadorian Andes. Buildings 2016, 6, 36. [Google Scholar] [CrossRef] [Green Version]
  37. Ouédraogo, E. Determination of Parameters Influencing Thermal Comfort in a Building. Sci. J. Energy Eng. 2018, 6, 42. [Google Scholar] [CrossRef] [Green Version]
  38. Brambilla, A.; Jusselme, T. Preventing Overheating in Offices through Thermal Inertial Properties of Compressed Earth Bricks: A Study on a Real Scale Prototype. Energy Build. 2017, 156, 281–292. [Google Scholar] [CrossRef]
  39. SIA 180 Isolamento Termico, Protezione Contro l’umidità e Clima Interno Degli edifici. I-180 520180. 2014. Available online: http://shop.sia.ch/normenwerk/architekt/sia%20180/i/1999/D/Product (accessed on 7 April 2021).
  40. Zhang, L.; Sang, G.; Han, W. Effect of Hygrothermal Behaviour of Earth Brick on Indoor Environment in a Desert Climate. Sustain. Cities Soc. 2020, 55, 102070. [Google Scholar] [CrossRef]
  41. Heathcote, K. El Comportamiento Térmico de Los Edificios de Tierra. Inf. De La Construccióninf 2011, 63, 117–126. [Google Scholar] [CrossRef] [Green Version]
  42. Desogus, G.; Di Benedetto, S.; Grassi, W.; Testi, D. Environmental Monitoring of a Sardinian Earthen Dwelling during the Summer Season. J. Phys. Conf. Ser. 2014, 547, 012009. [Google Scholar] [CrossRef] [Green Version]
  43. Desogus, G.; Di Benedetto, S.; Ricciu, R. The Use of Adaptive Thermal Comfort Models to Evaluate the Summer Performance of a Mediterranean Earth Building. Energy Build. 2015, 104, 350–359. [Google Scholar] [CrossRef]
  44. ISO 13786: 2007. Thermal Performance of Building Components-Dynamic Thermal Characteristics- Calculation Methods; International Organization for Standardization: Geneva, Switzerland, 2007; Available online: https://www.iso.org/standard/65711.html (accessed on 7 April 2021).
  45. Ekici, C. A review of thermal comfort and method of using fanger’s pmv equation. In Proceedings of the 5th International Symposium on Measurement, Analysis and Modeling of Human Functions, Vancouver, BC, Canada, 27–29 June 2013. [Google Scholar]
  46. Zhang, J.; Xu, W.; Li, A.; Zheng, K.; Zhang, J. Study on Improving Thermal Environment and Energy Conservation of Quadrangle Adobe Dwelling. Energy Build. 2016, 129, 92–101. [Google Scholar] [CrossRef]
  47. Martín, S.; Mazarrón, F.R.; Cañas, I. Study of Thermal Environment inside Rural Houses of Navapalos (Spain): The Advantages of Reuse Buildings of High Thermal Inertia. Constr. Build. Mater. 2010, 24, 666–676. [Google Scholar] [CrossRef]
  48. Chel, A.; Tiwari, G.N. Thermal Performance and Embodied Energy Analysis of a Passive House—Case Study of Vault Roof Mud-House in India. Appl. Energy 2009, 86, 1956–1969. [Google Scholar] [CrossRef]
  49. Algifri, A.H.; Bin Gadhi, S.M.; Nijaguna, B.T. Thermal Behaviour of Adobe and Concrete Houses in Yemen. Renew. Energy 1992, 2, 597–602. [Google Scholar] [CrossRef]
  50. Meneses, T.; Vicente, R.; Costa, A.; Figueiredo, A.; Varum, H.; Soares, N. Comportamento térmico de construções em alvenaria de adobe: Ensaios experimentais sobre três células de teste à escala 1:4. In Proceedings of the VII Congreso Internacional de Arquitectura de Tierra, Valladolid, Spain, 26–27 September 2010. [Google Scholar]
  51. DECRETO-LEY 80/2006: “RCCTE— Regulamento das Características de Comportamento Térmico dos Edifícios”. 2006. Available online: https://dre.pt/home/-/dre/672456/details/maximized (accessed on 7 April 2021).
  52. DIN EN ISO 6946:2008-04: Building Components and Building Elements-Thermal Resistance and Thermal Transmittance-Calculation Method. 2008. Available online: https://shop.snv.ch/Standard/Protection-of-and-in-buildings/DIN-EN-ISO-6946/2008-04.html (accessed on 7 April 2021).
  53. Michael, A.; Philokyprou, M.; Thravalou, S. The Role of Adobes in the Thermal Performance of Vernacular Dwellings. In Proceedings of the XII Congrès Mondial sur les Architectures de Terre, Grenoble, France, 11–14 July 2016. [Google Scholar]
  54. El Fgaier, F.; Lafhaj, Z.; Brachelet, F.; Antczak, E.; Chapiseau, C. Thermal Performance of Unfired Clay Bricks Used in Construction in the North of France: Case Study. Case Stud. Constr. Mater. 2015, 3, 102–111. [Google Scholar] [CrossRef]
  55. Aranda-Jiménez, Y.G.; Espuna-Mujica, J.A.; Suarez-Domínguez, E.J. Structural and Thermal Monitoring of Sustainable Housing with Poured Earth Walls. Int. J. Sci. Res. Eng. Technol. (IJSRET) 2016, 5. [Google Scholar]
  56. Freney, M.H.P.; Soebarto, V.; Williamson, T. Thermal Comfort of Global Model Earthship in Various European Climates. In Proceedings of the 13th Conference of International Building Performance Simulation Association, Chambéry, France, 26–28 August 2013. [Google Scholar]
  57. Ip, K.; Miller, A. Thermal Behaviour of an Earth-Sheltered Autonomous Building—The Brighton Earthship. Renew. Energy 2009, 34, 2037–2043. [Google Scholar] [CrossRef]
  58. Ministry of Housing and Urban-Rural Development of the People’s Republic of China. GBT50785-2012, Indoor Thermal and Humidity Environment Evaluation Standard for Civil Buildings; China Building Industry Press: Beijing, China, 2012. (In Chinese)
  59. Asadi, S.; Fakhari, M.; Sendi, M. A Study on the Thermal Behavior of Traditional Residential Buildings: Rasoulian House Case Study. J. Build. Eng. 2016, 7, 334–342. [Google Scholar] [CrossRef]
  60. Rincón, L.; Carrobé, A.; Martorell, I.; Medrano, M. Improving Thermal Comfort of Earthen Dwellings in Sub-Saharan Africa with Passive Design. J. Build. Eng. 2019, 24, 100732. [Google Scholar] [CrossRef]
  61. Desideri, U.; Proietti, S.; Sdringola, P.; Vuillermoz, E. Feasibility Study and Design of a Low-Energy Residential Unit in Sagarmatha Park for Environmental Impact Reduction of High Altitude Buildings. In Proceedings of the 25th International Conference on Efficiency, Cost, Optimization and Simulation of Energy Conversion Systems and Processes, ECOS 2012, Perugia, Italy, 26–29 June 2012. [Google Scholar]
  62. Geiger, O. Insulated Earthbag Houses. Ezine Article. 2009. Available online: http://www.earthbagbuilding.com/articles/insulated.htm (accessed on 7 April 2021).
  63. Fivos Sargentis, G. Earth Building, Models, Technical Aspects, Tests and Environmental Evaluation. In Proceedings of the 11th International Conference on Environemental Science and Technology, Chania, Greece, 3–5 September 2009. [Google Scholar]
  64. Hyde, R. Bioclimatic Housing: Innovative Design for Warm Climates; Earthscan: London, UK, 2008; ISBN 978-1-84407-284-2. Available online: www.earthscan.co.uk (accessed on 7 April 2021).
  65. Zhao, Z.; Lu, Q.; Jiang, X. An Energy Efficient Building System Using Natural Resources--Superadobe System Research. Procedia Eng. 2015, 121, 1179–1185. [Google Scholar] [CrossRef] [Green Version]
  66. Stevanović, S. Optimal Rammed Earth Wall Thickness for a Single-Family House in Serbia, Rammed Earth Conservation. In Proceedings of the First International Conference on Rammed Earth Conservation, Valencia, Spain, 21–23 June 2012; pp. 223–228. [Google Scholar]
  67. Dong, X.; Soebarto, V.; Griffith, M. Achieving Thermal Comfort in Naturally Ventilated Rammed Earth Houses. Build. Environ. 2014, 82, 588–598. [Google Scholar] [CrossRef]
  68. Dong, X.; Soebarto, V.; Griffith, M. Design Optimization of Insulated Cavity Rammed Earth Walls for Houses in Australia. Energy Build. 2015, 86, 852–863. [Google Scholar] [CrossRef] [Green Version]
  69. Dong, X.; Soebarto, V.; Griffith, M. Strategies for Reducing Heating and Cooling Loads of Uninsulated Rammed Earth Wall Houses. Energy Build. 2014, 77, 323–331. [Google Scholar] [CrossRef]
  70. Degelman, L.O.; Soebarto, V.I. Software Description for Ener-Win: A Visual Interface Model For Hourly Energy Simulation. Build. Proc. Build. Simul. 1995, 95, 692–696. [Google Scholar]
  71. Nicol, J.F.; Humphreys, M.A. Adaptive Thermal Comfort and Sustainable Thermal Standards for Buildings. Energy Build. 2002, 34, 563–572. [Google Scholar] [CrossRef]
  72. Janjai, S.; Sripradit, A.; Wattan, R.; Buntoung, S.; Pattarapanitchai, S.; Masiri, I. A Simple Semi-Empirical Model for the Estimation of Photosynthetically Active Radiation from Satellite Data in the Tropics. Int. J. Photoenergy 2013. [Google Scholar] [CrossRef]
  73. Janjai, S.; Deeyai, P. Comparison of Methods for Generating Typical Meteorological Year Using Meteorological Data from a Tropical Environment. Appl. Energy 2009, 86, 528–537. [Google Scholar] [CrossRef]
  74. Coulibaly, O.; Ouédraogo, E.; Ouedraogo, A.; Koulidiati, J. Détermination d’années Météorologiques Types Utilisées Pour La Simulation Thermique et Énergétique Des Bâtiments de Dix Villes Du Burkina Faso. Afr. Sci. 2015, 11, 158–169. [Google Scholar]
  75. Hema, C.M.; Van Moeseke, G.; Evrad, A.; Courard, L.; Messan, A. Vernacular Housing Practices in Burkina Faso: Representative Models of Construction in Ouagadougou and Walls Hygrothermal Efficiency. Energy Procedia 2017, 122, 535–540. [Google Scholar] [CrossRef]
  76. Wati, E.; Meukam, P.; Damfeu, J.C. Modeling Thermal Performance of Exterior Walls Retrofitted from Insulation and Modified Laterite Based Bricks Materials. Heat Mass Transf. 2017, 53, 3487–3499. [Google Scholar] [CrossRef]
  77. Wati, E.; Bidoung, J.C.; Damfeu, J.C.; Meukam, P. Energy Performance of Earthen Building Walls in the Equatorial and Tropical Climates: A Case Study of Cameroon. Energy Effic. 2020, 13, 735–750. [Google Scholar] [CrossRef]
  78. Ozel, M. Determination of Optimum Insulation Thickness Based on Cooling Transmission Load for Building Walls in a Hot Climate. Energy Convers. Manag. 2013, 66, 106–114. [Google Scholar] [CrossRef]
  79. Collet, F.; Serres, L.; Miriel, J.; Bart, M. Study of Thermal Behaviour of Clay Wall Facing South. Build. Environ. 2006, 41, 307–315. [Google Scholar] [CrossRef]
  80. Zeghari, K.; Louahlia, H.; Leguern, M.; Boutouil, M.; Gualous, H.; Marion, M.; Schaetzel, P.; Goodhew, S.; Streif, F. Comparison of the Thermal Performance between Conventional and Cob Building. E3S Web Conf. 2019, 111, 03003. [Google Scholar] [CrossRef]
  81. Azhary, K.E.; Raefat, S.; Laaroussi, N.; Garoum, M. Energy Performance and Thermal Proprieties of Three Types of Unfired Clay Bricks. Energy Procedia 2018, 147, 495–502. [Google Scholar] [CrossRef]
  82. Toguyeni, D.Y.K.; Coulibaly, O.; Ouedraogo, A.; Koulidiati, J.; Dutil, Y.; Rousse, D. Study of the Influence of Roof Insulation Involving Local Materials on Cooling Loads of Houses Built of Clay and Straw. Energy Build. 2012, 50, 74–80. [Google Scholar] [CrossRef]
  83. Bou-Saada, T.E.; Haberl, J.S. An Improved Procedure for Developing Calibrated Hourly Simulation Models. Proc. Build. Simul. 1995. [Google Scholar]
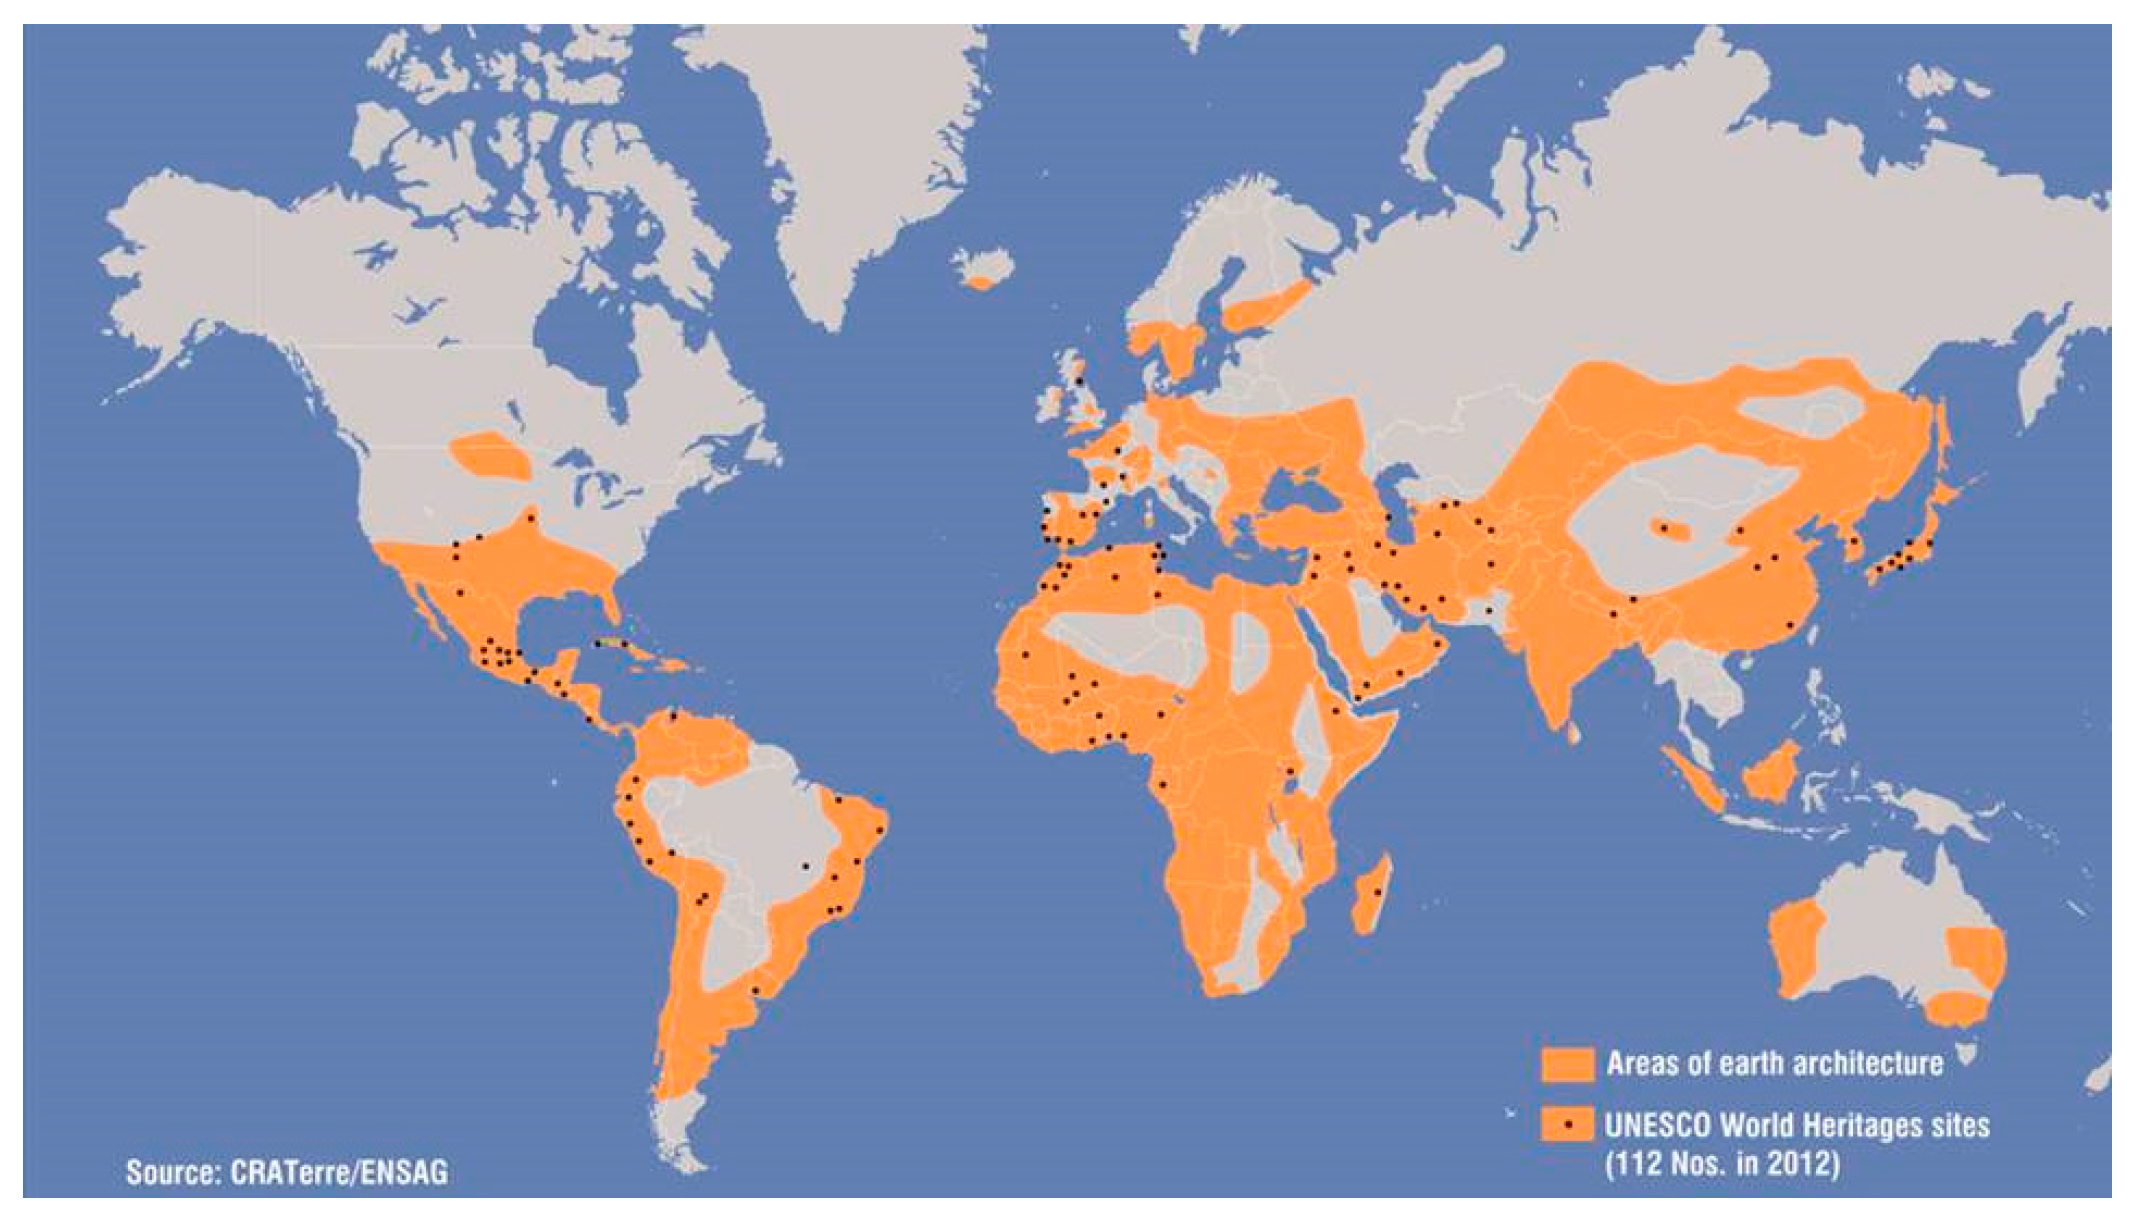
Figure 1. Earth construction areas of the world. Auroville Earth Institute, UNESCO chair earthen architecture. Building with Earth–Technique overview, 2012 [8].
Energies 14 02080 g001
Figure 2. Main earth techniques classification, according to water content [8].
Energies 14 02080 g002
Figure 3. Main earth techniques classification, according to the load bearing system [10].
Energies 14 02080 g003
Figure 4. Relation between the wall thickness and its thermal transmittance, according to each climate.
Energies 14 02080 g004
Figure 5. Decrement factor in function of the wall thickness.
Energies 14 02080 g005
Figure 6. Decrement Factor according to the climate and the earth construction technique.
Energies 14 02080 g006
Table 1. Main characteristics for earth construction technologies and correspondence with literature classifications.
TechniqueSoil CharacteristicsConstruction TechniqueWater ContentTools for ConstructionTime of ConstructionHouben & Guilland [10]Auroville Earth Institute [8]
Earthen dug out Energies 14 02080 i001(-)Digging out earth (Horiz. or Vert.) (-) (-) (-) 11
Earthbag Energies 14 02080 i002Any soilPVC continuous bags, building in layers5–20%Rammer, wireImmediately without interruptions173
Cut blocks Energies 14 02080 i003Lateritic soils rich in iron and aluminiumExcavate and cut the bricks directly from the ground0%Metal tools and large knife for cuttingAfter extraction, drying to gain more resistance82
Rammed earth Energies 14 02080 i004mix of soil with all granulometries (sand, clay, gravel)Fill formwork with layers of earth from 10 to 15 cm compacted5–20%Rammer, formworkThe placement of formwork and manual tamping is long55
Compressed earth blocks (CEB) Energies 14 02080 i005Balanced mix of sand, silt and clay. It cannot contain stone or gravelThe slightly humid screened earth is compressed into presses5–20%Manual pressImmediately after its manufacture6,75
Direct shaping Energies 14 02080 i006Plastic soilShaping the earth in place(-)Minimal and very simple, hands(-)46
Stacked earth Energies 14 02080 i007Land without stone or gravel, it can be clay or sandy, it must contain strawModelling the mixture in a plastic state building the wall in layers15–30%Non specificBetween layers drying time must be expected37
Cob Energies 14 02080 i008Mixture of clay, sand, straw and waterShaping and compressing together lumps to form the wall(-)Hands, feet or simple tools(-)15-
Adobe Energies 14 02080 i009Mud mixture with straw, no graver or stonesPoured mixture in a formwork, let it sun dry15–30%Metal formwork2 weeks to dry the blocks, stacking upon them11,12,138
Extruded earth Energies 14 02080 i010Sandy and stabilisedExtruded stabilized earth at a plastic state(-)Machine for the extruded bricksFast production of large homogeneous bricks109
Straw clay Energies 14 02080 i011Chopped straw and clay as stabilizerStraw clay bales in a timer frame(-)Wooden formwork30-ton wall in less than 5 days1611
Daubed earth Energies 14 02080 i012Thin, clayey, binder soil, mixed with straw to avoid fissuresWoven structure filled with mud mixture15–35%Any specificLong mixing preparation1410
Poured earth Energies 14 02080 i013Ordinary soil (some specifications)Poured earth in a formwork(-)FormworkPouring after doing the mixture. Wait until it dries212
Earth 3D * Energies 14 02080 i014Raw earth with clayEarth extruded45%Earth 3D printer9 min for the mixture 24 h for 3 m wall(-)(-)
Earthship ** Energies 14 02080 i015Ordinary soil(-)(-)Any specific(-)(-)(-)
(-) No information available. The pictures in column 1 are taken from the Auroville Earth Institute [8].* The picture is obtained from the WASP project. https://www.3dwasp.com/en/3d-printed-house-gaia/ accessed on 20 March 2021. ** This picture is obtained from the wikipedia, Earthship.
Table 2. Building characteristics and thermal performance of the dug out earth monitored studies.
Reference NumberMonitoring PeriodLocationClimateUseBuilding DescriptionDecrement FactorThermal LagThermal AmplitudeThermal Comfort
[14]cold period (Text < Tint) and warm period (Text > Tint)San Esteban de Gormaz (Spain)CfbIn-use building (warehouse)Deep: 10 m; Volume: 250 m3----
[15]#1, #2, #4: 1 June to 21 December #3, #5: 15 August to 21 DecemberDezful (Iran)BShIn-use buildings
(dwelling)
Depth from the courtyard level: #1: 9 m; #2: 8.8 m; #3: 7.25 m; #4: 6.5 m; #5: 8 m#1: 0.38; #2: 0.13; #3: 0.18; #4: 0.26; #5: 0.07-#1: 8.8 °C; #2: 4.5 °C; #3: 6.9 °C; #4: 9.1 °C; #5: 2.6 °C-
[16]2006–2009Ribera del Duero (Spain)CsbIn-use building (wine cellar)#1 (basement) 50 × 17 × 6 m3; #2 (earth-sheltered construction) 50 × 17 m2;
#3 underground construction) tunnel of 100 m long and 4 m high
#1: 0.33; #2: 0.18; #3: 0.10#1: 28 days; #2: 58 days; #3: 51 days-#1: 58%; #2: 80% #3: 100%
[17]#1: 2006–2009; #2: January 2008 to December 2009Ribera del Duero (Spain)CsbIn-use building (wine cellar)#1: cave of 10 m2, 2.4 m high, depth of 2.3 m + ventilation chimney; #2 cave of 84 m2, 2.5 m high, depth of 9 m + ventilation chimney.----
[18,19]2006–2007Morcuera (Soria, Spain)CsbIn-use building (wine cellar)#1: cave of 6 m2 and 1.9 m high, 3.1 m deep + 9 m canyon; #2 same as #1 with 6.5 m canyon; #3 linear layout cave of 12 m2, 7 m canyon.--Daily, weekly, montly average:#1: 0.2, 0.7, 2.3 °C; #2: 0.7, 1.6, 3.4 °C; #3: 0.2, 0.7, 2.1 °C-
[20]1 July to 7 JulyMorcuera (Soria, Spain)CsbIn-use building (wine cellar)#1: 16.2 m long hillside with no ventilation;
#2: 14.7 m long 3.4 m deep with 8 m canyon.
#1: 0.04; #2: 0-#1: 0.8 °C #2: 0 °C-
[21]-Miaoshang (China)BSkIn-use building (dwelling)9 cave rooms with the depth of 7.5 m and plane size of 12 m2 + Yaokang (Adobe stove)Summer: 0.19; Winter: 0.46---
[22]-Miaoshang (China)BSkIn-use building
(dwelling)
Four cave rooms located in north, south, east and west around a courtyard.0.21---
[23]Winter: 6 January to 28 February 2018; summer: 26 August to 26 September 2018Gongyi (China)CwaIn-use building (dwelling)7.6 × 3 m2 facing southSummer: 0.25; Winter: 0.1---
[24]15 January to 18 January 2000Jiang Yao Zu (China)DwaIn-use building (dwelling)Courtyard surrounded by cave rooms (3–3.8 m high) #1 Occupied cave room; #2 Unoccupied cave room#1: 0.057; #2: 0.4-#1: 7–8 °C; #2: 0.65 °C-
Table 3. Building characteristics and thermal performance of the earth dug out simulated studies.
Reference NumberLocationClimateUseBuilding DescriptionSimulation SoftwareVentilationThermal TransmittanceDecrement FactorThermal LagMonitoring vs. SimulationThermal ComfortComfort Standard
[14]San Esteban de Gormaz (Spain)Cfbin-use buildingDeep: +10 m; Volume: 250 m3STAR-CCM+-----average temperature of 10.5 °C-
[17]Ribera del Duero (Soria, Spain)Csbin-use building (wine cellar)Cellar #1 is 5 × 2 × 2.4 m3 and cellar #2 is 20 × 4.2 × 2.5 m3. Both with a ventilation chimneyEnergyPlus--#1: 0.19–0.35 (average 0.28); #2: 0.05–0.11 (average 0.08).#1: 39–63 days (average 49);
#2: 63–92 (average 78)
---
[22]Miaoshang (China)BSkin-use building9 cave rooms with the depth of 7.5 m and plane size of 12 m2 + Yaokang (Adobe stove)Sketchup + EnergyPlus--0.42 (annual behaviour)-Average deviation in: Summer: 0.54%; Winter: 3.08%; Spring: 3.1%42.8% in comfort Zone IIChinese Standard, GBT50785−2012
[23]Gongyi (China)Cwain-use building7.6 × 3 m2 facing southEnergyPlus-Cave roof: 0.067 W/(m2·K); South façade: 1.72 W/(m2·K) and Interior wall: 0.2 W/(m2·K)-Cave roof: 360.15 h; South façade: 10.06 h; Interior wall: 109.04 hNMBE: 0.6% (summer) and 2.6% (winter); RMSE: 4.1% (summer) and 6.1% (winter).52.3% in comfort Zone IIChinese Standard, GBT50785–2012
[24]Jiang Yao Zu (China)Dwain-use buildingcourtyard surrounded by cave rooms (3–3.8 m high) 0.43 ACHEarth wall: 1.56 W/(m2·K)-0.5 h for the courtyard1.7% deviation in the courtyard; 16% for the south cave room and 8.5% for the west cave room.--
[59]Yazd (Iran)Bwkin-use building-ECOTEC + EnergyPLus--Summer: 0.03–0.08-RMSE: 0.19–0.97--
Table 4. Building characteristics and thermal performance of the earthbag monitored studies.
Reference NumberMonitoring PeriodLocationClimateUseThicknessThermal TransmittanceDecrement FactorThermal LagThermal Comfort
[13]July 2017–June 2018Lleida, (Spain)BSkExperimental building70 cm (buttress)–28 cm (roof)2.7 W/(m2·K)Theory: 0.12; winter 0.12; equinox 0.19; summer 0.10Theory: 8.1 h; Experimental: Free floating (8–9 h)Good performance in hot climates
Table 5. Building characteristics and thermal performance of the earthbag simulated studies.
Reference NumberLocationClimateUseSimulation SoftwareBuilding DescriptionThicknessVentilationConductivity/Thermal TransmittanceDecrement FactorThermal LagThermal ComfortComfort Standard
[13]Lleida
(Spain)
BSkExperimental buildingEnergyPlusDome Ø3 m, height 3.3 m70 cm (buttress)–28 cm (roof)0.5 ACH (base); 10 ach (night ventilation)2.7 W/(m2· K)Free floating winter, equinox, summer (0.17; 0.16; 0,14)Free floating winter, equinox, summer (8, 7, 6 h)good performance in hot climatesASHRAE Standard 55 Adaptive Comfort
[60]Ouagadougou (Burkina Faso)BshIn-use buildingEnergyPlusDome Ø4.5 m, height 4.7 m64 cm (buttress)–32 cm (roof)0.5 ach (base); 4 ach (night ventilation)1.1 W/(m·K)0.15 (equinox)-94–99% better than adobeASHRAE Standard 55 Adaptive Comfort
[61]Sagarmatha National Park (Nepal)CwaIn-use building-Modified earthbag + insulation33 cm-0.22 W/(m2·K)----
[63]---ECOTECone space earthbag construction-------
[65]---PHOENICS--------
Table 6. Building characteristics and thermal performance of the rammed earth monitored studies.
Reference NumberMonitoring PeriodLocationClimateUseBuilding DescriptionThicknessConductivity/Thermal TransmittanceDecrement FactorThermal LagThermal Amplitude
[26]March 2013 to June 2015Saint-Antoine l’Abbaye (France)CfbIn-use buildingtwo floors, 150 m2, 3 m high50 cm0.6 W/(m·K) completely dried0.09–0.26–9 h-
[27]4 July 2008 to 1 April 2009Leicestershire (UK)CfbIn-use building-17.5 cm + 5 cm extruded polystyrene insulation + 17.5 cm0.643 W/(m·K)---
[28]13 February 2001–13 March 2000)Albury-Wodonga (Australia)CfaIn-use buildingtwo floors with offices, 10 m230 cm----
[29]-Willunga, Adelaide (Australia)CsbIn-use building104 m2, occupied by 2 people mainly on weekends and night time22 cm external, 11 cm internal----
Willunga, Adelaide (Australia)CsbIn-use building96 m2 occupied by 1 person33 cm external, 22 cm internal ---
-Willunga, Adelaide (Australia)CsbIn-use building175 m2, occupied by 5 person11 cm + 2.5 cm air gap + R2 insulation externally clad----
[30,31]-San Pedro de Atacama (Chile)BWkIn-use building-50 cm wall, 15 cm earth roofTheoretical: wall (1.3 W/(m2 K)); roof (2.3 W/(m2·K))summer: 0.14; winter: 0.13--
[32]-La Serranía, Valencia (Spain)BskIn-use building345.5 m2 in three floors50 cm1.58 W/(m2·K)0.08Increasing temp: 5–8; decreasing Temp: 1–2 h1.5 °C
[33]Summer and winter 2013Barcelona (Spain)CsaExperimental building2.48 × 2.15 × 2.50 m3 inner dimensions50 cm-summer: 0.2; winter: 0.25-Inner surface summer: 2 °C; winter 0.5 °C. External surface summer: 5 °C; winter: 1 °C
Puigverd de Lleida (Spain)Csa/CfaExperimental building2.40 × 2.40 × 2.40 m3 of inner dimensions29 cm-summer: 0.23; winter: 0.3-Inner surface summer: 3.5 °C; winter 5 °C. External surface summer: 15°C; winter: 17 °C
[34]Summer 2015Puigverd de Lleida (Spain)Csa/CfaExperimental building2.40 × 2.40 × 2.40 m329 cm-Free floating in winter: 0.17-Winter: 1–2 °C
Puigverd de Lleida (Spain)Csa/CfaExperimental building3 cubicles of 2.40 × 2.40 × 2.40 m329 cm + 6 cm wood fibers panel + 1 cm clay and straw coating-Free floating in winter: 0.11-winter <1 °C
[35]-Kalgoorlie-Boulder (Australia)BwhExperimental buildingComplete house. 50.3 m × 20.1 m231 cm thick-0.103–0.1910.364–1.5 h-
-Kalgoorlie-Boulder (Australia)BwhExperimental buildingComplete house. 50.3 × 20.1 m231 cm thick; kitchen and bathroom 30 cm + insulation-0.108–0.1470.48–0.949 h-
Table 7. Building characteristics and thermal performance of the rammed earth simulated studies.
Reference NumberSimulation SoftwareLocationClimateUseBuilding DescriptionThicknessMonitoring vs. SimulationVentilationConductivity/Thermal TransmittanceDecrement FactorThermal LagThermal ComfortComfort Standard
[27]WUFI Plus v1.2Leicestershire (UK)Cfbexperimental buildingOne space room 8 m217.5 cm + 5 cm extruded polystyrene insulation + 17.5 cm1 °C discrepancy1.5 ACH-----
[28]TRNSYSAlbury-Wodonga (Australia)CfaIn-use buildingtwo floors with offices, 10 m230 cm-----75%ASHRAE Standard 55 Adaptive
[29]-Willunga, Adelaide (Australia)CsbIn-use building104 m2, occupied by 2 people mainly on weekends and night time22 cmcorrelation coefficient (R2) in summer: 0.9870.8 ACHTheory: 4.26 W/(m2·K)Theory: 0.714Theory: 2.81 h--
-Willunga, Adelaide (Australia)CsbIn-use building96 m2 occupied by 1 person33 cmcorrelation coefficient (R2) in winter: 0.828; summer: 0.9870.8 ACHTheory: 3.089 W/(m2·K)Theory: 0.374Theory: 6.16 h--
-Willunga, Adelaide (Australia)CsbIn-use building175 m2, occupied by 5 person11 cm + 2.5 cm air gapcorrelation coefficient (R2) in summer: 0.9840.8 ACHTheory: 2.411 W/(m2·K)Theory: 0.189Theory: 9.3 h--
[30,31]ECOTECSan Pedro de Atacama (Chile)BWkIn-use building-50 cm wall, 15 cm earth roof-0.4 ACH-80%14 hReduction 70% discomfortASHRAE standards
[35]-Kalgoorlie-Boulder (Australia)BwhExperimental buildingComplete house. 50.3 m × 20.1 m31 cm thick---0.119–0.4250.357–5.75 h--
-Kalgoorlie-Boulder (Australia)BwhExperimental buildingComplete house. 50.3 m × 20.1 m31 cm thick; kitchen and bathroom 30 cm + insulation---0.145–0.4270.69–3.4 h--
[66]EnergyPlusBelgrade (Serbia)Cfain-use building83 m230–40−50 cm-0.7 ACH2.07, 1.76 and 1.54 W/(m2·K)---2010/31/EU
[67]AccuRateLongreach (Australia)Bshexperimental buildingOne space room 8 × 12 m---1.25 W/(m·K) (AccuRate library)Winter: 0.32; Summer: 0.37Winter: 7.5; Summer: 937% overheatingASHRAE Standard 55 Adaptive
AccuRateAdelaide (Australia)Csbexperimental buildingOne space room 8 × 12 m---1.25 W/(m·K) (AccuRate library)Winter: 0.38; Summer: 0.45Winter: 8; Summer: 10.550% out of the limitsASHRAE Standard 55 Adaptive
AccuRateBallarat (Australia)Cfbexperimental buildingOne space room 8 × 12 m---1.25 W/(m·K) (AccuRate library)Winter: 0.41; Summer: 0.31Winter: 7; Summer: 8.570% UndercoolingASHRAE Standard 55 Adaptive
Table 8. Building characteristics and thermal performance of the compressed earth blocks monitored studies.
Reference NumberMonitoring PeriodLocationClimateUseThicknessConductivity/Thermal TransmittanceDecrement FactorThermal LagThermal AmplitudeComfort Standard
[36]-Zumbahua (Equator)ETIn-use building14 cm thick + plaster coating (unspecified thickness)2.24 W/(m2 K)0.62.5 h for increase. 1 h for decrease--
[37]-Burkina FasoBShExperimental building14 cm or 28 cmEarth with paper (0.588 W/(m2·K)), Only earth (0.644 W/(m2·K)), earth with cement and paper (0.671 W/(m2·K)), earth with cement (0.742 W/(m2·K)).33.54–44%6–7 h--
[38]summer 2016Fribourg (Switzerland)CfbExperimental building14 + 18 cm insulation0.79 W/m·K0.182 h3.1 °CSIA 180:2014
[40]1 August to 4 August 2016Turpan (China)BwkIn-use building40 cm + 1.5 cm cement-lime mortar---Ground floor: 2.5 °C; Semi-underground floor: 0.5 °C; first floor: 2 °C-
Table 9. Building characteristics and thermal performance of the compressed earth blocks simulated studies.
Reference NumberSimulation SoftwareLocationClimateUseThicknessMonitoring vs. SimulationVentilationDecrement FactorThermal LagThermal Comfort
[36]EnergyPlusZumbahua (Equator)ETIn-use building14 cm thick + plaster coating (unspecified thickness)R2: 0.89; RMSE: 1.1 °C---75% under comfort
[37]-Burkina FasoBShExperimental building14 cm or 28 cmMBD < 5.6%; RMSD < 10%- -
[40]EnergyPlusTurpan (China)BwkIn-use building30 cm-0.5 ACH (base); night ventilation 2.5 ACH---
[75]-Ouagadougou (Burkina Faso)BshExperimental building------
[76]EnergyPlusGaroua (Cameroon)AmExperimental building30 cm--CSEB 0,6; Sawdust 0.3; Pozzolan 0.2sawdust +4.21%; Pozzolan + 16.14%-
[77]-Garoua, Youndé and Douala (Cameroon)Am, AwIn-use building14 cm-0.35 ACH---
Table 10. Building characteristics and thermal performance of the Cob simulated studies.
Reference NumberSimulation SoftwareLocationClimateUseBuilding DescriptionThicknessVentilationConductivityDecrement Factor
[79]TRNSYSRennes (France)Cfbin-use building32 dwellings of 65.7 m230 to 80 cm60 m3/h--
[80]-France and UKCfbin-use buildingtwo floors35 cm insulation Cob + 30 cm construction cob-insulation Cob (0.1 W/m·K); construction cob (0.494 W/m·K)-
Table 11. Building characteristics and thermal performance of the adobe monitored studies.
Reference NumberMonitoring PeriodLocationClimateUseBuilding DescriptionThicknessConductivity/Thermal TransmittanceDecrement FactorThermal LagThermal AmplitudeThermal ComfortComfort Standard
[30,31]Summer 2012San Pedro de Atacama (Chile)BWkIn-use buildingBedroom and small lavatory30 cm + rammed earth roof 15 cm-Summer 0.29; Winter 0.27Summer: 3–4 h; Winter: close to zeroSummer: 1.5 °C; Winter: 6 °C--
[41]March 2007 (summer) and May 2007 (winter)Australia-Experimental building4 m225 cm stabilized with bitumenTheoretical: 0.82 W/m·KWinter: 0.33; Summer: 0,27Theoretical: 8 h; Summer 5–6 h; Winter: 3–4 hWinter: 4 °C; Summer: 1.75 °C--
[42]Summer 2010Serramanna (Italy)CsaIn-use buildingLiving room (24.5 m2) and bedroom (14.7 m2)40 cmExperimental in the lab: 0.127 W/(m2·K)Experimental in the lab: 0.098; monitored: 0.11Experimental in the lab: 14.5 h---
[43]Summer 2011Serramanna (Italy)CsaIn-use buildingLiving room (24.5 m2) and bedroom (14.7 m2)-----Living room 99% bedroom 87%Fanger’s method
[46]8 December 2012 to 30 December 2012Gansu (China)BSk or BWkIn-use building---0.2651 h-−2 (Cool)PMV
[47]Summer: 20 June to 1 July; Winter: 1 January to 8 MarchNavapalos (Spain)CsbIn-use building-Adobe (40 × 20 × 15 cm) + 1 cm plaster1.35 W/(m2·K)Winter: 0.12; Summer: 0.13--cross point: 7 °C (Winter) and 21°C (summer)cumulative distribution function (CDF)
[48]-New Delhi (India)BshIn-use building6 rooms (3 inverted U-shaped rooms and 3 dome shaped rooms)36 cm1.39 W/(m2·K)Winter: 0.28–0.33; Summer: 0.18–0.28----
[49]-Sieyoung (China)BWhIn-use building-55 cm adobe + 0.5 cm of mud plaster-Winter: 0.1Summer: 14–15 h, Winter 12–14 h<5 °C--
-Lahij
(Yemen)
BWhIn-use building-56 cm adobe + 0.5 cm of mud plaster-Summer: 0.02; Winter: 0.05Summer: 12–16 h, Winter 17 h<5 °C--
[50]MayUniversdade de Aveiro (Portugal)CsbExperimental buildingOne space area of 1 × 1.35 × 0.75 m, with adobe bricks of 11.25 × 7.5 × 3.75 cmAdobes produced in the lab2.06 W/(m2·°C) (RCCTE) and 2.22 W/m2· K (DIN EN ISO 6946)0.713 h 16 min---
MayUniversdade de Aveiro (Portugal)CsbExperimental buildingOne space area of 1 × 1.35 × 0.75 m, with adobe bricks of 11.25 × 7.5 × 3.75 cmadobes taken from a demolished construction in Aveiro1.83 W/(m2· K) (RCCTE) and 1.95 W/(m2·°C) (DIN EN ISO 6946)0.662 h 17 m---
MayUniversdade de Aveiro (Portugal)CsbExperimental buildingOne space area of 1 × 1.35 × 0.75 m, with adobe bricks of 11.25 × 7.5 × 3.75 cmAdobes produced in the lab adding 2% cork.1.47 W/(m2· K) (RCCTE) and 1.65 W/m2·°C (DIN EN ISO 6946)0.62 h 05 min---
[53]-CyprusBShExperimental building-50 cm-Summer: 0.03; winter: 0.0085---
Table 12. Building characteristics and thermal performance of the adobe simulated studies.
Reference NumberSimulation SoftwareLocationClimateUseBuilding DescriptionThicknessMonitoring vs. SimulationVentilationThermal TransmittanceDecrement FactorThermal LagThermal ComfortComfort Standard
[30,31]ECOTECSan Pedro de Atacama (Chile)BWkIn-use buildingBedroom and small lavatory30 cm, 15 cm (roof)-0.4 ACH-55%8 h5500 h discomfortASHRAE 55 Adaptive comfort model
[46]FLUENTGansu (China)BsIn-use building---------
[48]-New Delhi, Bangalore, Jodhpur, Mumbai and Srinagar (India)BshIn-use building--R2 097–0.98; RMSE 0.2–3%------
[60]EnergyPlusOuagadougou (Burkina Faso)BshIn-use buildingone space area, 15.9 m215 cm-0.5 ACH; night ventilation (4 ACH)0.95 W/(m2·K)--+3000 h discomfort; + 200 discomfort degree daysASHRAE 55 Adaptive comfort model, Discomfort degree days (DDD)
Table 13. Building characteristics and thermal performance of the extruded earth monitored studies.
Reference NumberMonitoring PeriodLocationClimateUseThicknessConductivityDecrement FactorThermal Lag
[54]26 July 2012 to 12 July 2013Lille (France)CfbExperimental building46–60 cm0.9 W/m·K0.210 h
Table 14. Building characteristics and thermal performance of the extruded earth simulated studies.
Reference NumberSimulation SoftwareLocationClimateUseBuilding DescriptionVentilationDecrement FactorThermal Lag
[81]Design BuildingMarrakechBsh-288 m236 m3/hwinter: 0.33; summer 0.2-
Table 15. Building characteristics and thermal performance of the straw clay simulated studies.
Reference NumberSimulation SoftwareLocationClimateUseBuilding DescriptionThicknessVentilationThermal TransmittanceDecrement Factor
[82]TRNSYS 16.1Ouagadougou (Burkina Faso)BshIn-use building50.02 m220 cm clay and 20 cm clay-straw 3%-clay: 2.12 W/(m2·K); clay-straw 3%: 0.53 W/m2·K-
Table 16. Building characteristics and thermal performance of the earthship monitored studies.
Reference NumberMonitoring PeriodLocationClimateUseThicknessThermal TransmittanceDecrement FactorThermal LagThermal ComfortComfort Standard
[56]2012Taos (New Mexico, USA)DfbIn-use building160 cm0.613 W/(m2·K)Summer: 0.13; Winter: 0.33---
[57]2004–2005Brighton (United Kingdom)CfbIn-use building100 cm (tyres + earth)-Summer: 0.37; Winter: 0.625-80%ASHRAE 55 Adaptive comfort
Table 17. Building characteristics and thermal performance of the earthship simulated studies.
Reference NumberSimulation SoftwareLocationClimateUseMonitoring VS SimulationVentilationThermal TransmittanceDecrement Factor
[56]EnergyPlus + Design BuilderTaos (USA), Paris (France) Albacete, Seville and Valladolid (Spain), and London (UK)Dfb, Cfb BSk Csa Csb CfaIn-use buildingRMSE: 6.3%---
Publisher’s Note: MDPI stays neutral with regard to jurisdictional claims in published maps and institutional affiliations.