Abstract
Maximum power point tracking (MPPT) algorithms are invariably employed to utilize solar photovoltaic (PV) systems effectively. Perturbation based MPPT algorithms are popular due to their simplicity and reasonable efficiency. While novel MPPT algorithms claim increased energy utilization over classic perturbation techniques, their performance is governed by the choice of optimal algorithm parameters. Existing guidelines for parameter optimization are mathematically laborious and are not generic. Hence, this paper aims to provide simple and comprehensive guidelines to ensure optimal performance from the perturbation based MPPT technique. For an illustration of proposed claims, a solar PV fed boost converter is investigated to examine the effect of input capacitor, digital filter cut-off frequency, system time constant and sampling time on implementing a classic Perturb and Observe (P and O) algorithm. The readers will be presented with two simple step tests (to determine the effective system time constant) and proposed guidelines to choose the optimal performance sampling time. Necessary laboratory experiments show that an appropriate choice of sampling time could increase efficiency and ensure system stability. This investigation’s learnings can be easily extended to any power electronics converter, loads and all perturbation-based algorithms used in solar PV systems. The results of appropriate tests on the system’s mathematical model and the laboratory prototype are presented in detail to support this research’s claims.
1. Introduction
To meet growing energy needs, it is inevitable that renewable technology will be adopted for energy decarbonization. Solar photovoltaic (PV) power is foreseen to mature as the world’s largest electricity source by 2050 with the current potential in the range of 1575–49,837 exajoules [1]. The available solar energy can be harnessed in standalone or grid-connected mode. Irrespective of the application of solar PV systems, the maximum power point tracking (MPPT) algorithm is mandatory to ensure optimal power extraction from the solar PV system due to non-linear P-V (power-voltage) characteristics.
The Solar PV system’s P-V curve exhibits a non-linear characteristic with only one peak power operating point. The system operates at this Maximum Power Point (MPP) when source impedance matches load impedance [2]. Perturbation techniques are popular for achieving MPP due to factors like minimal sensors and ease of implementation [3]. System variables like duty ratio (D), PV voltage () and PV current () are continuously perturbed to force the system to operate at MPP against disturbances like changing irradiances and loads [4]. Research in perturbation-based MPPT has evolved in two folds, namely novel algorithms and optimization of system parameters.
Novel algorithms include classic algorithms like Perturb and Observe (P and O) method and Incremental Conductance (InC) method. Also, research is fast emerging in modifying these basic algorithms to improve energy extraction. An attempt is made to consolidate research of modifications in classic P and O algorithm [5]. In addition, attributes like drift avoidance [6,7,8] and current perturbation [9] based adaptive P and O are discussed. On similar grounds, adaptive InC [10] and modified InC algorithms [11] are also discussed in literature. The novel MPPT algorithms mentioned above [10,11] claim improved performance over the classic perturbation based MPPT algorithms. However, their performance is subject to the optimal choice of the MPPT algorithm’s parameters namely sampling time () and step size ().
Several investigations are carried out to study the effect of and on system performance. A theoretical analysis guiding the optimal choice of and to improve the dynamic performance of the P and O algorithm is proposed [12,13]. The research is carried out obtaining a small-signal model of PV fed DC-DC boost converter and formulating optimal value of and using the settling time of the step response of the modeled plant. The influence of and step size () is studied for P and O algorithm to investigate system stability, system performance and energy extraction [14]. This research focused more on studying the effects of limiting discussions on selecting . A similar investigation is carried out for the InC algorithm [15]. Recently an attempt is made to develop guidelines for the choice of optimal and for solar PV fed boost converter with P and O algorithm [16,17]. This work’s main contribution is the guidelines for optimal developed using the small-signal model of the system under consideration, while the procedure for selection of is the same as explained in [12]. A new research finding has reported that the solar PV system’s response time is slower for the operating point in the constant current region [18]. Accordingly, the guidelines presented in [16] are modified to propose the MPPT algorithm’s parameter optimization in the solar PV system’s constant current region. Parametric identification method using Dichotomous Coordinate Descent-Recursive Least Squares (DCD-RLS) algorithm is proposed to determine the solar PV system’s settling time continuously [19]. This information is used to set the optimal for every cycle. The algorithm cannot simultaneously execute system identification and MPPT and hence suffers poor performance for fast-changing irradiances.
It is evident from the literature discussions that the choice of and () governs the performance, energy utilization and stability of the perturbation based MPPT algorithm with a solar PV system. Numerous researchers have discussed the optimization of these parameters wherein the values obtained are from the developed small-signal models under consideration [12,19]. The se developed small-signals models are not generic and are to be designed for every converter and load. Furthermore, online estimation of proposed in [19] is computationally complex and suitable for large-scale solar PV systems. Optimization of alone is attempted to enhance system stability and energy utilization [20,21]. Several researchers have also proposed zero-oscillation MPPT algorithms [22]. However, if is not judiciously chosen, the system is prone to disturbances and instability. Hence appropriate selection of is more crucial than that of () for performance enhancement of solar PV system with perturbation based MPPT algorithm.
In this paper, two simple step-tests are presented to determine the effective system time constant of solar PV system employing empirical formulation based on experimentation. This method eliminates the need to develop a small-signal model and applies to a solar PV system with any power converter and load. The combined effects of input capacitance, digital filter cut-off frequency, and choice of sampling time on the solar PV system’s energy extraction are investigated. The guidelines for selecting are proposed for optimal performance of perturbation based MPPT algorithm based on empirical formulation obtained using two simple tests conducted on solar PV fed boost converter. The following objectives are outlined as contributions of this paper:
- To study the effect of input capacitance on the system time constant and determine system time constant using a simple step test (Step test 01).
- To study the digital filter’s impact on the system time constant as seen by the controller (Step test 02).
- To address the choice of the sampling frequency of PV voltage and current based on the estimated system time constant for optimal energy extraction using perturbation techniques.
The rest of the paper is organized as follows: In Section 2, the theoretical concepts and the mathematical model of solar PV fed boost converter is presented. Section 3 describes the details of the proposed tests and guidelines for performance optimization. Section 4 outlines the results and discussions of the study. The conclusions for the research are presented in Section 5.
2. Solar PV Fed Boost Converter
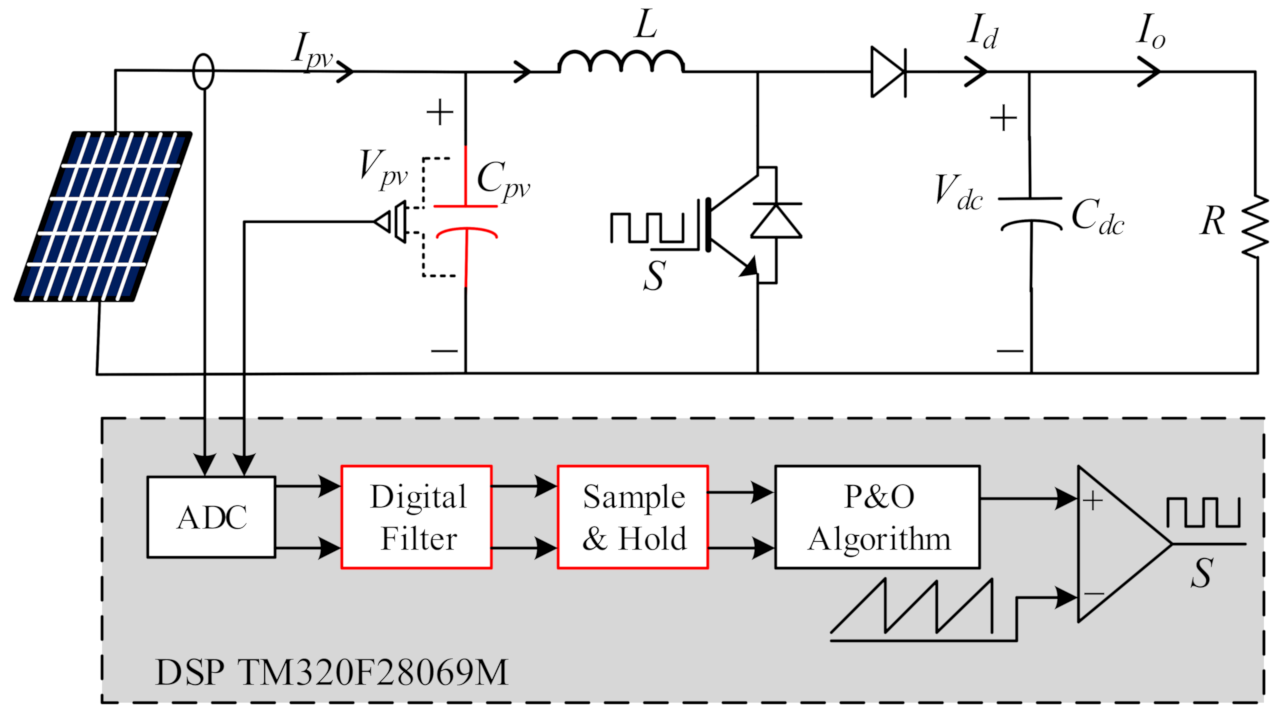
In this section, the system employed to deliberate the objectives is discussed. Also, the components of the system and system parameters affecting overall performance are illustrated in detail. Figure 1 shows the schematic of solar PV fed boost converter with P and O algorithm. The system consists of a solar PV array, boost type DC-DC converter feeding resistive load and the system controller. P and O algorithm with direct duty ratio perturbation is adopted to ensure maximum power transfer from the source to the load [14]. For simulation studies, the required and are sampled and are processed using P and O algorithm to generate appropriate D. In case of experimentation, the required signals are read using inbuilt ADC of the controller . Further, a digital filter is employed to eliminate high-frequency noise before the signals are fed to the P and O algorithm. The important system parameters affecting the performance of the system are highlighted in red in Figure 1 and described below.
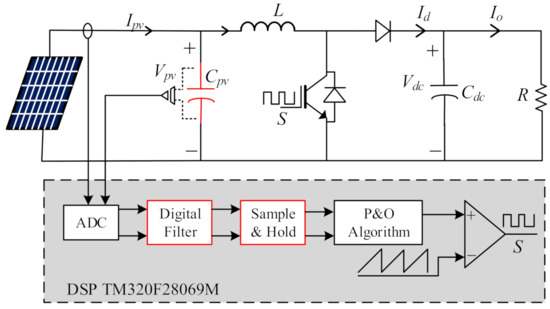
Figure 1.
Schematic of solar photovoltaic (PV) fed boost converter and system controller.
2.1. Input Capacitance and Its Effect on the System Time Constant
The switching frequency () of the boost converter is of the order of 10 kHz. This high introduces transients in all currents and voltages of the converter. In a boost converter based PV system, the ripple in inductor current influences the ripple in and . This ripple leads to reduction of the average values of and hence . The inclusion of input capacitance helps in reducing this ripple content considerably. This , by definition is given by Equation (1)
It is imperative from Equation (1) that for a given operating point on PV curve, the values of and remain unchanged and the time (t) taken for charging and discharging of capacitor varies directly depending on the value of . Hence the settling time of the responses of and increases with increase in and vice versa.
2.2. Digital Filter Design and Its Effect on System Time Constant
The high switching frequency of the boost converter and the process of analog to digital conversion of and results in high-frequency noise in these signals. This noise, if untreated, leads to reduced efficiency of the PV system and/or system instability. The use of digital filters in experimental studies is imperative due to the presence of non-idealities and the high-frequency noise added during ADC sampling. Literature suggests that the first-order low-pass filter described by Equation (2) is adequate to filter the high-frequency noise [13,23].
where is the cut-off frequency of the filter in electrical rad/sec.
In this study, a first-order low-pass filter is designed in conitnous time domain and its digital coefficients are obtained using the bilinear transformation. This filter results in attenuation and additional delay of the signals given by Equations (3) and (4), respectively. The attenuation caused by this filter is negligible; however, the delay caused by the filter significantly influences the performance of the MPPT algorithm if the cut-off frequency is not chosen judiciously.
2.3. Effect of Sampling time on System Performance
The speed and efficiency of the perturbation based MPPT algorithm are mainly decided by the sampling time [19]. If the is less than the required value, it leads to reduced efficiency and, in the worst case, may cause system instability. On the contrary, if the chosen is more than required, it results in a sluggish algorithm response for fast varying insolation conditions. Hence the judicious choice of is inevitable to ensure optimal speed and stability of perturbation-based MPPT algorithms.
2.4. Mathematical Model
In this section, the mathematical modelling of the overall system is discussed in detail. Figure 2 shows the equivalent circuit of the system under test. The PV array is modelled using single diode model [24]. The boost converter is modelled using the concept of switching function. The input capacitance () present between PV array and the boost converter is modeled as extended part of PV module modelling.

Figure 2.
Equivalent circuit of single diode model of solar PV cell and ideal boost converter (using switching function).
The current available at terminals of PV cell is governed by internal (series and parallel resistance of PV cell) and external factors (solar irradiance, temperature) [24]. Employing KCL, is derived using (5).
The current generated by light is dependent on solar irradiance and temperature given by Equation (6)
The diode saturation current is dependent on the ambient temperature given by Equation (7)
A capacitor used at the output of the PV cell is used to derive the PV voltage given by (10).
3. Proposed Tests and Guidelines for System Parameter Based Performance Optimization
In this section, the details of the proposed tests and the guidelines for optimal solar PV system performance with a perturbation-based MPPT algorithm is discussed in detail. Also, preliminary test results and their inferences are presented to support the objectives’ claims.
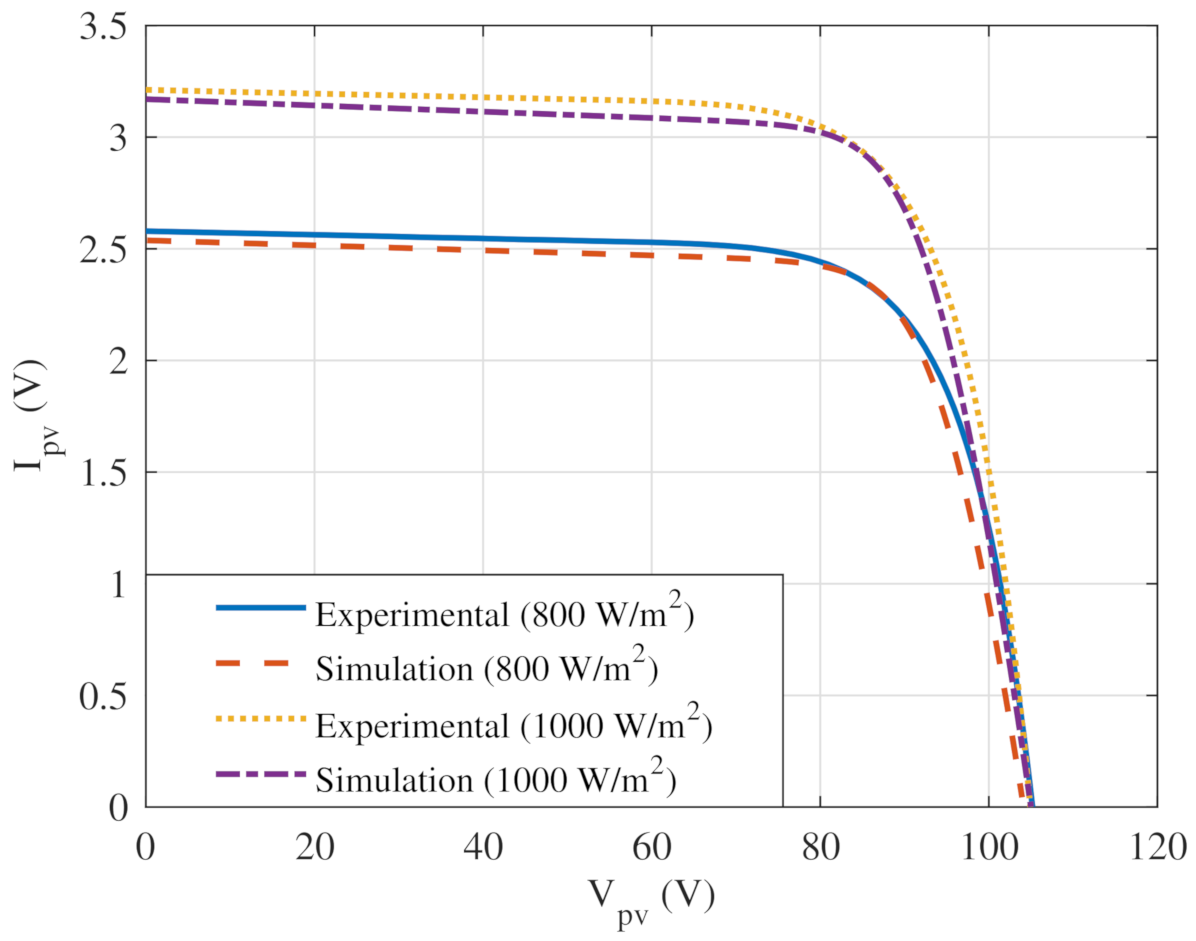
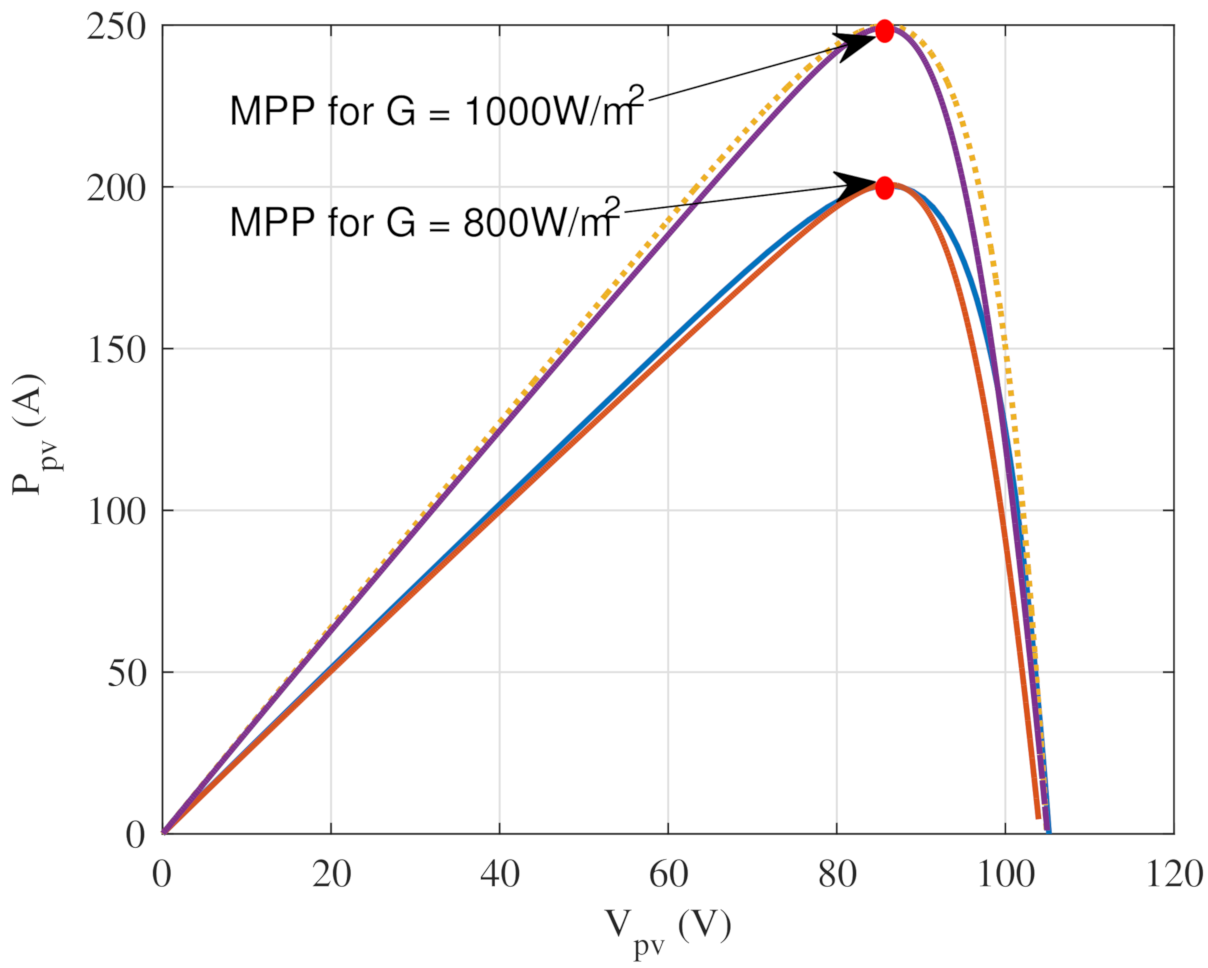
The system parameters used for simulation and emulation studies are taken of commercial 50 W PV module from WAREE and are listed in Table 1. Figure 3 and Figure 4 shows the and curves obtained using the mathematical model and the solar emulator. The characteristics are in close agreement proving the validity of the mathematical model used for system simulation.

Table 1.
Electrical characteristics of ARKA series WAREE WS-50 solar PV module measured at STC .
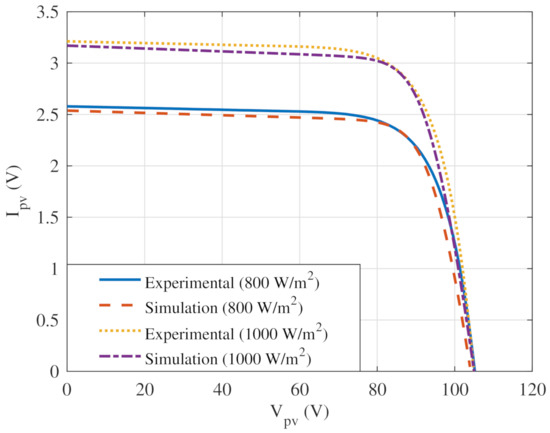
Figure 3.
Characteristic.
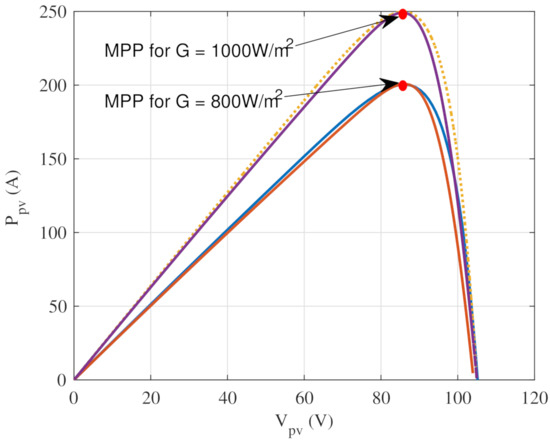
Figure 4.
Characteristic.
3.1. Step Test 01—Determination of Optimum Value of Input Capacitance
To restrict the effect of harmonics induced by virtue of high switching frequency in boost converter, an input capacitor () is connected across the PV array and is calculated using Equation (11), [2]
where
(inductor current ripple) = of
= of
T = , being the switching frequency of Boost converter.
The value of calculated using above parameters and Equation (11) is . In this study, is chosen for simulation and experimental investigations to account for non-idealities, ADC noise and factor of safety. A simple test (Step test-01) is employed to determine the approximate system time constant of system under consideration for different values of .
Step test 01: Following are the sequence of steps involved in carrying out the test.
- Configure an experimental setup consisting of Solar PV array, and the power converter under test (setup is shown in Figure 1 for this study)
- Choose appropriate value of and vary the duty ratio from minimum to maximum value and capture the responses of . (In this study, is chosen and D is varied from 0.1 to 0.7 in steps of 0.05)
- Repeat step 2 for different values of , to see the effect of input capacitance on . (In this study, responses are investigated for , 440 ).
This test helps in the determination of for the given value of .
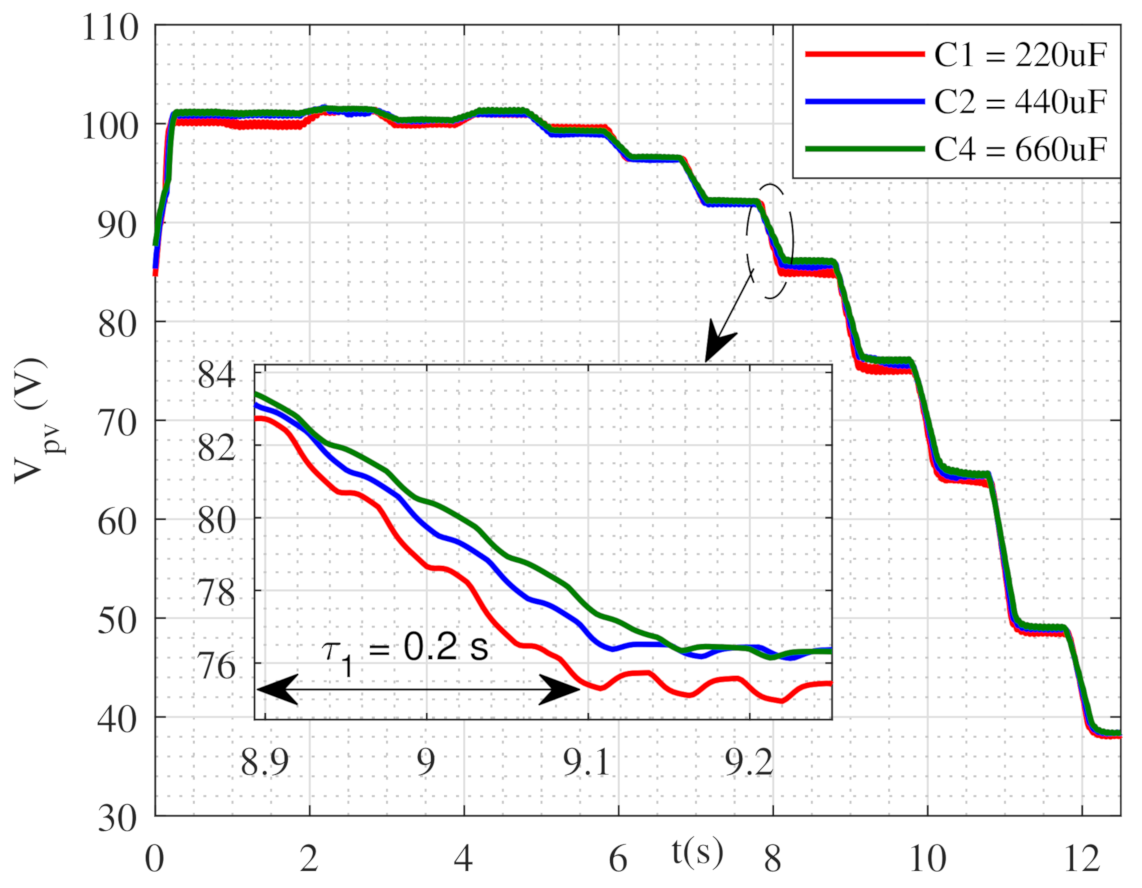
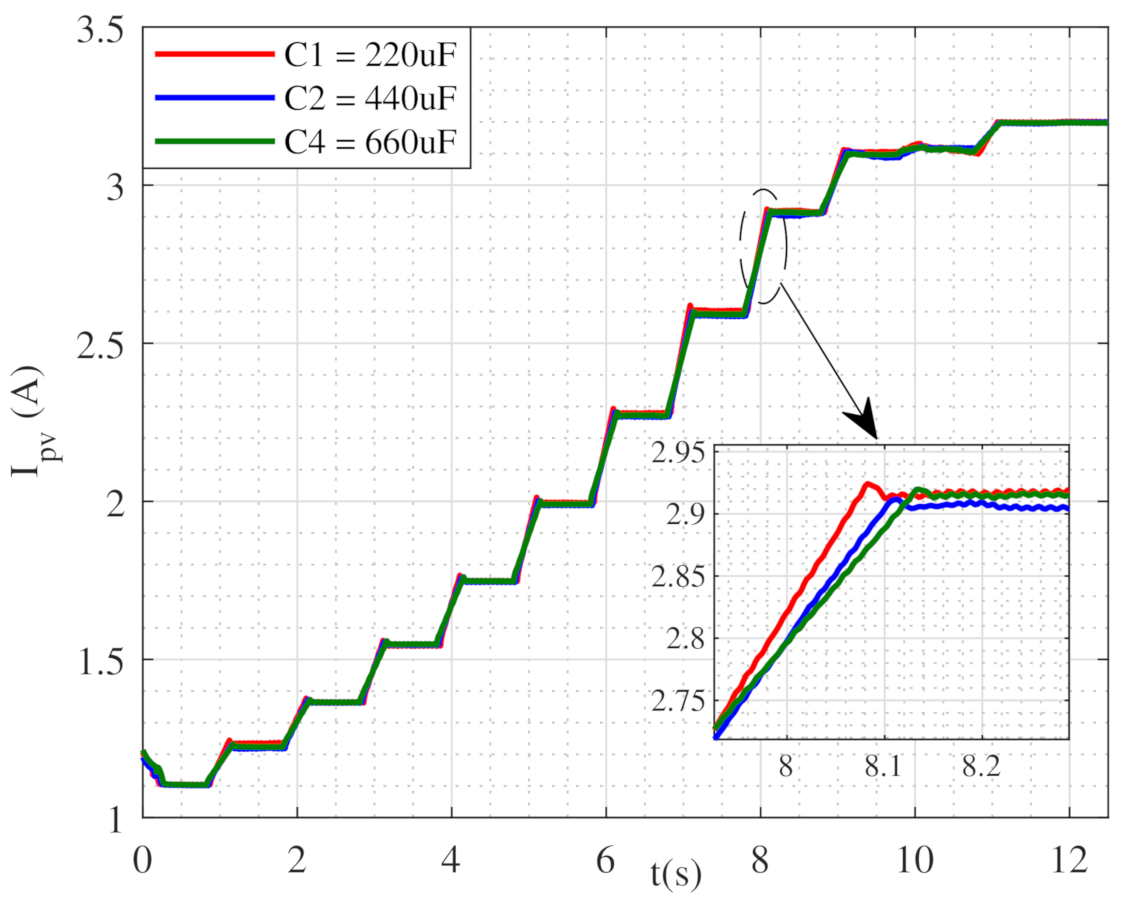
Figure 5 and Figure 6 shows the behaviour of the settling time of and respectively, recorded for step changes in duty ratio for three different values. The is dependent on the value of of the system. Following inferences are made based on (11) and the results of Step test 01 conducted on the system:
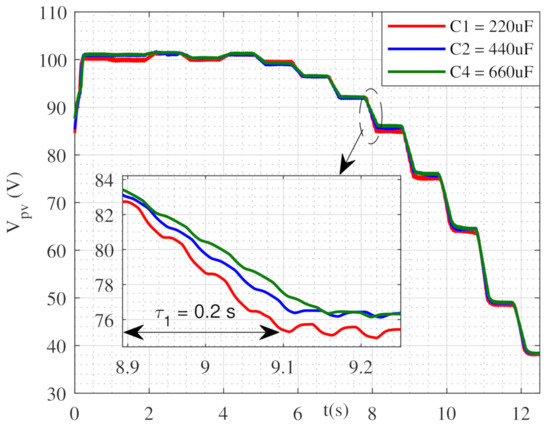
Figure 5.
PV voltage () (Experimental results).
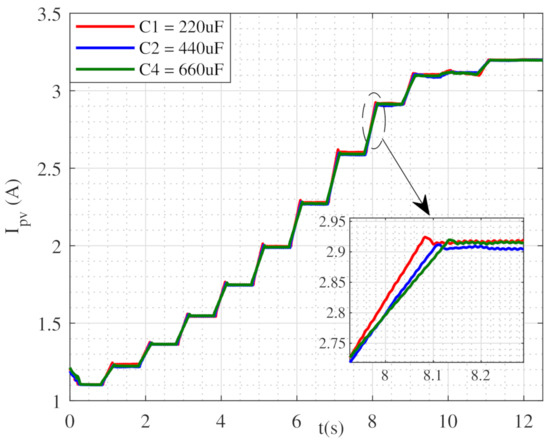
Figure 6.
PV current () (Experimental results).
- The value of depends on the switching frequency of the power converter, ripple in PV voltage and PV current and is calculated using (11).
- The value of is directly proportional to the settling time of responses of PV voltage and current.
- The of the system is 0.2 s for .
The value of increases with increase in and vice versa. The recorded should be considered as an approximate system time constant. Another simple step test (Step test 02) helps to estimate additional delay and attenuation caused by the digital filter and determine effective system time constant () as seen by the controller.
3.2. Step Test 02—Determination of Optimum Value of Digital Filter Cut-Off Frequency
The perturbation-based MPPT algorithm’s performance in solar PV systems is primarily decided by the precision of voltage and current measurements. Filters are invariably incorporated to ensure accuracy and noise-free signals for the processing of algorithms. To demonstrate the undesired addition of delay and attenuation caused by the inclusion of filters, another simple step-test (step test - 02) is proposed. This test helps in determining the effective system time constant as seen by the controller.
Step test 02: Following are the sequence of steps involved in carrying out the test.
- Configure experiment set-up with chosen value of in step test-01. ( )
- Configure digital filter to eliminate/reduce the noise due to ADC. (First order filter with cut-off frequency of 157 rad/s, 314 rad/sec and 628 rad/s are used in this study, first cut-off frequency (100 Hz = 628 rad/s) is empirically chosen as 0.01 times switching frequency (10 kHz))
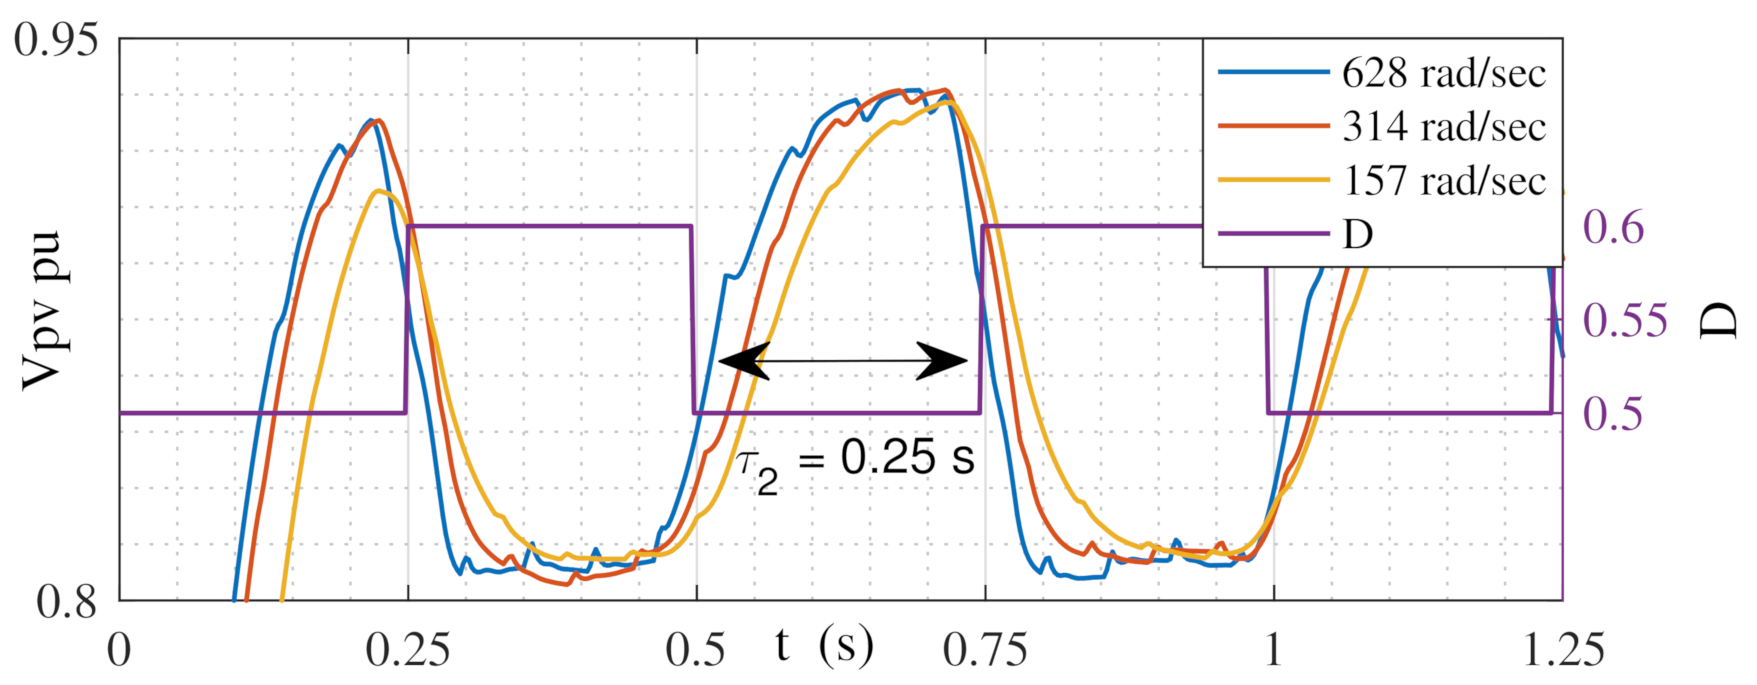
- Introduce a step change in D (from 0.5 to 0.6) of S and record the response of digital filter output () for different cut-off frequencies.(During experimentation, the response of was observed to be slightly slower compared to , hence was chosen as criteria over )
The response of for the different cut-off frequency of the digital filter is recorded in Figure 7. The employed filter eliminates the high frequency noise. In addition, it introduces the delay and the attenuation in these signals. The delay introduced in the signal further adds to increase in settling time of the signal as seen by the controller. If the cut-off frequency of the filter is limited to very low value to reduce the ripple content, signal will be delayed accordingly. This delay introduced by filter into the signal will further increase the settling time of the response of the and . Hence, the settling time of the and should be calculated after they are subjected to the filter. Also, it is recommended that the same digital filter be used to filter noise from and to maintain uniform delay and attenuation. This will ensure appropriate decision making by P and O algorithm. A low-pass digital filter with cut-off frequency of 628 rad/s (100 Hz) is employed in the present experimental studies resulting in effective time constant of 0.25 s () as seen from the controller. It is to be noted that represents the cumulative delay (system time constant () + digital filter delay) not the delay caused by digital filter alone.
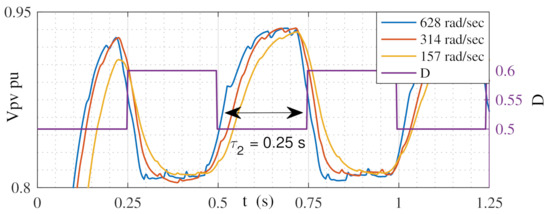
Figure 7.
Plot of p.u PV voltage for different cut-off frequencies of first order digital filter (Experimental results).
3.3. Proposed Guidelines for the Choice of Sampling Time
The values of the and are obtained using two tests discussed in Section 3.1 and Section 3.2 respectively. A simple procedure for the choice of sampling time is proposed using this data to ensure optimal performance of perturbation based MPPT algorithms. Th following are the suggested guidelines for the choice of sampling time.
- For a given switching frequency , obtain at value of using Equation (11) ().
- Conduct step test for system under test using control variable (D, in this case) and determine the of the system under test ( s).
- Determine of the experimental setup as seen from the controller, for chosen cut-off frequency of low pass digital filter, as discussed in Section 2.2. ( s).
- Select sample time for perturbation based algorithm () more than (), () approximately.
- (a)
- Experiments are conducted for four different (0.5 s, 0.4 s, 0.3 s, 0.2 s)
- (b)
- Behaviour of and are presented for () and ().
- (c)
- Average PV power extraction is discussed for all four sampling times.
- (d)
- Scaling factor of 1.5 in is chosen empirically.
- Energize the system under test with suitable perturbation based algorithm and chosen sample time (), and observe the behavior of control variable (D) and system variables () to exhibit sustained three-step-waveform around their respective steady-state values.
- The sample time can further be optimized based on the required tracking speed and the energy extraction.
- Check the behaviour of control variable and the system variables for step-change in irradiances to ensure three-step waveform or quasi three-step waveform.
It is noteworthy that the proposed tests and guidelines are comprehensive. These tests and guidelines can be easily extended to any power converter and perturbation based MPPT algorithm for performance improvement.
4. Results and Discussions
In this section, the simulation and experimental results of the system under test are presented. Also, the rightness of the research findings for other converters and perturbation based MPPT algorithms is illustrated.
4.1. Simulation Results
The mathematical model of the overall system discussed in Section 2.4 is implemented using MATLAB Simulink. A fixed-step third-order (ODE Bogacki-Shampine formula) numerical technique is used for faster convergence. After the choice of suitable input capacitance, the simulation results are captured for two different sampling times and irradiance. The data used for simulation is listed in Table 1. The steady-state values of the system variables for two different solar irradiances are as shown in Table 2. The steady-state value of D in Table 2 is obtained using Equation (12) [25].

Table 2.
Steady state values of system variables.
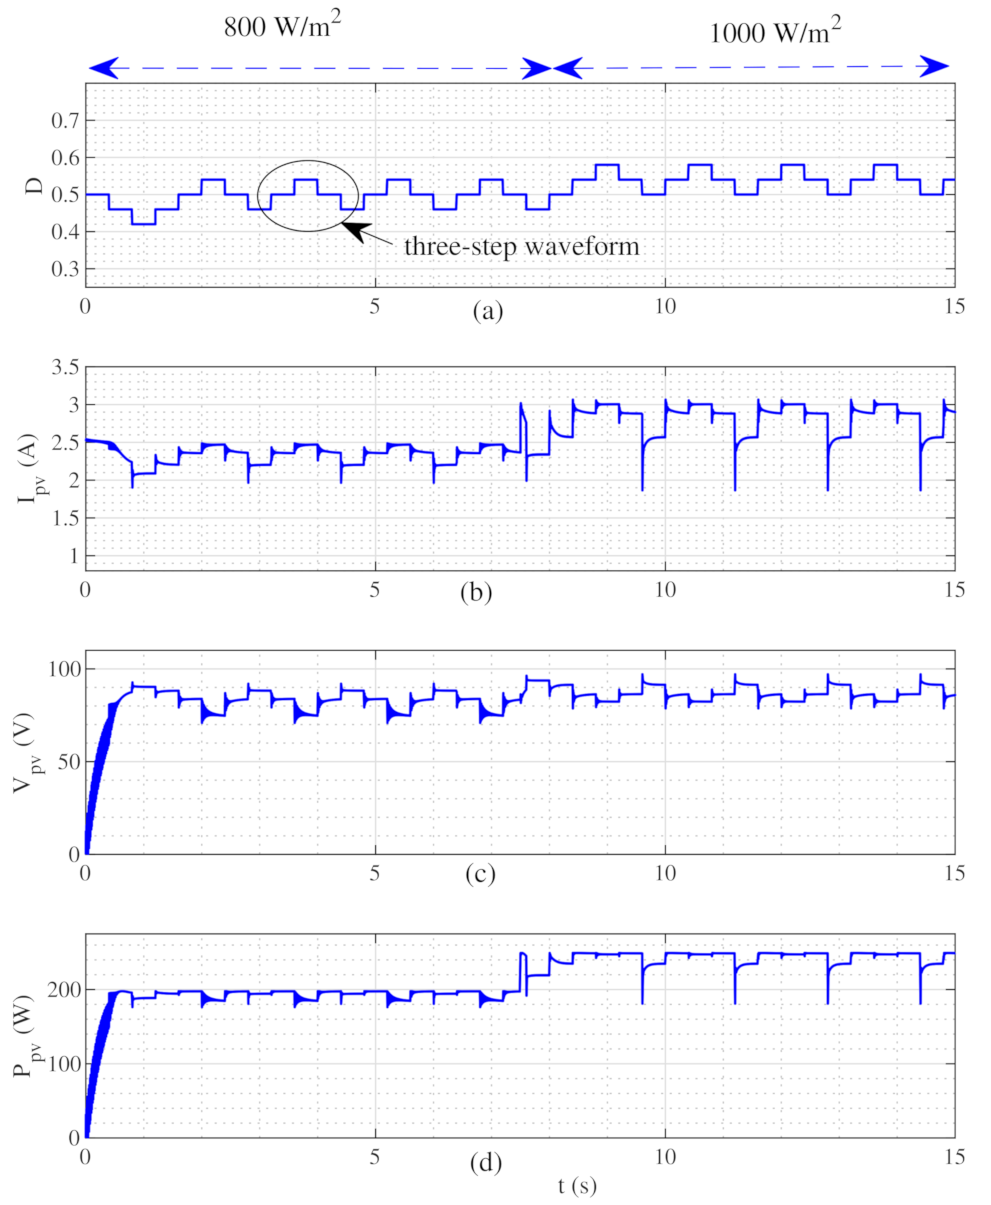
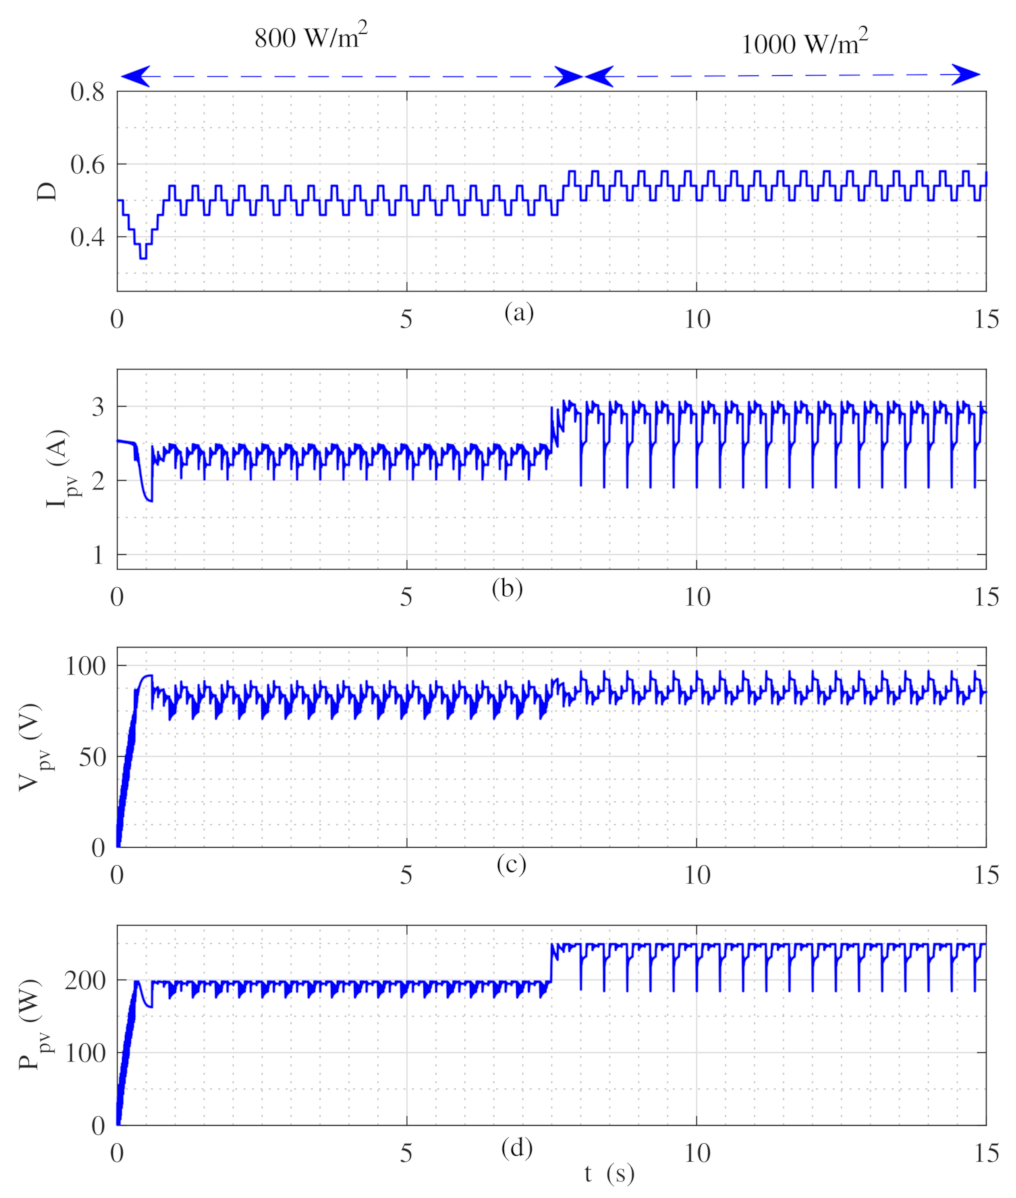
The performance of the system is studied by analyzing system variables namely and for step change in solar irradiance (G) from 800 W/m to 1000 W/m. The variables are analysed for sampling time of 0.4 s and 0.1 s shown in Figure 8 and Figure 9 respectively. In itial value of D is set to 0.5 to shorten the tracking time during startup of the system [14].
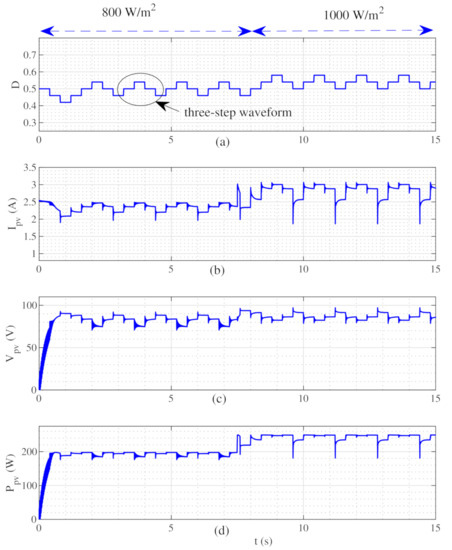
Figure 8.
Dynamic and steady state (a) Duty ratio, (b) PV current, (c) PV voltage and (d) PV power with sample time of 0.4 s.
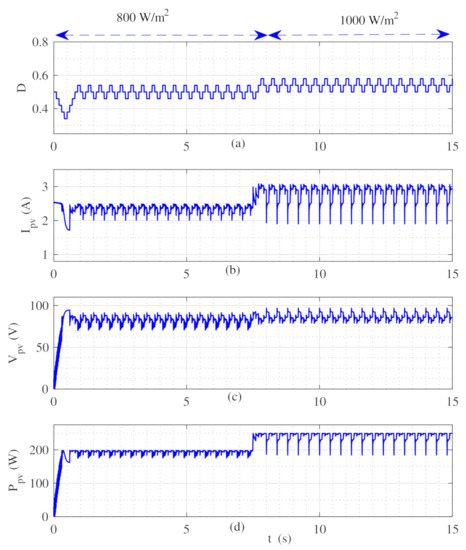
Figure 9.
Dynamic and steady state (a) Duty ratio, (b) PV current, (c) PV voltage and (d) PV power with sample time of 0.1 s.
Figure 8a shows the variation of D for step change in G. The response settles in 1.5 s exhibiting a three step perturbation for W/m . A step change in G is introduced at t = 7.5 s, D settles to with three step response in less than 2 s. The overall response in Figure 8a proves the logical correctness of the P and O algorithm. However, the optimal performance of the algorithm depends on the correct choice of the step size and the sampling time [12]. Figure 8b–d shows the response of . All three variables exhibit three-step waveform around steady-state values indicated in Table 2 for step change in G.
Results for a sampling time of 0.1 s are shown in Figure 9. D exhibits stable three-step variation around the steady-state value. However, a disturbance is observed in for every duty ratio perturbation resulting in increased disturbance in . The sampling time chosen is less than the system time constant. For every change in D, the operating point changes and require to settle at new steady-state values. undergo transients for the time defined by the system time constant before they settle at steady-state values. If the consequent change in D results before the responses of have settled, then the resulting will exhibit disturbance. Lesser the value of more severe is the disturbance. The average values of reduce due to the presence of disturbance, leading to further reduction in the average value of .
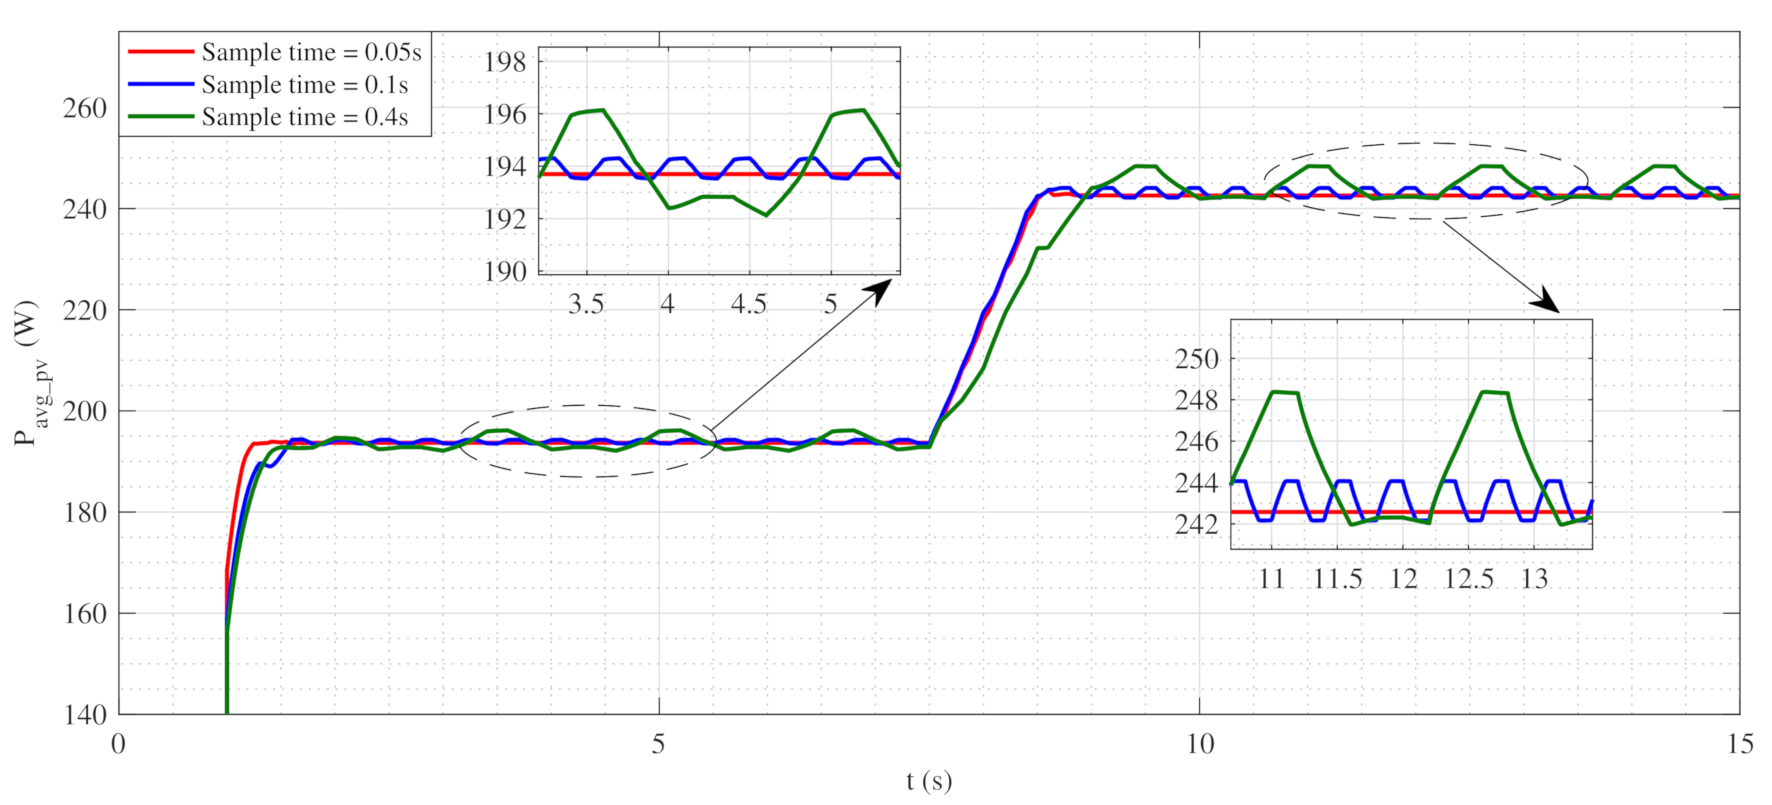
Tests are conducted on the system for three different sampling times, 0.4 s, 0.1 s and 0.05 s, to quantify its effect on the energy extraction. The power obtained for different sampling times is averaged for 1 s and is plotted in Figure 10. The energy extraction is highest for a sampling time of 0.4 s. This can be attributed to three-step waveform of & observed in Figure 8. The response shows that the sampling time of 0.4 s is appropriate for chosen . The average power is seen to be decreased for a sampling time of 0.1 s, which can be explained with Figure 9 exhibiting noisy response due to reduced sampling time for chosen . Further, the average power is observed to be least for sampling time of 0.05 s. The response of & exhibits chaotic behavior for reduced sampling time with large deviations from the steady-state MPP leading to poor energy extraction.
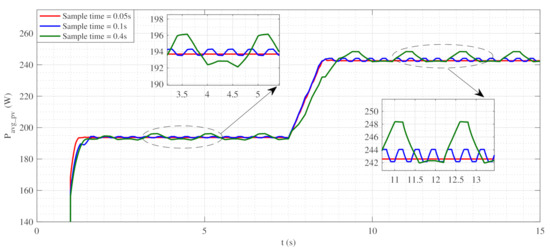
Figure 10.
PV power for different sampling times, averaged over 1 s.
4.2. Experimental Results
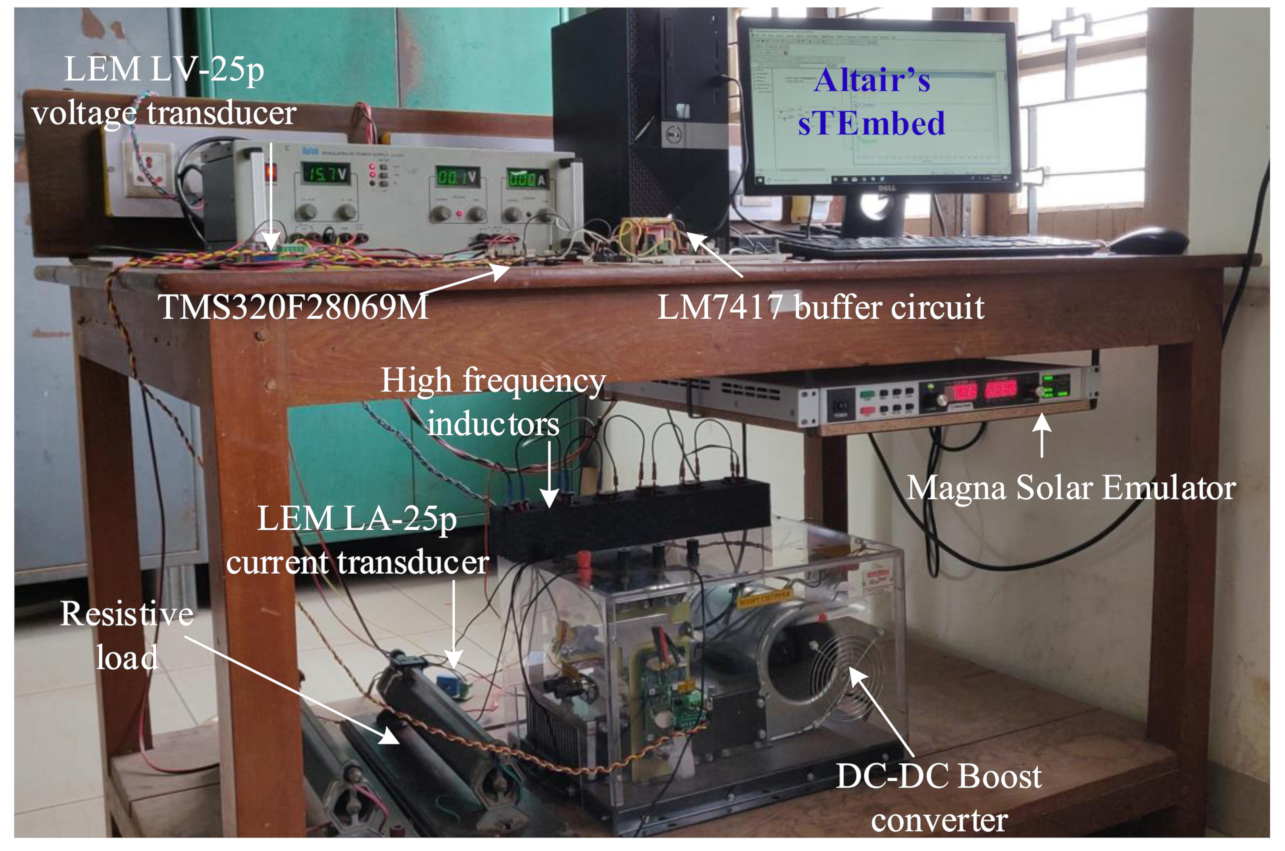
This section presents the experimental set-up developed for conceptual validation, the details of uncertainty in measured variables and results of experimentation. For experimental studies, a semikron making DC-DC boost converter feeding a resistive load is employed for maximum power extraction. Magna SL 300-5 Emulator (Magna-Power Electronics, Flemington, NJ, USA) is used to emulate solar PV profiles shown in Figure 3 and Figure 4. Classic P and O algorithm is implemented using Texas Instrument’s TMS320F28069M DSP (Texas Instruments, Dallas, TX, USA) [26].
Figure 11 shows the laboratory prototype developed for conceptual validation of the results in Section 4.1. The details of the components used in the setup is described in Table 3.
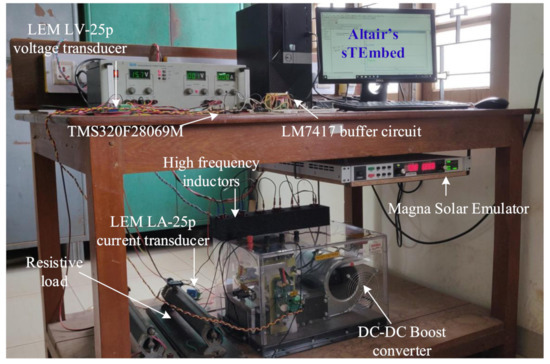
Figure 11.
Experimental setup of solar PV system used for step-tests.

Table 3.
Particulars of components used to develop laboratory prototype.
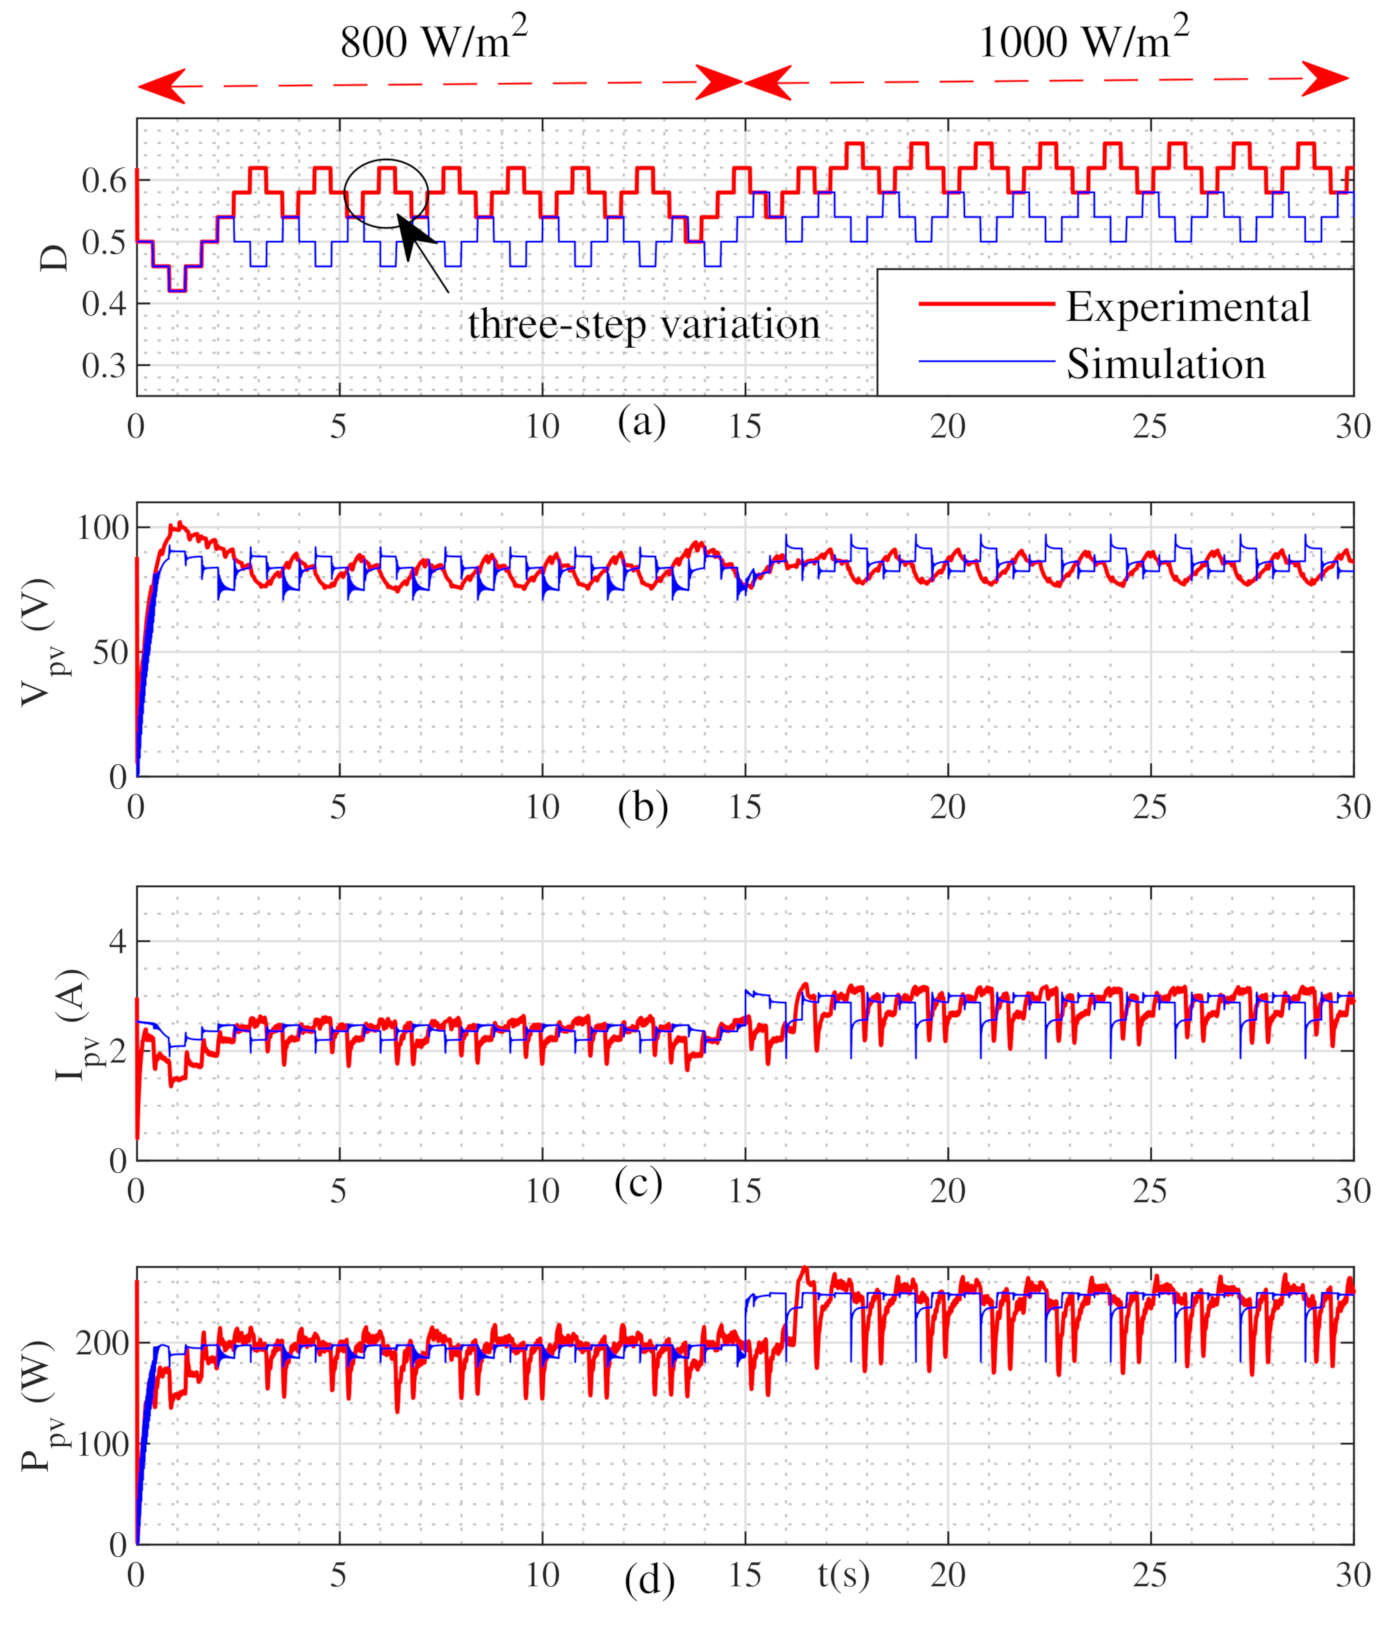
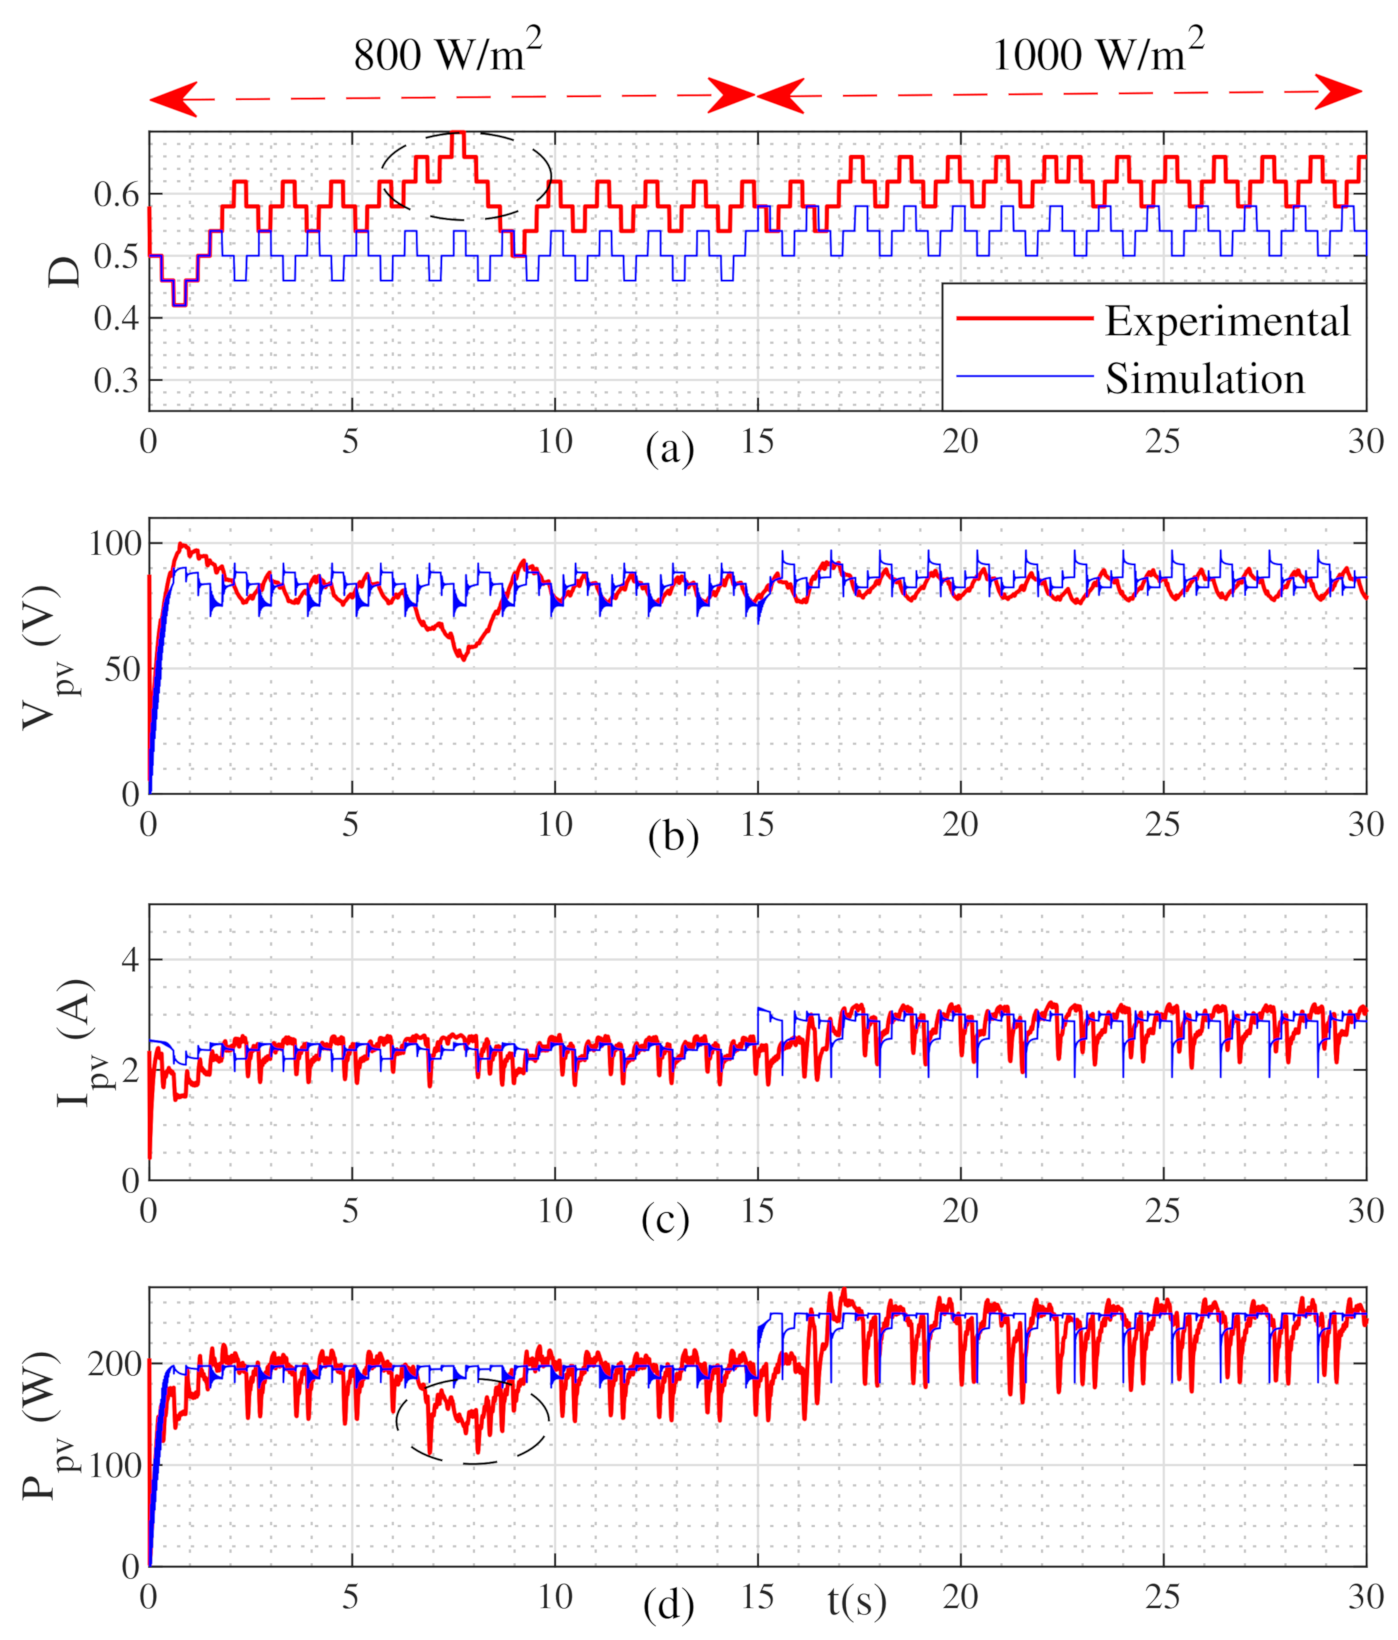
In this study, the effect of system parameters on PV fed DC-DC boost converter is investigated. Two simple tests are proposed to determine the effective system time-constant approximately. Also, guidelines for the choice of sampling time is suggested. The experimental setup consists of non-idealities like, inductor resistance, capacitor resistance, switch resistance and switch stray capacitances. In addition to the non-idealities, & are to be read via ADC of microcontroller for processing of the P and O algorithm. During this conversion, the signals are prone to disturbance due to the added noise. Hence, the values of sampling times for same value of input capacitance may change in comparison to simulation studies. Figure 12 and Figure 13 shows the response (simulation and experimental) of and for step change in G from 800 W/m to 1000 W/m for a sampling time of 0.4 s and 0.3 s respectively. The simulation responses are included to highlight the considerable effect of the non-idealities and their effect on experimental results.
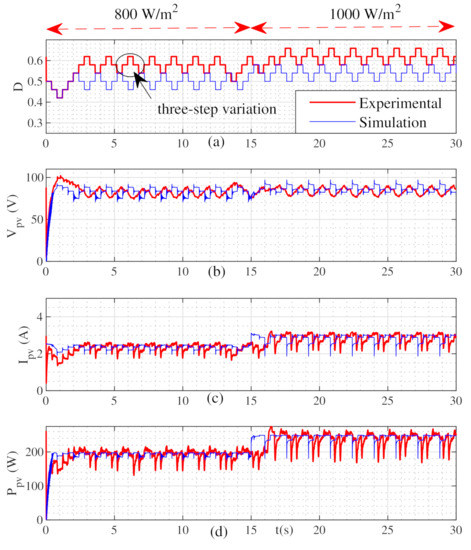
Figure 12.
Dynamic and steady state (a) Duty ratio, (b) PV current, (c) PV voltage and (d) PV power with sample time of 0.4 s.
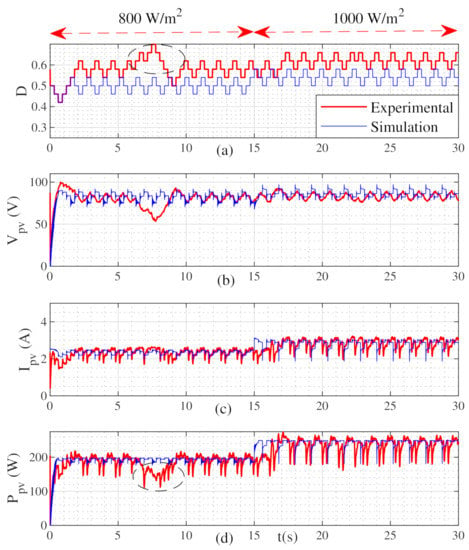
Figure 13.
Dynamic and steady state (a) Duty ratio, (b) PV current, (c) PV voltage and (d) PV power with sample time of 0.3 s.
The behaviour of and for sampling time of 0.4 s is captured in Figure 12a–d. The control variable, D exhibits perfect three-step oscillation around steady-state value. Corresponding to change in D, also exhibits three-step variation. However, due to value of capacitance used, the exhibits quasi three-step waveform. In experimentation, it is not possible to have the exact value of capacitance designed. Hence, nearest possible value is used, also the stray capacitances and other non-idealities add to uncertainties. So, the quasi three-step waveform for the is considered satisfactory. Further increase in sampling time to achieve three-step waveform results in slow response. The follows the variations in and and approximately exhibits reduced oscillations around anticipated steady state value. The chosen sampling time ensures fast tracking and stable steady state operation for step change in G.
Figure 13 shows the response of and for sampling time of 0.3 s. It is evident that the noise in is confusing the P and O algorithm. The confusion is mainly due to reduced sampling time. The chosen sampling time is not sufficient for the responses to settle for perturbations in D, leading to wrong decisions by P and O algorithm during tracking. Figure 13a shows the response of D exhibiting three-step waveform with two wrong decisions by the P and O algorithm. The responses of and for perturbations in D are shown in Figure 13b,c respectively. It is evident that and do not exhibit three-step waveform for perturbations in D, but show behaviour with increased disturbances around steady state value. The further multiplies the effect of disturbances in and as shown in Figure 13d. Further reduction in sampling time is expected to worsen the results reducing the power extraction or leading to instability.
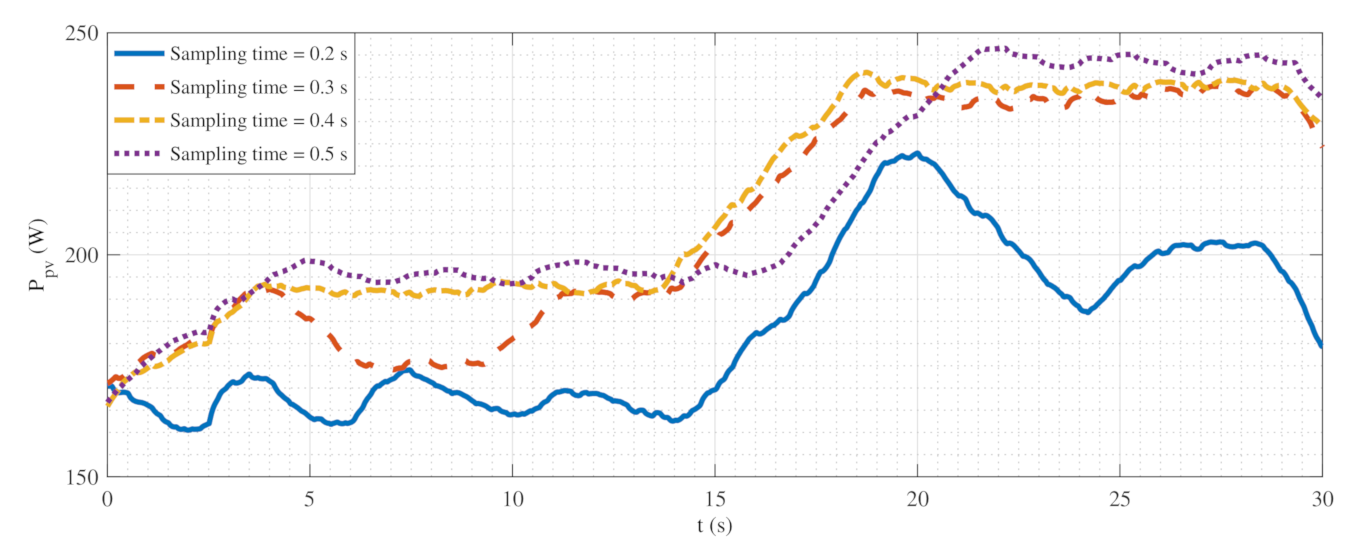
To demonstrate the significance of the sampling time, experiments are conducted for four different sampling times 0.5 s, 0.4 s, 0.3 s and 0.2 s and the average power extraction is captured in Figure 14. The steady state energy extraction for Ts = 0.5 s is highest (96%) and is found to be decreasing with decrease in (80% for s). It is evident from Figure 14 that s increases the tracking time, while s results in reducing efficiency upto 15% or in worst case lead to system instability. Hence, sampling time has to be chosen judiciously. Choice of sampling time is trade-off between the tracking speed and stability margin. The effect of sampling time on energy extraction and stability is more crucial in experimentation compared to simulation studies. This can be attributed to the existence of non-idealities in power converter and additional noise due to analog to digital conversion of the PV current and voltage [27].
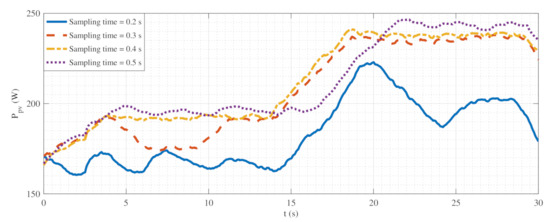
Figure 14.
PV power averaged over 1 s for different sampling times (Power read back accuracy of recorded using Magna Solar Emulator SL300-5/85-265).
4.3. Discussions
The comparison of theoretical, simulation and experimental studies is summarized in Table 4. It is evident that, the simulation results are in close agreement with theoretical values compared to experimental results. The findings of this study suggest that the experiment results are more susceptible to sampling time due to the existence of non-idealities and ADC conversion. Hence, even the smallest change in sampling time results in a significant shift in energy extraction and system stability.

Table 4.
Steady state values of system variables for theoretical, simulation and experimental studies.
Decisively, a qualitative comparison of the proposed method for selecting sampling time is presented in Table 5. The time constant of the system is obtained using a simple step test (step test 01) in this work, compared to the mathematically intensive small signal based approach [12,13,14,15,16,18] and DCD-RLS approach [19]. The inclusion of a digital filter adds a delay to the sensed variables. This critical consideration of additional delay is estimated in this study using another step-test (step-test 02), which is seen to be neglected in [12,13] [16,19]. The minimum sampling time of should be atleast greater than to overcome system time constant and digital filter delay. Furthermore, the sampling time can be chosen based on local whether conditions and the required transient speed of the algorithm. In this study, the sampling time of 1.5 is employed to account for non-idealities, fast-changing irradiances and large changes in irradiances.

Table 5.
Comparison of methods for choice of sampling time in solar photovoltaic systems.
It is worth noting that the tests discussed in Section 2.1 and Section 2.2 are comprehensive and can be performed on any given power converter and load to obtain and . Further the guidelines proposed in Section 3.3 can be employed to chose optimal for performance optimization.
5. Conclusions
In this paper, the effects of system parameters (input capacitance, the cut-off frequency of the digital filter and the sampling time) on the solar photovoltaic system’s performance with the perturbation-based MPPT technique are investigated.
Primarily, the need for input capacitance in solar PV systems and its impact on the system time constant has been conferred to the readers. Step test 01 shows that the value of input capacitance is directly proportional to the system time constant. For optimal performance, the value of 220 F has been selected in this study. Secondly, the need for a digital filter and the significance of the cut-off frequency to mitigate high-frequency noise is deliberated. It has been observed that the inclusion of a digital filter to reduce the noise causes delay and attenuation in the signal. Further, the results reveal that the delay introduced is inversely proportional to the filter’s cut-off frequency. Step test 02 optimizes the choice of cut-off frequency to 100 Hz for the first order digital filter to minimize the delay caused by it to 0.05 s in addition to 0.2 s. caused by the input capacitance.
Based on the proposed guidelines, sampling time of 0.4 s. has been reported to be an optimal choice. It has been observed that 0.4 s. would make the system sluggish, while 0.4 s. results in reduced efficiency or, in the worst case, may lead to system instability. Hence, the choice of is critical and governs the overall system efficiency. Conclusively, two simple step tests are proposed to find approximate system time constant and effective system time constant as seen by controller. Further guidelines are proposed for the choice of to ensure optimal performance of the perturbation based MPPT algorithm. It is noteworthy that the research and the results presented in this paper are comprehensive and can be easily extended to any other converter, load and perturbation based MPPT algorithm by performing a couple of tests discussed in this paper. The proposed method eludes small-signal modeling of the overall system for simplicity. If more insights into system stability are desired, then small-signal modeling is recommended. The system under test has been modeled using Matlab/Simulink. Also, a laboratory prototype has been developed and tested using a Texas Instruments TMS320F28069M controller to confirm the efficacy of the proposed goals.
Author Contributions
Conceptualization, S.A.; methodology, S.A.; software, S.A.; validation, S.A.; formal analysis, S.A.; investigation, S.A.; resources, S.A, U.R.Y., Y.S. and A.B.R.; data curation, S.A.; writing—original draft preparation, S.A.; writing—review and editing, S.A, U.R.Y., Y.S. and A.B.R.; visualization, S.A.; supervision, U.R.Y., Y.S. and A.B.R. All authors have read and agreed to the published version of the manuscript
Funding
This research received no external funding.
Institutional Review Board Statement
Not applicable.
Informed Consent Statement
Not applicable.
Data Availability Statement
We would like to exclude this statement.
Acknowledgments
Authors would like to thank KLE Technological University, Hubli—580031, Karnataka (INDIA) for funding this research project under Capacity Building Project (CBP-2019) scheme.
Conflicts of Interest
The authors declare no conflict of interest.
References
- Elavarasan, R.M. Comprehensive Review on India’s Growth in Renewable Energy Technologies in Comparison With Other Prominent Renewable Energy Based Countries. J. Sol. Energy Eng. 2020, 142. [Google Scholar] [CrossRef]
- Ayop, R.; Tan, C.W. Design of boost converter based on maximum power point resistance for photovoltaic applications. Sol. Energy 2018, 160, 322–335. [Google Scholar] [CrossRef]
- Yahyaoui, I. Advances in Renewable Energies and Power Technologies: Volume 1: Solar and Wind Energies; Elsevier: Amsterdam, The Netherlands, 2018. [Google Scholar]
- Ahmad, R.; Murtaza, A.F.; Sher, H.A. Power tracking techniques for efficient operation of photovoltaic array in solar applications—A review. Renew. Sustain. Energy Rev. 2019, 101, 82–102. [Google Scholar] [CrossRef]
- Motahhir, S.; El Hammoumi, A.; El Ghzizal, A. The most used MPPT algorithms: Review and the suitable low-cost embedded board for each algorithm. J. Clean. Prod. 2020, 246, 118983. [Google Scholar] [CrossRef]
- Ahmed, M.; Abdelrahem, M.; Harbi, I.; Kennel, R. An Adaptive Model-Based MPPT Technique with Drift-Avoidance for Grid-Connected PV Systems. Energies 2020, 13, 6656. [Google Scholar] [CrossRef]
- Ahmed, J.; Salam, Z. An enhanced adaptive P&O MPPT for fast and efficient tracking under varying environmental conditions. IEEE Trans. Sustain. Energy 2018, 9, 1487–1496. [Google Scholar]
- Jana, S.; Kumar, N.; Mishra, R.; Sen, D.; Saha, T.K. Development and implementation of modified MPPT algorithm for boost converter-based PV system under input and load deviation. Int. Trans. Electr. Energy Syst. 2020, 30, e12190. [Google Scholar] [CrossRef]
- Yang, Y.; Wen, H. Adaptive perturb and observe maximum power point tracking with current predictive and decoupled power control for grid-connected photovoltaic inverters. J. Mod. Power Syst. Clean Energy 2019, 7, 422–432. [Google Scholar] [CrossRef]
- Li, X.; Wen, H.; Hu, Y.; Du, Y.; Yang, Y. A comparative study on photovoltaic MPPT algorithms under EN50530 dynamic test procedure. IEEE Trans. Power Electron. 2020, 36, 4153–4168. [Google Scholar] [CrossRef]
- Xu, L.; Cheng, R.; Yang, J. A Modified INC Method for PV String Under Uniform Irradiance and Partially Shaded Conditions. IEEE Access 2020, 8, 131340–131351. [Google Scholar] [CrossRef]
- Femia, N.; Petrone, G.; Spagnuolo, G.; Vitelli, M. Optimization of perturb and observe maximum power point tracking method. IEEE Trans. Power Electron. 2005, 20, 963–973. [Google Scholar] [CrossRef]
- Femia, N.; Petrone, G.; Spagnuolo, G.; Vitelli, M. A technique for improving P&O MPPT performances of double-stage grid-connected photovoltaic systems. IEEE Trans. Ind. Electron. 2009, 56, 4473–4482. [Google Scholar]
- Elgendy, M.A.; Zahawi, B.; Atkinson, D.J. Assessment of perturb and observe MPPT algorithm implementation techniques for PV pumping applications. IEEE Trans. Sustain. Energy 2011, 3, 21–33. [Google Scholar] [CrossRef]
- Elgendy, M.A.; Zahawi, B.; Atkinson, D.J. Assessment of the incremental conductance maximum power point tracking algorithm. IEEE Trans. Sustain. Energy 2012, 4, 108–117. [Google Scholar] [CrossRef]
- Kivimäki, J.; Kolesnik, S.; Sitbon, M.; Suntio, T.; Kuperman, A. Design guidelines for multiloop perturbative maximum power point tracking algorithms. IEEE Trans. Power Electron. 2017, 33, 1284–1293. [Google Scholar] [CrossRef]
- Suntio, T.; Kuperman, A. Maximum Perturbation Step Size in MPP-Tracking Control for Ensuring Predicted PV Power Settling Behavior. Energies 2019, 12, 3984. [Google Scholar] [CrossRef]
- Kivimäki, J.; Kolesnik, S.; Sitbon, M.; Suntio, T.; Kuperman, A. Revisited perturbation frequency design guideline for direct fixed-step maximum power point tracking algorithms. IEEE Trans. Ind. Electron. 2017, 64, 4601–4609. [Google Scholar] [CrossRef]
- Dadkhah, J.; Niroomand, M. Real-Time MPPT Optimization of PV Systems by Means of DCD-RLS Based Identification. IEEE Trans. Sustain. Energy 2018, 10, 2114–2122. [Google Scholar] [CrossRef]
- Tang, L.; Xu, W.; Mu, C. Analysis for step-size optimisation on MPPT algorithm for photovoltaic systems. IET Power Electron. 2017, 10, 1647–1654. [Google Scholar] [CrossRef]
- Yan, K.; Du, Y.; Ren, Z. MPPT perturbation optimization of photovoltaic power systems based on solar irradiance data classification. IEEE Trans. Sustain. Energy 2018, 10, 514–521. [Google Scholar] [CrossRef]
- Bhattacharyya, S.; Patnam, D.S.K.; Samanta, S.; Mishra, S. Steady Output and Fast Tracking MPPT (SOFT MPPT) for P&O and InC Algorithms. IEEE Trans. Sustain. Energy 2020, 12, 293–302. [Google Scholar]
- Al-Atrash, H.; Batarseh, I.; Rustom, K. Effect of measurement noise and bias on hill-climbing MPPT algorithms. IEEE Trans. Aerosp. Electron. Syst. 2010, 46, 745–760. [Google Scholar] [CrossRef]
- Villalva, M.G.; Gazoli, J.R.; Ruppert Filho, E. Comprehensive approach to modeling and simulation of photovoltaic arrays. IEEE Trans. Power Electron. 2009, 24, 1198–1208. [Google Scholar] [CrossRef]
- Fannakh, M.; Elhafyani, M.L.; Zouggar, S. Hardware implementation of the fuzzy logic MPPT in an Arduino card using a Simulink support package for PV application. IET Renew. Power Gener. 2018, 13, 510–518. [Google Scholar] [CrossRef]
- Angadi, S.; Yaragatti, U.R.; Suresh, Y.; Raju, A. Implementation of Perturbation-Based MPPT Technique Using Model-Based Design. In Electronic Systems and Intelligent Computing; Springer: Berlin, Germany, 2020; pp. 155–166. [Google Scholar]
- Erickson, R.W.; Maksimovic, D. Fundamentals of Power Electronics; Springer Science & Business Media: New York, NY, USA, 2007. [Google Scholar]
Publisher’s Note: MDPI stays neutral with regard to jurisdictional claims in published maps and institutional affiliations. |
© 2021 by the authors. Licensee MDPI, Basel, Switzerland. This article is an open access article distributed under the terms and conditions of the Creative Commons Attribution (CC BY) license (http://creativecommons.org/licenses/by/4.0/).

