Article

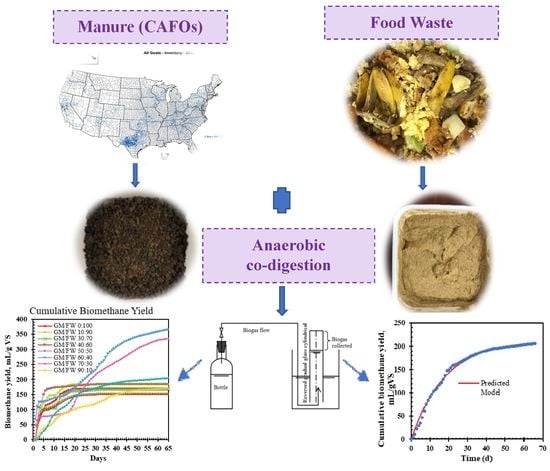
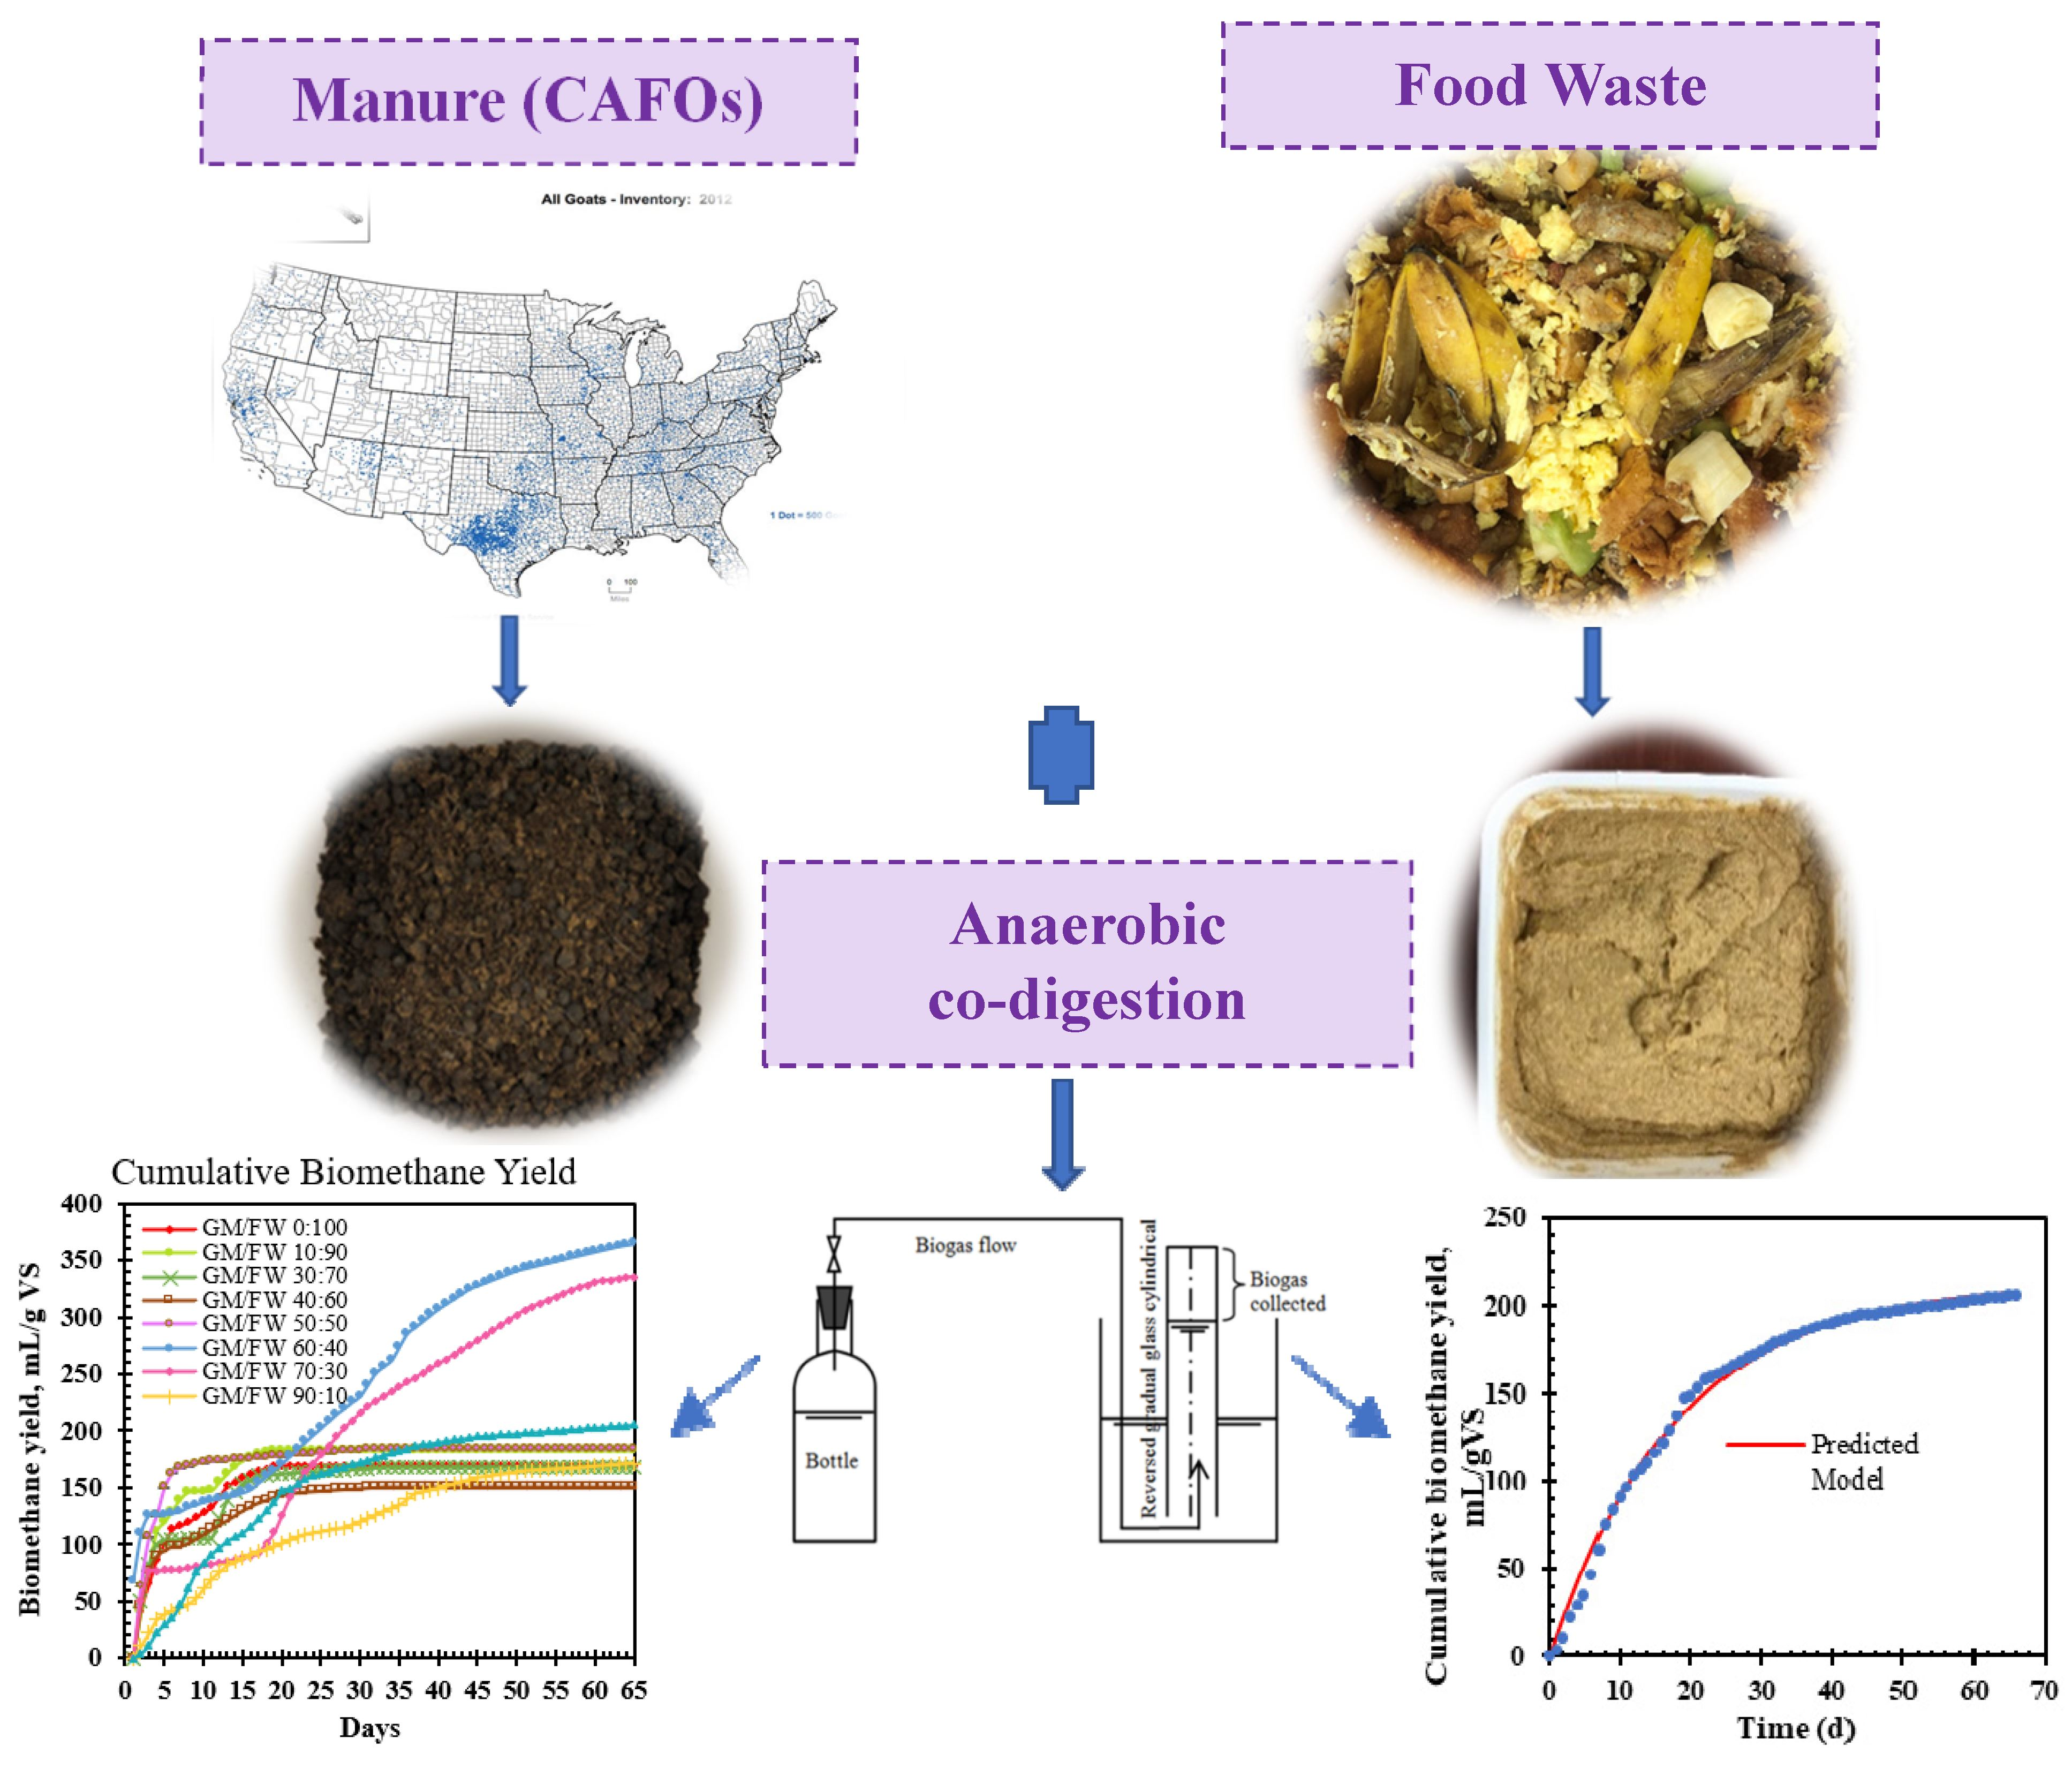
Batch Anaerobic Co-Digestion and Biochemical Methane Potential Analysis of Goat Manure and Food Waste

by
Ayobami Orangun
1,
Harjinder Kaur
1 and
Raghava R. Kommalapati
1,2,*
1
Center for Energy & Environmental Sustainability, Prairie View A&M University, 700 University Drive, Prairie View, TX 77446, USA
2
Department of Civil and Environmental Engineering, Prairie View A&M University, 700 University Drive, Prairie View, TX 77446, USA
*
Author to whom correspondence should be addressed.
Energies 2021, 14(7), 1952; https://doi.org/10.3390/en14071952
Submission received: 4 March 2021 / Revised: 29 March 2021 / Accepted: 29 March 2021 / Published: 1 April 2021
(This article belongs to the Special Issue Energy and Environmental Sustainability 2020)

Abstract

:
The improper management of goat manure from concentrated goat feeding operations and food waste leads to the emission of greenhouse gasses and water pollution in the US. The wastes were collected from the International Goat Research Center and a dining facility at Prairie View A&M University. The biochemical methane potential of these two substrates in mono and co-digestion at varied proportions was determined in triplicates and processes were evaluated using two nonlinear regression models. The experiments were conducted at 36 ± 1 °C with an inoculum to substrate ratio of 2.0. The biomethane was measured by water displacement method (pH 10:30), absorbing carbon dioxide. The cumulative yields in goat manure and food waste mono-digestions were 169.7 and 206.0 mL/gVS, respectively. Among co-digestion, 60% goat manure achieved the highest biomethane yields of 380.5 mL/gVS. The biodegradabilities of 33.5 and 65.7% were observed in goat manure and food waste mono-digestions, while 97.4% were observed in the co-digestion having 60% goat manure. The modified Gompertz model is an excellent fit in simulating the anaerobic digestion of food waste and goat manure substrates. These findings provide useful insights into the co-digestion of these substrates.

Graphical Abstract

1. Introduction

1.1. Anaerobic Digestion

Anaerobic digestion (AD) is an essential component of renewable energy systems, sustainable waste management strategies, and advanced bio-refineries [1]. The biogas produced from this process can be used for cooking, heating, and when purified can generate electricity through a gas grid power and run vehicles [2]. It is also a well-known technology for the treatment of solid organic wastes such as animal manure, slaughterhouse wastes and biomass for bioenergy production, and municipal solid waste (MSW) [3,4].
The management of MSW in developed countries via AD is adopted for decades [5] and it involves source separation followed by suitable treatment such as AD of the organic fraction [6]. The approximate composition of MSW in a developing country is 70% organic fraction, 4.16% paper and cardboard, 0.65% metals, 14.04% plastics, 1.17% glass, 3.92% textile and leather, 5.08% nappy [7] and needs to be separated before AD.
There are several studies reporting co-digestion of food waste (FW) and MSW with animal manures [8,9,10,11,12]. The digestion of the FW alone leads to instability and even failure of AD digester at higher organic loading rates (OLR, above 2.5 g VS/L/d), mostly during thermophilic conditions, due to the accumulation of volatile fatty acids (VFAs) and ammonia inhibition [13,14,15]. An enhanced balance of nutrients and synergistic effect of microorganisms is achieved with the co-digestion of FW with manure, sewage sludge, and lignocellulosic biomass [16]. The co-digestion of the substrates with other substrates can supply alkalinity and micro-nutrients to overcome the disadvantages in single digestion of FW and improve digestion efficiency and process performance [17].

1.2. Goat Manure Mismanagement in Concentrated Animal Feeding Operations

Goats are essential producers of meat, milk, fiber in Asian and African countries as 91% of their world population is in these regions [18]. United States Department of Agriculture reported that there were 2,698,636 goats in the United States in 2017 [19]. These animals are heavily concentrated in the eastern part of the United States, with 31% of the population situated in Texas due to the favorable environmental conditions for goat production.
Animals raised in large operations produce about 1.6 million tons of manure yearly [20]. Although manure adds essential values to the farming industry, it becomes problematic in large amounts. Most farms in the United States no longer grow their feed. As a result, all the manure that originated at a particular farm cannot be absorbed onsite. The excess application of livestock waste can burden soil with macronutrients like phosphorus and nitrogen, and micronutrients from animal feed such as heavy metals [21]. The contaminants from animal wastes can enter the environment through pathways such as leakage from poorly constructed manure lagoons or during significant precipitation events resulting in either overflow of lagoons and runoff from recent applications of waste to farm fields, or atmospheric deposition followed by dry or wet fallout [22]. The decomposition of manure is the cause of gaseous emissions (ammonia, hydrogen sulfide, methane, and particulate matter) in the concentrated animal feeding operations (CAFOs) and the areas surrounding, posing human health risks [23]. Although carbon dioxide is considered as the primary greenhouse gas of concern, manure emits methane which is 323 times more potent as a greenhouse gas than carbon dioxide [21,24]. The EPA attributes manure mismanagement as the fourth leading source of nitrous oxide emissions and the fifth leading source of methane emission [25]. Additionally, there are over 150 different kinds of pathogens in manure, which can lead to a widespread outbreak of diseases. One of the most common manure disposal methods is its ground application which has limitations, such as the limited use under harsh winter (frozen) and the ratio of nutrients that a land can handle.

1.3. Environmental Impact of Food Waste

Food waste (FW) is the most significant component of the waste stream in the United States, and it accounts for the largest proportion of MSW in both developing and developed countries [6,7]. It is estimated that about 43.6 million tons of food are thrown away yearly by Americans [26]. It comprises fruits, vegetables, milk, food residue, etc. from restaurants, school cafeterias, households, and retails. The FW contains 70–90% moisture content and high organic content of volatile solid (VS) [27]. Environmental pollution of the soil, water, and air can arise from its improper disposal [28]. Of the several methods for its disposal, the most widely adopted are incineration, landfill, aerobic composting, and AD [29].
However, the biodegradability and high nutrient content of this perishable waste are highly desirable characteristics for anaerobic digestion.
Recently, there has been an increased interest in biomethane potential (BMP) tests through the number of published research papers focused on BMP [30,31,32]. The biomethane potential of different substrates is determined using these tests [33].
Previous research has proved that the volume of biogas produced using a single substrate is lower than the combination of two or more substrates via anaerobic co-digestion [34]. In this experiment, goat manure (GM) was co-digested with FW to improve the biomethane yield of GM and stabilize the carbon-nitrogen ratio, and the process was simulated by kinetic models and compared with theoretical values.

2. Materials and Methods

2.1. Substrates and Inoculum

Goat manure was collected from the International Goat Research Center (IGRC) at Prairie View A&M University (PVAMU). The GM was dried in a Heratherm oven (Thermo Scientific, Waltham, MA, USA) at 80 °C for 24 h. Mechanical pretreatment of the GM was done using a mechanized grinder (LHB dual refiner Model 6SM14A), reducing its size into fine particles. The particle size was further reduced using a mesh size of 2 mm to remove coarse materials, thereby increasing the surface area for micro-organisms to breakdown the substrate. The ground GM was then transferred into a large zip-lock bag and stored in the laboratory-grade refrigerator at 4 °C.
The FW was collected for a week, including waste from breakfast, lunch, and dinner at the dining facilities at Prairie View A&M University. Edible and non-edible components such as bones, peels, shells, wastepaper, and plastics were removed manually, avoiding any non-edible components remaining in the substrate. The FW was then transferred into a standard blender (Hamilton Beach, Glen Allen, VA, USA) and homogenized. The thermal treatment of FW is known to enhance biomethane recovery [35], so the thick slurry mixtures were dried in the oven at 80 °C for 48 h. The dried FW was then ground into fine particles and sieved with a (2 mm mesh size) to remove coarse materials, sealed in a Ziplock bag, and then stored in a laboratory-grade refrigerator at 4 °C.
The inoculum used in the research was sludge from Prairie View A&M wastewater treatment anaerobic digester functioning at a temperature of 36 ± 1 °C, which was the same temperature used in the BMP test. The sludge was sieved to remove unwanted particles and then poured into a 500 mL volumetric flask purged with 99.9% nitrogen, covered with a rubber stopper, and placed in an incubator at 36 ± 1 °C. The inoculum was de-gassed for a week before being used in experiments.

2.2. Experimental Design

The BMP assays, similar to Angelidaki et al. [36], were performed in triplicates under mesophilic (36 ± 1 °C) conditions.
The co-digestion of GM and FW was carried out with the mixing ratios of 10:90, 30:70, 40:60, 50:50, 60:40, 70:30, and 90:10 along with substrate mono-digestions. A total of 27 serum bottles were used for all the substrate mixtures. Each serum bottle contained different ratios of the dried substrates plus 20 mL of inoculum and 20 mL of trace nutrients [37]. The 100 mL working volume was achieved by adding DI water, with 150 mL headspace in each serum bottle. The inoculum to substrate ratio of (ISR) was maintained at 2, which was in the range of 0.1–2 as recommended in previous studies [15,38]. The initial pH of the mixture in each digester ranged from 5.2 to 7.3. The pH below 7.0 was adjusted to 7.0 ± 0.1 by adding 3M NaOH solution. Each serum bottle’s headspace was purged with 99.9% nitrogen for five minutes at a flow rate of 5 L/min to ensure anaerobic conditions. After purging, the bottles were sealed with rubber septa and aluminum crimp caps and were incubated at 36 ± 1 °C. The serum bottles were mixed twice daily by shaking manually before and after the biogas volume measurement. Biomethane was monitored daily, using the liquid displacement method (Figure 1). The difference in initial and final volumes of the inverted graduated cylinder represents the volume of biogas. The duration of the BMP assay was determined explicitly for each substrate.

2.3. Data Analysis

The experimental data were processed in Microsoft Excel 2010 (Microsoft, Redmond, USA). The biomethane data were converted to mL/gVS and dry gas volume (at STP) by multiplying with a factor of 0.838 as described by Richards et al. [39].

2.4. Theoretical Maximum Methane Yield and Biodegradability

Theoretical maximum methane yield (TMY, mL/gVS) was calculated from the elemental composition of the substrates, using Boyle’s [40] equation (originally Buswell’s formula) [41]:
C a H b O c N d + a b 4 c 2 + 3 d 4 H 2 O   a 2 + b 8 c 4 3 d 8 C H 4 + a 2 b 8 + c 4 + 3 d 8 C O 2 + d N H 3 + e H 2 S ,
T M Y =         22.4 1000 a 2 + b 8 c 4 3 d 8   12 a + b + 16 c + 14 d ,
B D   % = E M Y T M Y 100 .  
Biodegradability (BD) was calculated from the cumulative methane yield (experimental biomethane yield, EMY) and TMY, as shown in Equation (3).

2.5. Reaction Kinetics

Two different kinetic models, first-order and modified Gompertz were compared to determine the suitability for batch anaerobic co-digestion of GM and FW.

2.5.1. First-order Kinetic Model

G t = G 0 1 e k t ,
where, G(t) is the cumulative methane yield at time t (mL/gVS), G0 is the methane potential of the substrates (mL/gVS), K is the first-order degradation rate constant as well as methane production rate constant (per d).

2.5.2. Modified Gompertz Model

The modified Gompertz equation as described by Lay et al. [42,43] was utilized to simulate the anaerobic digestion process:
G t = G 0 e x p e x p R m a x e G 0 λ t + 1 ,
where, Rmax is the maximal methane production rate (mL/gVS/d), and λ is the duration of lag phase (day), while t is the time over the fermentation period, and e is equivalent to exp (1), or 2.718282.

2.5.3. Statistical Analysis

Statistical indicators evaluated the models, correlation coefficient (R2) and root mean square error (RMSE) [44,45] using Microsoft Excel:
R M S E =   1 m   j = 1 m d j Y j 2 1 2
where m is the number of data pairs, j is jth values, Y is measured methane yield (mL/gVS), and d is the deviations between measured and predicted methane yield.

3. Results and Discussion

3.1. Substrate Characterization

The C/N ratio of each substrate mixture greatly influences biogas production. The C/N ratio was calculated by utilizing the results from the elemental analysis (Table 1). The substrate with a higher C/N ratio provides more carbon for methane production. On the other side, lower nitrogen content limits microbial activity because microbes need a considerable amount of nitrogen to maintain their growth. A good C/N ratio suitable for anaerobic digestion ranges from 9 to 30 for an anaerobic digester [15,46].
The C/N ratio of GM was 20:1, while that of FW was 18:1, thus falling within the suitable range for anaerobic digestion. The co-digestion of FW with GM can balance the ammonia nitrogen, alkalinity, and C/N ratio to the optimal range and enhance biomethane yield. As presented in Table 1, the TS for FW was high. The GM’s VS/TS ratio was more than 80%, indicating there is high organic matter content in the substrate. However, FW showed a relatively low VS/TS ratio, indicating high ash content compared to GM which may be from bone fragments in the FW.
The chemical formulas, theoretical biomethane potential, and biodegradability were determined from the elemental composition of pure substrates (Table 1). The chemical formulas of co-digestion (GM/FW 10:90, 30:70, 40:60, 50:50, 60:40, 70:30, and 90:10), were C 20.58 H 38.18 O 14.89 N , C 21.06 H 39.71 O 17.00 N , C 21.32 H 40.56 O 18.19 N , C 21.62 H 41.49 O 19.48 N , C 21.92 H 42.49 O 20.87 N , C 22.27 H 44.29 O 22.39 N , C 23.07 H 46.14 O 25.91 N . The theoretical BMPs of 313.4, 506.6, 487.29, 448.7, 429.3, 418.2, 390.7, 374.2, 332.8 mL/gVS were computed for GM and FW mono and co-digestions (GM 10, 30, 40, 50, 60, 70, and 90%), respectively.

3.2. Daily Biomethane Yield

The daily biomethane yield for mono-and co-digestion of GM and FW is shown in Figure 2a. Biomethane production started immediately on the first day of all the digesters. The FW biodegraded quicker than GM and peaked on the second day. The peak biomethane yield of FW was 42.0 mL/gVS, which was 10 times more than GM (4.0 mL/gVS) on the same day (Figure 2a). In mono-digestion, GM had a slow start in producing biogas. In mono-digestion, FW stopped producing biomethane at the end of the 20th day.

3.3. Cumulative Biomethane Yield

The cumulative biomethane yield (CMY) for 66 d is shown in Figure 2b. These results show an increase of 10.6%, 2.2%, 11.7%, 107.6%, 86.1%, and 2.4% compared to mono-digestion of FW. Whereas an increase of 54 and 72.6% in biomethane yield was observed in co-digestions having 30 and 40% FW respectively, over GM mono-digestion. The biomethane yield of 90% GM (168.5 mL/gVS) was lower than its mono-digestion. These results signify that GM and FW’s co-digestion significantly improved biomethane yield at most mixing ratios compared to their mono-digestions. There are not any previous studies reporting the co-digestion of these substrates.

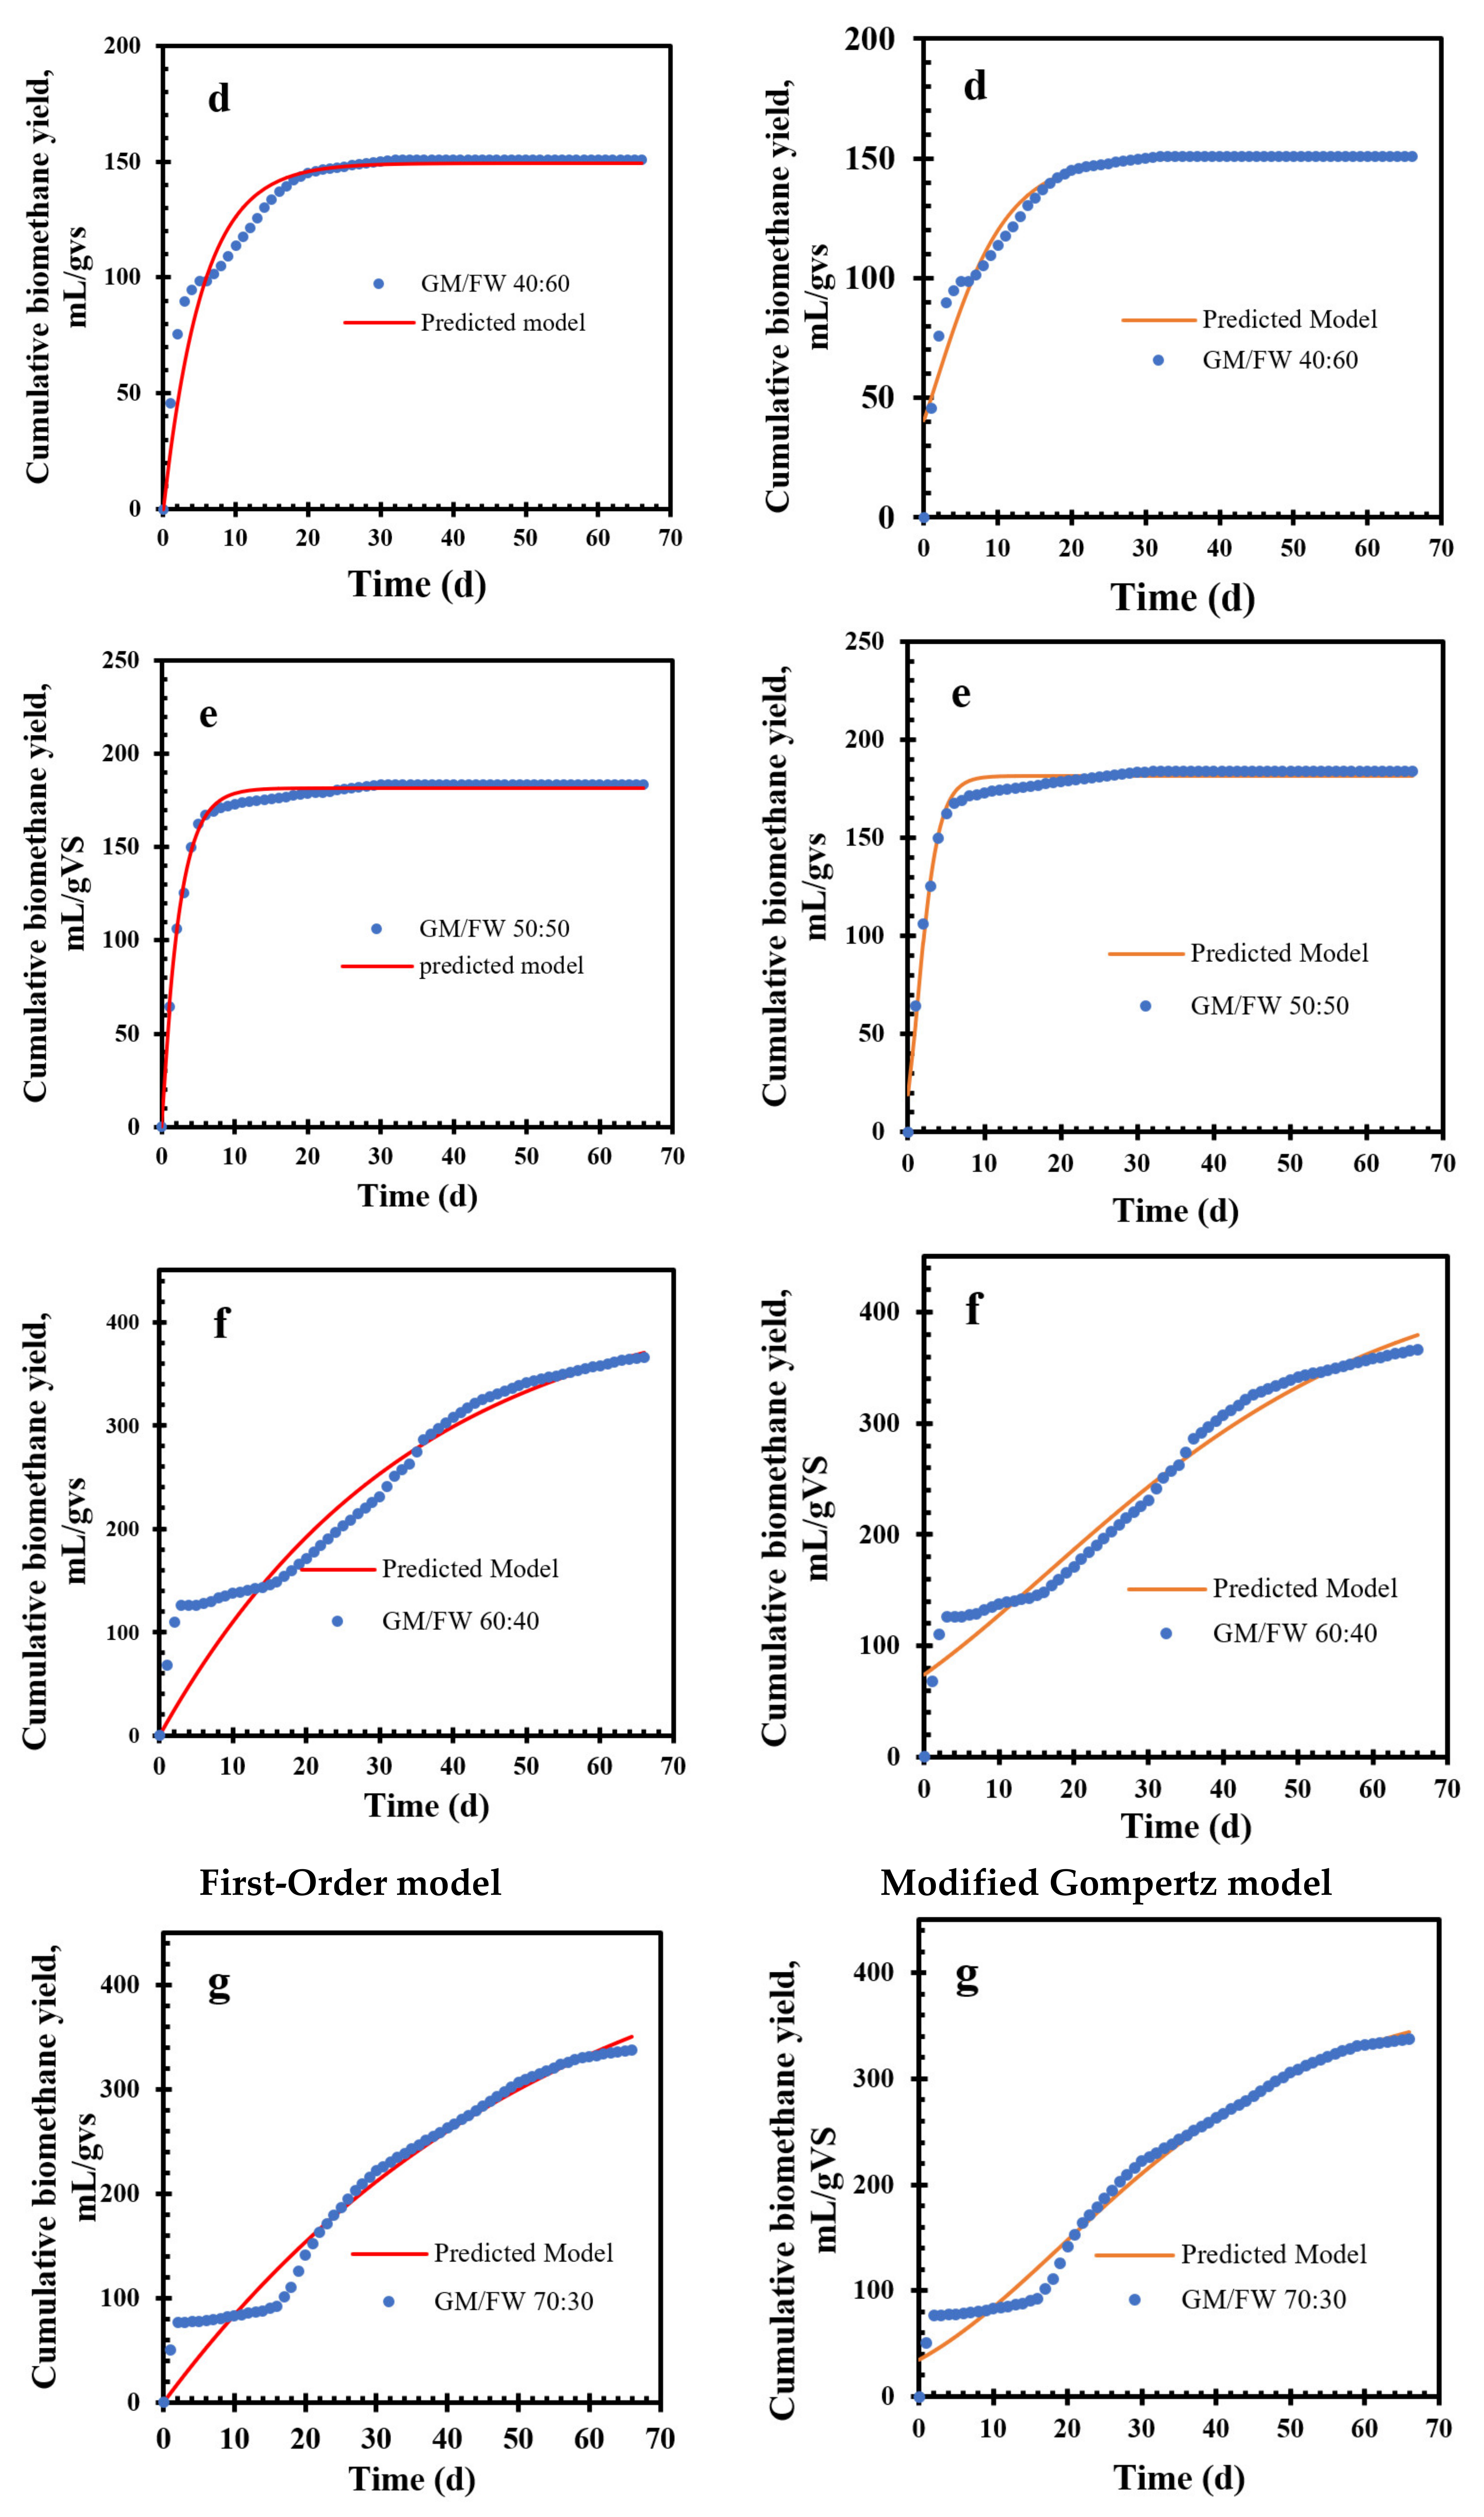
3.4. Kinetic Model Analysis

Understanding the digestion kinetics is essential for predicting the behavior of anaerobic systems, optimizing the digestion process, and designing digesters [47,48].
The process of anaerobic digestion in this study was simulated by the first-order kinetic and modified Gompertz models. The first-order kinetic model was utilized to determine the hydrolysis rate constant (k). The lag-phase (λ), maximum specific production rate (Rmax), and methane production potential (G0) were determined by the modified Gompertz model.

3.5. First-Order Kinetic Model

The first-order kinetic model is the oldest in modeling the utilization of complex waste [49]. It can only be applied when the rate-limiting factor is the surface of the particulate substrate, and bioavailability or biodegradability-related phenomena do not interfere [33]. The first-order kinetic model is not precise in the representation of the process. According to Pages et al. [50], it provides useful information on the rate of degradation and the maximum biomethane production for the entire degradation process without intermediate metabolites. The hydrolysis rate constant (k-value) for FW in this experiment (0.20) (Table 2). Da Silva et al. [51] pointed out that biomethane production and rate of degradation depend on the k-value. In general, faster degradation and biomethane production could be achieved with a higher k-value. However, this study found that a lower k-value generated a high amount of biomethane. Additionally, it was noted that the k of FW was higher than that of GM. The incorporation of GM to FW produced a higher k value in the GM/FW mixing ratios of 10:90 and 50:50 compared to (k) for FW alone. The increase in GM’s content reduced the k value in the mixing ratio of GM/FW 60:40, 70:30, and 90:10. The R2 value for the first-order kinetic model ranged between (0.921–0.994), which demonstrates good efficacy of the first-order model in predicting anaerobic co-digestion of GM and FW with few exceptions.

3.6. Modified Gompertz Kinetic Model

The kinetic parameters of Rmax, G0, and λ are presented in Table 3. The R2 for the mixing ratios was between 0.996 and 0.999, whereas for FW mono-digestion and 10% GM R2 was 0.972 and 0.959, respectively. The Rmax values were observed in the range of 4.1 to 42.3 mL/gVS d−1. A higher Rmax value represents higher biomethane yields.
Lag phase (λ) is an important parameter to determine substrate biodegradability and utilization rate [52]. The highest and lowest values of λ (d) were observed in GM/FW 60:40 and GM mono-digestion, respectively.

3.7. Comparison of First-Order and Modified Gompertz Model

The experimental and simulated biomethane values from both models are presented in Figure 3. The root means square error (RMSE) and the coefficient of determination (R2) were used to find the best model fit (Table 3). For the first-order model, the RMSE values were in the range of 0.018 to 0.992, and the R2 values were in the range of 0.921 to 0.994 (Table 2). Similarly, for the Gompertz model, the RMSE values were in the range of 0.003 to 0.448, and the R2 values were in the range of 0.959 to 0.99. Both of the models fitted well to the AD process as the difference between the experimental and predicted biomethane yield was less than 5%. Raposo et al. [53] reported that the first-order kinetic model predicted methane yield at an error of 10% or less from sunflower oil cake. Kafle and Chen [54] also reported similar findings while simulating AD of swine manure.
The modified Gompertz model (Table 3) has smaller RMSE values and a difference between predicted and experimental biomethane yields than the first-order kinetic model, indicating it is a better fit for simulating the GM-FW anaerobic digestions. The observation is strongly supported by its higher correlation coefficient (0.959–0.999).

3.8. Biodegradability

The biodegradabilities (BDs) of GM and FW mono-digestions were 65.7 and 33.5%, respectively (Table 4). The GM-FW co-digestions had higher BDs compared to their mono-digestions. The BDs of co-digestion having 60 and 70% GM were 97.4 and 90.1%, respectively. The mechanism that might be associated with the increase in BD for both GM/FW 60:40 and 70:30 could be the adsorption of hemicellulose and cellulose of both substrates by forming complexes with a lower hydrolysis rate than FW alone. Therefore, this avoids the inhibition of methane production caused by high VFA concentration and acidic pH [55,56]. Another mechanism can be the result of nutrient balance, which facilitates the optimal growth of various micro-organisms involved in the AD process [17]. Previous research reported that BD decreases with the increase in lignin content in various animal manure and energy crops [38].

3.9. Process Stability

The initial, adjusted, and final pH of GM/FW treatments at 0 to 66 d of digestion are shown in Table 5. Most of the digesters with a high proportion of FW had pH in the range of 5.18–5.64, while those with higher GM proportion had pH in the range of 7.1–7.5. This might be due to the alkaline component of GM, enhancing the buffer capacity and stability of the anaerobic system. The initial pH at each GM/FW mixing ratio decreased as the percentage of FW in the co-digestion increased. The imbalance of hydrolytic and acetogenic bacteria can cause lower methane yield and reactor failure. This imbalance is often caused by the accumulation of VFAs, which may lead to a dramatic drop in pH when there is not enough buffering capacity in the reactor. Thus, the pH and VFA/alkalinity ratios are common stress indicators used for monitoring the AD process [57]. It was observed that low final pH values indicated reactor failure. A study by Brown and Li [58] also showed that the pH in the batch reactors decreased with an increase in the amount of FW. The adjusted pH ranged from 6.9 to 7.3, close to the recommended operating pH of 7.4 proposed by Lahav and Morgan [59]. The adjustment of pH or the addition of the buffer solution is necessary for the continuous production of biomethane.

4. Conclusions

This study evaluated the effects of substrate characteristics on the process stability, biodegradability, digestion kinetics, and biomethane yield in mono- and co-digestions of GM and FW using anaerobic batch digesters at 36 ± 1 °C. The experimental findings prove that the anaerobic co-digestion of GM and FW enhances the biomethane yield compared to their mono-digestions. The highest increase in biomethane recovery (72.6%) was observed in the co-digestions having 60% GM compared to its mono-digestion. The 90% of biomethane was recovered in 20 d in 90 and 100% FW co-digestions. In contrast, the highest time (60 d) was taken by GM mono-digestion and co-digestion having 90% GM. The BMP tests indicate that a large proportion of GM in the mixing ratios provides buffer support, which keeps the pH of the digester at the desired range.
The modified Gompertz model had lower RMSE values than the first-order kinetic model and a smaller difference between predicted and experimental biomethane yields. The R2 (0.959–0.999) values were also higher compared to the first-order model, indicating that it was the better fit for the GM/FW mono- and co-digestions. The results of this study will help the researchers with useful information about the substrates investigated here and resolve environmental problems of greenhouse gas emissions and aid in generating bioenergy. The digestate (bio-solid) generated afterward can be further processed and evaluated for its potential applications as a bio-fertilizer.

Author Contributions

Conceptualization, R.R.K.; methodology, A.O, R.R.K.; software, A.O.; validation, A.O., H.K.; formal analysis, A.O.; investigation, A.O.; resources, R.R.K.; data curation, A.O., H.K.; writing—Original draft preparation, A.O.; writing—Review and editing, H.K., R.R.K.; supervision, R.R.K.; project administration, R.R.K.; funding acquisition, R.R.K. All authors have read and agreed to the published version of the manuscript.

Funding

This research was funded by the USDA-CBG program grant (Award No. 2018-38821-27750), and partial support is also received from the NSF CREST Center for Energy and Environmental Sustainability (CEES) at Prairie View A&M University (NSF Award # 1036593), Prairie View, Texas. The funders had no role in the design of the study; in the collection, analyses, or interpretation of data; in the writing of the manuscript, or in the decision to publish the results.

Acknowledgments

We thank Venkata Sai Vamsi Botlaguduru for his help in setting up this project in the initial stages of this work and Hongbo Du for his help in the lab and with the manuscript.

Conflicts of Interest

The authors declare no conflict of interest.

References

  1. Giusti, L. A review of waste management practices and their impact on human health. Waste Manag. 2009, 29, 2227–2239. [Google Scholar] [CrossRef] [PubMed]
  2. Scarlat, N.; Dallemand, J.-F.; Fahl, F. Biogas: Developments and perspectives in Europe. Renew. Energy 2018, 129, 457–472. [Google Scholar] [CrossRef]
  3. Nasir, I.M.; Ghazi, T.I.M.; Omar, R. Production of biogas from solid organic wastes through anaerobic digestion: A review. Appl. Microbiol. Biotechnol. 2012, 95, 321–329. [Google Scholar] [CrossRef] [PubMed]
  4. Afazeli, H.; Jafari, A.; Rafiee, S.; Nosrati, M. An investigation of biogas production potential from livestock and slaughterhouse wastes. Renew. Sustain. Energy Rev. 2014, 34, 380–386. [Google Scholar] [CrossRef]
  5. Braber, K. Anaerobic digestion of municipal solid waste: A modern waste disposal option on the verge of breakthrough. Biomass Bioenergy 1995, 9, 365–376. [Google Scholar] [CrossRef]
  6. Rolewicz-Kalińska, A.; Oniszk-Popławska, A.; Wesołowska, J.; Ryńska, E.D. Conditions for the development of anaerobic digestion technologies using the organic fraction of municipal solid waste: Perspectives for Poland. Environ. Dev. Sustain. 2016, 18, 1279–1296. [Google Scholar] [CrossRef] [Green Version]
  7. Dehkordi, S.M.M.N.; Jahromi, A.R.T.; Ferdowsi, A.; Shumal, M.; Dehnavi, A. Investigation of biogas production potential from mechanical separated municipal solid waste as an approach for developing countries (case study: Isfahan-Iran). Renew. Sustain. Energy Rev. 2020, 119, 109586. [Google Scholar] [CrossRef]
  8. Bedoić, R.; Špehar, A.; Puljko, J.; Čuček, L.; Ćosić, B.; Pukšec, T.; Duić, N. Opportunities and challenges: Experimental and kinetic analysis of anaerobic co-digestion of food waste and rendering industry streams for biogas production. Renew. Sustain. Energy Rev. 2020, 130, 109951. [Google Scholar] [CrossRef]
  9. Ma, G.; Ndegwa, P.; Harrison, J.H.; Chen, Y. Methane yields during anaerobic co-digestion of animal manure with other feedstocks: A meta-analysis. Sci. Total Environ. 2020, 728, 138224. [Google Scholar] [CrossRef]
  10. Panigrahi, S.; Sharma, H.B.; Dubey, B.K. Anaerobic co-digestion of food waste with pretreated yard waste: A comparative study of methane production, kinetic modeling and energy balance. J. Clean. Prod. 2020, 243, 118480. [Google Scholar] [CrossRef]
  11. Şenol, H.; Açıkel, Ü.; Demir, S.; Oda, V. Anaerobic digestion of cattle manure, corn silage and sugar beet pulp mixtures after thermal pretreatment and kinetic modeling study. Fuel 2020, 263, 116651. [Google Scholar] [CrossRef]
  12. Hartmann, H.; Ahring, B.K. Anaerobic digestion of the organic fraction of municipal solid waste: Influence of co-digestion with manure. Water Res. 2005, 39, 1543–1552. [Google Scholar] [CrossRef] [PubMed] [Green Version]
  13. Banks, C.J.; Zhang, Y.; Jiang, Y.; Heaven, S. Trace element requirements for stable food waste digestion at elevated ammonia concentrations. Bioresour. Technol. 2012, 104, 127–135. [Google Scholar] [CrossRef] [PubMed] [Green Version]
  14. Nagao, N.; Tajima, N.; Kawai, M.; Niwa, C.; Kurosawa, N.; Matsuyama, T.; Yusoff, F.M.; Toda, T. Maximum organic loading rate for the single-stage wet anaerobic digestion of food waste. Bioresour. Technol. 2012, 118, 210–218. [Google Scholar] [CrossRef] [PubMed]
  15. Zhang, T.; Liu, L.; Song, Z.; Ren, G.; Feng, Y.; Han, X.; Yang, G. Biogas production by co-digestion of goat manure with three crop residues. PLoS ONE 2013, 8, e66845. [Google Scholar] [CrossRef] [Green Version]
  16. Gu, Y.; Chen, X.; Liu, Z.; Zhou, X.; Zhang, Y. Effect of inoculum sources on the anaerobic digestion of rice straw. Bioresour. Technol. 2014, 158, 149–155. [Google Scholar] [CrossRef]
  17. Xu, F.; Li, Y.; Ge, X.; Yang, L.; Li, Y. Anaerobic digestion of food waste—Challenges and opportunities. Bioresour. Technol. 2018, 247, 1047–1058. [Google Scholar] [CrossRef]
  18. Miller, B.A.; Lu, C.D. Current status of global dairy goat production: An overview. Asian Australas. J. Anim. Sci. 2019, 32, 1219–1232. [Google Scholar] [CrossRef]
  19. USDA; NASS. United States Summary and State Data, 2017. In Census of Agriculture; United States Department of Agriculture: Washington, DC, USA, 2019; Volume 1. Available online: https://www.nass.usda.gov/Publications/AgCensus/2017/ (accessed on 11 April 2019).
  20. Hribar, C. Understanding Concentrated Animal Feeding Operations and Their Impact on Communities; National Association of Local Boards of Health: Bowling Green, OH, USA, 2010; pp. 1–22. [Google Scholar]
  21. Burkholder, J.; Libra, B.; Weyer, P.; Heathcote, S.; Kolpin, D.; Thorne, P.S.; Wichman, M. Impacts of waste from concentrated animal feeding operations on water quality. Environ. Health Perspect. 2007, 115, 308–312. [Google Scholar] [CrossRef] [Green Version]
  22. Aneja, V.P.; Nelson, D.R.; Roelle, P.A.; Walker, J.T.; Battye, W. Agricultural ammonia emissions and ammonium concentrations associated with aerosols and precipitation in the southeast United States. J. Geophys. Res. 2003, 108, 4152. [Google Scholar] [CrossRef] [Green Version]
  23. Howard, A.; Botlaguduru, V.S.V.; Du, H.; Kommalapati, R.R.; Huque, Z. Measurements and comparative air quality analysis of a goat farm operation. Trans. ASABE 2019, 62, 1723–1733. [Google Scholar] [CrossRef]
  24. Hu, Y.; Cheng, H.; Tao, S. Environmental and human health challenges of industrial livestock and poultry farming in China and their mitigation. Environ. Int. 2017, 107, 111–130. [Google Scholar] [CrossRef]
  25. United States Government Accountability Office. EPA-Concentrated Animal Feeding Farm Operations; GAO: Washington, DC, USA, 2008. Available online: https://www.gao.gov/products/gao-08-944 (accessed on 24 September 2008).
  26. Zhang, R.; El-Mashad, H.M.; Hartman, K.; Wang, F.; Liu, G.; Choate, C.; Gamble, P. Characterization of food waste as feedstock for anaerobic digestion. Bioresour. Technol. 2007, 98, 929–935. [Google Scholar] [CrossRef]
  27. Li, R.; Chen, S.; Li, X. Biogas production from anaerobic co-digestion of food waste with dairy manure in a two-phase digestion system. Appl. Biochem. Biotechnol. 2010, 160, 643–654. [Google Scholar] [CrossRef]
  28. Han, S.-K.; Shin, H.-S. Biohydrogen production by anaerobic fermentation of food waste. Int. J. Hydrogen Energy 2004, 29, 569–577. [Google Scholar] [CrossRef]
  29. Kelley, T.R.; Walker, P.M. Bacterial concentration reduction in swine waste amended livestock feed using a single-screw dry-extrusion process. Bioresour. Technol. 2000, 75, 189–195. [Google Scholar] [CrossRef]
  30. Ohemeng-Ntiamoah, J.; Datta, T. Perspectives on variabilities in biomethane potential test parameters and outcomes: A review of studies published between 2007 and 2018. Sci. Total Environ. 2019, 664, 1052–1062. [Google Scholar] [CrossRef] [PubMed]
  31. Filer, J.; Ding, H.H.; Chang, S. Biochemical Methane Potential (BMP) assay method for anaerobic digestion research. Water 2019, 11, 921. [Google Scholar] [CrossRef] [Green Version]
  32. Raposo, F.; Fernández-Cegrí, V.; De La Rubia, M.A.; Borja, R.; Béline, F.; Cavinato, C.; Demirer, G.N.; Fernández, B.; Fernández-Polanco, M.; Frigon, J.C.; et al. Biochemical methane potential (BMP) of solid organic substrates: Evaluation of anaerobic biodegradability using data from an international interlaboratory study. J. Chem. Technol. Biotechnol. 2011, 86, 1088–1098. [Google Scholar] [CrossRef]
  33. Labatut, R.A.; Angenent, L.T.; Scott, N.R. Biochemical methane potential and biodegradability of complex organic substrates. Bioresour. Technol. 2011, 102, 2255–2264. [Google Scholar] [CrossRef]
  34. Rabii, A.; Aldin, S.; Dahman, Y.; Elbeshbishy, E. A review on anaerobic co-digestion with a focus on the microbial populations and the effect of multi-stage digester configuration. Energies 2019, 12, 1106. [Google Scholar] [CrossRef] [Green Version]
  35. Bong, C.P.C.; Lim, L.Y.; Lee, C.T.; Klemeš, J.J.; Ho, C.S.; Ho, W.S. The characterisation and treatment of food waste for improvement of biogas production during anaerobic digestion—A review. J. Clean. Prod. 2018, 172, 1545–1558. [Google Scholar] [CrossRef]
  36. Angelidaki, I.; Alves, M.M.; Bolzonella, D.; Borzacconi, L.; Campos, J.L.; Guwy, A.J.; Kalyuzhnyi, S.; Jenicek, P.; Van Lier, J.B. Defining the biomethane potential (BMP) of solid organic wastes and energy crops: A proposed protocol for batch assays. Water Sci. Technol. 2009, 59, 927–934. [Google Scholar] [CrossRef] [PubMed] [Green Version]
  37. Moody, L.; Burns, R.; Wu-haan, W.; Spajic, R. Use of biochemical methane potential (BMP) assays for predicting and enhancing anaerobic digester performance. In Proceedings of the 44th Croatian and the 4th International Symposium on Agriculture, Opatija, Croatia, 16–20 February 2009. [Google Scholar]
  38. Braguglia, C.; Mininni, G.; Tomei, M.; Rolle, E. Effect of feed/inoculum ratio on anaerobic digestion of sonicated sludge. Water Sci. Technol. 2006, 54, 77–84. [Google Scholar] [CrossRef] [PubMed]
  39. Richards, B.K.; Cummings, R.J.; White, T.E.; Jewell, W.J. Methods for kinetic analysis of methane fermentation in high solids biomass digesters. Biomass Bioenergy 1991, 1, 65–73. [Google Scholar] [CrossRef]
  40. Boyle, W. Energy Recovery from Sanitary Landfills—A Review; Pergamon Press: Oxford, UK, 1977; pp. 119–138. [Google Scholar]
  41. Buswell, A.M.; Mueller, H.F. Mechanism of methane fermentation. Ind. Eng. Chem. 1952, 44, 550–552. [Google Scholar] [CrossRef]
  42. Lay, J.-J.; Li, Y.-Y.; Noike, T. Effect of moisture content and chemical nature on methane fermentation characteristics of municipal solid wastes. Doboku Gakkai Ronbunshu 1996, 101–108. [Google Scholar] [CrossRef] [Green Version]
  43. Lay, J.-J.; Li, Y.-Y.; Tatsuya, N. Influences of pH and moisture content on the methane production in high-solids sludge digestion. Water Res. 1997, 31, 1518–1524. [Google Scholar] [CrossRef]
  44. Bhattarai, S.; Oh, J.-H.; Euh, S.-H.; Kafle, G.K.; Kim, D.H. Simulation and model validation of sheet and tube type photovoltaic thermal solar system and conventional solar collecting system in transient states. Sol. Energy Mater. Sol. Cells 2012, 103, 184–193. [Google Scholar] [CrossRef]
  45. Kafle, G.K.; Kim, S.H.; Sung, K.I. Ensiling of fish industry waste for biogas production: A lab scale evaluation of biochemical methane potential (BMP) and kinetics. Bioresour. Technol. 2013, 127, 326–336. [Google Scholar] [CrossRef] [PubMed]
  46. Wang, X.; Yang, G.; Feng, Y.; Ren, G.; Han, X. Optimizing feeding composition and carbon–nitrogen ratios for improved methane yield during anaerobic co-digestion of dairy, chicken manure and wheat straw. Bioresour. Technol. 2012, 120, 78–83. [Google Scholar] [CrossRef] [PubMed]
  47. Fernández-Rodríguez, M.J.F.; Rincón, B.; Fermoso, F.G.; Jiménez, A.; Borja, R. Assessment of two-phase olive mill solid waste and microalgae co-digestion to improve methane production and process kinetics. Bioresour. Technol. 2014, 157, 263–269. [Google Scholar] [CrossRef] [PubMed] [Green Version]
  48. Yuan, X.-Z.; Shi, X.-S.; Yuan, C.-X.; Wang, Y.-P.; Qiu, Y.-L.; Guo, R.-B.; Wang, L.-S. Modeling anaerobic digestion of blue algae: Stoichiometric coefficients of amino acids acidogenesis and thermodynamics analysis. Water Res. 2014, 49, 113–123. [Google Scholar] [CrossRef] [PubMed]
  49. Mata-Alvarez, J. Biomethanization of the Organic Fraction of Municipal Solid Wastes; IWA Publishing: London, UK, 2003; ISBN 1900222140. [Google Scholar]
  50. Díaz, J.P.; Reyes, I.P.; Lundin, M.; Horváth, I.S. Co-digestion of different waste mixtures from agro-industrial activities: Kinetic evaluation and synergetic effects. Bioresour. Technol. 2011, 102, 10834–10840. [Google Scholar] [CrossRef] [PubMed]
  51. Da Silva, C.; Astals, S.; Peces, M.; Campos, J.; Guerrero, L. Biochemical methane potential (BMP) tests: Reducing test time by early parameter estimation. Waste Manag. 2018, 71, 19–24. [Google Scholar] [CrossRef]
  52. Xie, S.; Hai, F.I.; Zhan, X.; Guo, W.; Ngo, H.H.; Price, W.E.; Nghiem, L.D. Anaerobic co-digestion: A critical review of mathematical modelling for performance optimization. Bioresour. Technol. 2016, 222, 498–512. [Google Scholar] [CrossRef] [PubMed]
  53. Raposo, F.; Borja, R.; Martín, A.; De La Rubia, M.Á.; Rincón, B. Influence of inoculum–substrate ratio on the anaerobic digestion of sunflower oil cake in batch mode: Process stability and kinetic evaluation. Chem. Eng. J. 2009, 149, 70–77. [Google Scholar] [CrossRef]
  54. Kafle, G.K.; Chen, L. Comparison on batch anaerobic digestion of five different livestock manures and prediction of biochemical methane potential (BMP) using different statistical models. Waste Manag. 2016, 48, 492–502. [Google Scholar] [CrossRef] [Green Version]
  55. Eronen, P.; Österberg, M.; Heikkinen, S.; Tenkanen, M.; Laine, J. Interactions of structurally different hemicelluloses with nanofibrillar cellulose. Carbohydr. Polym. 2011, 86, 1281–1290. [Google Scholar] [CrossRef]
  56. Ju, X.; Engelhard, M.; Zhang, X. An advanced understanding of the specific effects of xylan and surface lignin contents on enzymatic hydrolysis of lignocellulosic biomass. Bioresour. Technol. 2013, 132, 137–145. [Google Scholar] [CrossRef]
  57. Anderson, G.K.; Yang, G. Determination of bicarbonate and total volatile acid concentration in anaerobic digesters using a simple titration. Water Environ. Res. 1992, 64, 53–59. [Google Scholar] [CrossRef]
  58. Browne, J.D.; Murphy, J.D. Assessment of the resource associated with biomethane from food waste. Appl. Energy 2013, 104, 170–177. [Google Scholar] [CrossRef]
  59. Lahav, O.; Morgan, B. Titration methodologies for monitoring of anaerobic digestion in developing countries? A review. J. Chem. Technol. Biotechnol. 2004, 79, 1331–1341. [Google Scholar] [CrossRef] [Green Version]
Figure 1. Schematic diagram of liquid displacement method.
Energies 14 01952 g001
Figure 2. Biomethane yields: (a) Daily and (b) Cumulative (mL/gvs) yields.
Energies 14 01952 g002
Figure 3. The experimental and predicted biomethane yields for GM/FW ratios; a: 0:100, b: 10:90; c: 30:70; d: 40:60, e: 50:50, f: 60:40, g: 70:30, h: 90:10, i: 100:0 for the first order (left) and modified Gompertz models (right).
Energies 14 01952 g003aEnergies 14 01952 g003bEnergies 14 01952 g003c
Table 1. Characteristics of goat manure (GM), food waste (FW), and inoculum.
ParametersUnitsGMFWInoculum
Total Solid (TS)% 64.9 ± 1.985.2 ± 0.63.9 ± 0.4
Volatile Solid (VS)%54.4 ± 1.344.3 ± 2.81.94 ± 0.2
Moisture Content (MC)%35.1 ± 1.714.8 ± 0.696 ± 0.1
Ash%10.5 ± 0.440.8 ± 2.51.9 ± 0.2
CODg/L1.9 ± 0.2165.5 ± 3.43.0 ± 0.2
pH-7.3 ± 0.05.1 ± 0.17.1 ± 0.0
C%35.5 ± 0.447.0 ± 2.4-
H%6.0 ± 0.17.3 ± 0.4-
N%1.8 ± 0.02.7 ± 0.4-
O%56.2 ± 0.342.9 ± 3.3-
S%0.5 ± 0.00.2 ± 0.0-
C/N%20:118:1-
VS/TS%84.2 ± 0.252.1 ± 3.150.2 ± 0.6
Chemical formula-C23.51H47.59O27.93NC20.36H37.49O13.94N-
Table 2. The first-order kinetic model parameters for GM: FW ratios.
First-OrderKineticModel
GM/FW Treatment G 0
(mL/gVS)
CMY
(mL/gVS)
K(d−1)R2RMSE%
Difference
0:100169.8169.70.19660.9830.0500.06
10:90181.4182.00.23790.9810.0370.29
30:70174.6174.80.16070.9270.1060.15
40:60149.4150.90.18690.9330.0911.01
50:50181.9183.80.41410.9890.0181.05
60:40432.8380.50.02930.9210.2211.16
70:30497.6337.30.01850.9700.2134.00
90:10183.9171.90.04190.9890.0890.34
100:0212.2206.00.05610.9940.9920.49
Table 3. Gompertz model parameters for GM: FW ratios.
GM: FW G 0
(mL/gVS)
CMY
(mL/gVS)
R m a x (mL/gVS)λ (d)R2RMSE% Differnce
0:100169.6167.715.1−1.8530.9720.0380.06
10:90184.1182.020.2−1.4070.9590.0490.49
30:70175.3174.810.9−3.7490.9970.0660.26
40:60150.5150.99.7−4.1450.9980.0500.27
50:50181.3183.842.3−0.3000.9990.0031.35
60:40449.3380.55.9−11.4720.9960.0863.69
70:30386.9337.36.−2.6550.9970.0972.13
90:10176.1171.94.1−4.9160.9980.2030.49
100:0200.0206.08.0−0.10110.9990.4483.19
Table 4. Biodegradability (BD) of GM and FW mono and co-digestions.
GM:FWTMY (mL/gVS)EMY (mL/gVS)BD (%)
0:100506.6167.733.5
10:90487.3182.037.3
30:70448.7174.839.0
40:60429.3150.935.2
50:50418.2183.843.9
60:40390.7380.597.4
70:30374.2337.390.1
90:10332.8171.951.7
100:0313.4206.065.7
Table 5. Changes in pH for GM and FW mixing ratios during the 66 d co-digestion.
GM/FWpH
InitialAdjustedFinal
0:1005.1 ± 0.16.9± 0.15.4 ± 0.0
10:906.0 ± 0.16.9 ± 0.15.4 ± 0.0
30:706.4 ± 0.17.1 ± 0.05.6 ± 0.0
40:607.2 ± 0.27.2 ± 0.25.6 ± 0.1
50:507.0 ± 0.07.0 ± 0.05.2 ± 0.0
60:407.1 ± 0.17.1 ± 0.17.5 ± 0.0
70:307.1 ± 0.17.1 ± 0.17.2 ± 0.1
90:107.1 ± 0.07.1 ± 0.07.2 ± 0.0
100:07.3 ± 0.07.3 ± 0.07.1 ± 0.0
Publisher’s Note: MDPI stays neutral with regard to jurisdictional claims in published maps and institutional affiliations.

