1. Introduction
The demand to reduce vehicle emissions to comply with modern legislation has led to the development of hybrid and fully electric road vehicles for the consumer market by most of the major automotive manufacturers. Weight and cost optimisation of packs is a key performance indicator prioritised within the automotive industry. Together with innovative material optimisation, improved volumetric efficiency, and design for recyclability, the lifecycle impact of vehicles can be reduced. Current electric and hybrid vehicles rely on Li-Ion battery technology in the form of cylindrical, prismatic or pouch cells. The cells are often packaged to minimise physical damage, as this may result in internal shorting and potential thermal runaway. This is normally achieved by holding the cells in modules, which are themselves contained within a pack secured inside the vehicle structure. The battery packs are typically large and heavy (e.g., The pack for a Nissan LEAF contains 192 cells in 48 modules weighing 294 kg) with a low energy density, e.g., Nissan leaf 81.4 Wh/kg, Tesla Model S 140 Wh/kg. For the safety of electric vehicles to be improved, it is essential that energy density can be increased whilst limiting the risk of thermal runaway resulting from physical damage, e.g., in a crash. Vehicle crash response is largely evaluated using finite element (FE) simulation. An essential part of battery crash simulation is a structural FE model of a battery cell, which provides the opportunity to optimise the module and pack designs by taking into consideration the structural contribution of the cells.
A large number of methods for measuring volumetric strain as a response to electrochemical processes, such as cycling, degradation, and abuse [
1]. These measurement techniques, including cell surface pressure [
2] and embedded fibre optics [
3], can be used by a battery management system to determine the cell’s state of charge or state of health.
Coupling between mechanical and electrochemical phenomena can arise from both external mechanical loading [
4] and internal cycling [
5]. Stresses within the cell’s active materials can lead to fracture of the lithium bearing particles [
6], causing degradation and failure. The changing stiffness arising from a cell’s changing state of charge or state of health can be determined from the frequency response on a mechanical shaker [
7]. The intercalation and deintercalation of lithium ions result in a change of mechanical properties that may be significant under crash and vibration load cases in automotive applications. Swelling also occurs from the thermal expansion of the active materials, which increases with charge and discharge rate [
8]. These thermal effects can be highly localised [
9], which means that a homogenous model may not adequately predict the mechanical response in all crash scenarios. However, for the scope of this work, thermal and electrochemical coupling is not considered.
Pouch cells are attractive for future electric/hybrid vehicle designs as they offer greater packing density. Whilst previous published work [
10] has focused on individual load-cases, particularly indentation, to understand the development of internal shorts during abuse, the objective of the current work has been to develop a model capable of representing the behaviour of a cell under typical in-service mechanical loading experienced in automotive applications. In this paper, a model of a battery cell that has characteristic stiffness and deformation is developed which, using appropriate material properties and FE topology, is simultaneously consistent with multiple load-cases and suitable for integration into module, pack and full vehicle FE model simulations. The ability to scale this structural model to accommodate cells of different geometries or to provide information about interactions/deformation of multiple cells in a module is also investigated.
2. Cell Modelling
The lithium-ion pouch cell comprises multiple layers of negative electrode (anode), positive electrode (cathode) and separator, sealed in a flexible aluminium/polymer pouch. Two approaches have been developed to model the structural behaviour of cells using the FE method. The first is a detailed model in which all the components of the cell structure are defined but which requires mechanical property data for all of the individual components. The second is a macro model in which the bulk of the cell is treated as a single entity with homogenised properties obtained from physical testing of complete cells.
2.1. Detailed Models
Pouch Cell constructions include a number of materials, e.g., active layers, for which conventional structural material properties and characteristics are not readily available. In addition, the individual layers are very thin being of the order of 10–20 µm. To model each individual layer in a typical 20 Ah pouch cell of dimensions 200 × 150 × 7 mm, using solid elements would require approximately 3 billion elements. Such a high level of discretisation for a cell model is computationally infeasible and not compatible with the time-step required for full vehicle, and sub-system, crash simulations run by vehicle manufacturers using explicit solvers such as LS-Dyna (Livermore Software Technology, Livermore, CA, USA). These models typically use a minimum time-step of 10–6 s, which relates to an element edge length of approximately 5 mm for both steel and aluminium structures. However, detailed models have been used to predict the onset of internal shorting in smaller cells [
11,
12,
13,
14] though the EVERSAFE project required a 2000 element simplified cell model for full vehicle simulations.
2.2. Macro Models
A computationally efficient method of representing cells in larger scale module and pack simulations is to use a macro model, which considers each cell as a block of homogeneous material [
15,
16]. This approach has been adopted by several workers e.g., [
17,
18].
In the simplest models a battery cell was based on a homogenous linear elastic cuboid and used for harmonic frequency analysis which showed good correlation with physical testing [
19]. This cell model was also used to determine the response of a module to various static and dynamic load-cases, including torsion, bending and impact. The cell modulus used was 100 MPa. However, the model was only suitable when the expected displacements were very small, i.e., less than 1 mm over the length of the module. Whilst this may provide a good estimate of a battery pack’s mechanical performance, there remain significant opportunities to reduce the mass of a battery pack if the maximum displacement a cell can undergo, without reducing electrical performance or sustaining permanent damage, can be determined.
Under significant mechanical loading, cells experience permanent deformation due to ‘plastic’ flow. The plastic behaviour of a cell can be modelled in various ways e.g., a pressure dependent non-associated flow rule [
17] or a crushable foam model [
18]. The crushable foam model is available in most finite element codes and is simple to implement. A sample compressive flow stress in the through thickness orientation can be approximated as
[
20]. The tensile modulus is obtained from the maximum slope of the compressive flow stress [
20] or from the tensile properties of the electrode and separator materials [
18].
The response of a structure with integrated lithium-ion cells can be predicted using an isotropic model [
21] but this may require a different model for the cell in each orientation or load case for the overall structure.
Sahreai et al. [
22] used a homogenous macro material model to simulate the behaviour of a cell subjected to through thickness or lateral compression. Sahraei et al. [
10] also demonstrated the use of a homogenised material model to predict the on-set of an internal short circuit in pouch cells due to a local indentation.
However, such localised deformation requires more detail of the behaviour of the individual components. To address this need, the concept of a Representative Volume Element (RVE) in which only a small volume of the cell is modelled in detail was developed [
23,
24]. Amodeo et al. [
25] used a hybrid concept to simulate the quasi-static and dynamic response of battery modules where the cells were modelled using RVEs and the heat dissipater plates were modelled specifically.
A limitation of the RVE approach is that it has relied on physical data obtained from testing of the laminate structure in dry conditions. Also, the use of the RVE to date has only been applied to in-plane and through thickness compression load cases and does not account for the effects of the pouch or inter-laminar connections.
The RVE and RVE/hybrid models developed so far have concentrated on relating the mechanical deformation to internal short-circuiting of the cell and have therefore focused on local deformation, e.g., a pinch test.
3. Methodology
The requirement for a model compatible with full vehicle simulations necessitates the use of a macro model. Unlike previous published models, the intention in this work was to create a single model, which would be simultaneously consistent with the typical load cases that a cell might experience when in use e.g., bending, through thickness compression and edgewise compression. Localised indentation was found to conflict with global bending and has not been considered in this model.
3.1. Physical Testing
To characterise the mechanical behaviour of cells, tests were performed in the battery abuse facility at WMG both on commercially available Li-ion pouch cells (DK50106 and DK80106) and dummy or inert cells (DMYCELL) produced in-house, as listed in
Table 1. Due to health and safety considerations, live cells were limited to a maximum capacity of 8 Ah. The physically larger dummy pouch cells, equivalent to 20 Ah capacity, were manufactured on the Battery Scale-Up (BSU) line at WMG. Although filled with electrolyte these did not contain the lithium salt so they remained electrically inert, thereby eliminating the possibility of a thermal event. While the stiffness of pouch [
26] and cylindrical [
27] cells has been shown to depend on the state of charge, these inert cells are valuable for validating the test and simulation methodology.
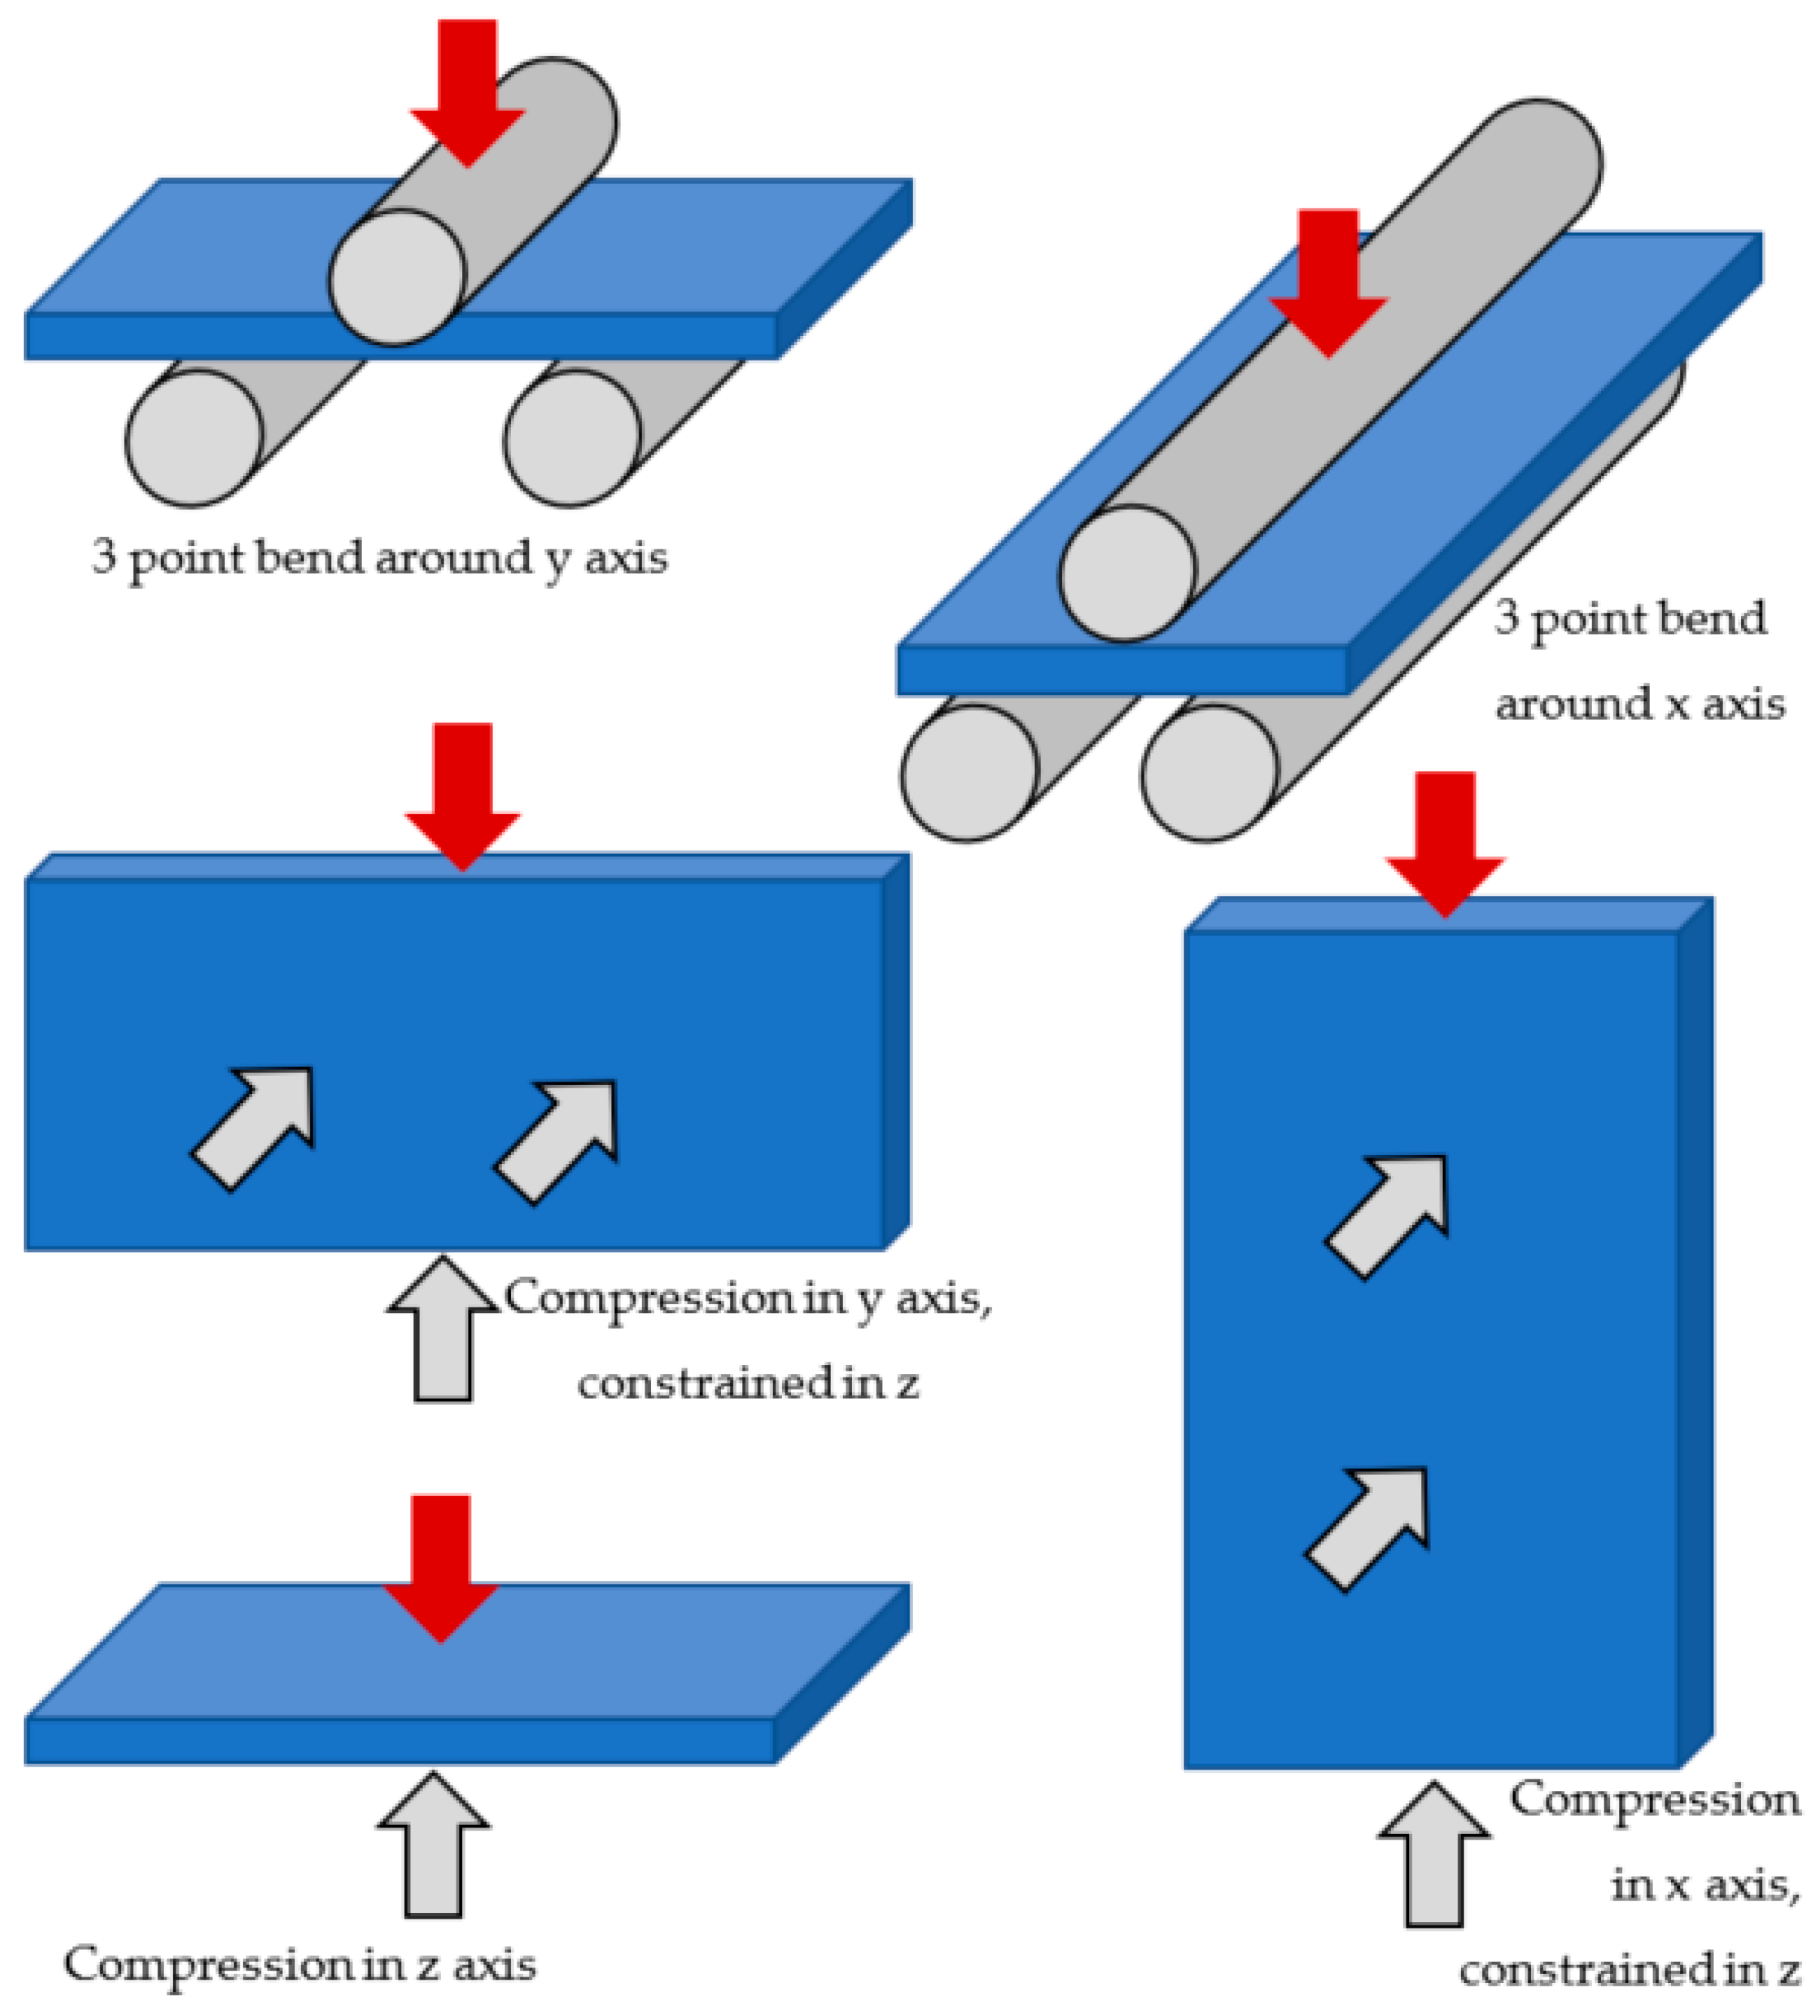
Quasi static tests were performed on separate cells for each of the five load-cases, as shown in
Figure 1, using a 10 kN Shimadzu universal testing machine located in a battery abuse chamber. A Vishay 7000 DAQ data recorder was used to simultaneously record force, displacement, open circuit voltage, and cell temperature during the tests, the latter two being used to detect the onset of internal shorting should it occur. Purpose-built fixtures, which included a load cell for measuring the lateral constraining force, were used for the confined compression tests. Maximum displacement was limited to 20% of the cell dimension in the direction of loading or a maximum force of 10 kN (the limit of the test machine) for the compression tests. Three-point bend (3PB) tests were performed with 10 mm diameters stators positioned at 75% of the appropriate cell dimension. The maximum displacement was limited to twice the cell thickness to prevent the cell slipping through the fixture. All tests were conducted at room temperature and a rate of displacement of 0.1 mm/min.
The commercial cells were tested at 50% State of Charge (SoC) as this was considered to be the most representative state of a cell in use and also reduced the possibility of a thermal runaway. A minimum of three tests were performed for each load case.
To ensure the cells were fully in contact with the loading fixture pre-loads were applied. For through thickness compression this was equivalent to the manufacturers’ recommended in-service pressure applied by the module assembly (approximately 0.1 MPa). For both in-plane compression and three-point bend tests the pre-load was set to a level where the cell to cell variations in the initial stage of the test converge.
The scalability of the modelling approach was explored in two ways. Firstly, the ability of the model to represent the mechanical behaviour of pouch cells with different physical dimensions and internal construction was investigated. Secondly, the appropriateness of the model for modelling multiple cells, as found in battery module assemblies, was investigated by performing compression and 3PB tests on unconstrained stacks of two or three cells.
3.2. FE Model Construction
3.2.1. Simulation Assumptions
The modelling methodology described makes the following basic assumptions:
- (a)
Individual layers within the cells, e.g., electrodes and separators are free to move relative to each other due to the lubricating effect of electrolyte.
- (b)
The primary load path between the lamina is the ‘bond’ between the layers and all significant structural load paths exist between the individual lamina, therefore the bulk of the cell can be considered as a homogeneous block.
- (c)
Mechanical properties of cells are orthotropic due to layered structure and can therefore be represented by an orthotropic material model (Honeycomb).
- (d)
Pseudo material properties can be determined from mechanical testing of cells.
- (e)
The methodology for modelling small cells can be scaled for larger cells.
The core of the battery cell which consists of multiple layers of coated cathode, separator and coated anode, was modelled as a bulk structure using the honeycomb material model LS-DYNA *MAT_HONEYCOMB (*MAT_026). This is an independently orthotropic material model with non-linear elastoplastic behaviour defined separately for all normal and shear stresses. The normal stress-strain characteristics can therefore be directly defined from through thickness and in-plane compression tests on physical cells. For a typical pouch cell construction, the equivalent homogeneous material properties give an element edge length of 2–4 mm for a solution time-step of
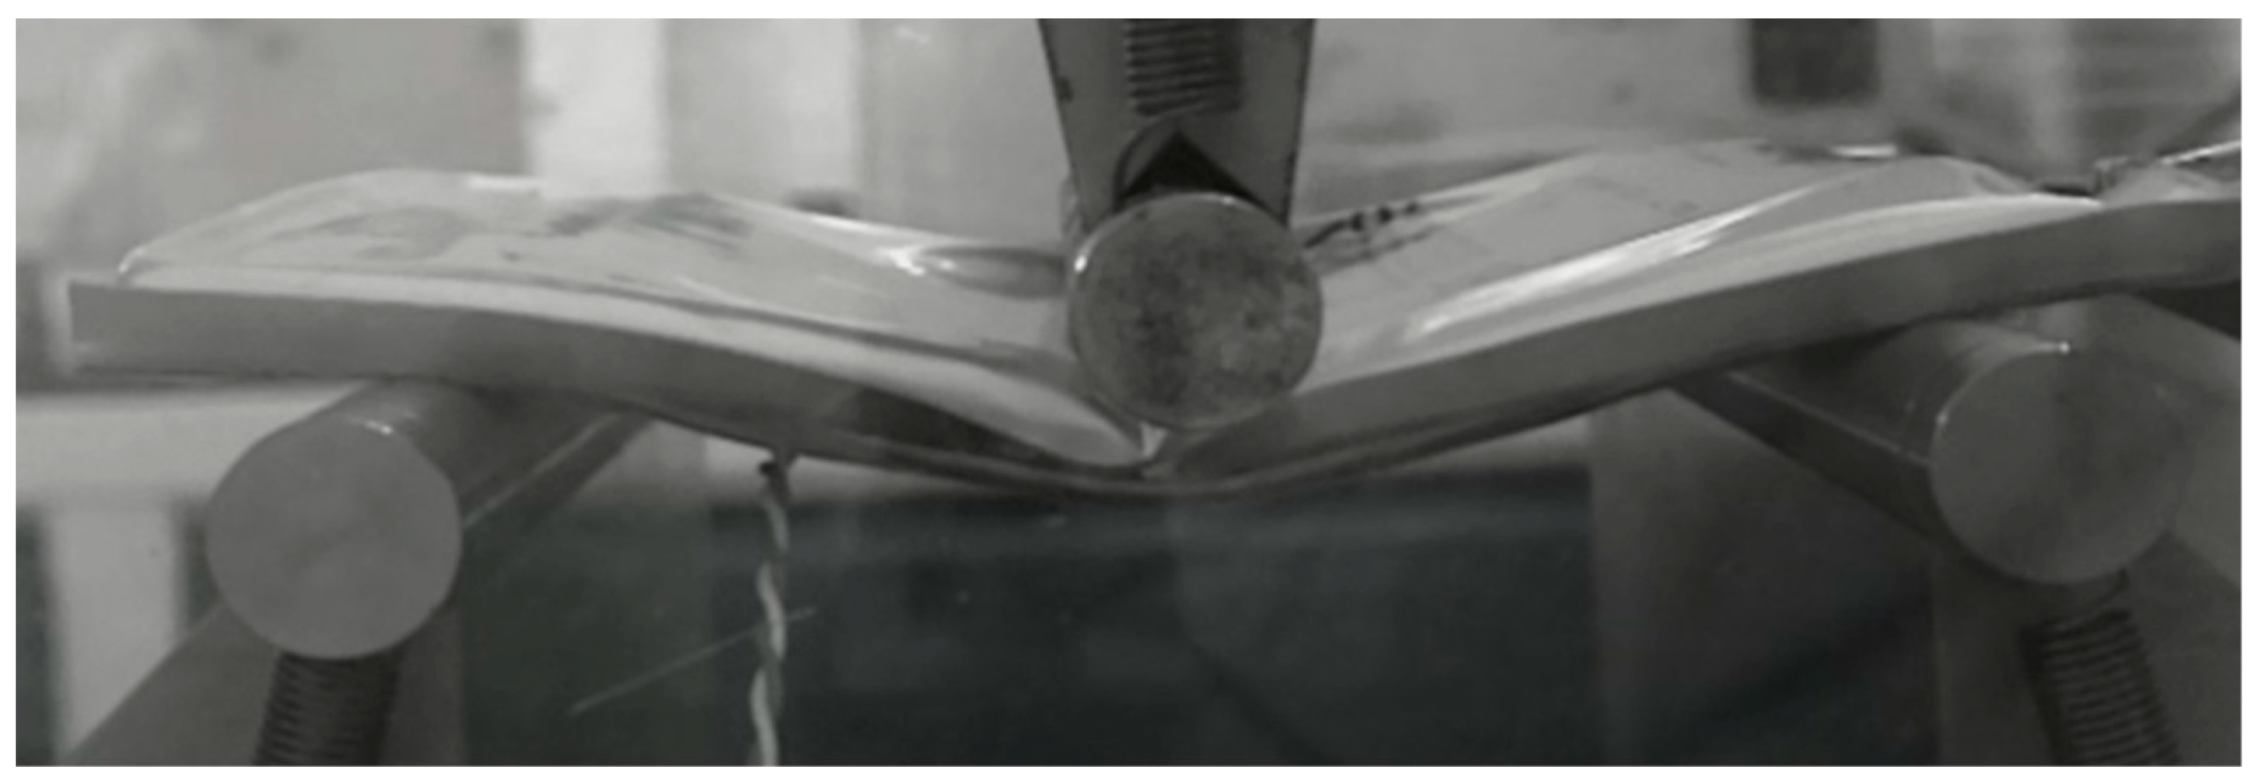
seconds. It was observed in 3PB tests that the pouch tended to wrap around the two supports (
Figure 2) suggesting that the sealed pouch may be affecting the behaviour. The pouch material, a sandwich of aluminium foil and polymer, is structurally thin (typically 125 µm) and separated from the bulk of the cell by the electrolyte. Under in-plane compression, the pouch readily buckled and was assumed to make little contribution in this mode to the stiffness of the overall cell. The pouch was therefore represented by a layer of shell elements with a fabric material model LS-DYNA *MAT_FABRIC (*MAT_034), developed for thin fabrics which cannot support compressive stresses. The element size required to match the time-step for full vehicle simulations is too large to capture the buckling behaviour of the pouch within the macro model.
The honeycomb material model has four parameters controlling the behaviour of a compacted material—Young’s modulus, Poisson’s ratio, yield stress and volume fraction at compaction. These parameters are not used as the isotropic elastic-ideal plastic compacted scenario is not relevant to this cell model. The bulk viscosity flag was set to zero and not used as the fitted parameter of material viscosity is recommended. The material axes parameters were all left blank and the local orthotropic axes were determined by the node orientation.
The fabric material model has the compressive strain elimination flag set to 1 as the buckling behaviour cannot be modelled with a coarse macro model. The FORM flag was set to 4 for large strains and nonlinear stress-strain behaviour. The Rayleigh damping coefficient was set to 0.1. A Poisson’s ratio of 0.33 and Young’s moduli of 7000 were used. All other fabric parameters were left at default and the orthotropic axes were defined by the node orientation.
The element formulations were type 1 constant stress 8 node solids and type 2 Belytschko-Tsay 4 node shells with 2 integration points through thickness for the honeycomb and fabric materials respectively. The solid elements have type 6 Belytschko-Bindeman hourglass control with a coefficient of 0.00075. Automatic surface to surface contacts were used between the cell pouch and rigid loading surfaces with a coefficient of friction of 0.3. Preload was applied to match the physical testing with a rigid body load. The displacement of the loading surface was controlled with a boundary prescribed motion applied to the rigid body after the preload. The rate was determined by a curve smooth with a maximum velocity of 100 mm/s and a rise time of 2 ms. This allowed for a substantial reduction in runtime via run scaling without introducing any inappropriate inertial effects.
3.2.2. Model Calibration to Test
Calibration is the process in which material parameters in the pouch cell macro FE model are adjusted to match the force vs displacement outputs from the model to those obtained from the physical tests. To do this a target (average) and an associated envelope (due to cell to cell variation) for the force vs displacement data obtained from the physical tests of each load case was prepared. The average force-displacement curves for the compression load-cases; LCZ, CCX & CCY are used to determine the through thickness and in-plane stress-strain characteristics for the honeycomb material model.
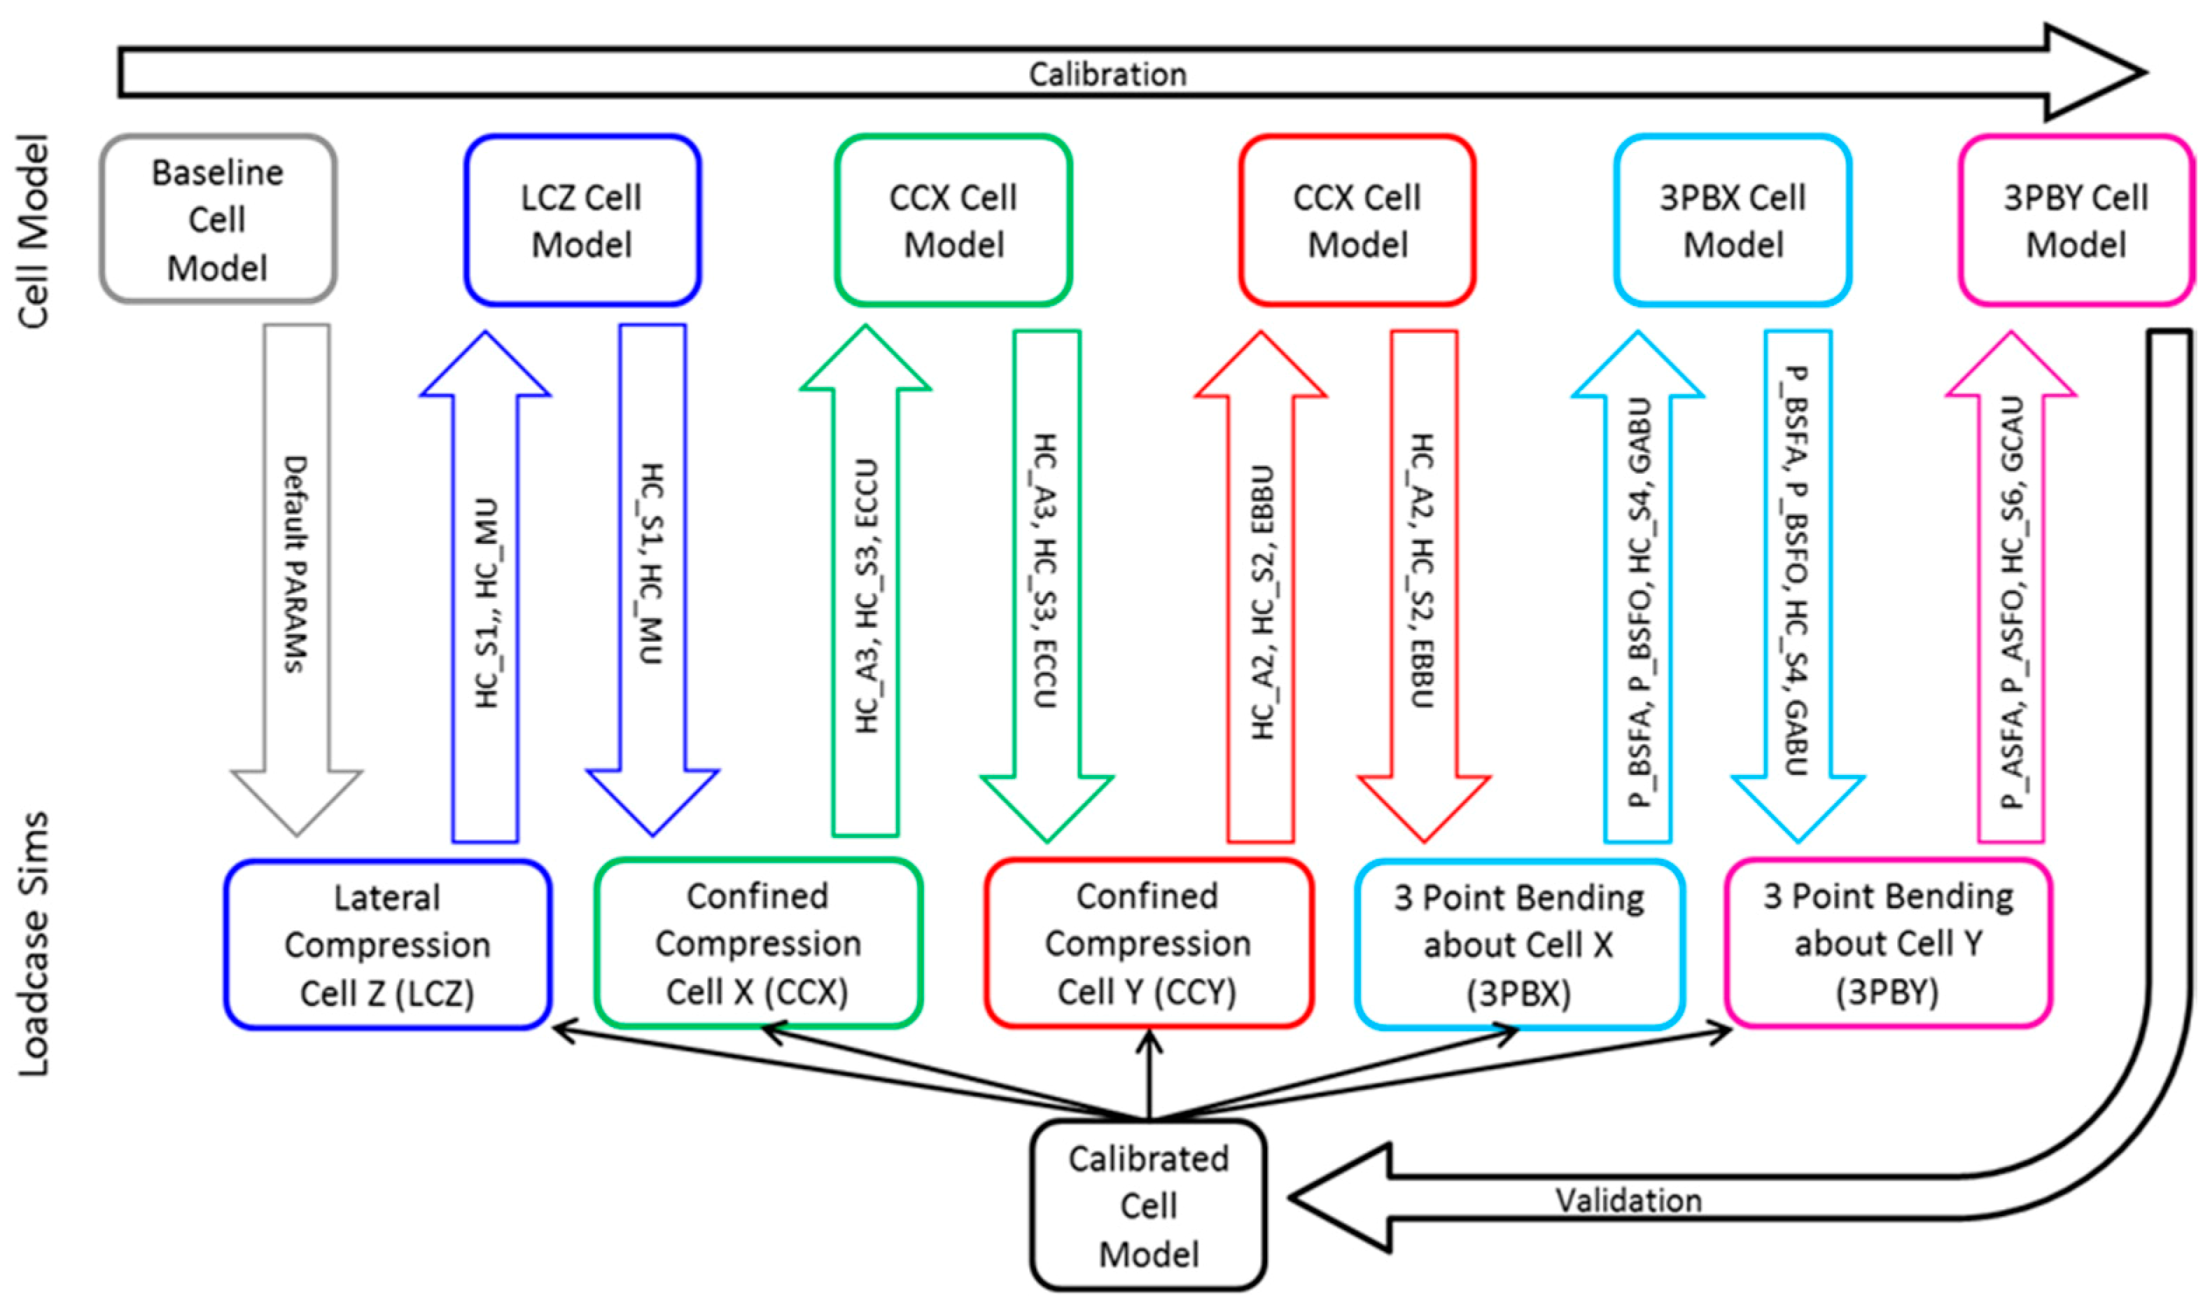
The pouch cell FE model includes many constitutive parameters and scale factors that could potentially be used as variables to modify the characteristics of the material models. Therefore, a parameter sensitivity study was conducted to identify the key parameters (shown in
Figure 3) which have the most significant effect on the force-displacement response for each load-case. The parameters and their abbreviations are described in
Table 2.
The following is a summary of the findings from the sensitivity analysis of the five load-cases:
- (a)
Lateral Compression Cell Z (LCZ): The ordinate scale factor (HC_S1) and interaction between HC_S1 & damping (HC_MU) contribute mostly to the residual sum of squares (RSS) error
- (b)
Confined compression cell X (CCX): The ordinate scale factor (HC_S3) and interaction between HC_A3 & HC_S3 contribute most significantly (95% confidence interval) to the RSS error
- (c)
Confined compression cell Y (CCY): As with the CCX load-case, the ordinate scale factor (HC_S2) and interaction between HC_A2 & HC_S2 contribute most significantly to the RSS error
- (d)
3 Point bending about cell X (3PBX): The scale factors and their interactions contribute most significantly (95% confidence interval) to the RSS error. The interactions have a higher effect than the main factors
- (e)
3 Point bending about cell Y (3PBY): The scale factors and their interactions contribute most significantly (95% confidence interval) to the RSS error. The main effects have a higher effect than interactions
The study showed that the load–displacement curve characteristics remain almost the same as the input variables and scale factors are changed. This implies that the model is insensitive to changes in these variables and factors and is therefore robust in terms of its predictions relative to these changes. When the main effects and interactions were determined in terms of the size of their effect and sensitivity, it was apparent that the scale factors were the main influential variables. Special attention is therefore required when assigning values to the scale factors. For the macro cell FE model to be valid for all five load cases, it is important that these key material model parameters are adjusted, to match the physical test results for each load-case in turn.
The order in which the load-cases are addressed (
Figure 3) is significant because some parameters e.g., the uncompressed elastic moduli (EBBU and ECCU) cannot be determined directly from the test data but influence both the confined compression and 3-point bending load-cases. The bending and flexural characteristics of the cell model must be matched to the physical cell bending tests by tuning the orthotropic shear stress-strain honeycomb material model characteristics and the tensile stress-strain fabric material model characteristics. Once all the parameters have been determined, a validation step, in which all the load-case models are solved again, is required to ensure that force-displacement outputs remained within the required limits.
4. Results and Discussion
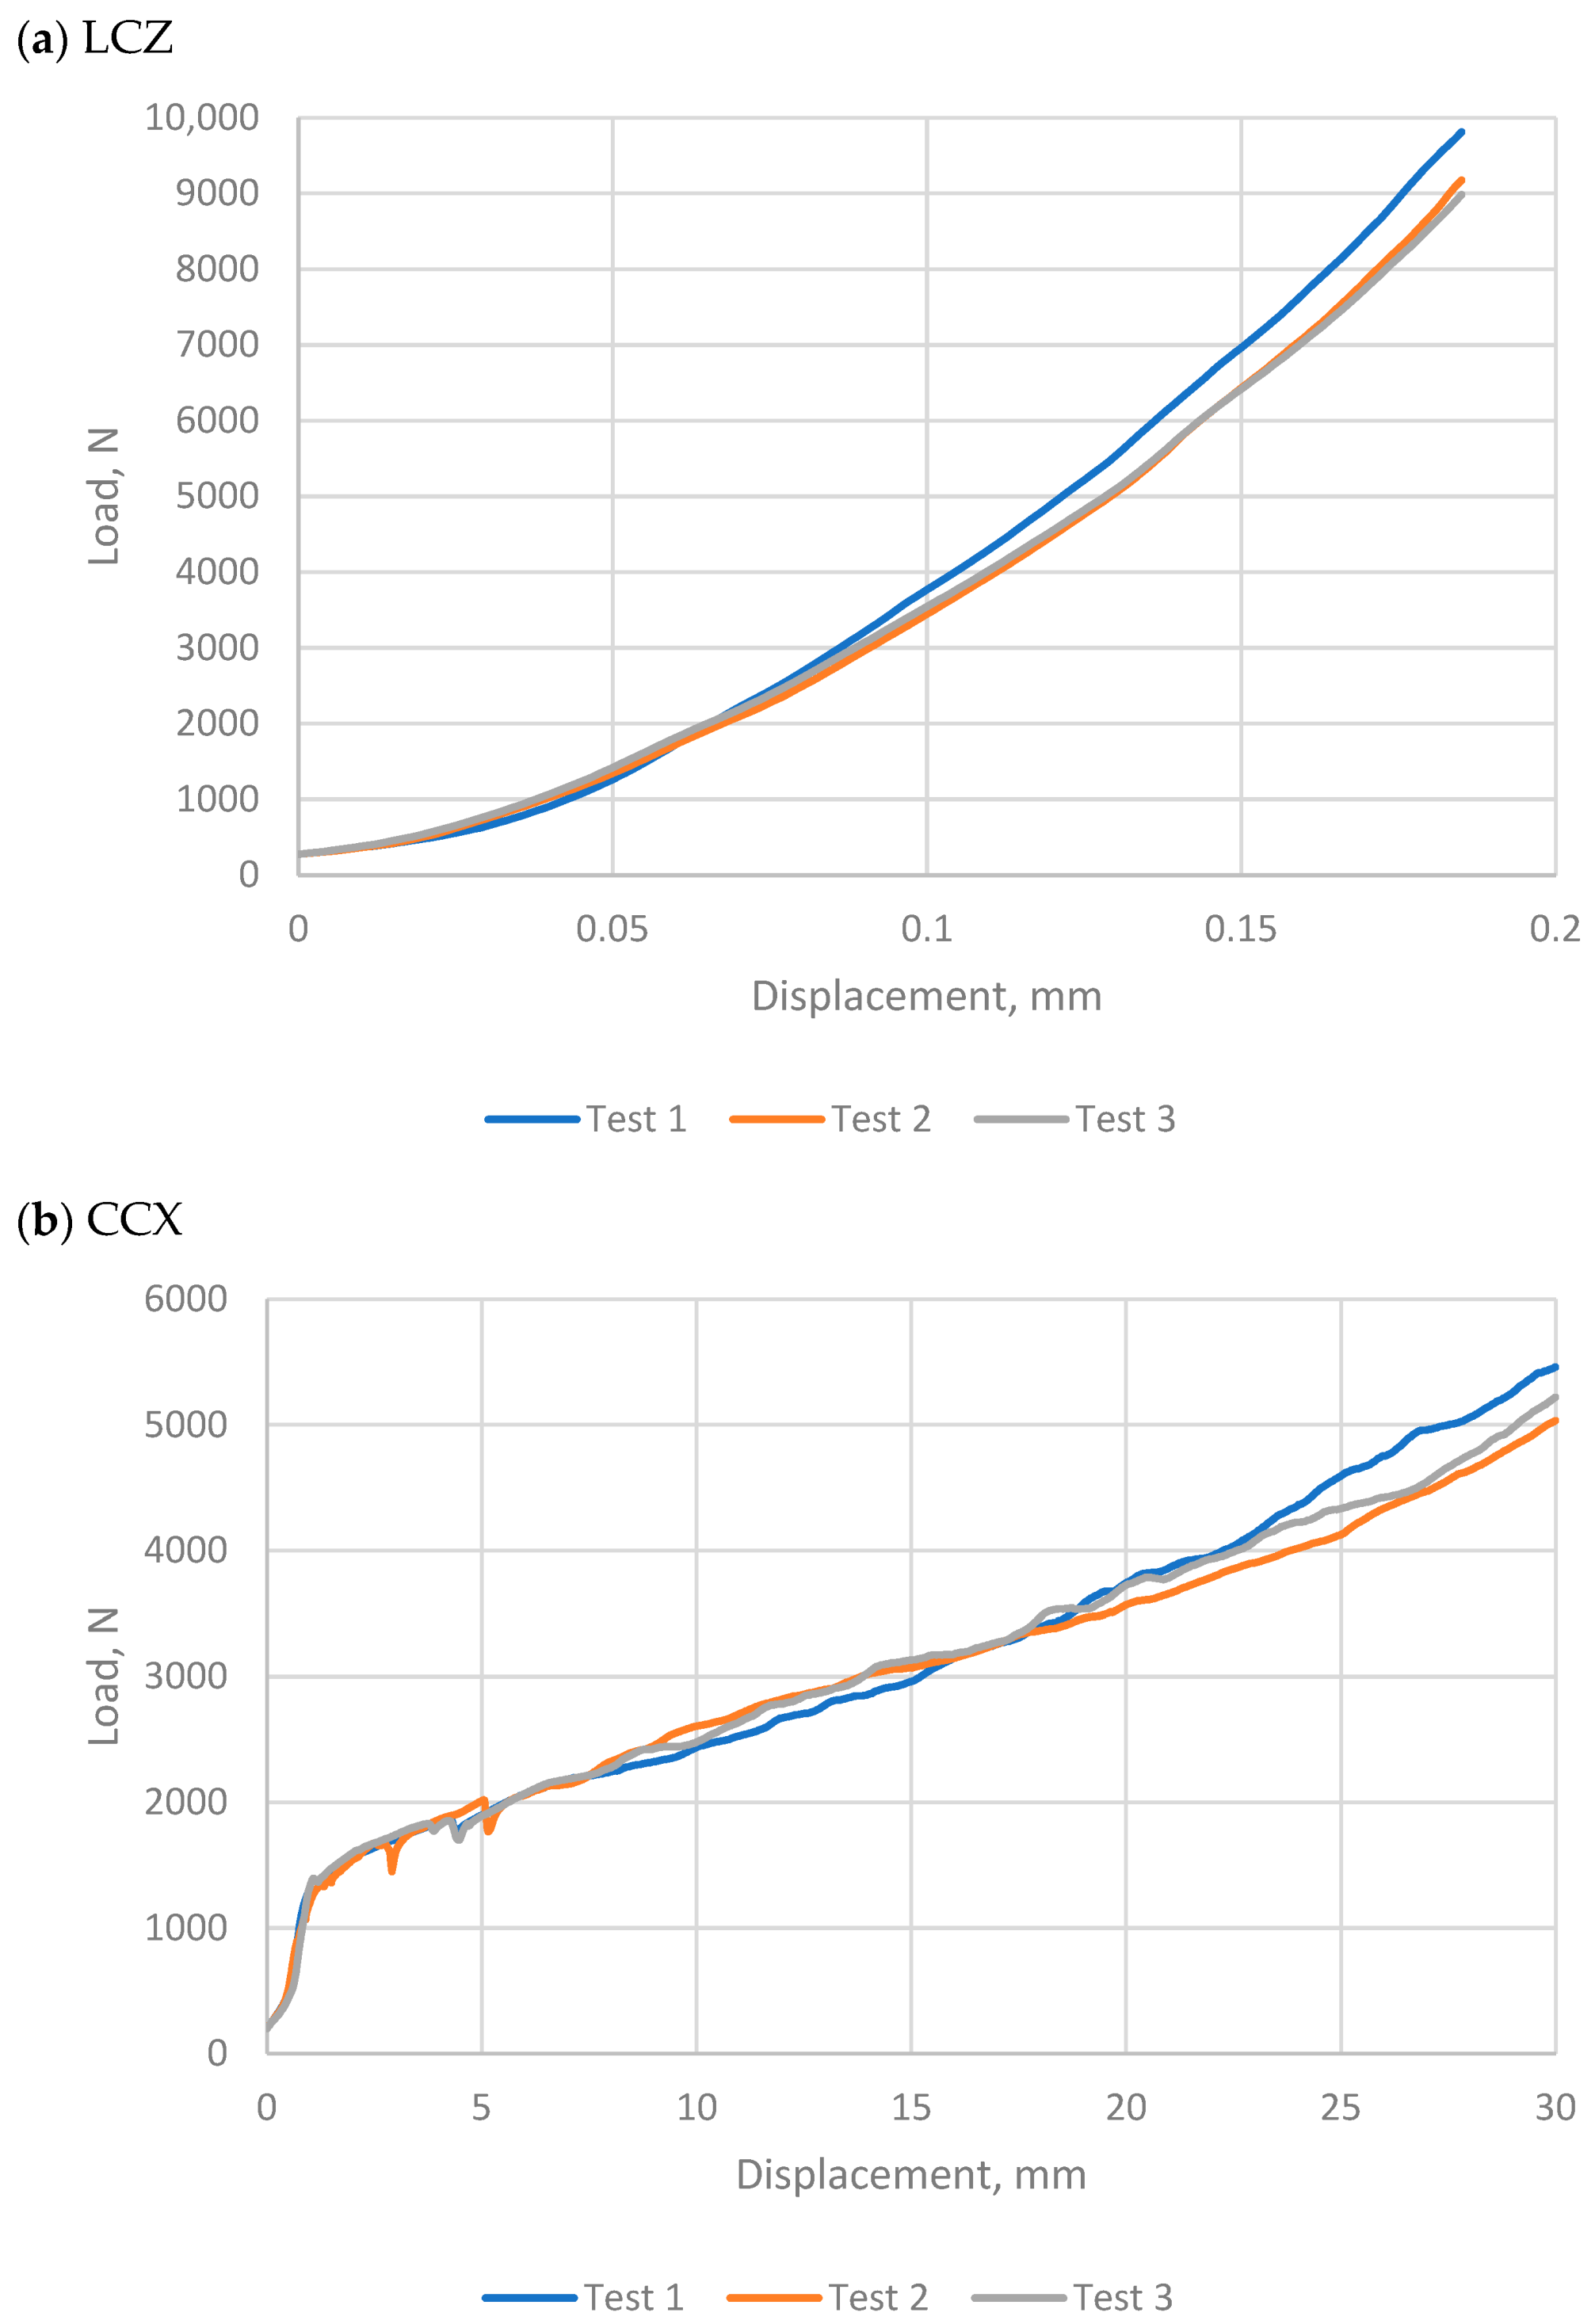
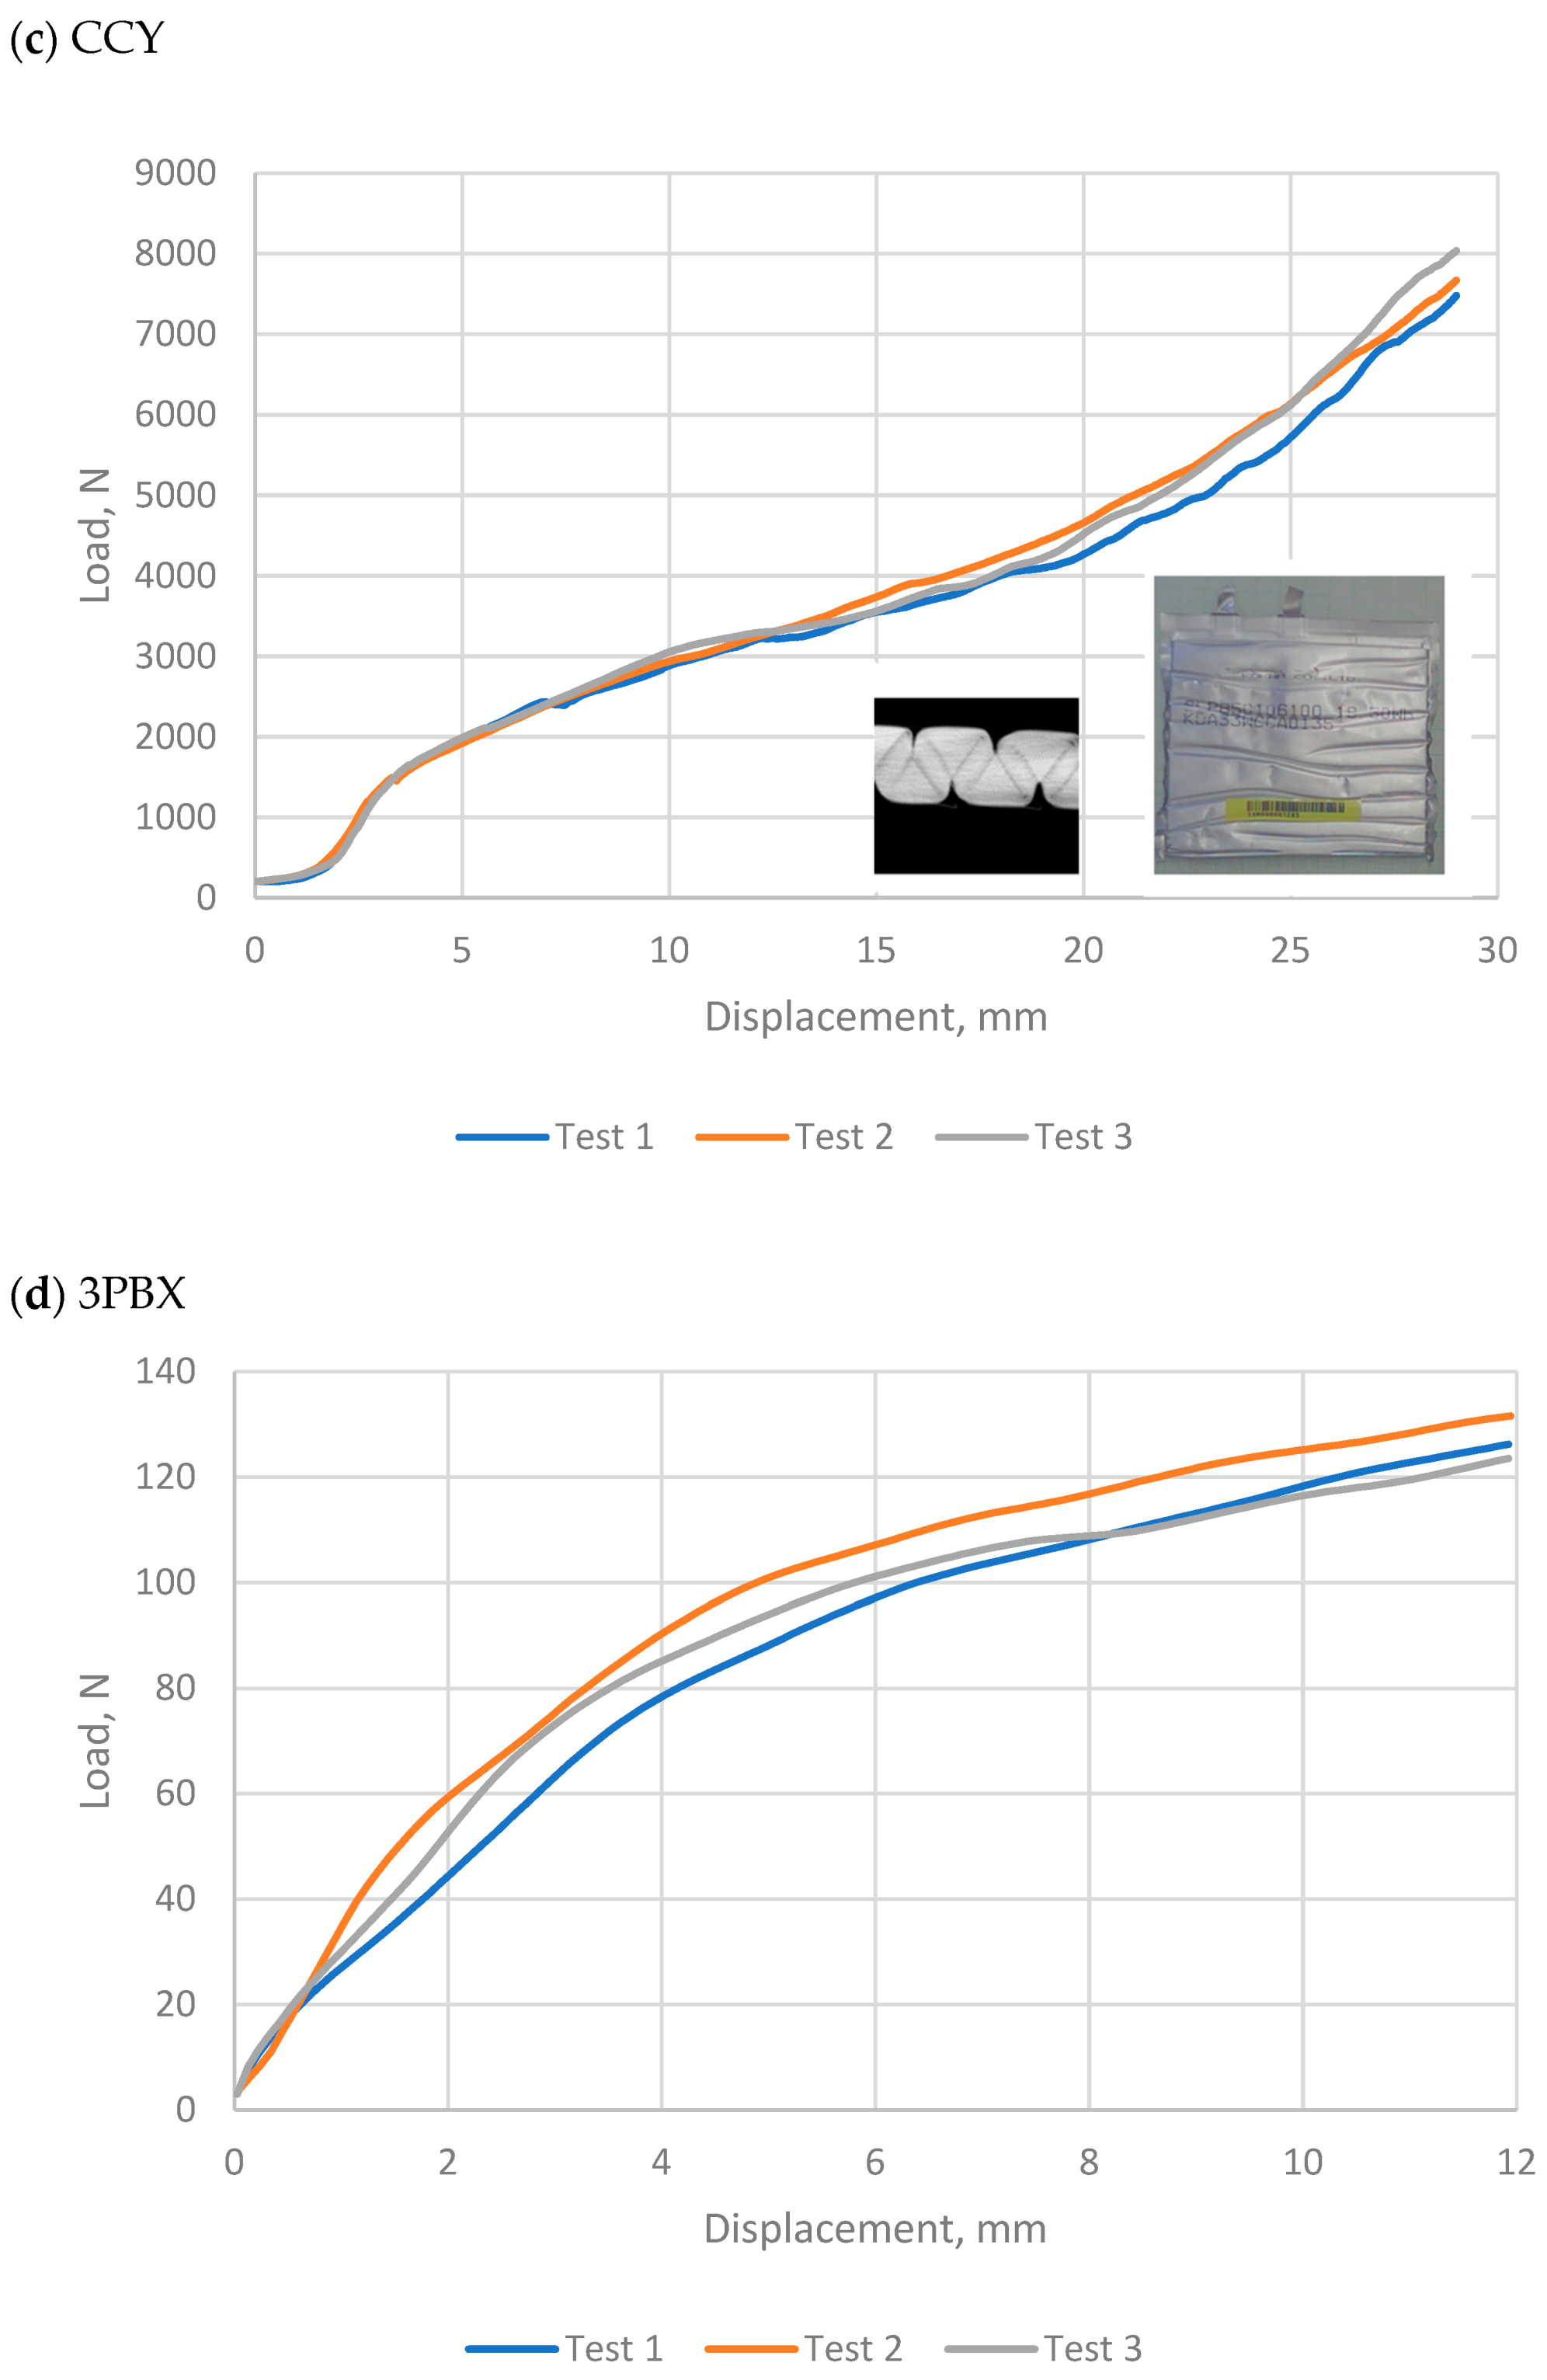
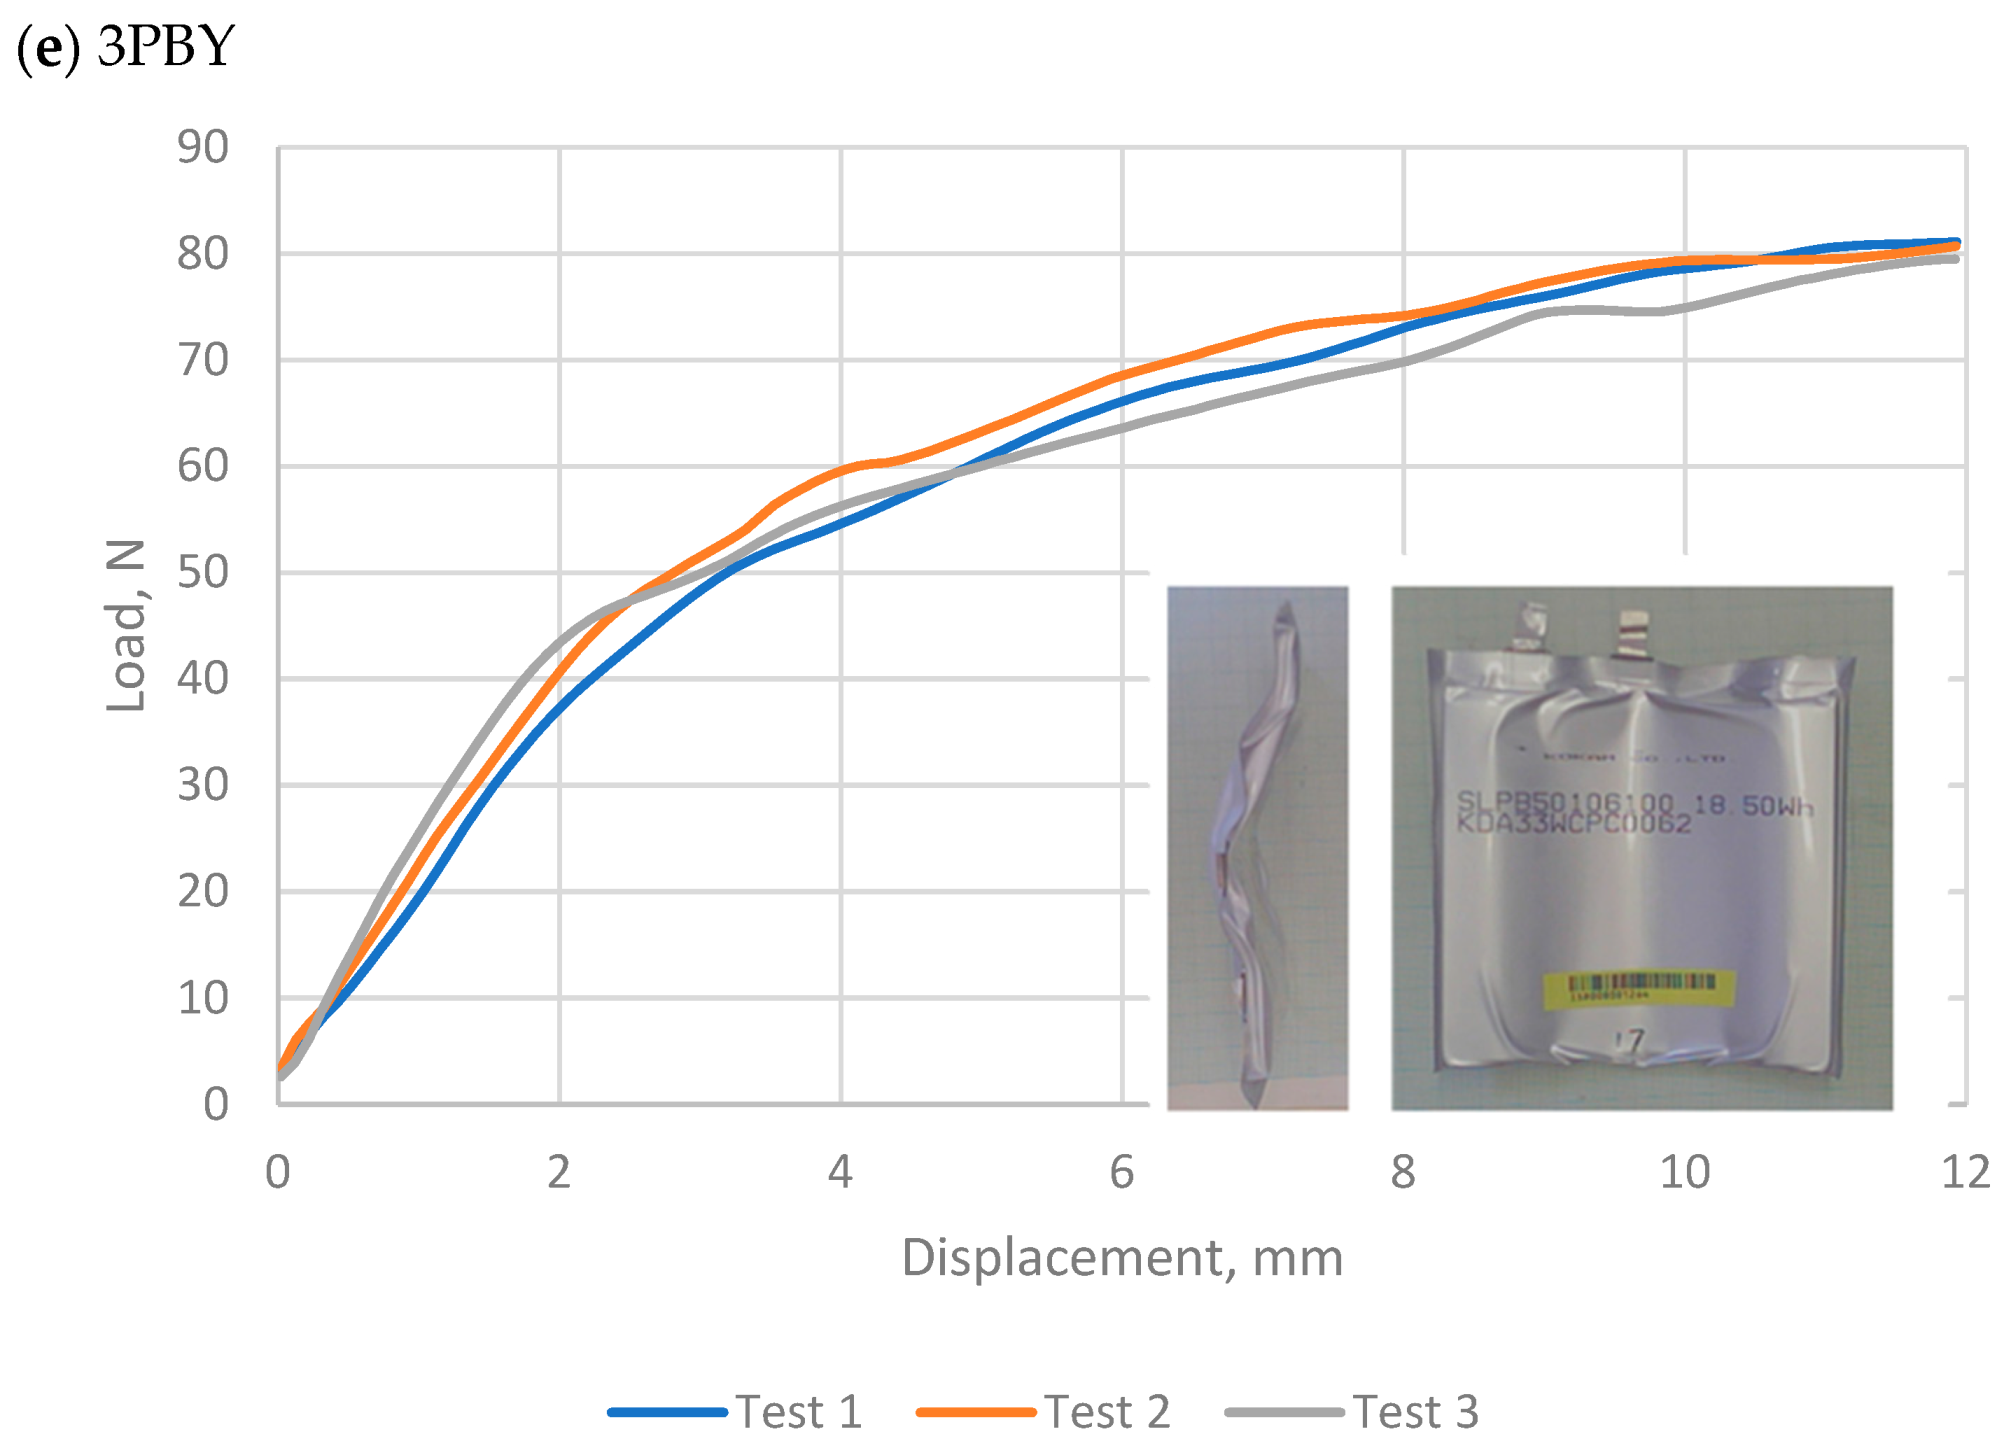
Typical load displacement curves for a pouch cell, in this case Dow Kokam SLPB5010600, deforming under each of the five load cases are shown
Figure 4.
The calibration parameters determined for each of the cell types tested are listed in
Table 2. The correlation function COR1 provides a measure of the degree to which the simulated curve matches the target curve. As can be seen from the table, the correlation is generally good being greater than 91% for all cell types and load cases. However, it can be observed that 3PB is the worst of all the load cases, probably due to the shear deformation which is the most difficult to define in the model.
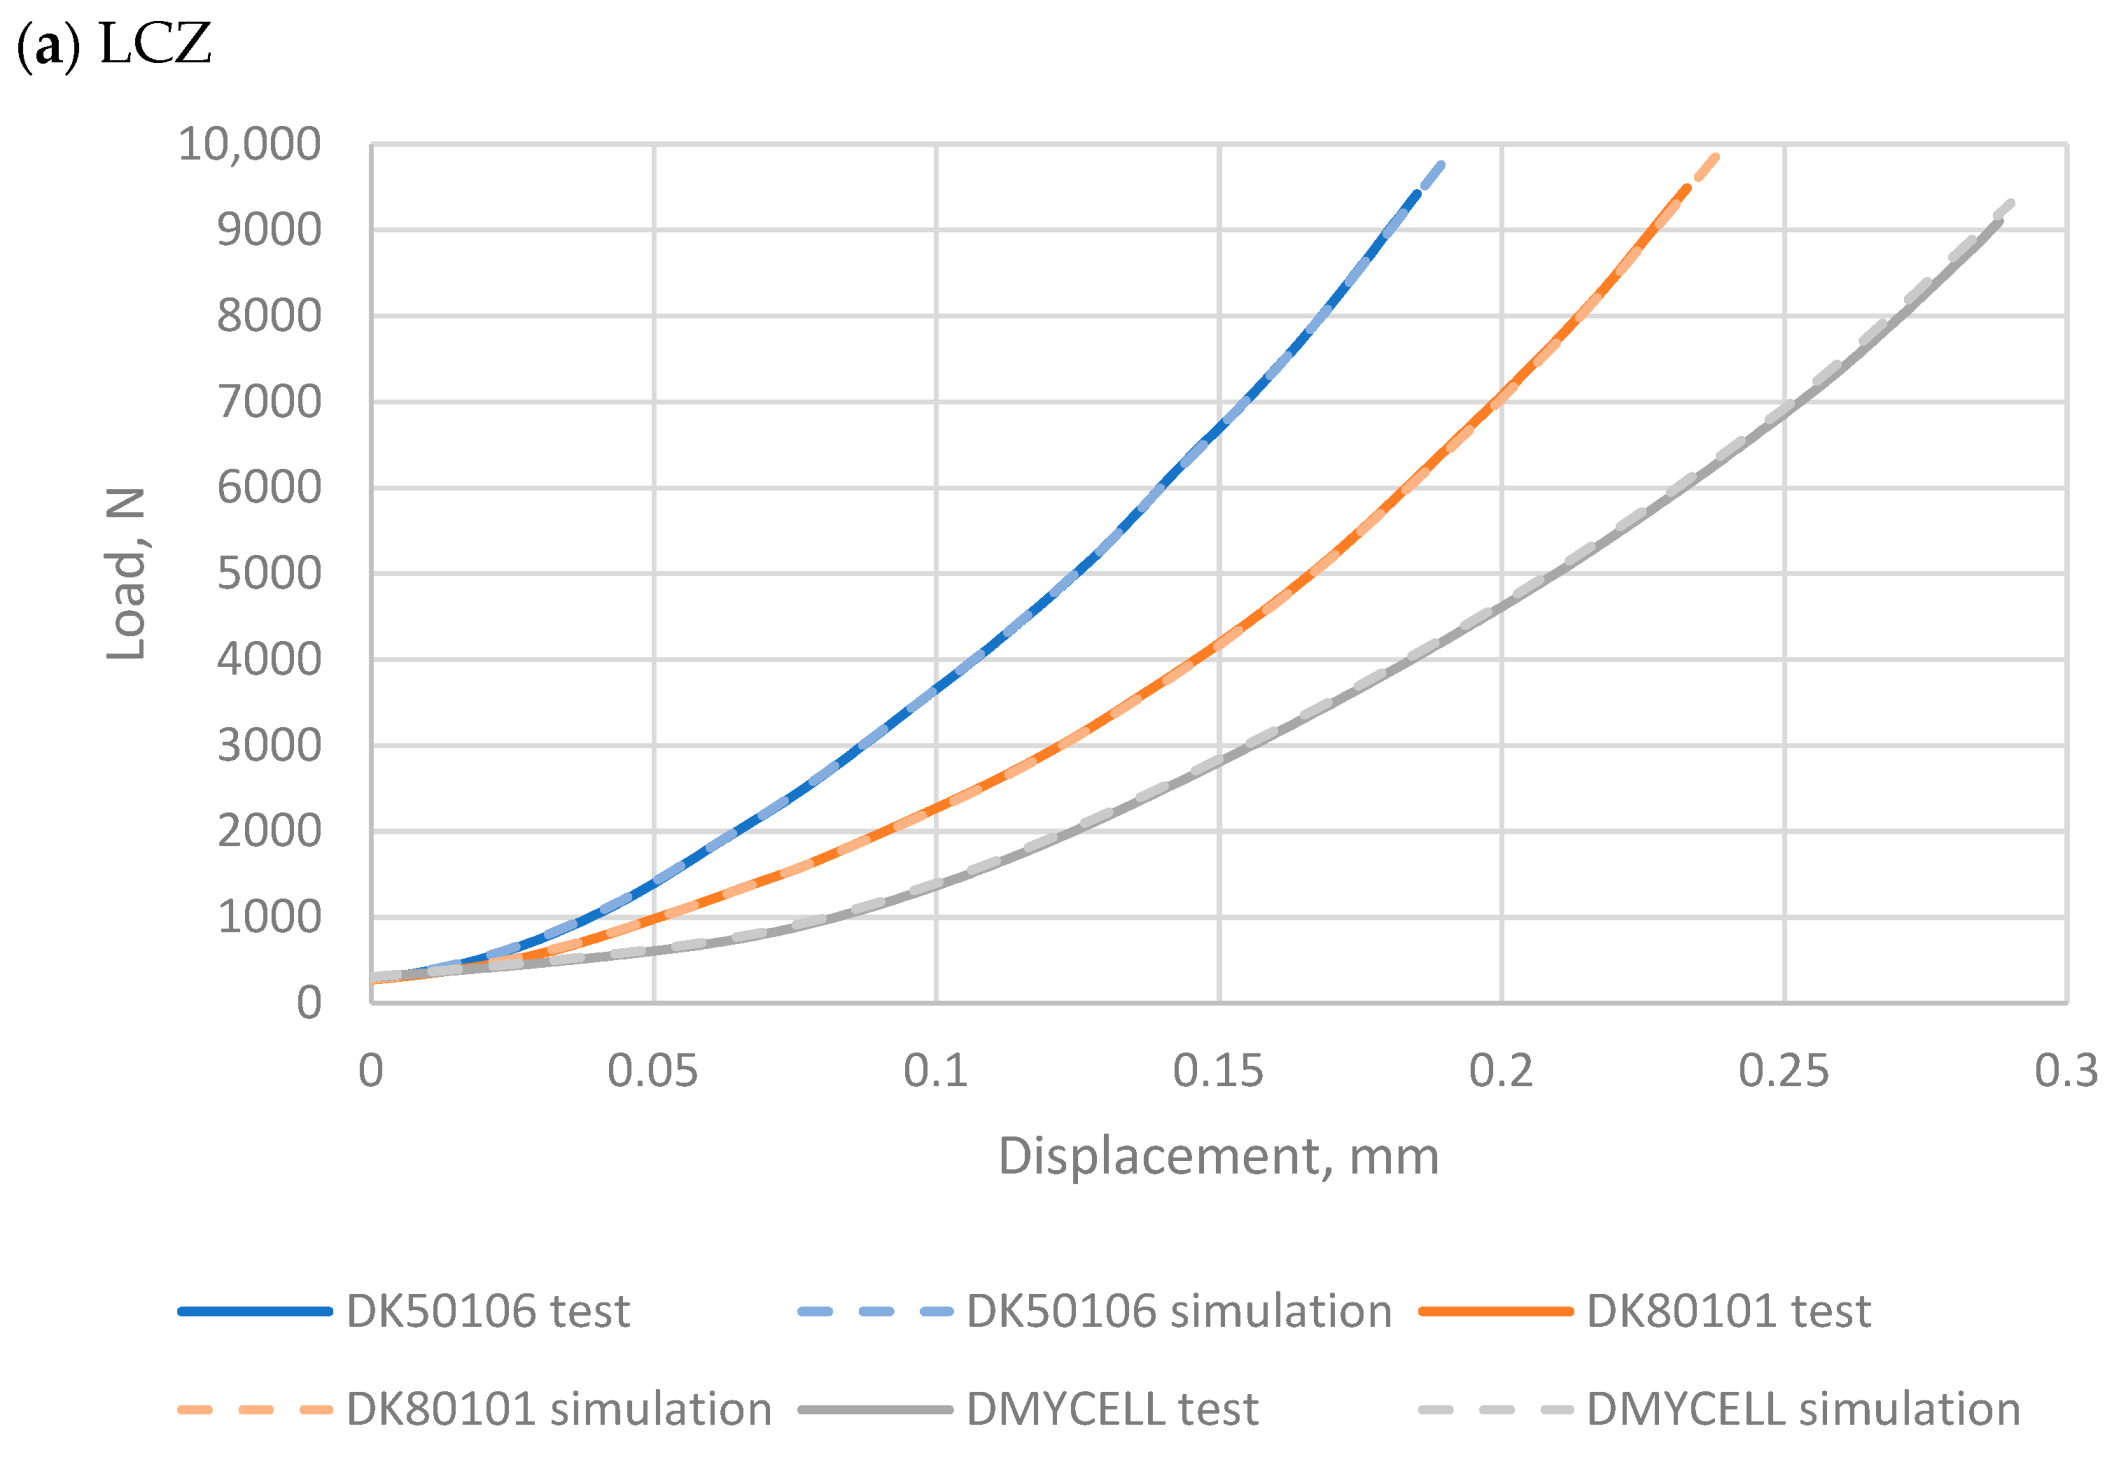
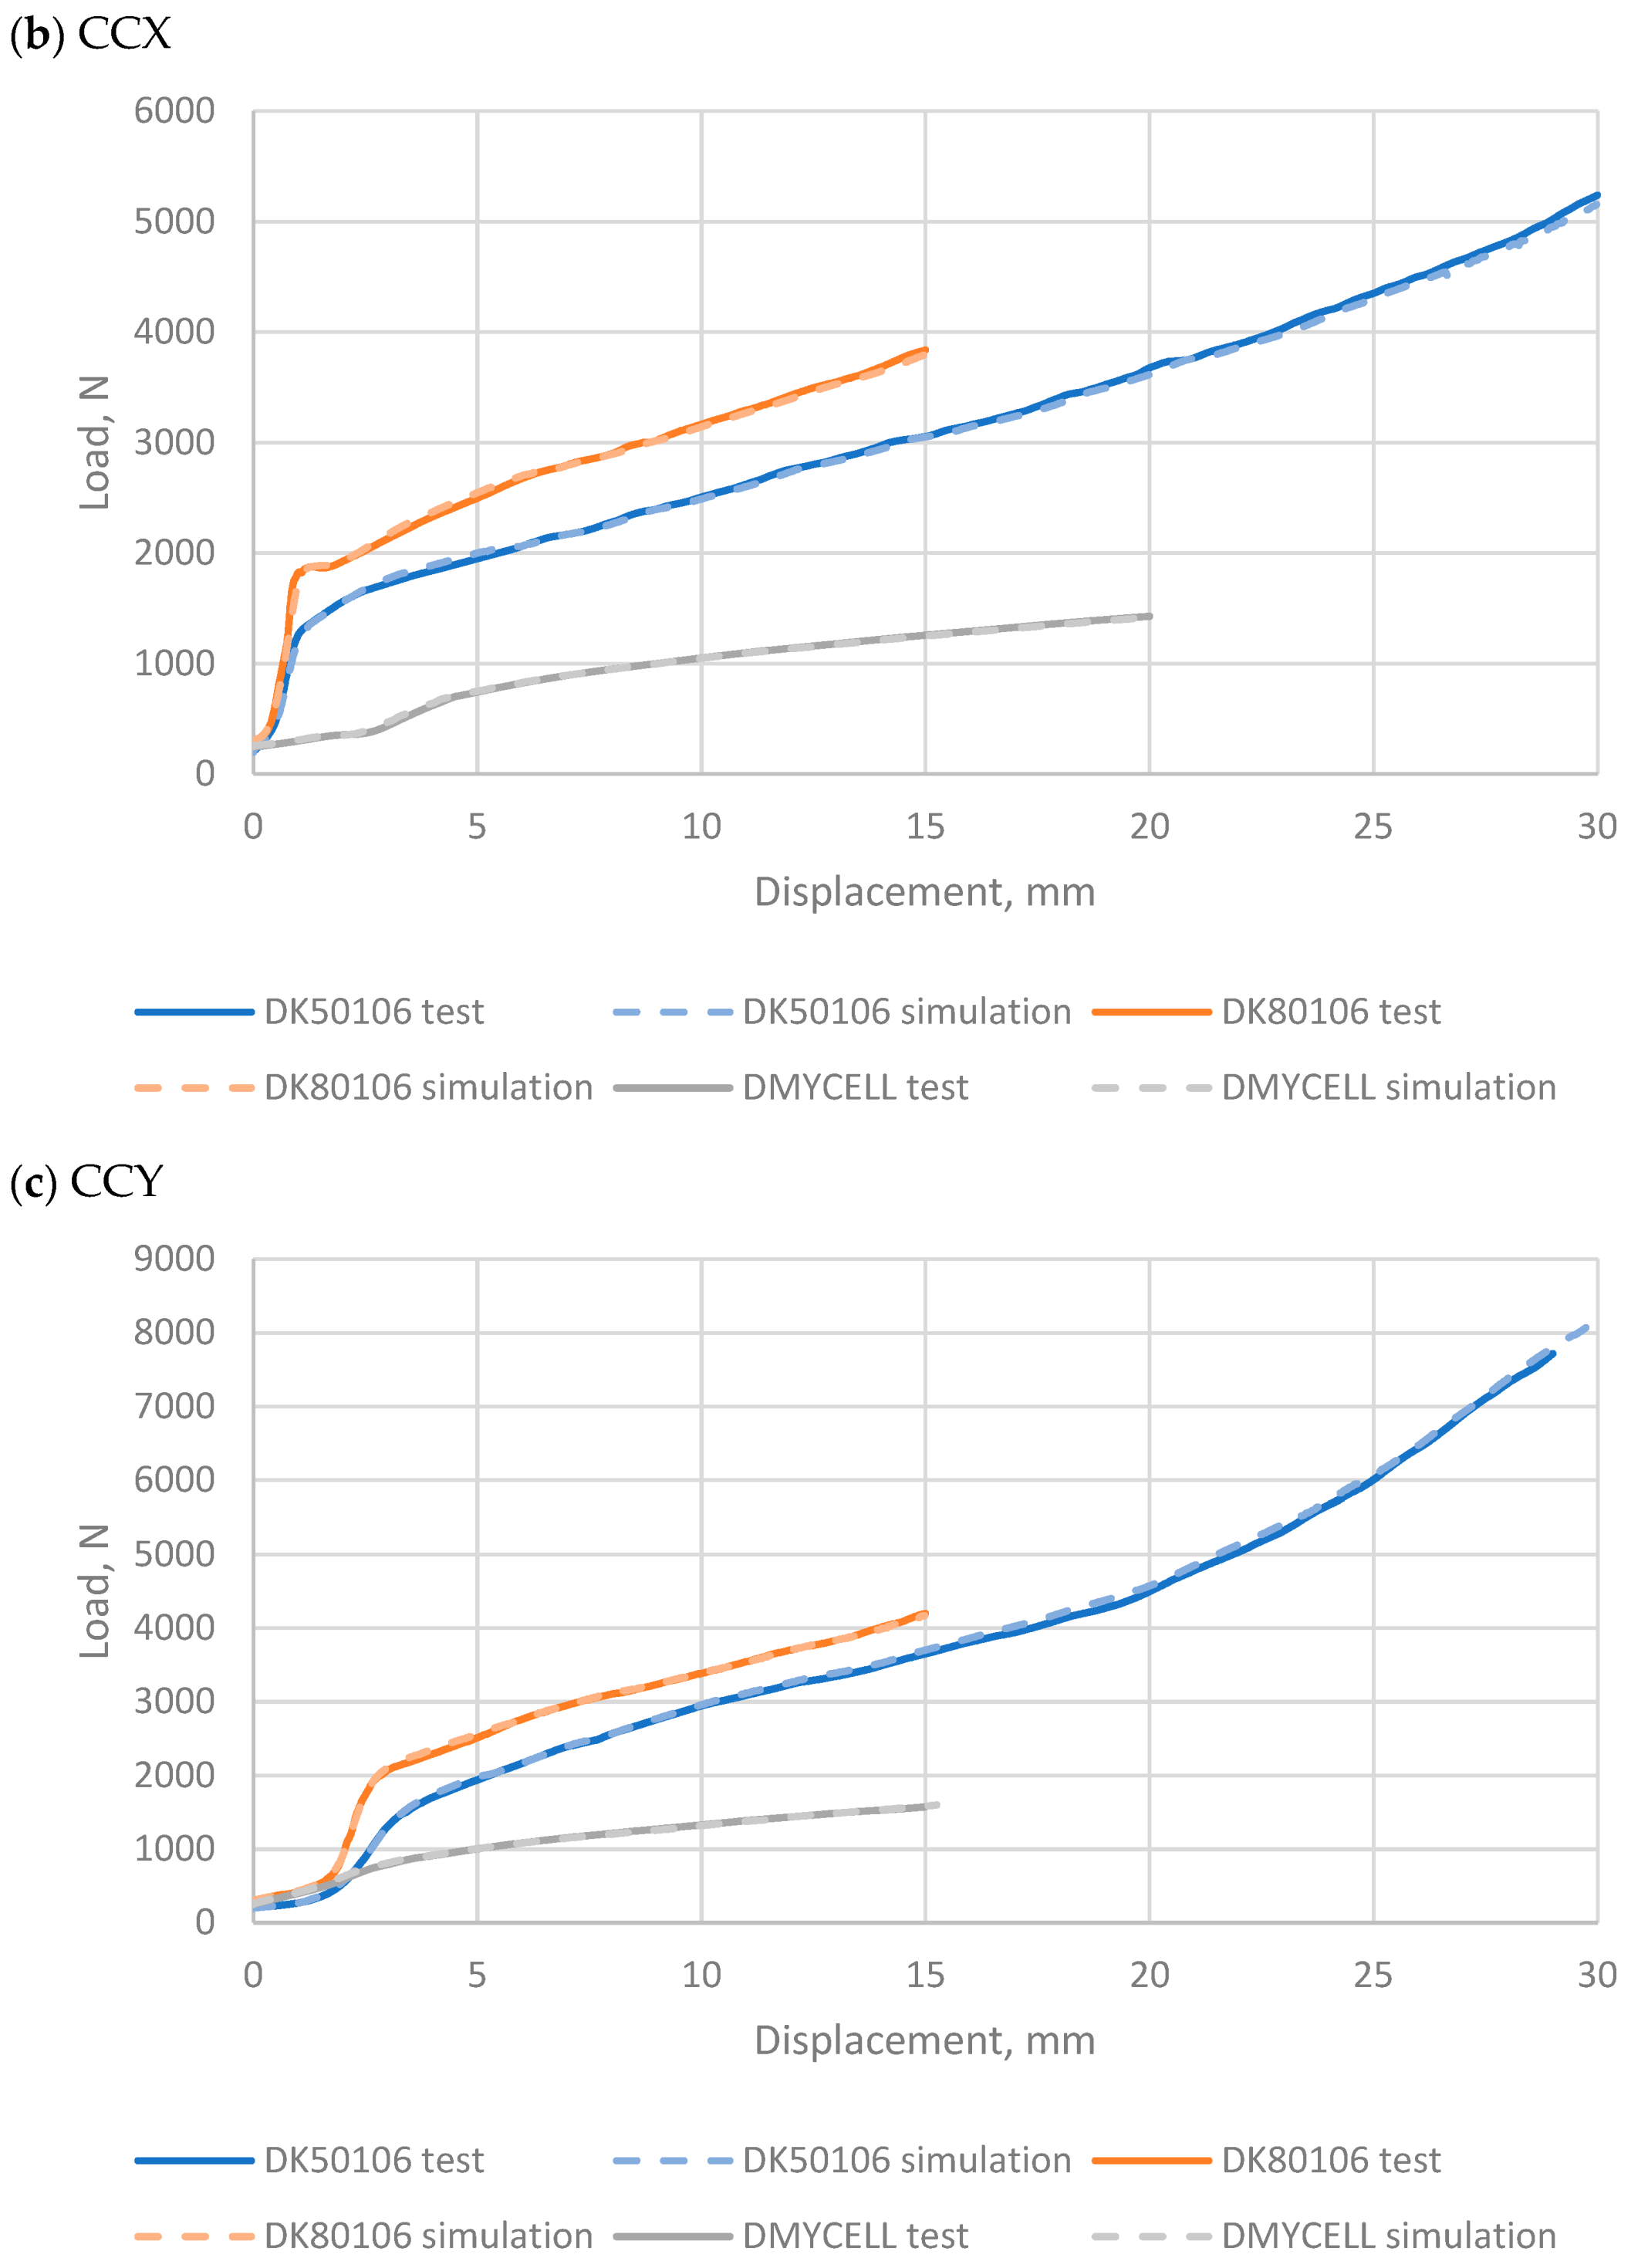
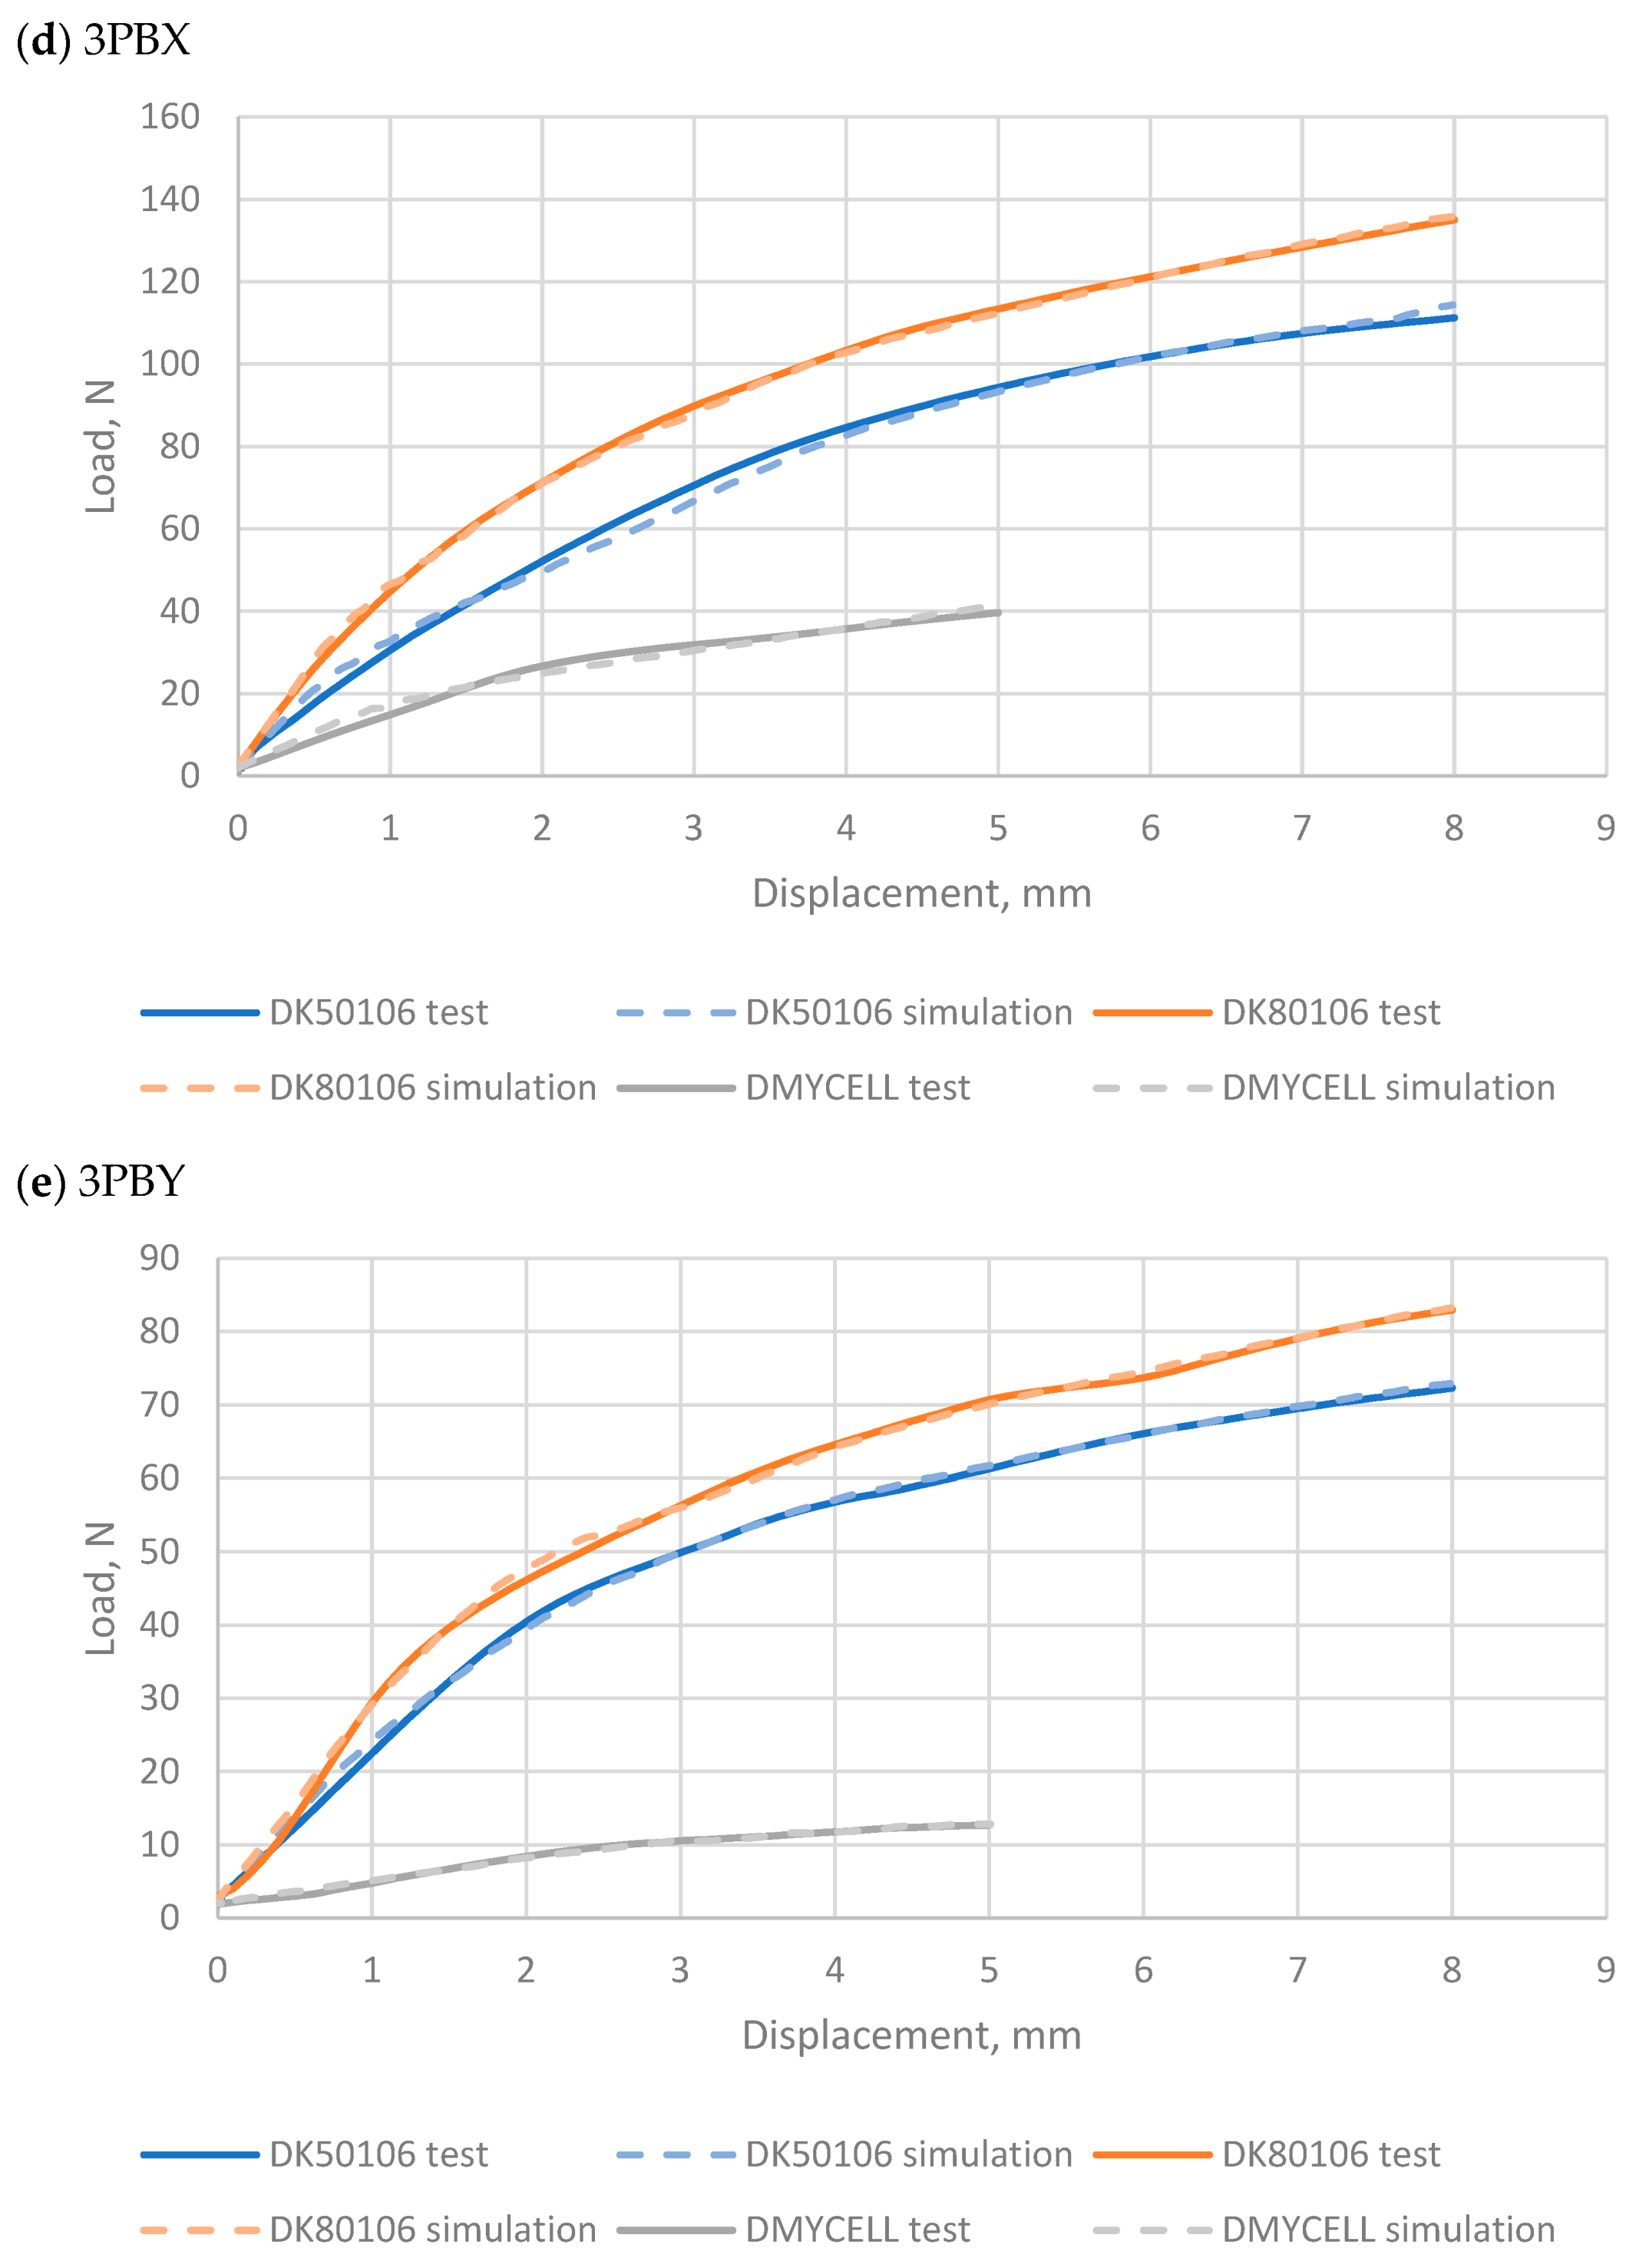
Figure 5 show the results of the calibration of the macro FE models for each of the cell types investigated compared to the average test data for all five load cases.
For each cell type and load-case considered the calibrated force-displacement response matched well with average physical test response, deviations from the average physical test response being contained within the boundaries of the measured test to test variation. The greatest variation was found in the yielding/onset of buckling in confined compression load case.
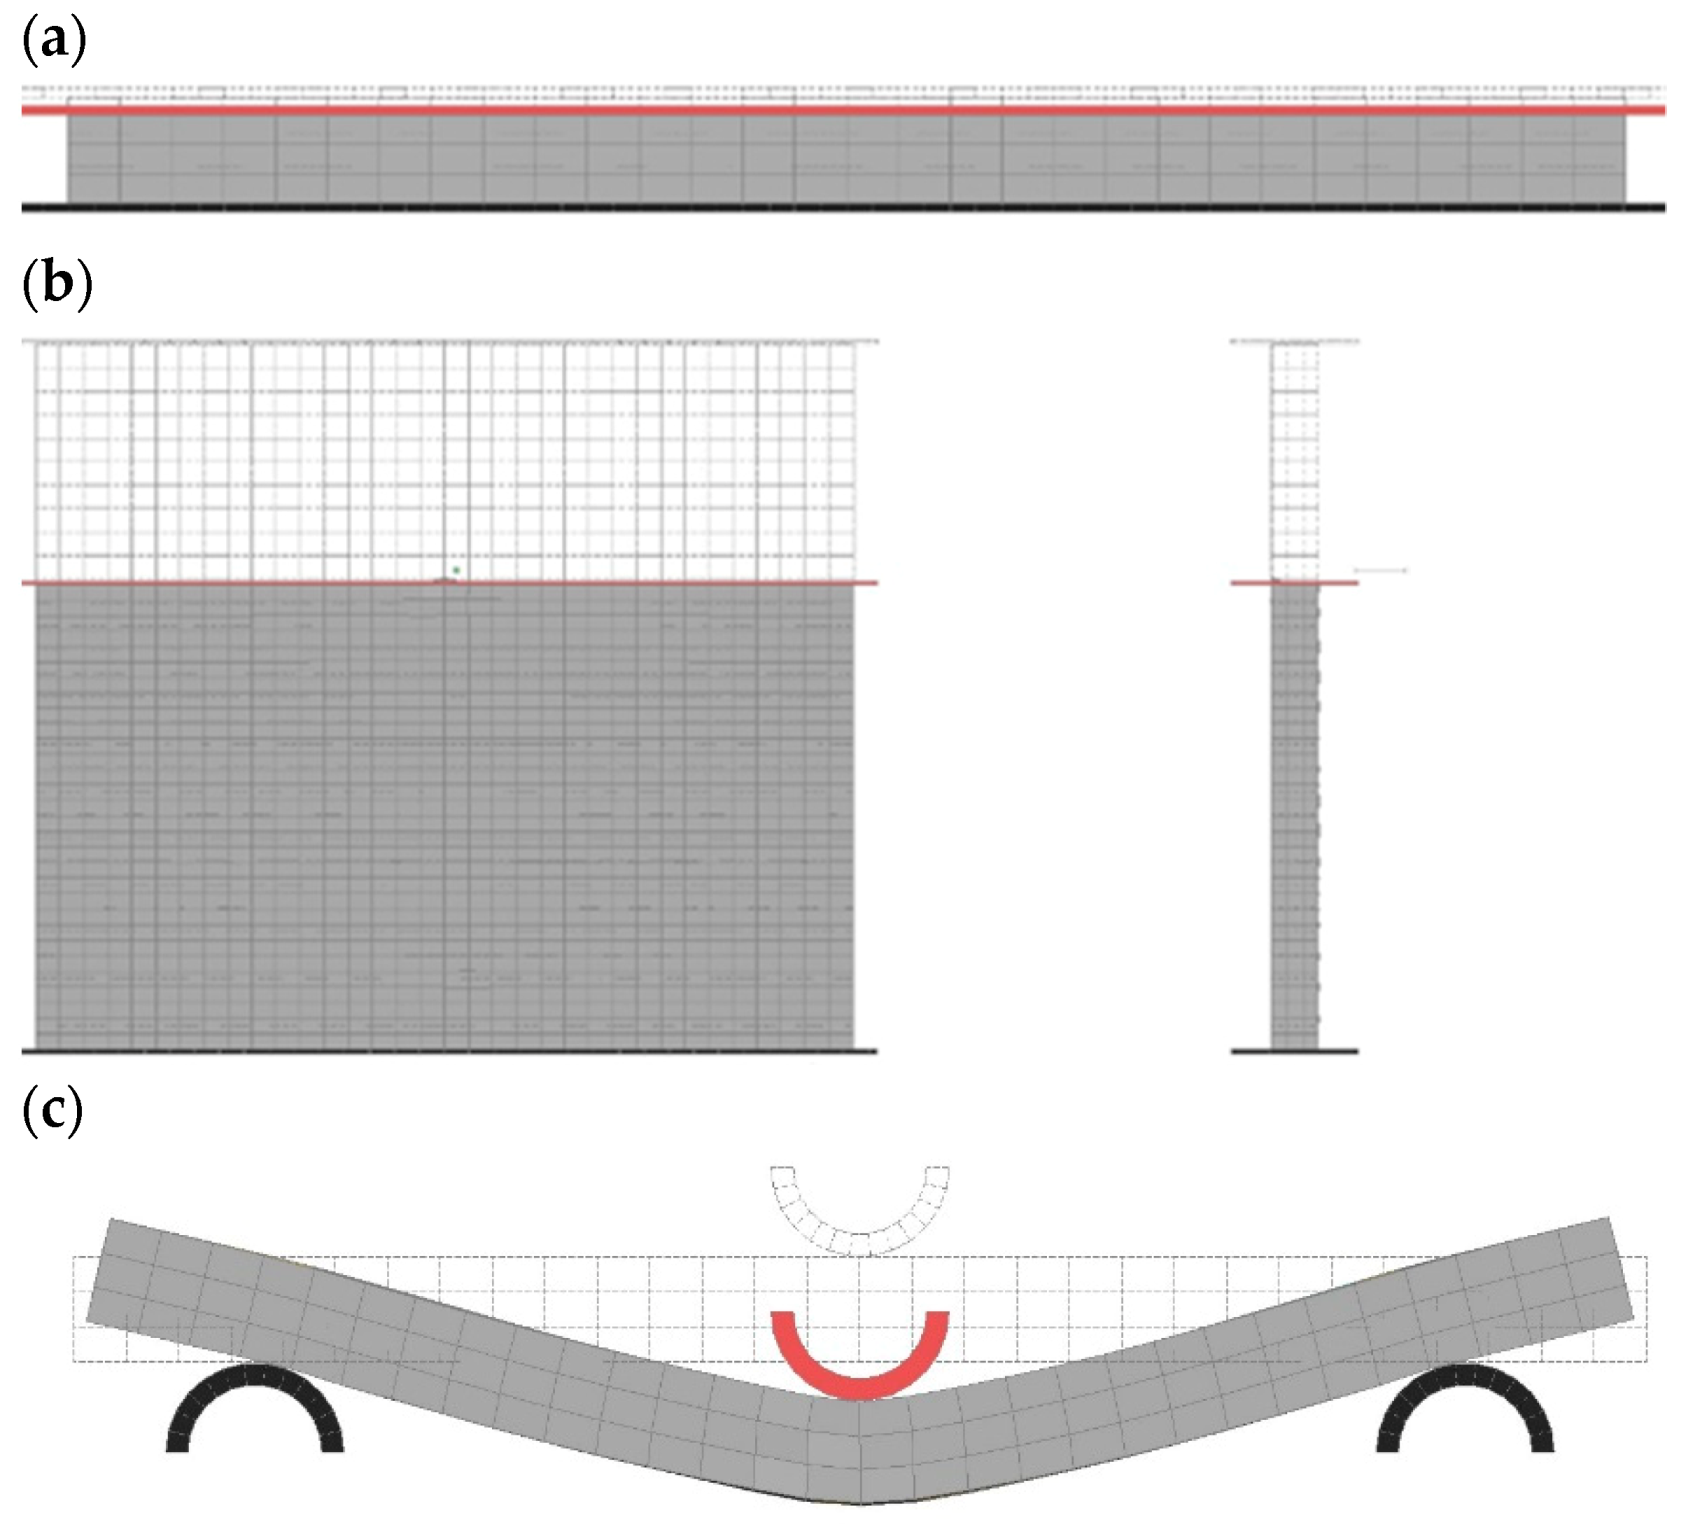
Figure 6 shows the FEM model of the Dow Kokam SLPB 50106100 cell subject to the three main load cases of lateral compression, in-plane confined compression and three-point bend. The original and deformed meshes are visible, demonstrating the stability of the model.
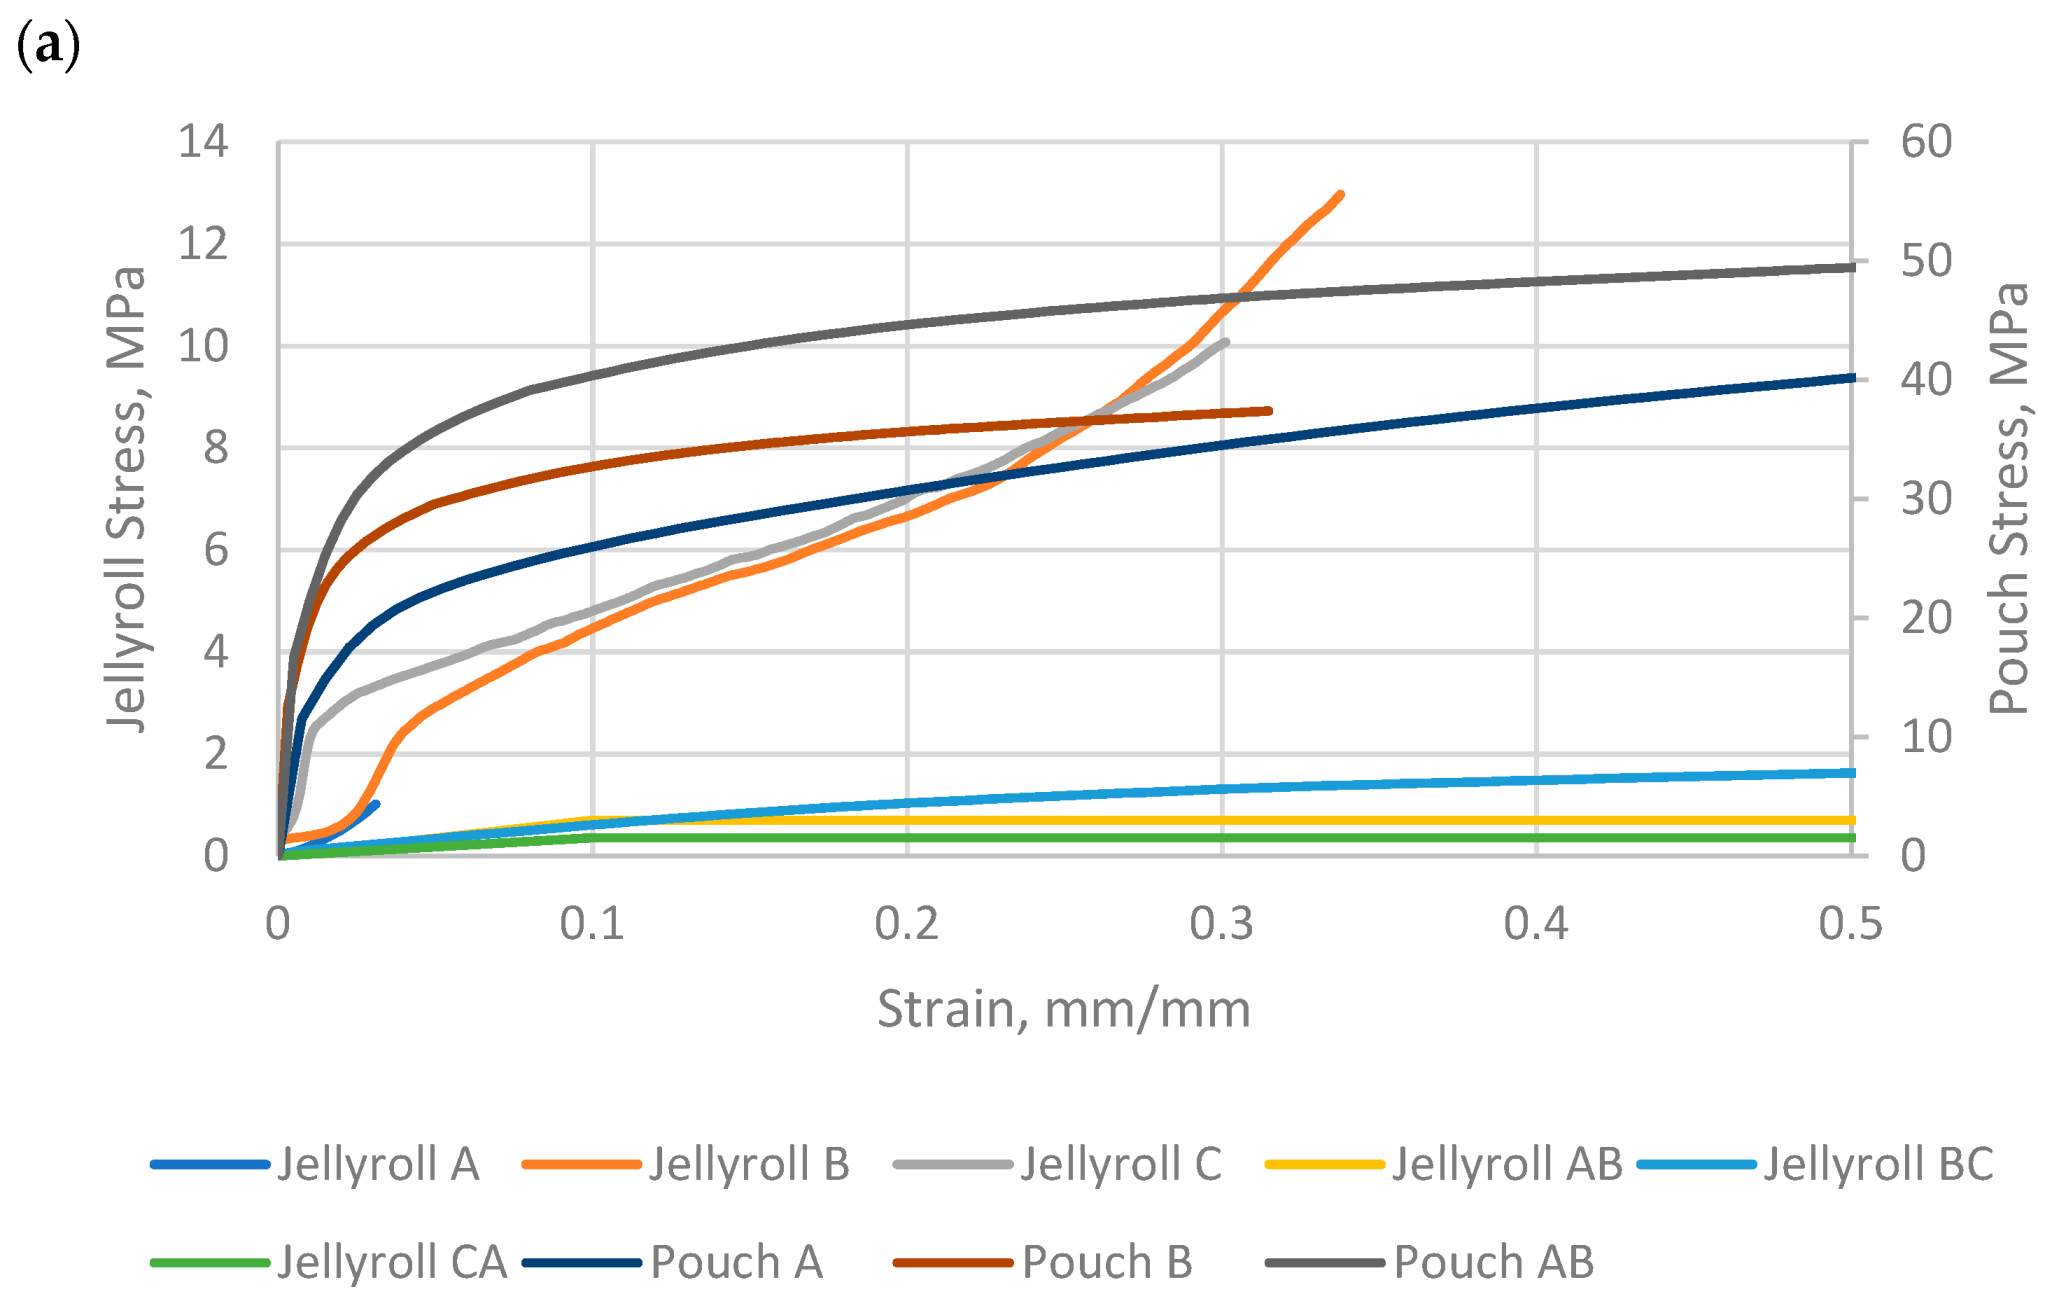
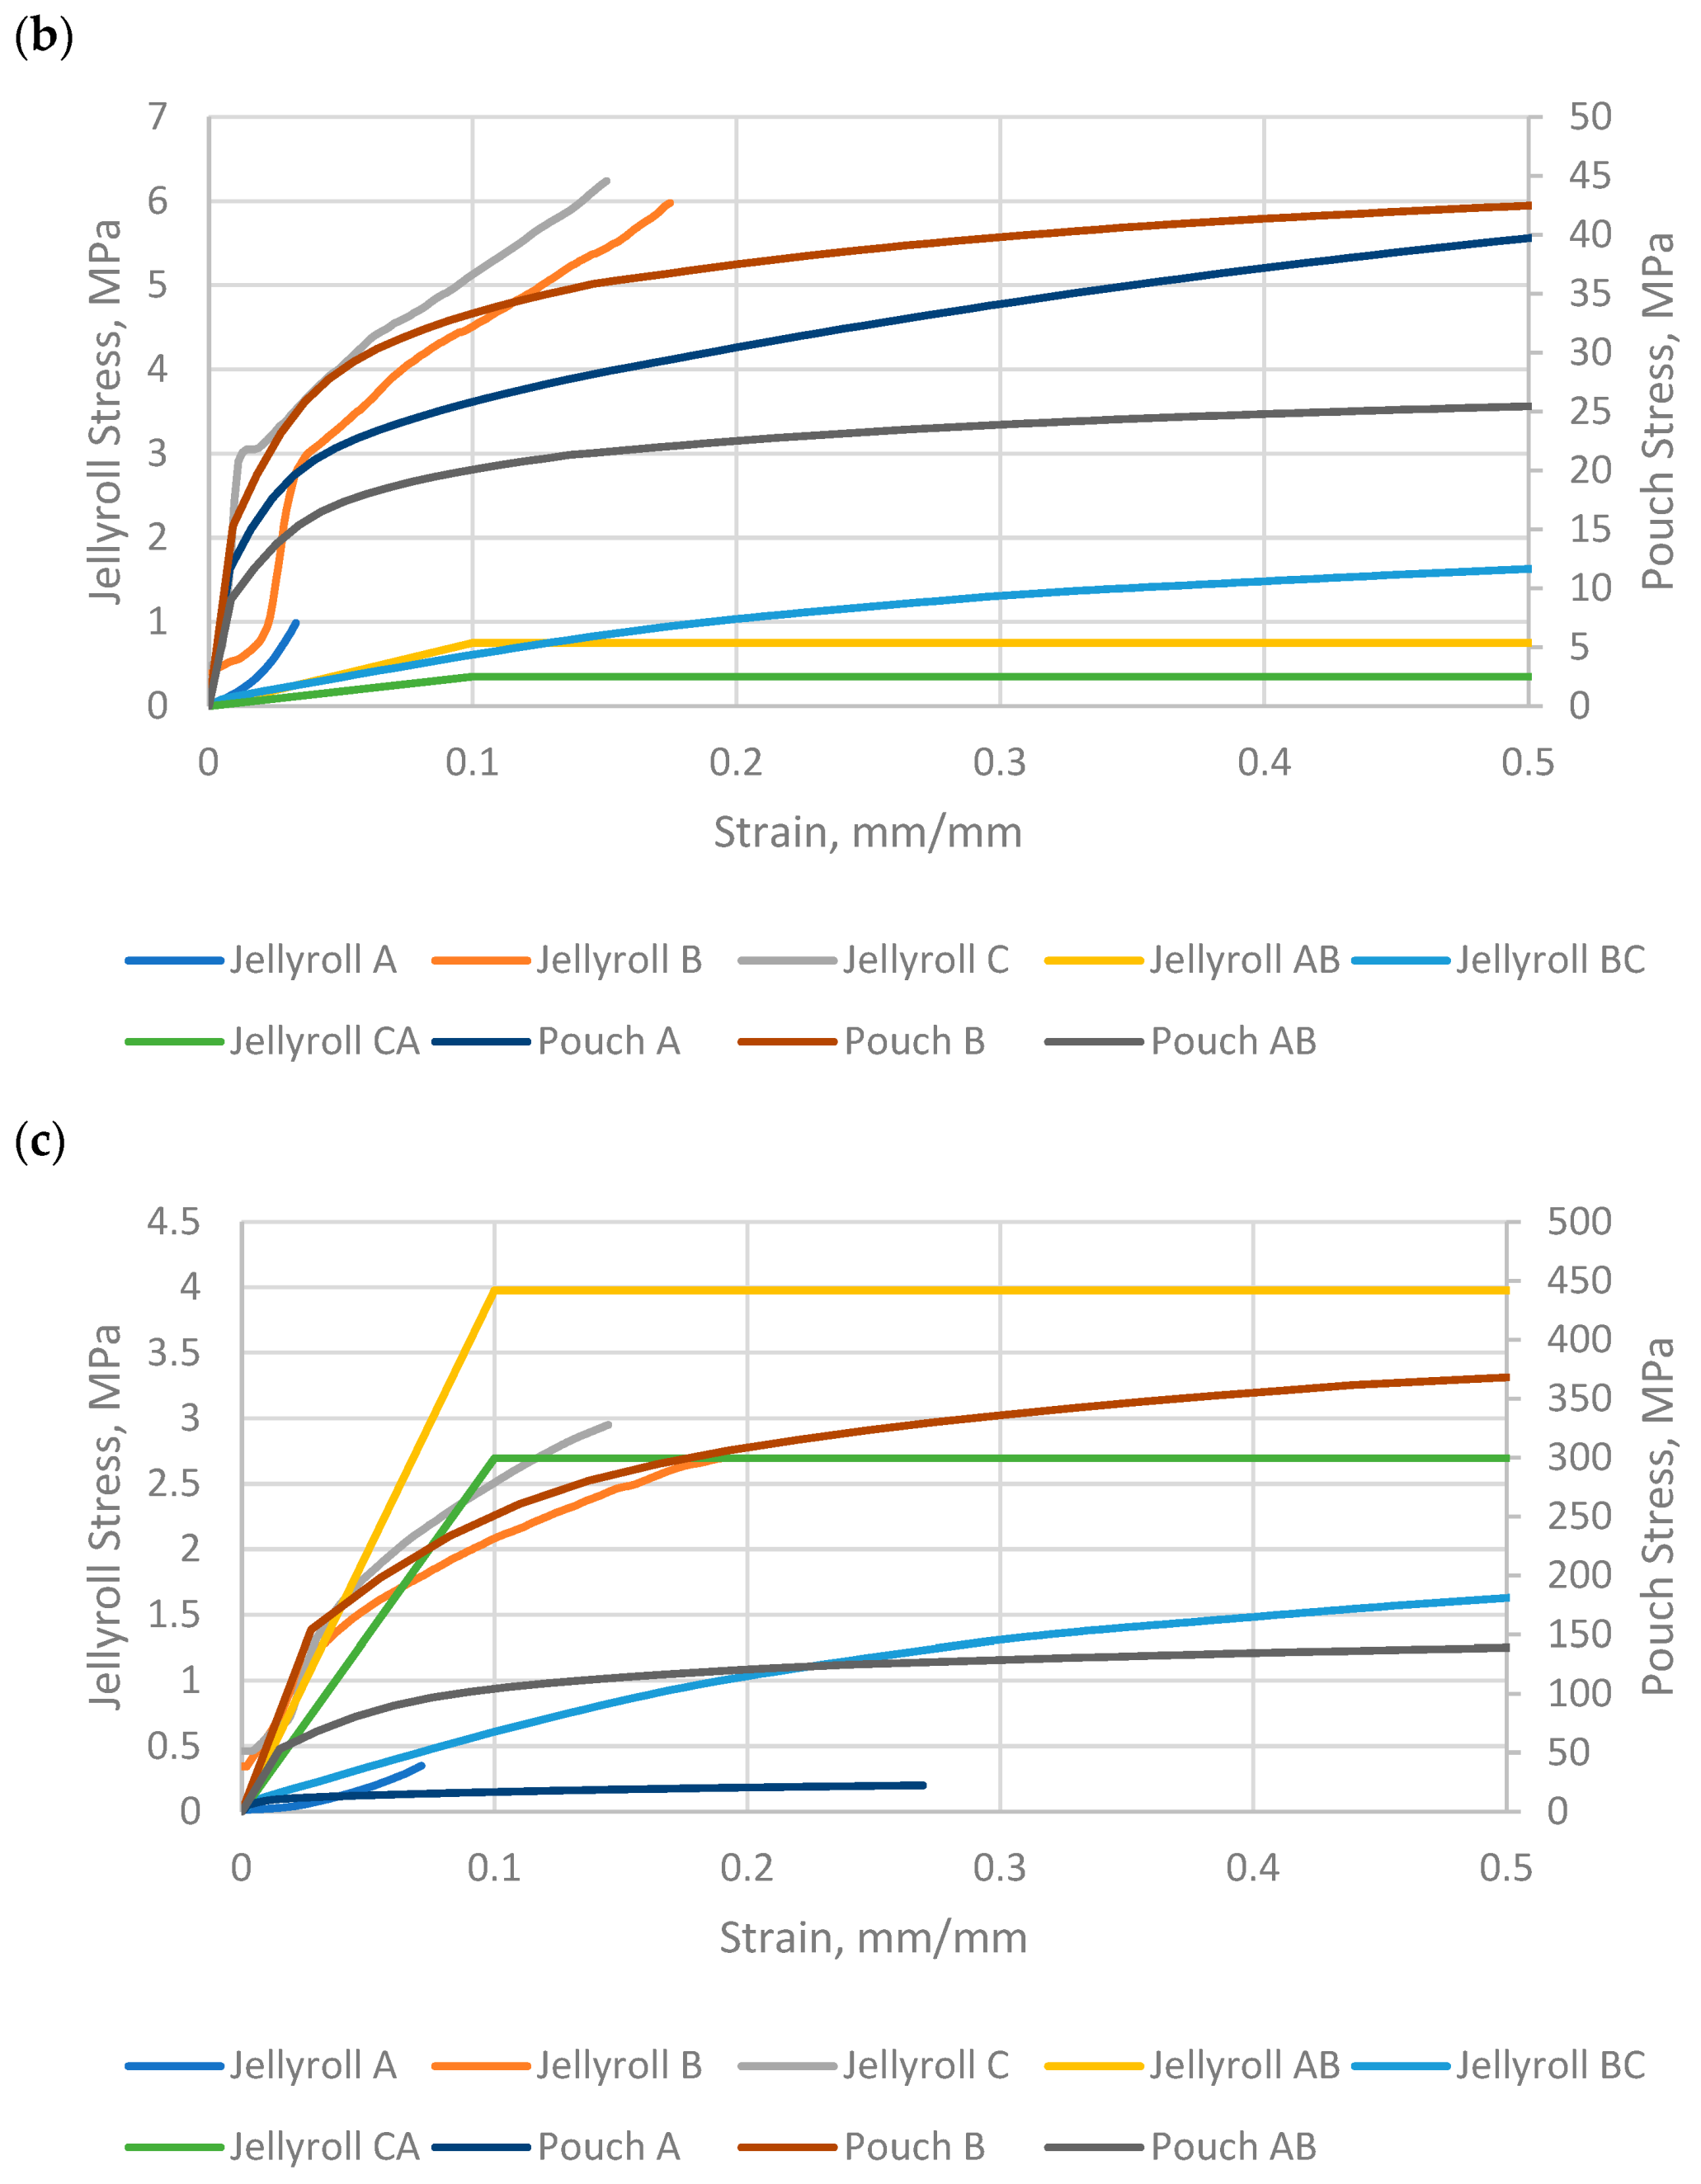
The fitted stress-strain curves for the jellyroll and pouch of all three cells can be seen in
Figure 7. The through thickness flow curve, Jellyroll A, is limited by the capacity of the test equipment. The dummy cell has substantially stiffer jellyroll shear and pouch tensile flow curves than the two live cells, while the in-plane compressive jellyroll flow curves, B and C, are substantially softer. It is not clear if this is a result of the inert and uncharged nature of the cells, or material or geometric phenomena.
4.1. Scalability
4.1.1. Geometry and Construction
The scalability of Pouch Cell Macro FE Model in terms of geometry and construction, has been demonstrated through the ability to successfully calibrate-to-test models, for all the cells investigated, for all load cases including the large format dummy cells (
Figure 5). The dummy cell is thinner, wider and longer than the Dow Kokam 5 Ah cell and approximately 2.5 times the area, resulting in significantly different initial stress vs strain responses.
4.1.2. Multiple Cells
To assess the ability of calibrated cell macro FEMs to predict the structural performance of multiple cells, stacks of two and three cells were tested in each of the five load cases previously described. It had been anticipated that the behaviour of multiple cells would be effectively a summation of the behaviour of single cells.
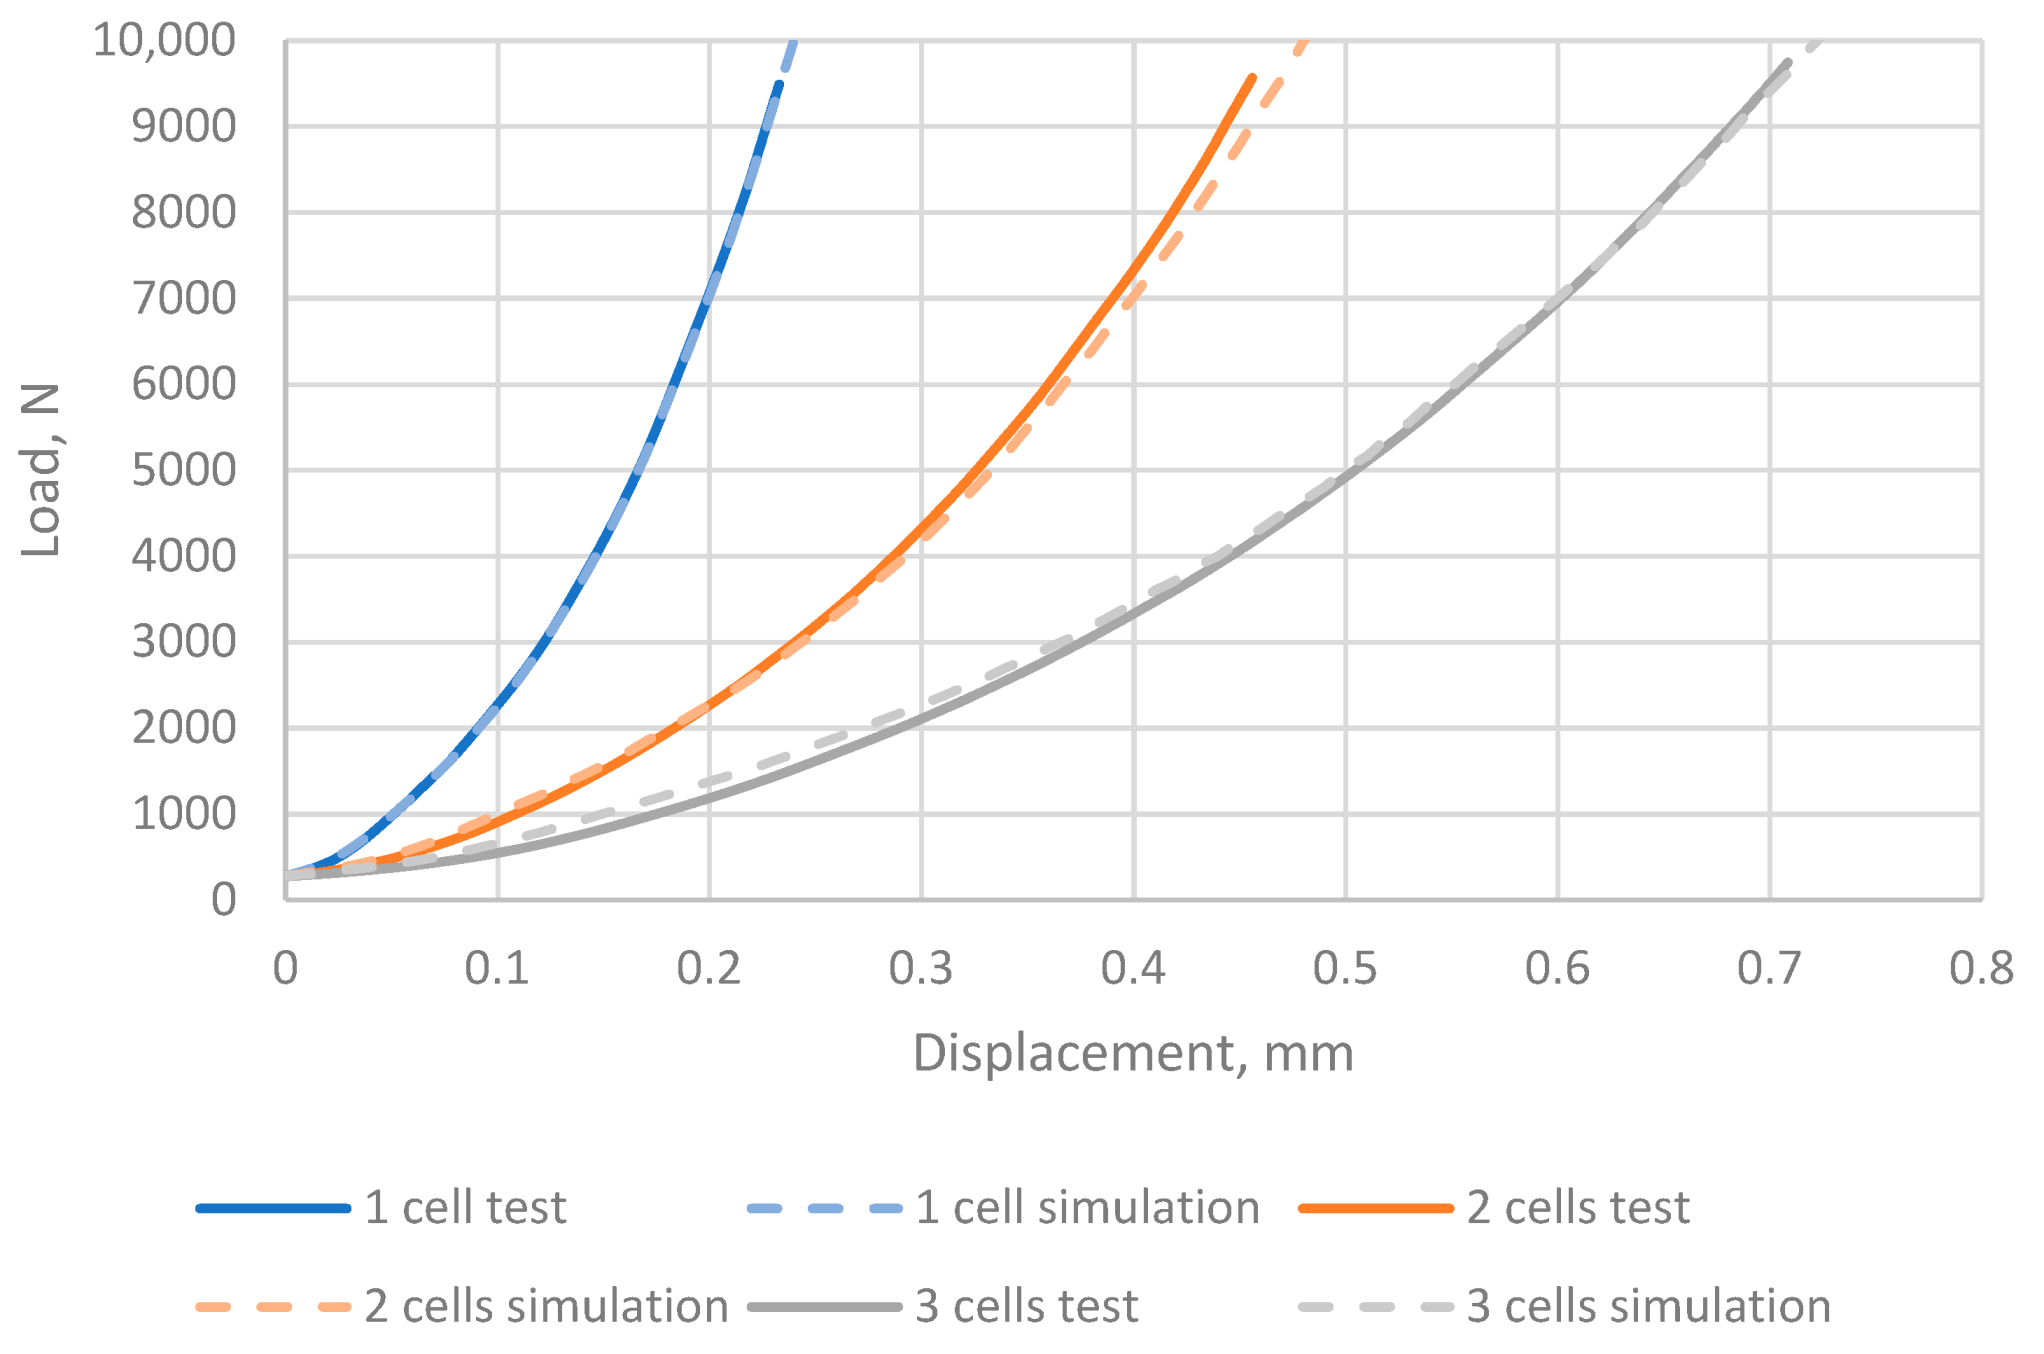
4.1.3. Lateral Compression
Figure 8 shows the predicted force-displacement characteristics (dashed) obtained using a calibrated macro FE model of the Dow Kokam 8 Ah pouch cell compared to the physical test results (solid) for stacks of one, two and three cells respectively subjected to lateral (through thickness) compression. As expected, at any given load the total displacement of two stacked cells is twice that of a single cell and for three stacked cells is three times that of a single cell for the lateral compression.
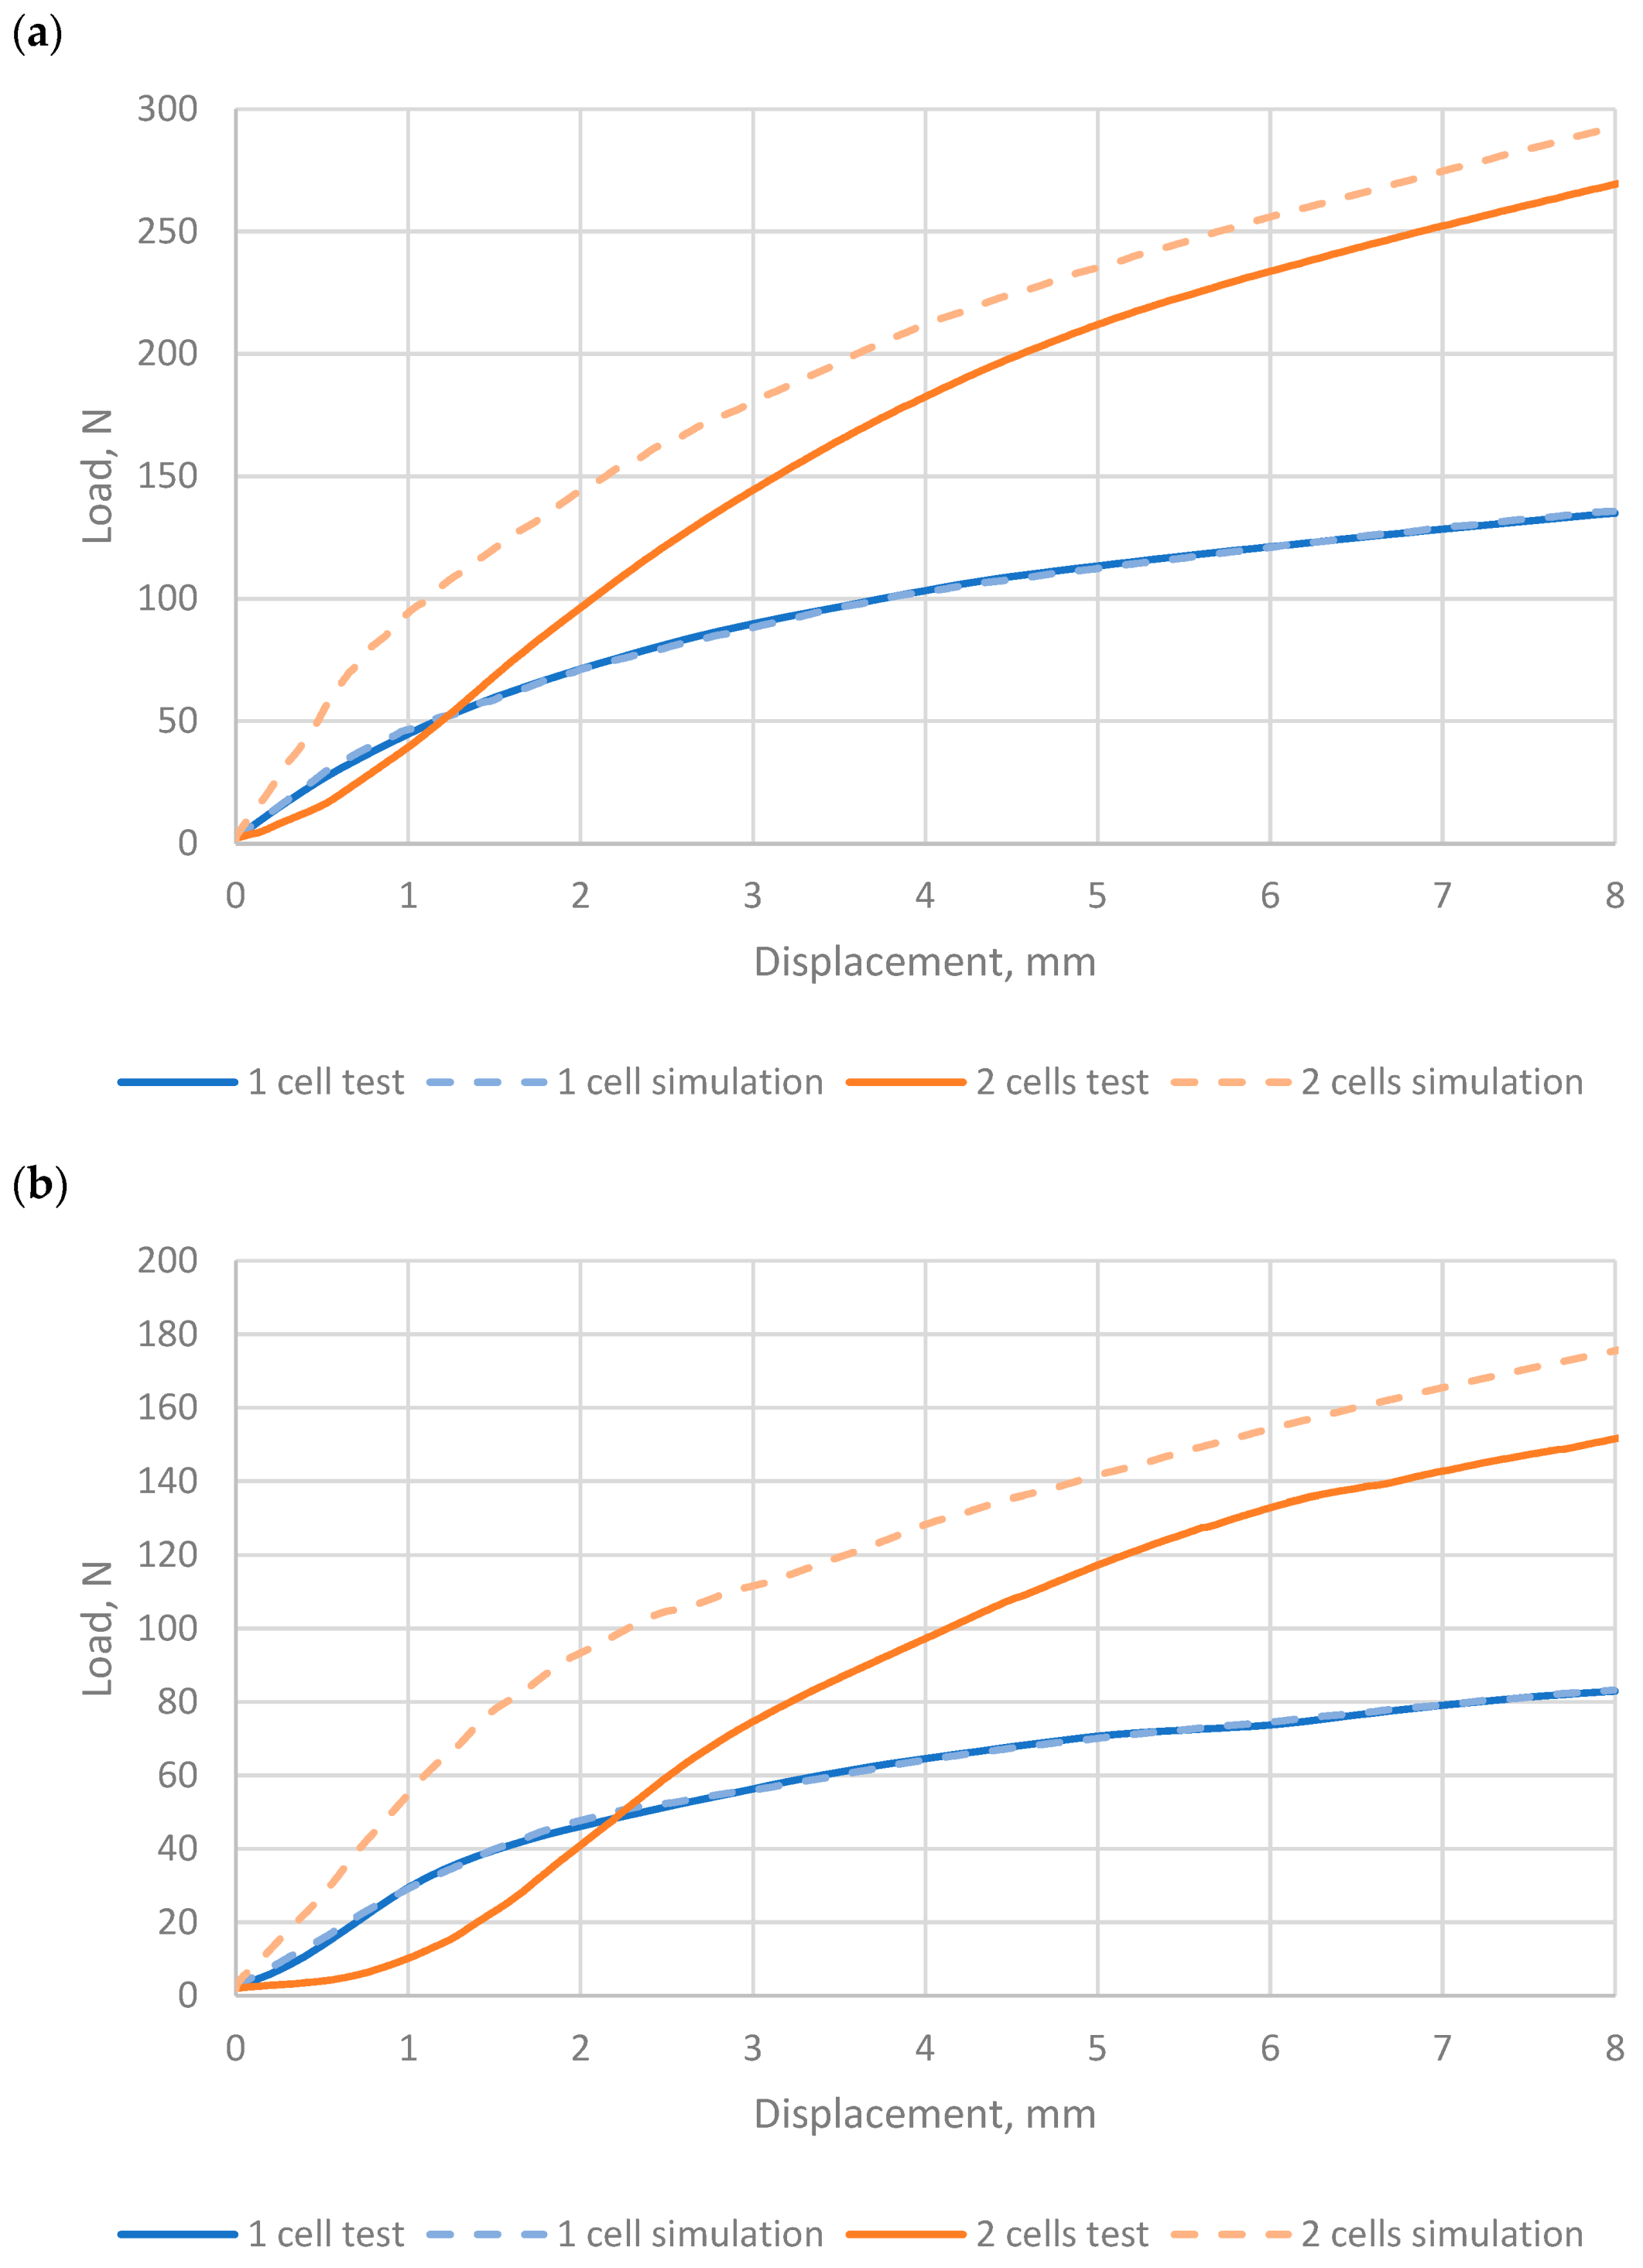
4.1.4. Three-Point Bend
As can be seen from
Figure 9a,b, the predicted simulation force-displacement characteristics are similar to the physical tests for two cells tested together, but the simulation over estimates the force particularly in the early stages. The off-set between the simulation and the physical test is more pronounced when bending around the Y axis where the span is larger. It is thought that this is due to variation in flatness of the physical cell whereas the simulation models are perfectly flat. Modification to the test protocol to include a separate lateral compression pre-load phase to consolidate the cell stack may reduce the displacement offset in the 3PB physical test.
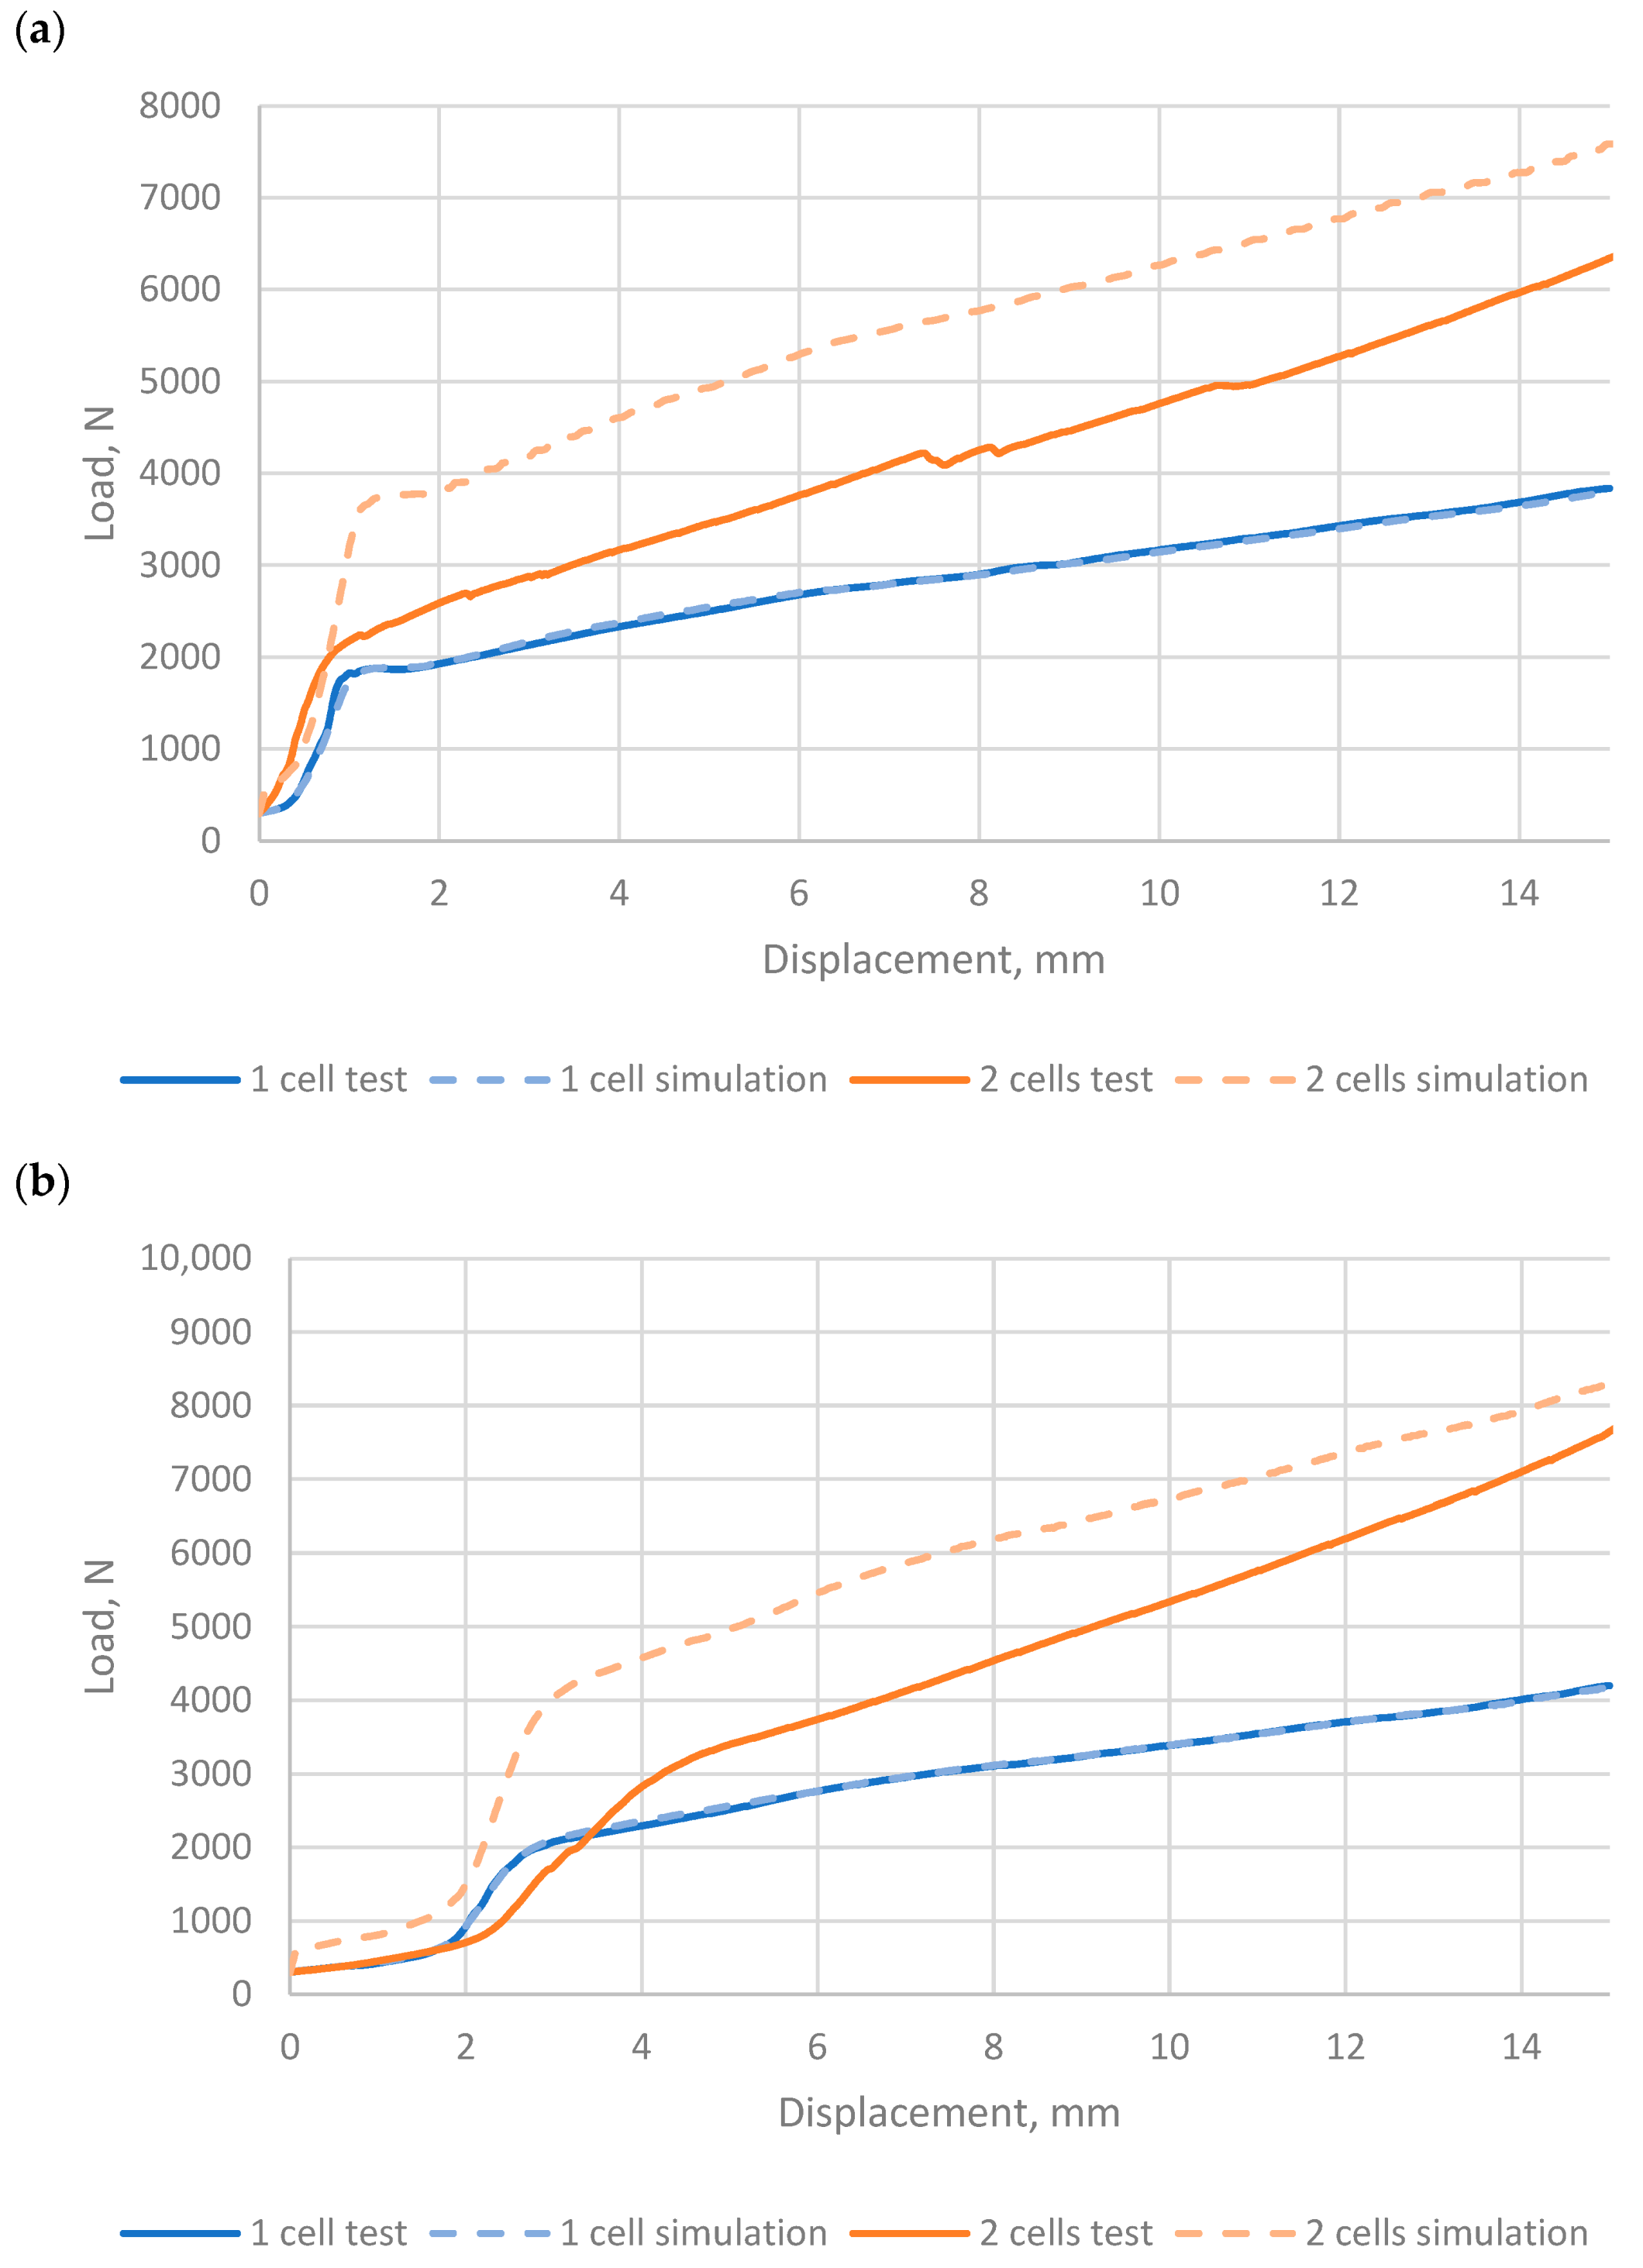
4.1.5. Confined Compression
Figure 10a,b show the predicted force-displacement characteristics (dashed) compared to physical test (solid) for stacks of 1, and 2 cells subjected to confined compression in the X and Y planes respectively. It was anticipated that for multiple stacked cells the force, at a given displacement, would be equal to that of a single cell multiplied by the number of cells in the stack. This is equivalent to a number of similar springs with equivalent characteristics, in parallel, i.e., the force required to achieve a given displacement for a system with N springs will be N times the force required to achieve the same displacement with a single spring. As can be seen from
Figure 10a,b, stacked cells do not generate the expected response. In the confined compression load case, the cells are subject to a through thickness constraining load. Also, there is a ‘soft region’ at the end of the cell which compresses preferentially before the initial linear part of the curve is obtained. Once buckling commences the gradient reduces but the response remains linear. The local deformation of the constituent parts in confined compression is therefore a complex interaction of factors including compression, bending, buckling and friction. In addition, as the cell is not a homogeneous material, but a structure defined by the geometry and material properties of the constituent parts, it can be postulated that, as the lateral thickness of the structure is increased by adding more cells, the lateral stiffness will reduce allowing the cells to deform and buckle at lower loads. As a result, the force-displacement response softens, which is consistent with the characteristics observed from physical tests using multiple stacked cells in the confined compression load-case. This also suggests that, for this load case, a pouch cell macro FE model calibrated to physical test data cannot be used to predict the force-displacement characteristic of a cell of the same construction with a different thickness.
5. Applications for the Pouch Cell Macro FE Model
A number of potential applications for pouch cell macro FE models have been identified which include:
5.1. Battery Module Design & Assessment
Manufacturing assembly process: Preload, banding, geometric tolerances and sensitivity.
Design optimisation: End Plate mass/stiffness, HTP thickness & mass, foam pressure pad specification, tab/busbar configuration.
Module structural performance and characterisation: Static/dynamic stiffness, vibration & shock/impact.
5.2. Battery Pack Design & Assessment
Sub-system models of battery pack designs can be generated using battery module models consisting of pouch cell macro FE model assemblies. These can be used for design studies and assessments of the battery pack system and the constituent components and assemblies.
5.3. Vehicle Design & Assessment
Full vehicle simulation models could be conducted with module and packs constructed using pouch cell macro FE models described in this report. This would provide a representative structural response for the vehicle system and also allow analysis of the pack internal systems including the cells. However, this may not be the most efficient or effective approach. It may be desirable to reduce the complexity of the pack model by including reduced/macro models of the modules. A methodology and process for developing validated module macro models from either physical test data or simulation of modules using pouch cell macro FE models would be required.
In this scenario, the correct vehicle response would be provided by the reduced pack model in a full vehicle simulation. Analysis of the pack and the internal systems would be facilitated using simulations of appropriate sub-system models.
6. Conclusions
A methodology and process have been developed to create pouch cell macro FE models in which the core cell structure is treated as a homogeneous orthotropic honeycomb block and the pouch as an orthotropic fabric with compressive stress elimination. This allows a level of element discretisation that is appropriate for full vehicle and sub-system simulations. The pouch cell macro model must be generated for a specific cell from physical test data.
This process has been demonstrated on three different cells subjected to five load cases. A single model was found to be capable of predicting the load-displacement response of the cell in each load case with a correlation above 91%.
The model proposed here is a purely mechanical model that does not couple electrical or thermal behaviour. It is intended to be used for automotive crash applications, though higher strain rate testing will need to be performed. Individual cells have been modelled accurately but groups of cells may need to be considered separately as they can interact with each other during in-plane compression and bending load cases.
Using the methodology and process described, pouch cell macro FE models have been developed and calibrated to test for two commercial cells and one manufactured in-house of significantly different geometry and the following conclusions drawn:
- (1)
A sensitivity study of the pouch cell macro FE Model has been conducted to identify and quantify the effect of constitutive parameters and scale factors on predictions of pouch cell mechanical performance. It is concluded that input variable scale factors, rather than explicit material model parameters, are the main factors controlling the macro structural characteristics of the pouch cell macro model.
- (2)
Scalability of the pouch cell macro FE model, in terms of geometry and construction, has been demonstrated through the ability to successfully calibrate to test three types of cell with a range of geometries and internal construction.
- (3)
The scalability of the modelling approach for representing stacks of multiple cells under different loading conditions was investigated using the Dow Kokam 8 Ah calibrated macro model, with the following findings:
- (a)
Lateral compression (LCZ)
The predicted simulation force-displacement characteristics compare well to the physical tests with 1, 2 & 3 cells. For this load-case multiple calibrated macro models are predictive.
- (b)
Confined compression (CC X & Y)
The predicted simulation force-displacement characteristics do not compare well to physical test data. For this load-case multiple calibrated macro models are not predictive. Further work would be required to establish a methodology to improve simulation prediction for this load-case.
- (c)
Three-point bending (3PBY & Z)
Predicted simulation force-displacement characteristics are similar to the physical tests. However, the physical test has a displacement offset compared to simulation. It is thought that this is due to variation in flatness of the physical cell whereas the simulation models are perfectly flat. Modification to the test protocol to include a separate lateral compression pre-load phase to consolidate the cell stack would reduce the displacement offset in the three-point bending physical test.
- (4)
For the confined compression load-case, a pouch cell macro FE model calibrated to physical test could not be used to predict the force-displacement characteristic of a cell of the same construction but with a different thickness.
- (5)
In applications where in-plane interactions between cells or other structures occur, it may be necessary to add ‘soft’ parameter elements to the pouch cell macro FE model. The homogeneous properties for these elements could be determined using a similar methodology to that used for the cell core structure.
It was therefore shown to be feasible to use a macro FE model to represent the global structural characteristic of a pouch cell having homogeneous material properties and a finite element topology that fulfils the requirement of full vehicle model simulations.
Future Work
For the three pouch cell types and five load-cases tested in support of this project, no electrical failure or thermal runaway events were recorded. It has therefore not been possible to develop metrics to predict the onset of electrical failure using pouch cell macro FE models although further work to test cells under more aggressive conditions e.g., higher SoC, elevated temperature and higher strain rates are planned. A detailed model is being developed which will be able to indicate the internal levels of equivalent stress or strain within the bulk cell which correspond to deterioration in electrical performance and in the worst case, catastrophic failure. It is hoped that such information can be integrated into the macro cell model thereby producing a useful design tool for the development of modules and packs which are not only rigid enough to prevent catastrophic failures but also optimised in terms of volume and energy density.
The pouch cell macro FE model methodology described in this report was developed using quasi-static test data. Therefore, the FE model calibrations were performed with low damping values that yield stable solutions without affecting the load and no other rate effects. However, in real world application the cells will be subjected to dynamic and transient load-cases e.g., torsion and dynamic loading. Under such conditions it is necessary to consider damping and rate effects for the pouch cell macro FE model. To facilitate calibration of the model, dynamic and transient physical test data are required. Due to the physical nature of the cells plus practical and health & safety constraints it will be necessary to develop appropriate test protocols and facilities.
This modelling strategy may be transferable to other cell formats. Similar methodologies have been proposed for prismatic [
28] and cylindrical cells [
29]. Both of these cell formats have substantially more structural casing than pouch cells, which may reduce the sensitivity of the model to changes in the jellyroll, including state of charge or health. It may also reduce the issues with multiple pouch cells in some load cases, though further experimentation is needed to determine this. Cylindrical cells may be difficult to model at a coarse macro scale for automotive crash as the level of discretisation necessary to achieve this will introduce further difficulties with sensitivity to orientation.
Author Contributions
Conceptualization, D.W. and I.M.; methodology, S.L. and R.B.; validation, S.L., R.B., and A.D.; formal analysis, A.D.; investigation, A.T.; writing—original draft preparation, S.L. and R.B.; writing—review and editing, R.B. and I.M.; visualization, S.L. and R.B.; supervision, I.M.; project administration, D.W.; funding acquisition, D.W. All authors have read and agreed to the published version of the manuscript.
Funding
This research is supported by the High Value Manufacturing Catapult and Jaguar Land Rover joint research program for automotive energy storage.
Institutional Review Board Statement
Not applicable.
Informed Consent Statement
Not applicable.
Data Availability Statement
All data is shown within this article.
Conflicts of Interest
The authors declare no conflict of interest.
References
- Wei, Z.; Zhao, J.; He, H.; Ding, G.; Cui, H.; Liu, L. Future smart battery and management: Advanced sensing from external to embedded multi-dimensional measurement. J. Power Sources 2021, 489, 229462. [Google Scholar] [CrossRef]
- Mussa, A.S.; Klett, M.; Lindbergh, G.; Lindström, R.W. Effects of external pressure on the performance and ageing of single-layer lithium-ion pouch cells. J. Power Sources 2018, 385, 18–26. [Google Scholar] [CrossRef]
- Sommer, L.W.; Raghavan, A.; Kiesel, P.; Saha, B.; Staudt, T.; Lochbaum, A.; Ganguli, A.; Bae, C.-J.; Alamgir, M. Embedded Fiber Optic Sensing for Accurate State Estimation in Advanced Battery Management Systems. Mrs Online Proc. Libr. 2014, 1681, 1–7. [Google Scholar] [CrossRef]
- Zhou, W. Effects of external mechanical loading on stress generation during lithiation in Li-ion battery electrodes. Electrochim. Acta 2015, 185, 28–33. [Google Scholar] [CrossRef]
- Zhou, W.; Hao, F.; Fang, D. The effects of elastic stiffening on the evolution of the stress field within a spherical electrode particle of lithium-ion batteries. Int. J. Appl. Mech. 2013, 5, 1350040. [Google Scholar] [CrossRef]
- Christensen, J.; Newman, J. A Mathematical Model of Stress Generation and Fracture in Lithium Manganese Oxide. J. Electrochem. Soc. 2006, 153, A1019. [Google Scholar] [CrossRef]
- Popp, H.; Glanz, G.; Alten, K.; Gocheva, I.; Berghold, W.; Bergmann, A. Mechanical Frequency Response Analysis of Lithium-Ion Batteries to Disclose Operational Parameters. Energies 2018, 11, 541. [Google Scholar] [CrossRef]
- Mei, W.; Duan, Q.; Lu, W.; Sun, J.; Wang, Q. An investigation on expansion behavior of lithium ion battery based on the thermal-mechanical coupling model. J. Clean. Prod. 2020, 274, 122643. [Google Scholar] [CrossRef]
- Oh, K.-Y.; Epureanu, B.I. Characterization and modeling of the thermal mechanics of lithium-ion battery cells. Appl. Energy 2016, 178, 633–646. [Google Scholar] [CrossRef]
- Sahraei, E.; Meier, J.; Wierzbicki, T. Characterising and modelling mechanical properties and the onset of short circuit for three types of lithium-ion pouch cell. J. Power Sources 2014, 247, 503–516. [Google Scholar] [CrossRef]
- Abada, S.; Marlair, G.; Lecocq, A.; Petit, M.; Sauvant-Moyant, V. Safety focused modelling of lithium-ion batteries: A review. J. Power Sources 2016, 3069, 178–192. [Google Scholar] [CrossRef]
- Wang, H.; Simunovic, S.; Maleki, H.; Howard, J.; Hallmark, J. Internal configuration of prismatic Li-ion cells at onset of mechanically induced short circuit. J. Power Sources 2016, 306, 424–430. [Google Scholar] [CrossRef]
- Léost, Y.; Boljen, M. Crash Simulations of Electric Cars in the EVERSAFE Project; LS-Dyna Forum: Bamberg, Germany, 2014. [Google Scholar]
- Zhexin, P.; Wei, L.; Yong, X. Experiments and 3D detailed modeling for a pouch battery cell under impact loading. J. Energy Storage 2020, 27. [Google Scholar] [CrossRef]
- Trattnig, G.; Leitgeb, W. Battery Modelling for Crash Safety Simulation. In Automotive Battery Technology, Automotive Engineering: Simulation and Validation Methods; Thaler, A., Watzenig, D., Eds.; Springer International Publishing: Cham, Switzerland, 2014; pp. 19–35. [Google Scholar]
- Turner, A.; Allu, S.; Berrill, M.; Elwasif, W.; Kalnaus, S.; Kumar, A.; Lebrun-Grandie, D.; Pannala, S.; Simunovic, S. Crash Models for Advanced Automotive Batteries; ORNL: Oak Ridge, TN, USA, 2015. [Google Scholar]
- Greve, L.; Fehrenbach, C. Mechanical testing and macro-mechanical finite element simulation of the deformation, fracture and short circuit initiation of cylindrical Lithium ion battery cells. J. Power Sources 2012, 214, 377–385. [Google Scholar] [CrossRef]
- Wierzbicki, T.; Sahraei, E. Homogenized mechanical properties for the jellyroll of cylindrical Lithium-ion cells. J. Power Sources 2013, 241, 467–476. [Google Scholar] [CrossRef]
- Roberts, S.C.; Aglietti, G.S. Structural performance of a multifunctional spacecraft structure based on plastic lithium-ion batteries. Acta Astronaut. 2010, 67, 424–439. [Google Scholar] [CrossRef]
- Sahraei, E.; Campbell, J.; Wierzbicki, T. Modeling and short circuit detection of 18650 Li-ion cells under mechanical abuse conditions. J. Power Sources 2012, 220, 360–372. [Google Scholar] [CrossRef]
- Attar, P.; Galos, J.; Best, A.S.; Mouritz, A.P. Compression properties of multifunctional composite structures with embedded lithium-ion polymer batteries. Compos. Struct. 2020, 237, 111937. [Google Scholar] [CrossRef]
- Sahraei, E.; Hill, R.; Wierzbicki, T. Calibration and finite element simulation of pouch lithium-ion batteries for mechanical integrity. J. Power Sources 2012, 201, 307–321. [Google Scholar] [CrossRef]
- Ali, M.Y.; Lai, W.; Pan, J. Computational models for simulations of lithium-Ion battery cells under constrained compression tests. J. Power Sources 2013, 242, 325–340. [Google Scholar] [CrossRef]
- Lai, W.; Ali, M.Y.; Pan, J. Mechanical behaviour of representative volume elements of lithium-ion battery modules under various loading conditions. J. Power Sources 2014, 248, 789–808. [Google Scholar] [CrossRef]
- Amodeo, C.M.; Ali, M.Y.; Pan, J. Computational models for the simulations of lithium-ion battery modules under quasi-static and dynamic constrained compression. Int. J. Crashworthiness 2017, 22, 1–14. [Google Scholar] [CrossRef]
- Jia, Y.; Yin, S.; Liu, B.; Zhao, H.; Yu, H.; Li, J.; Xu, J. Unlocking the coupling mechanical-electrochemical behaviour of lithium-ion battery upon dynamic mechanical loading. Energy 2019, 166, 951–960. [Google Scholar] [CrossRef]
- Xu, J.; Liu, B.; Hu, D. State of Charge Dependent Mechanical Integrity Behaviour of 18650 Lithium-ion Batteries. Sci. Rep. 2016, 6, 1–11. [Google Scholar]
- Yin, H.; Ma, S.; Li, H.; Wen, G.; Santhanagopalan, S.; Zhang, C. Modeling strategy for progressive failure prediction in lithium-ion batteries under mechanical abuse. eTransportation 2021, 7, 100098. [Google Scholar] [CrossRef]
- Jia, Y.; Gao, X.; Mouillet, J.-B.; Terrier, J.-M.; Lombard, P.; Xu, J. Effective thermo-electro-mechanical modeling framework of lithium-ion batteries based on a representative volume element approach. J. Energy Storage 2021, 33, 102090. [Google Scholar] [CrossRef]
Figure 1.
Five load cases used for physical testing and development of the FE macro model. Cells in blue, loading direction in red and fixed supports in grey.
Figure 1.
Five load cases used for physical testing and development of the FE macro model. Cells in blue, loading direction in red and fixed supports in grey.
Figure 2.
3PB test of Dow Kokam 50106100 cell showing buckling of the pouch.
Figure 2.
3PB test of Dow Kokam 50106100 cell showing buckling of the pouch.
Figure 3.
Calibration process of the Pouch Cell Macro FE model for five load cases.
Figure 3.
Calibration process of the Pouch Cell Macro FE model for five load cases.
Figure 4.
Typical load displacement curves from Dow Kokam SLPB5010600 pouch; (a) Lateral compression in Z (b) Confined compression in X, (c) Confined compression in Y (Insets—deformed cell and CT scan section of folds), (d) 3-point bend around X axis, (e) 3-point bend around Y axis (Inset deformed cell). All tests conducted at 50% SoC.
Figure 5.
Comparison of simulation results from the calibrated models with test data for (a) Lateral compression in Z (b) Confined compression in X, (c) Confined compression in Y, (d) 3-point bend around X axis, (e) 3-point bend around Y axis. All tests conducted at 50% SoC.
Figure 5.
Comparison of simulation results from the calibrated models with test data for (a) Lateral compression in Z (b) Confined compression in X, (c) Confined compression in Y, (d) 3-point bend around X axis, (e) 3-point bend around Y axis. All tests conducted at 50% SoC.
Figure 6.
Model of Dow Kokam SLPB 50106100 in (a) lateral compression, (b) confined in-plane compression and (c) three-point bend. Dashed lines indicate pre-test undeformed geometry.
Figure 6.
Model of Dow Kokam SLPB 50106100 in (a) lateral compression, (b) confined in-plane compression and (c) three-point bend. Dashed lines indicate pre-test undeformed geometry.
Figure 7.
Fitted stress-strain curves for jellyroll and pouch materials for (a) DK50106, (b) DK80106 and (c) DMYCELL. Jellyroll flow curves on left axes, pouch flow curves on right axes.
Figure 7.
Fitted stress-strain curves for jellyroll and pouch materials for (a) DK50106, (b) DK80106 and (c) DMYCELL. Jellyroll flow curves on left axes, pouch flow curves on right axes.
Figure 8.
Comparison of lateral compression for stacks of 1, 2 and 3 cells.
Figure 8.
Comparison of lateral compression for stacks of 1, 2 and 3 cells.
Figure 9.
Comparison between the simulation and physical 3PB test data for (a) single and double cells bent around the X axis and (b) single and double cells bent around the Y axis.
Figure 9.
Comparison between the simulation and physical 3PB test data for (a) single and double cells bent around the X axis and (b) single and double cells bent around the Y axis.
Figure 10.
Comparison between the simulation and physical confined compression test data for (a) single and double cells compressed along the X axis and (b) single and double cells compressed along the Y axis.
Figure 10.
Comparison between the simulation and physical confined compression test data for (a) single and double cells compressed along the X axis and (b) single and double cells compressed along the Y axis.
Table 1.
Capacity and dimensions of cells used for mechanical tests.
Table 1.
Capacity and dimensions of cells used for mechanical tests.
| Cell Description | Capacity
(Ah) | Length
(mm) | Width
(mm) | Thickness
(mm) | Mass
(g) |
|---|
| Dow Kokam SLPB 50106100 | 5 | 106 | 100 | 5.9 | 120 |
| Dow Kokam SLPB 681106100 | 8 | 106 | 102 | 7.0 | 156 |
| WMG Dummy Cell BSU | Equivalent to 20 | 180 | 135 | 4 | 150 |
Table 2.
Calibration parameters for each cell type tested.
Table 2.
Calibration parameters for each cell type tested.
| | PARAMETER | DK50106 | DK80106 | DMYCELL |
|---|
| Loadcase | Description | Name | Value | COR1 | Value | COR1 | Value | COR1 |
|---|
| LCZ | Honeycomb viscosity coefficient | HC_MU | 5.00 × 10⁻³ | 99.6 | 2.50 × 10⁻³ | 99.2 | 5.00 × 10⁻³ | 97.6 |
| | Honeycomb LCA ordinate scale factor | HC_S1 | 1 | 0.97 | 0.96 |
| CCX | LCC abscissa scale factor | HC_A3 | 1.03 | 97 | 1.03 | 98.2 | 1.02 | 98.9 |
| | LCC ordinate scale factor | HC_S3 | 1.03 | 1.02 | | 1.03 |
| | Uncompressed Elastic modulus | ECCU | 489 | 333 | | 115 |
| CCY | LCB abscissa scale factor | HC_A2 | 1.03 | 97.5 | 1.04 | 98.3 | 1.01 | 98.5 |
| | LCB ordinate scale factor | HC_S2 | 1.04 | 1.03 | | 1.01 |
| | Uncompressed Elastic modulus | EBBU | 147 | 281 | | 172 |
| 3PBX | LCB abscissa scale factor | P_BSFA | 0.62 | 94.5 | 1.82 | 98.8 | 5.49 | 91.3 |
| | LCB ordinate scale factor | P_BSFO | 0.75 | 0.92 | | 9.24 |
| | LCAB ordinate scale factor | HC_S4 | 0.7 | 0.75 | | 3.98 |
| | Uncompressed Elastic Torsion modulus | GABV | 1.32 | 1.51 | | 100 |
| 3PBY | LCA abscissa scale factor | P_ASFA | 1.5 | 97.9 | 1.6 | 98.7 | 0.51 | 97.9 |
| | LCA ordinate scale factor | P_ASFO | 0.72 | 0.72 | | 0.35 |
| | LCCA ordinate scale factor | HC_S6 | 0.36 | 0.35 | | 2.7 |
| | Uncompressed Elastic Torsion modulus | GCAU | 0.33 | 0.52 | | 100 |
| Publisher’s Note: MDPI stays neutral with regard to jurisdictional claims in published maps and institutional affiliations. |
© 2021 by the authors. Licensee MDPI, Basel, Switzerland. This article is an open access article distributed under the terms and conditions of the Creative Commons Attribution (CC BY) license (https://creativecommons.org/licenses/by/4.0/).


 ,
, 


