1. Introduction
No other crisis gained greater prominence during the past four decades than the Covid-19 pandemic crisis. This is due to its biological nature and wide scope affecting the entire world simultaneously. The household, being the basic economic unit, has been hit hardest by this crisis, often without the government support that enterprises can count on. Although household finance had been attracting substantial academic attention, it has not yet earned its own title and identity. Hence, there is still no commonly accepted definition of household financial instability in the literature. Conceptualizing the term ‘financial energy of the household,’ the author of this research aims to capture broader aspects of household finance. Households can count on two main types of resources over their lifetime—tangible wealth and human capital. The current pandemic crisis not only reduces the wealth but also decreases the potential of the labor market. Both factors directly influence the financial standing of the household and increase the need for the credits.
There are a number of studies explaining the increased vulnerability of households due to their increased debt and the negative consequences of household debt [
1,
2,
3,
4,
5]. In particular, studying the vulnerabilities of the household sector is important for at least two reasons. First, the household sector holds the largest share of wealth in developed economies. Since wealth is one of the most important factors in determining household consumption through its lifecycle, household consumption decisions are influenced by its solvency position, thereby, impacting the economic activity. Second, vulnerable households pose a threat to financial stability of the country due to their ties to financial institutions [
6]. Debt is one of the most important components of financial vulnerability of the household. However, the financial vulnerability may also be driven by factors other than debt, such as: low income, consumption behaviors that may be induced by irresponsibility or short-sightedness, and demographic factors (e.g., education, marital status, number of children) [
7]. Therefore, based on the term “financial energy of the household,” the author of this article understands the financial situation of the household and the ability to repay the debt, taking into account a wide range of financial, but also demographic and behavioral factors. Such a broad term of finance has already been applied in terms of refining the medical surge capacity [
8] during the COVID-19 pandemic. The second example of interdisciplinary terms and research approaches in today’s literature studies can be a theory of the “life cycle” that combines biological, economic, and engineering aspects into one compact study that analyzes the engineering and financial processes at different stages of enterprise development [
9]. The other example of broad application of an interdisciplinary term is called “creative destruction” formulated by J. Schumpeter, which is associated with improper, inefficient allocation of assets. From this point-of-view, liquidation of an inefficient enterprise improves the functioning of the whole economy of the country [
10]. According to the Cambridge Dictionary, the term “enterprise” is the willingness and energy to do something new that takes plenty of effort. This means that money resources in the direct sense of the word can also be defined as energy. Another example is the theory of energy value. In this theory, the researchers have deduced the “energy value” in terms of the dollar exchange rate of 1.4 × 10
5 J [
11]. The latest research recognizing the term “financial energy” does not exclude the scenario that, in the future, all money will be associated with energy [
12].
Majority of studies devoted to forecasting the financial standing of the household is based on traditional credit scoring methods that help banks decide whether or not to grant credit to consumers who apply to them [
13]. Most of the scholars use the following determinants in the models, e.g., [
14,
15,
16,
17,
18,
19,
20,
21,
22]: age, education level, gender, income level, mortgage expenditures, mortgage length, marital status, number of dependents, employment status, credit cards expenditures, number of credits, and value of assets. In other words, existing forecasting models available in the literature contain only individual financial and demographic information. These models lack any constructed ratios unlike in corporate finance where financial ratios are used to evaluate a company’s profitability, liquidity, efficiency, and solvency. In the literature, no attempts have been made to verify the possibility and usability of creating ratios based on financial and demographic data that can be implemented in credit scoring models for households. The question arises whether the implementation of constructed ratios can increase not only effectiveness of the forecasting model but also its versatility between different economic regions. Such a model contains the variables based on economic data expressed as a percent (e.g., a relation of debt to the value of assets) and not in absolute numbers.
Therefore, the contribution of paper is three-fold. First, it investigates the usefulness of the proposed ratios that are constructed with the combination of both demographic and financial data of the household. Second, it determines the most effective methodology of the model separately for households in Poland and Taiwan. Third, it verifies the influence of implementing ratios in the evaluation of financial energy of consumers on the versatility of estimated models. To address the mentioned research problems, the author formulated the following objectives of the study: to propose innovative ratios that can increase predictive properties of the model forecasting the financial standing of the household, to estimate six forecasting models (three for Poland and three for Taiwan) by using techniques as discriminant analysis, logit analysis, and decision trees (C&RT), and to compare effectiveness and versatility of the created forecasting models between two different economic regions and forecasting techniques.
The paper consists of five sections. In the introduction, the author justifies the topic, the study objectives, the contributions, and innovations in the literature.
Section 2 presents the concepts of financial energy of households and factors affecting it.
Section 3 introduces this study’s assumptions regarding constructed data, samples, and implemented forecasting methods. In
Section 4, the author presents six models forecasting the financial energy of households and discusses the results of effectiveness tests.
Section 5 concludes the paper.
2. Literature Review
Consumer financial health has been a significant problem in many countries all over the world. Typically, studies devoted to evaluating financial energy of households focus on forecasting the risk of consumer insolvency by conducting the analysis of macroeconomic determinants of nonperforming loans (NPLs) in the country or the microeconomic analysis of risk insolvency for individual households using the demographic and behavioral factors of consumers.
In a majority of the studies that investigate the factors affecting the scale of bankruptcies in households in the economy, the macroeconomic determinants are mainly used as explanatory variables. Berge and Boye [
23] state that NPLs depend on real interest rates and the unemployment rate, while Rinaldi and Sanchis-Arellano [
24] proved that disposable income, the unemployment rate, and monetary conditions have a strong influence on households’ financial health. Similarly, Espinoza and Prasad [
25] and Kauko [
26] found that NPLs are affected by interest rates, along with fiscal and external deficits. Beck et al. [
27] estimated that the most significant factors affecting the scale of consumer insolvencies are GDP growth, interest rates, and the exchange rate. Messai [
28] also proved that GDP growth, the unemployment rate, and real interest rates have significant influences on NPLs. Ozili [
29] revealed the correlation between NPLs and the stages of the business cycle, while Baboucek and Jancar [
30] investigated economic developments in the Czech banking sector through unemployment, real GDP growth, exports, imports, the real effective exchange rate, and the inflation rate as indicators of NPLs. Quagliariello [
31] presents a regression between the evolution of NPLs as a dependent variable and a set of explanatory variables for the case of Italy. This study revealed that decreasing real GDP growth, increasing unemployment, the real exchange rate, and the consumer price index have a significant effect on loan portfolio quality.
Another branch of the literature focuses on forecasting the risk of consumer bankruptcy with the use of microeconomic factors. Most of the authors, e.g., Aristei and Gallo [
14], Diaz-Serrano [
15], Ghent and Kudlyak [
16], Guiso, Sapienza and Zingales [
17], Haughwout, Okah and Tracy [
18], Hira [
19], Jackson and Kaserman [
20], Patel, Balmer and Pleasence [
21], Worthington [
22], and I-Cheng and Che-hui [
32] use the following determinants: age, education level, gender, income level, mortgage expenditures, mortgage length, marital status, number of dependents, employment status, credit card expenditures, number of credit cards, and value of assets.
Despite an exhaustive research on forecasting models for consumer bankruptcy, these studies have mainly focused on either the macro or the micro level. No studies have been devoted to the combination of financial factors with the demographic and behavioral determinants of consumers in the forecasting process of financial strength of households. To fill this gap, the main objective of this research is to develop the innovative ratios describing the financial energy of households and then to estimate six statistical models (three for Central European and three for Far-East Asian households) with constructed ratios.
3. Data, Samples, and Modeling Methods
The author created two learning and two testing samples in the study with one for each research region. Each testing sample consists of 1000 consumers who took consumption credits in Poland and Taiwan, while each learning sample consists of 200 consumers.
The learning samples were used to estimate the forecasting models (the models were taught on a given sample of consumers to recognize solvent and insolvent households). The testing samples were used to check the effectiveness of created models on the data unknown to the models. Such a research approach lets the models’ testing in a situation very close to the real case where the analysts, e.g., in the bank, do not know if a given consumer is a future solvent or insolvent one.
It is important to note that there is a balanced number of households with good (nonbankrupt) and bad (bankrupt) financial health in both samples. Such a research approach ensures the reliability of the conducted study as all the models are tested on an equal number of bankrupt and nonbankrupt cases. The intention of conducting a separate study on forecasting “the financial energy” of households in Poland and Taiwan was to evaluate the usefulness of created ratios that combine economic and demographic data on the example of two very different countries from economic and cultural perspectives’ behaviors. Such a research approach lets us conclude the versatility and predictive properties of proposed ratios and models.
In
Table 1, there is a presented gender distribution of consumers in both testing samples. There are 58% males and 42% females in the testing sample of Polish consumers, while, in a testing sample of Taiwanese households, there are 63.6% males and 36.4% females. The higher percentage of males in the Far-East Asian sample can be caused by cultural factors. It is also interesting to note that, in both samples, a higher percentage of male consumers (58.62% in Central Europe, i.e., 340 out of 580 male consumers and 56.91% in Far-East Asia, i.e., 362 out of 636 male consumers) are in the state of bad financial standing than female ones (38.09% in Poland, i.e., 160 out of 420 female consumers and 37.91% in Taiwan, i.e., 138 out of 364 female consumers).
The status of “nonbankrupt” is given to the households that were repaying the credits with no delays and “bankrupt” to those who had delays in repayment longer than 3 months.
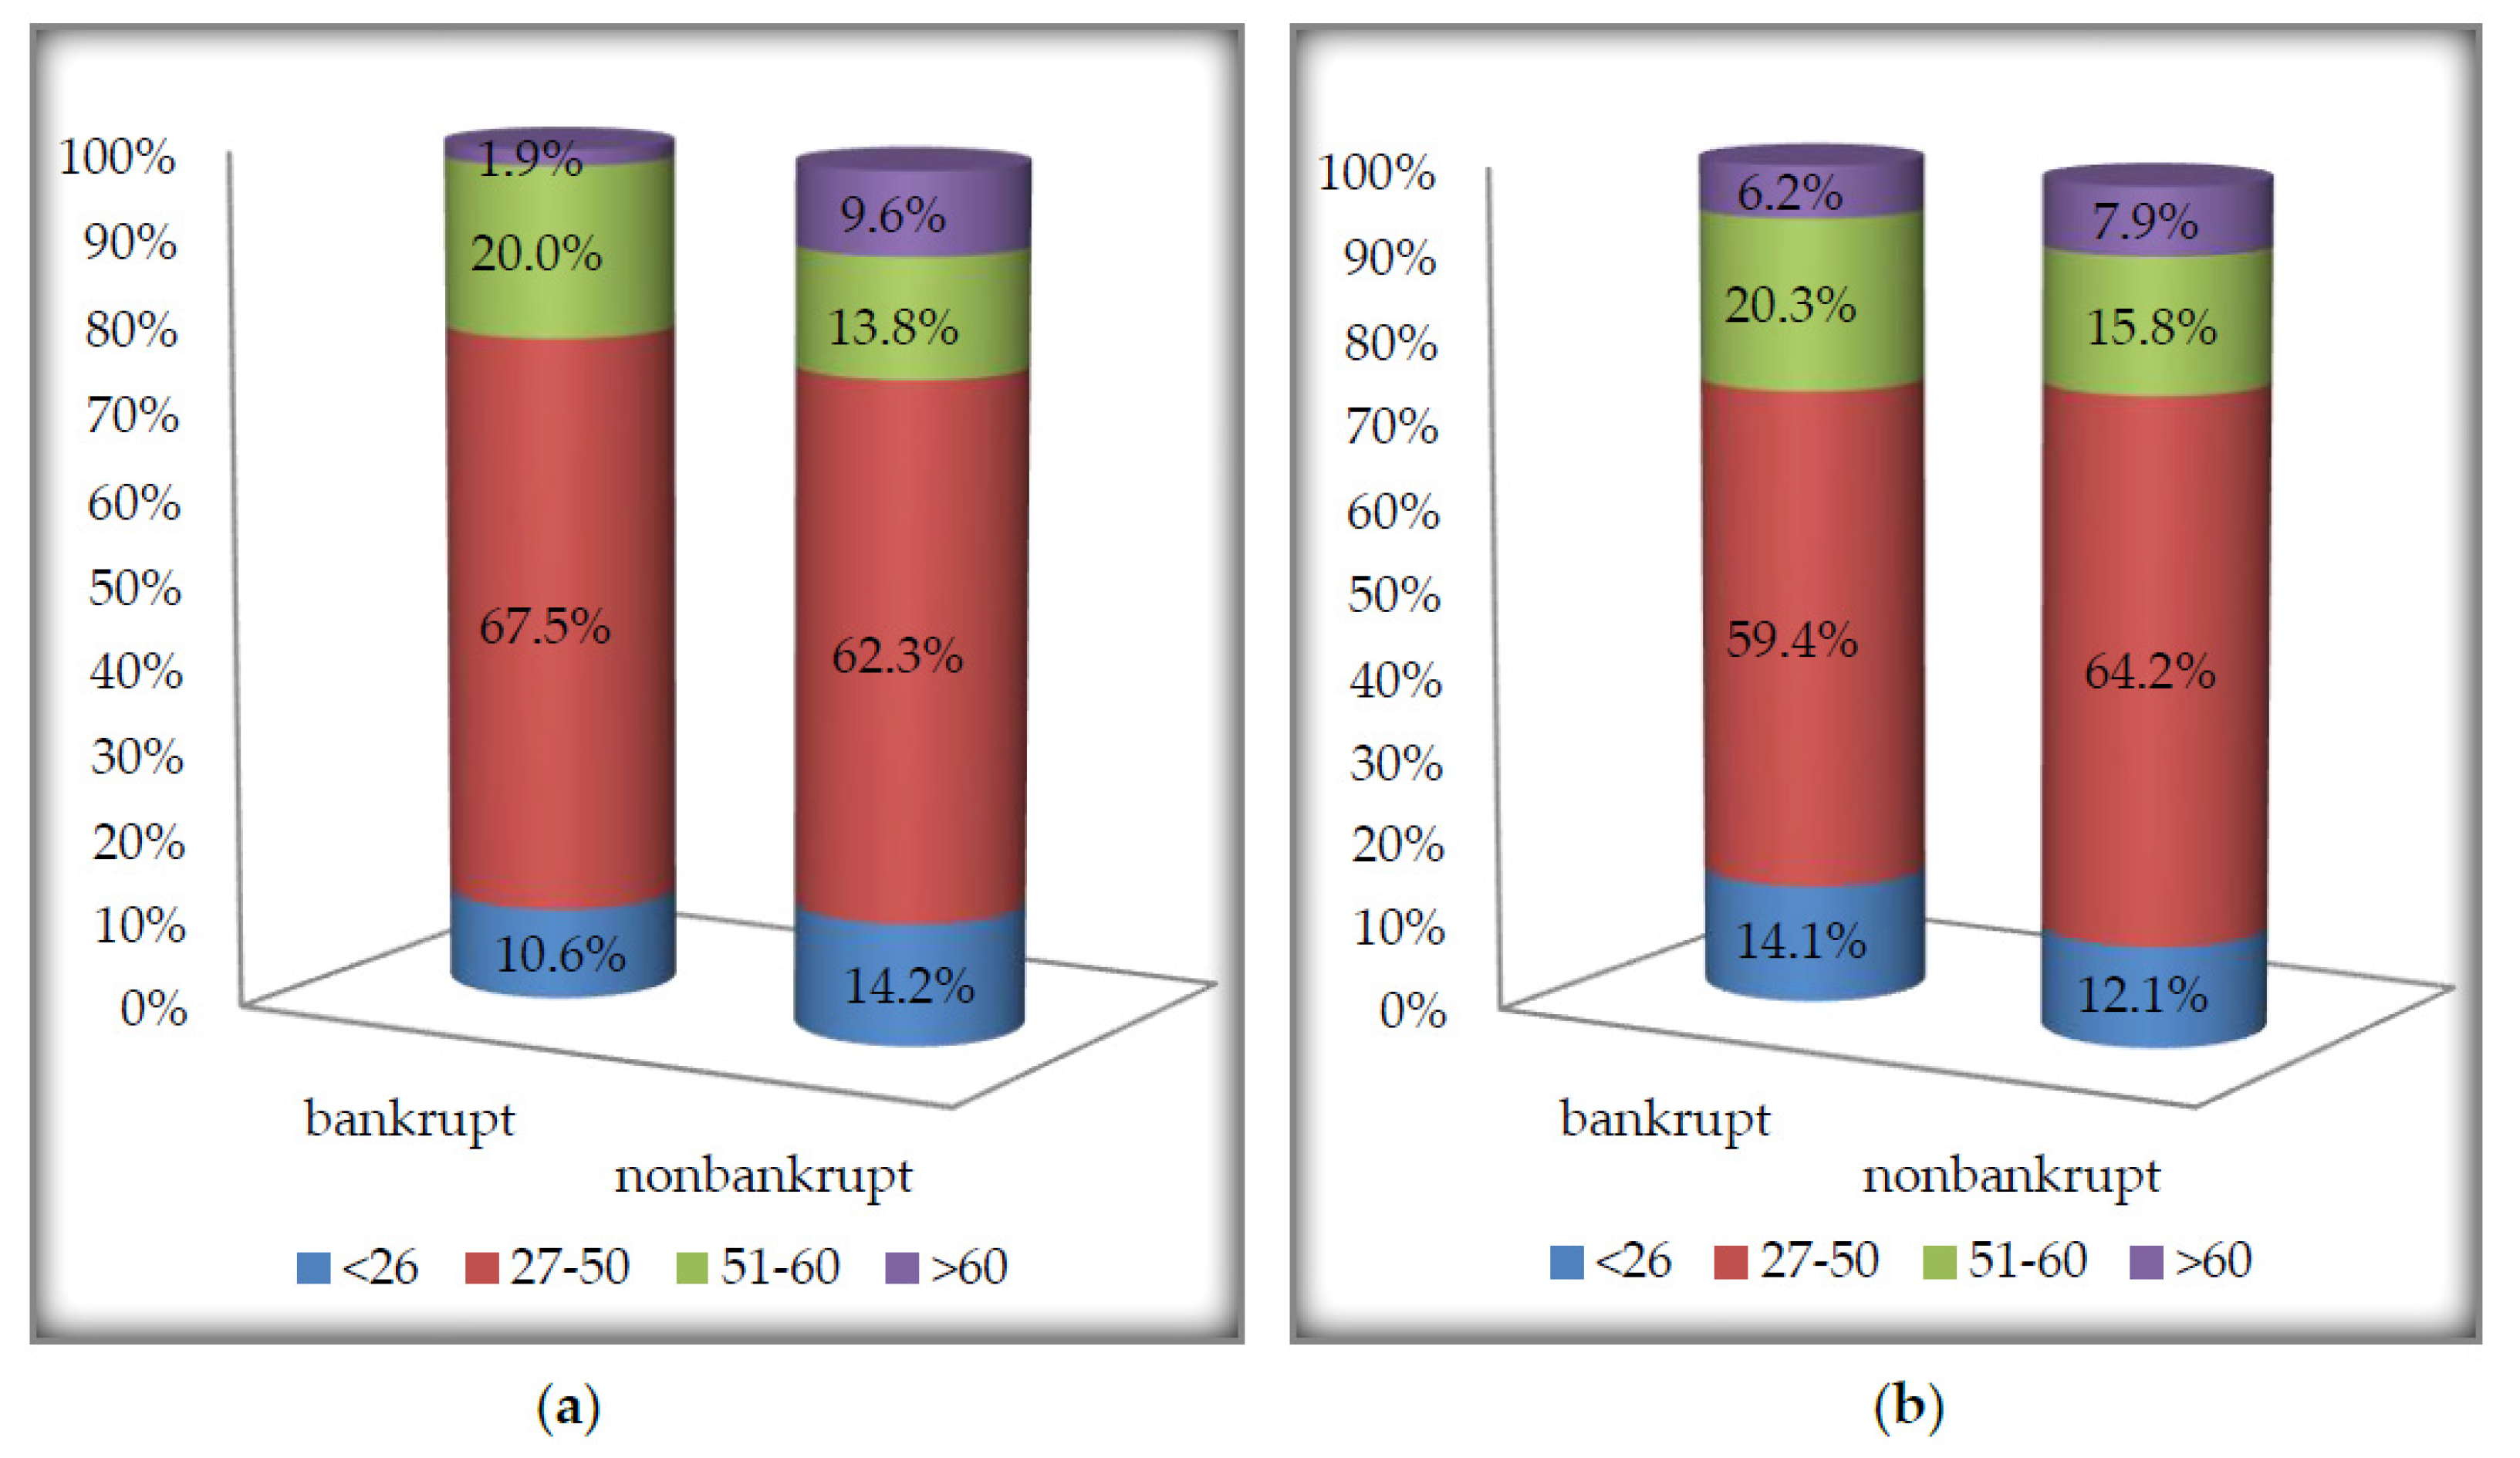
Looking more closely at the demographic characteristic of the testing samples, it can be seen that, in the case of analyzed female consumers in Poland (
Figure 1a), women in the group age of 27–50 stated the highest share in the sample (67.5% of bankrupt consumers and 62.3% of nonbankrupt ones). Similarly, in the case of male consumers (
Figure 1b), men in the group age of 27–50 were the biggest part of the bankrupt and nonbankrupt households. Here, the noticeable share of male consumers with solvency problems was a group of consumers older than 60 years old—6.2%, while, in the case of female consumers in the state of bankruptcy, it was only 1.9% (
Figure 1).
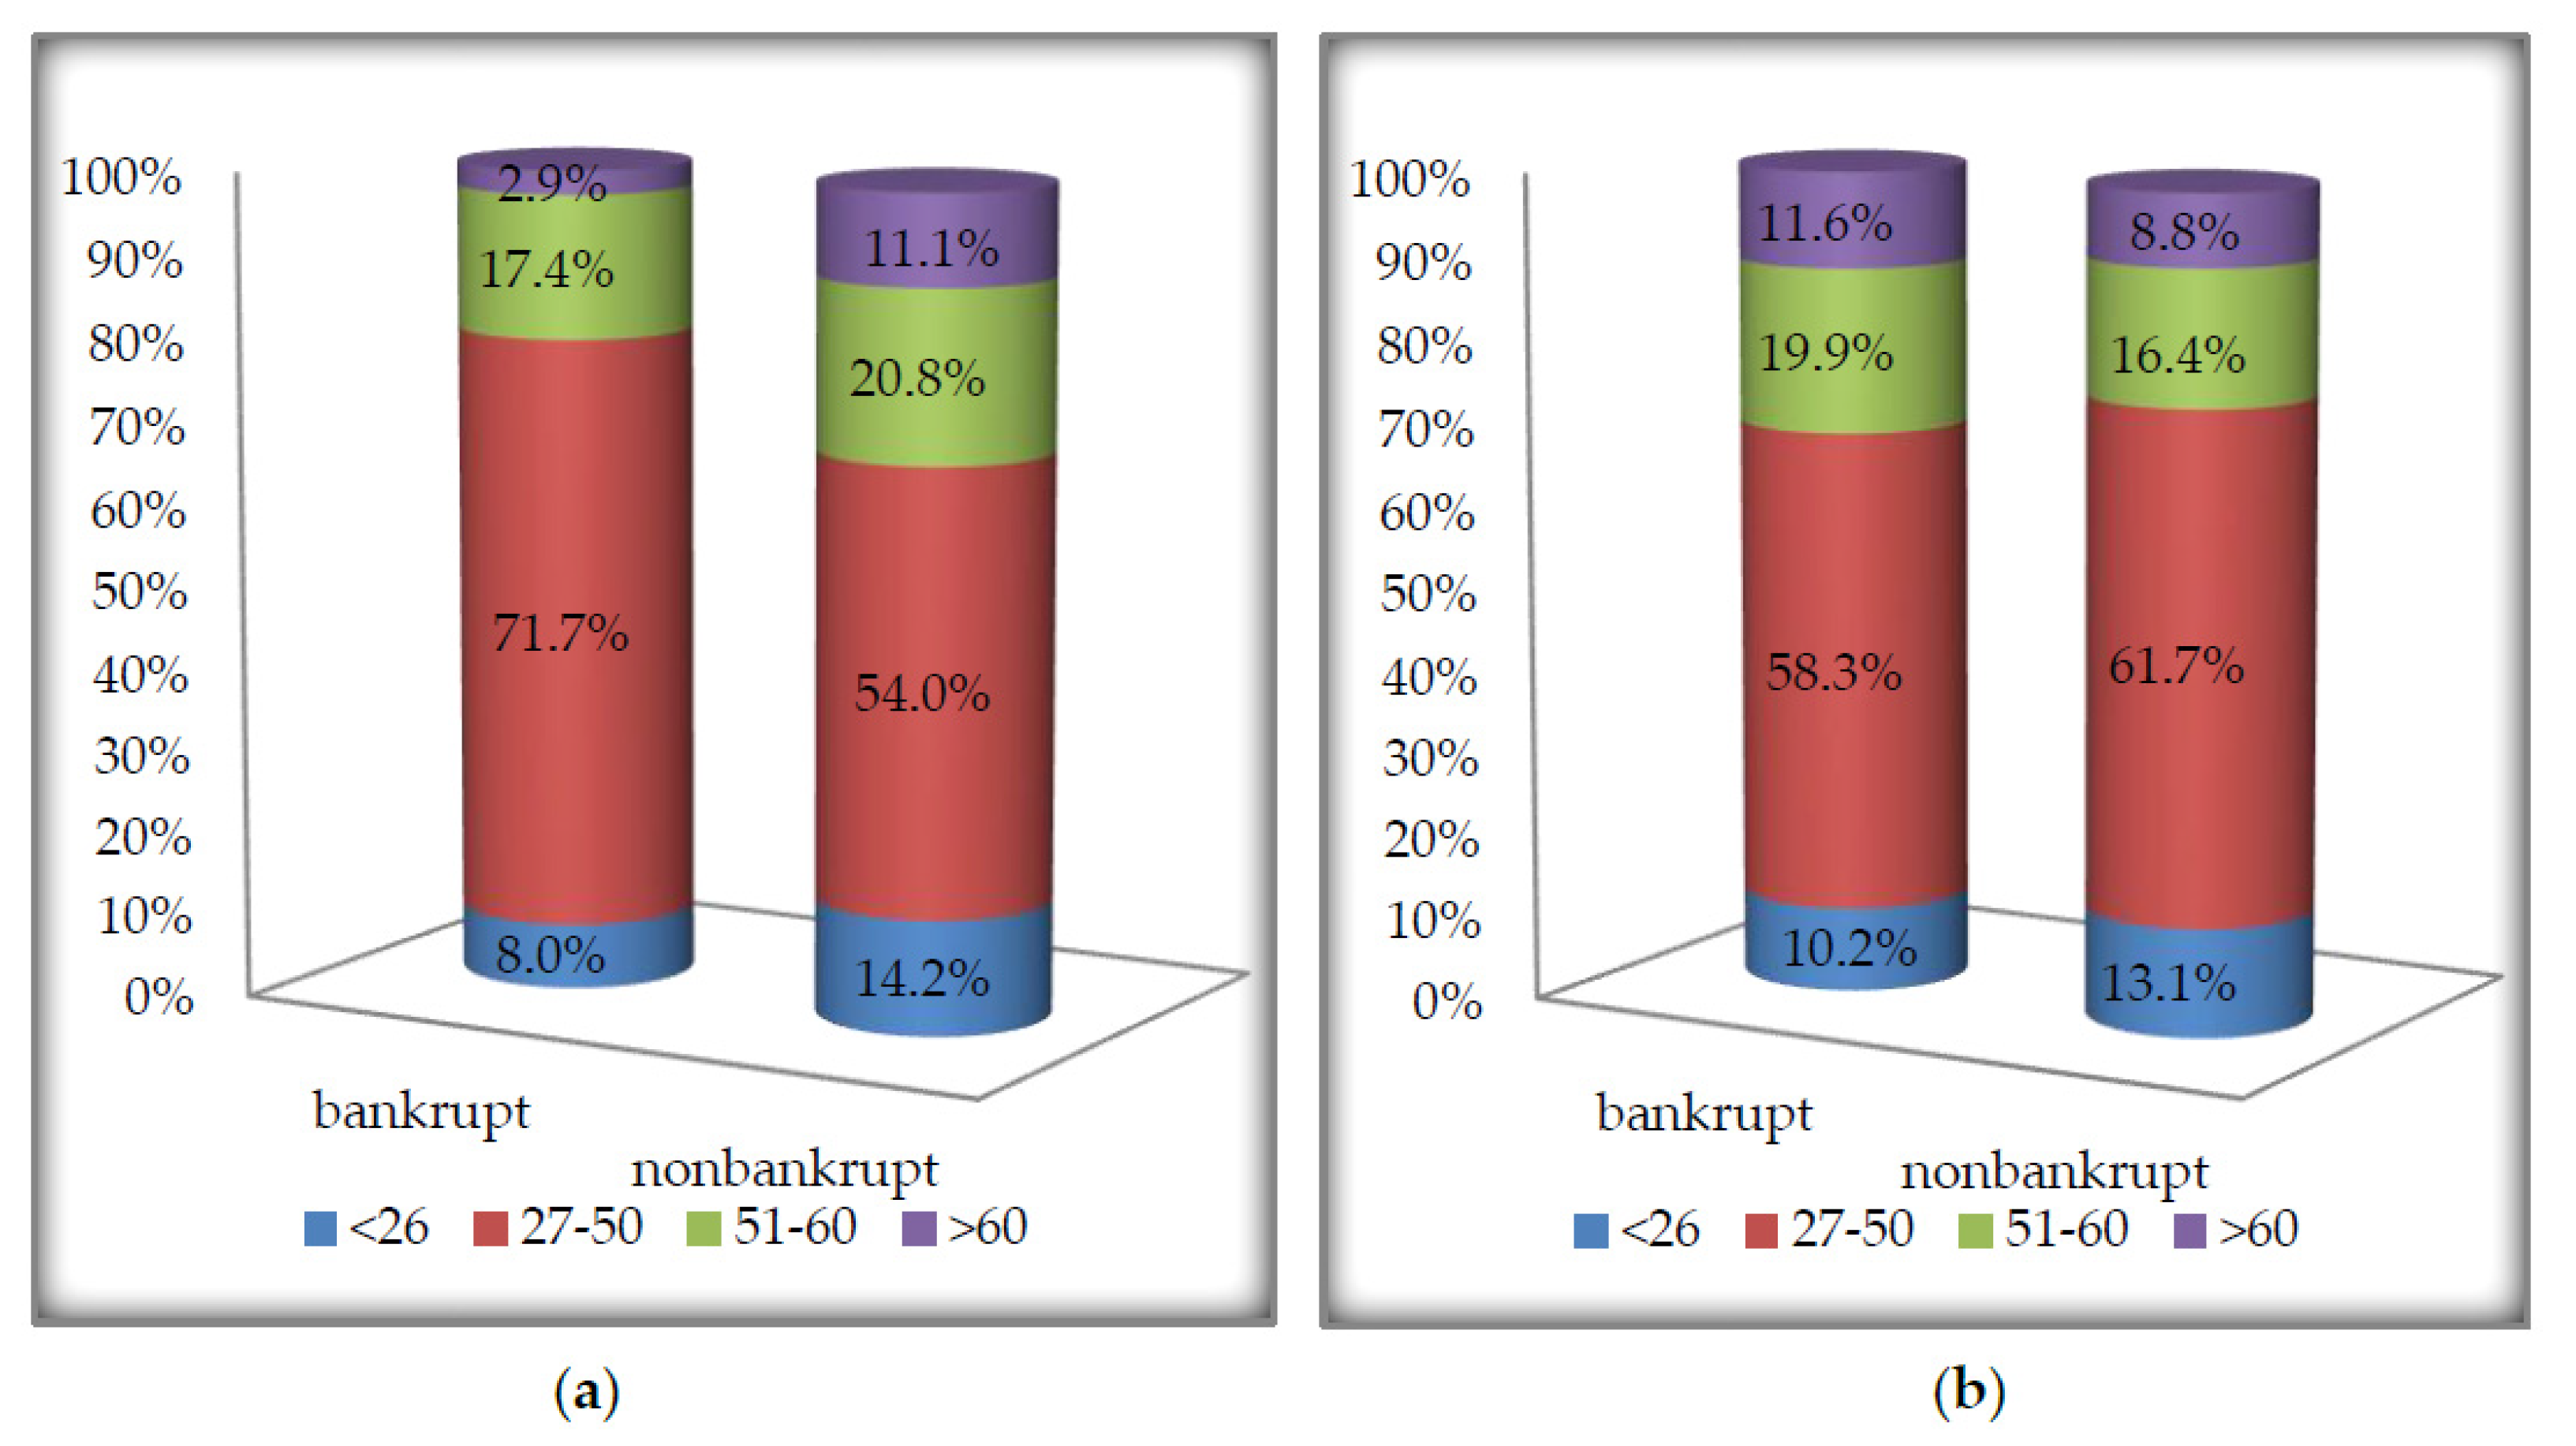
Concerning the age of consumers in the testing sample from Taiwan (
Figure 2), 71.7% of bankrupt women were from the age group of 27–50. The highest share of nonbankrupt female consumers was women in the age of 27–50 (54.0%) and 51–60 (20.8%). In the case of male consumers from Taiwan, the share of bankrupt and nonbankrupt consumers was at a similar level between 58.3% and 61.7%. It is worth noticing that quite a high share of bankrupt male consumers was older than 60 years old (11.6%). It is almost twice as big a share as in the case of European bankrupt male consumers (11.6% vs. 6.2%).
Comparing the educational level of analyzed consumers (
Figure 3), it can be noticed that the highest share of both bankrupt and nonbankrupt households in the Polish sample were consumers at the master or doctorate level (45.6% of bankrupt consumers and 49.8% of nonbankrupt ones). In Taiwanese households, the highest share was devoted to consumers at the bachelor level (35.4% of bankrupt and 35.2% of nonbankrupt households).
All consumers were described by six financial (annual income, monthly income, the value of total assets owned, the value of total credits taken, the value of credit cards, value of monthly interest rates paid) and five demographic (age, education level, number of children, marital status, length of employment) variables. Based on these eleven variables, the author of this study has created twelve ratios that combine the financial and demographic information. It is worth noting that it is one of the first attempts in literature worldwide to use such ratios that combine different types of information in evaluating the financial situation of the households.
Table 2 presents the created ratios with the given formulas and the description. Such a research approach uses a wide range of important information about consumers and increases the versatility of the study. These ratios are not denominated in money value nor strictly in demographic units that would be limited to use in only one country, but it can be widely used in other regions of the world.
The author used three methods to estimate the forecasting models—multivariate discriminant analysis (MDA), logit (LOG), and decision tree models (C&RT).
The multivariate discriminant analysis method is classified as a pattern (teacher) classification technique because the discriminant function’s value, determined for the analyzed households, is compared to a pattern, thereby defining the consumer belonging to a class. First the linear discriminant function is estimated, which is a weighted sum of the analyzed diagnostic variables in the following form.
where Z is the dependent variable, x
i is the independent variables (i = 1, 2, ..., n), and d
i is the discriminant weights. Then, the discriminant function’s cutoff value is determined. When the value of the function Z for the analyzed household is smaller than the cutoff value. The consumer is classified as a consumer with high risk of insolvency (low financial energy and capabilities). However, if the value is higher than the threshold, the consumer is classified as not at risk of bankruptcy (high financial energy and capabilities).
In the case of the logit model, the result of the logistic regression function is the likelihood of an event p
i. Estimating a consumer financial health is the probability of an analyzed consumer belonging to one of two sets: “bankrupt” or “nonbankrupt.” The p
i function takes the following form:
where P(Y = 1) is the dependent variable, the probability of adoption by variable Y is the value of 1. Z is the value of the linear function Z, where Z = d
0 + d
1x
1 + d
2x
2 + .... + d
nx
n [x
i − explanatory variables (i = 1, 2, ..., n), and d
i—weights (i = 1, 2, ..., n)]. The value of indicator P(Y = 1) occurs in the range of 0 to 1. To use the estimated logit model, a certain threshold (P
cutoff) of function P(Y = 1) must also be adopted, as in the case of discriminant analysis.
Decision trees allow the presentation of the rules arising from the collected data using hierarchical, sequential structures. These rules in a recursive way enable division of a multi-dimensional feature space into subsets, which are homogeneous or almost homogeneous in one characteristic. One of the most popular and most effective methods of building a decision tree is the C&RT algorithm. A characteristic feature of this algorithm is the search of the domain of all possible divisions and split into two disjoint and complementary subsets. This method involves making decisions about each division of a given set into subsets, resulting in the creation of a node, or a decision not to divide and classify data to one class, thus, creating a leaf. This procedure is repeated recursively until the moment when one cannot make more divisions, that is, create the next node, and, thus, every branch ends with a leaf. The decision to create the leaf, which is the recognition that the set is sufficiently homogeneous due to the explained variable (end of divisions) or node, which is a continuation of divisions determines the size of the decision tree.
To evaluate the effectiveness of the created models, the following formula was used (the symbols are explained in
Table 3):
It should be stressed that, from the point of view of the banks, in addition to analyzing the overall effectiveness (S) of the model, it is important to distinguish two types of errors generated by the models. The author has used the classification matrix presented in
Table 3 with the identification of such errors. Type I error indicates the classification of a consumer that, in the future, will experience problems with repaying the credits as a consumer with no risk of insolvency. Granting a credit to a future insolvent household (Type I error) will result in losses of bank that will have difficulties in collecting back the previously given credit. Conversely, Type II error means the loss of “only” potential profits by deciding not to grant the credit to a healthy consumer, believing that this is a future bankrupt household. For this reason, Type I error is considered to be more costly and dangerous from the point of view of the solvency of the bank than Type II.
4. Results and Discussion
To conduct the study, the author of research first calculated the set of 12 ratios (
Table 2) for all consumers in learning and testing samples. In the second stage of study, three forecasting models for Central European and three predicting models for the Far-East Asian household were developed. The first estimated model was the multivariate discriminant analysis model. Using a forward stepwise regression method, the following forms of MDA models were estimated.
Both models are well fitted to empirical data (adjusted coefficient of determination equal to 76.36% and 83.21%), and all selected independent variables were highly statistically significant (p << 0.01). All the variance inflation factors (VIF) were smaller than five, so the multicollinearity problem does not exist. It is worth noting that the MDA model for Polish consumers comprise four ratios, while, for Taiwanese households, the model contains five ratios. It is also interesting that models for both regions contain the same type ratios (X1, X3, X5, and X12). It is the evident that proposition of constructed ratios that combine financial and demographic information increased the versatility of the models.
The second developed model was the logit model, which was estimated using forward stepwise regression. For individual samples of households, the following forms of this model have been estimated.
Above both models are also well fitted to empirical data (adjusted coefficient of determination equal to 89.55% and 84.75%), and all selected independent variables were highly statistically significant (p < 0.01). All VIF were smaller than five so the multicollinearity problem does not exist either. Both logit models contain four ratios. Three out of these four ratios are the same for both economic regions (X2, X5, and X12). Comparing to MDA models, it can be seen that very similar information was selected in developing logit models. The most common ratios for all four models are four financial ratios (X1, X2, X3, X5) and one ratio that combine demographic variable (age) and financial variables (total credits/annual income). This ratio combines the relation of age to number of years needed for repayment of all the credits by the consumer.
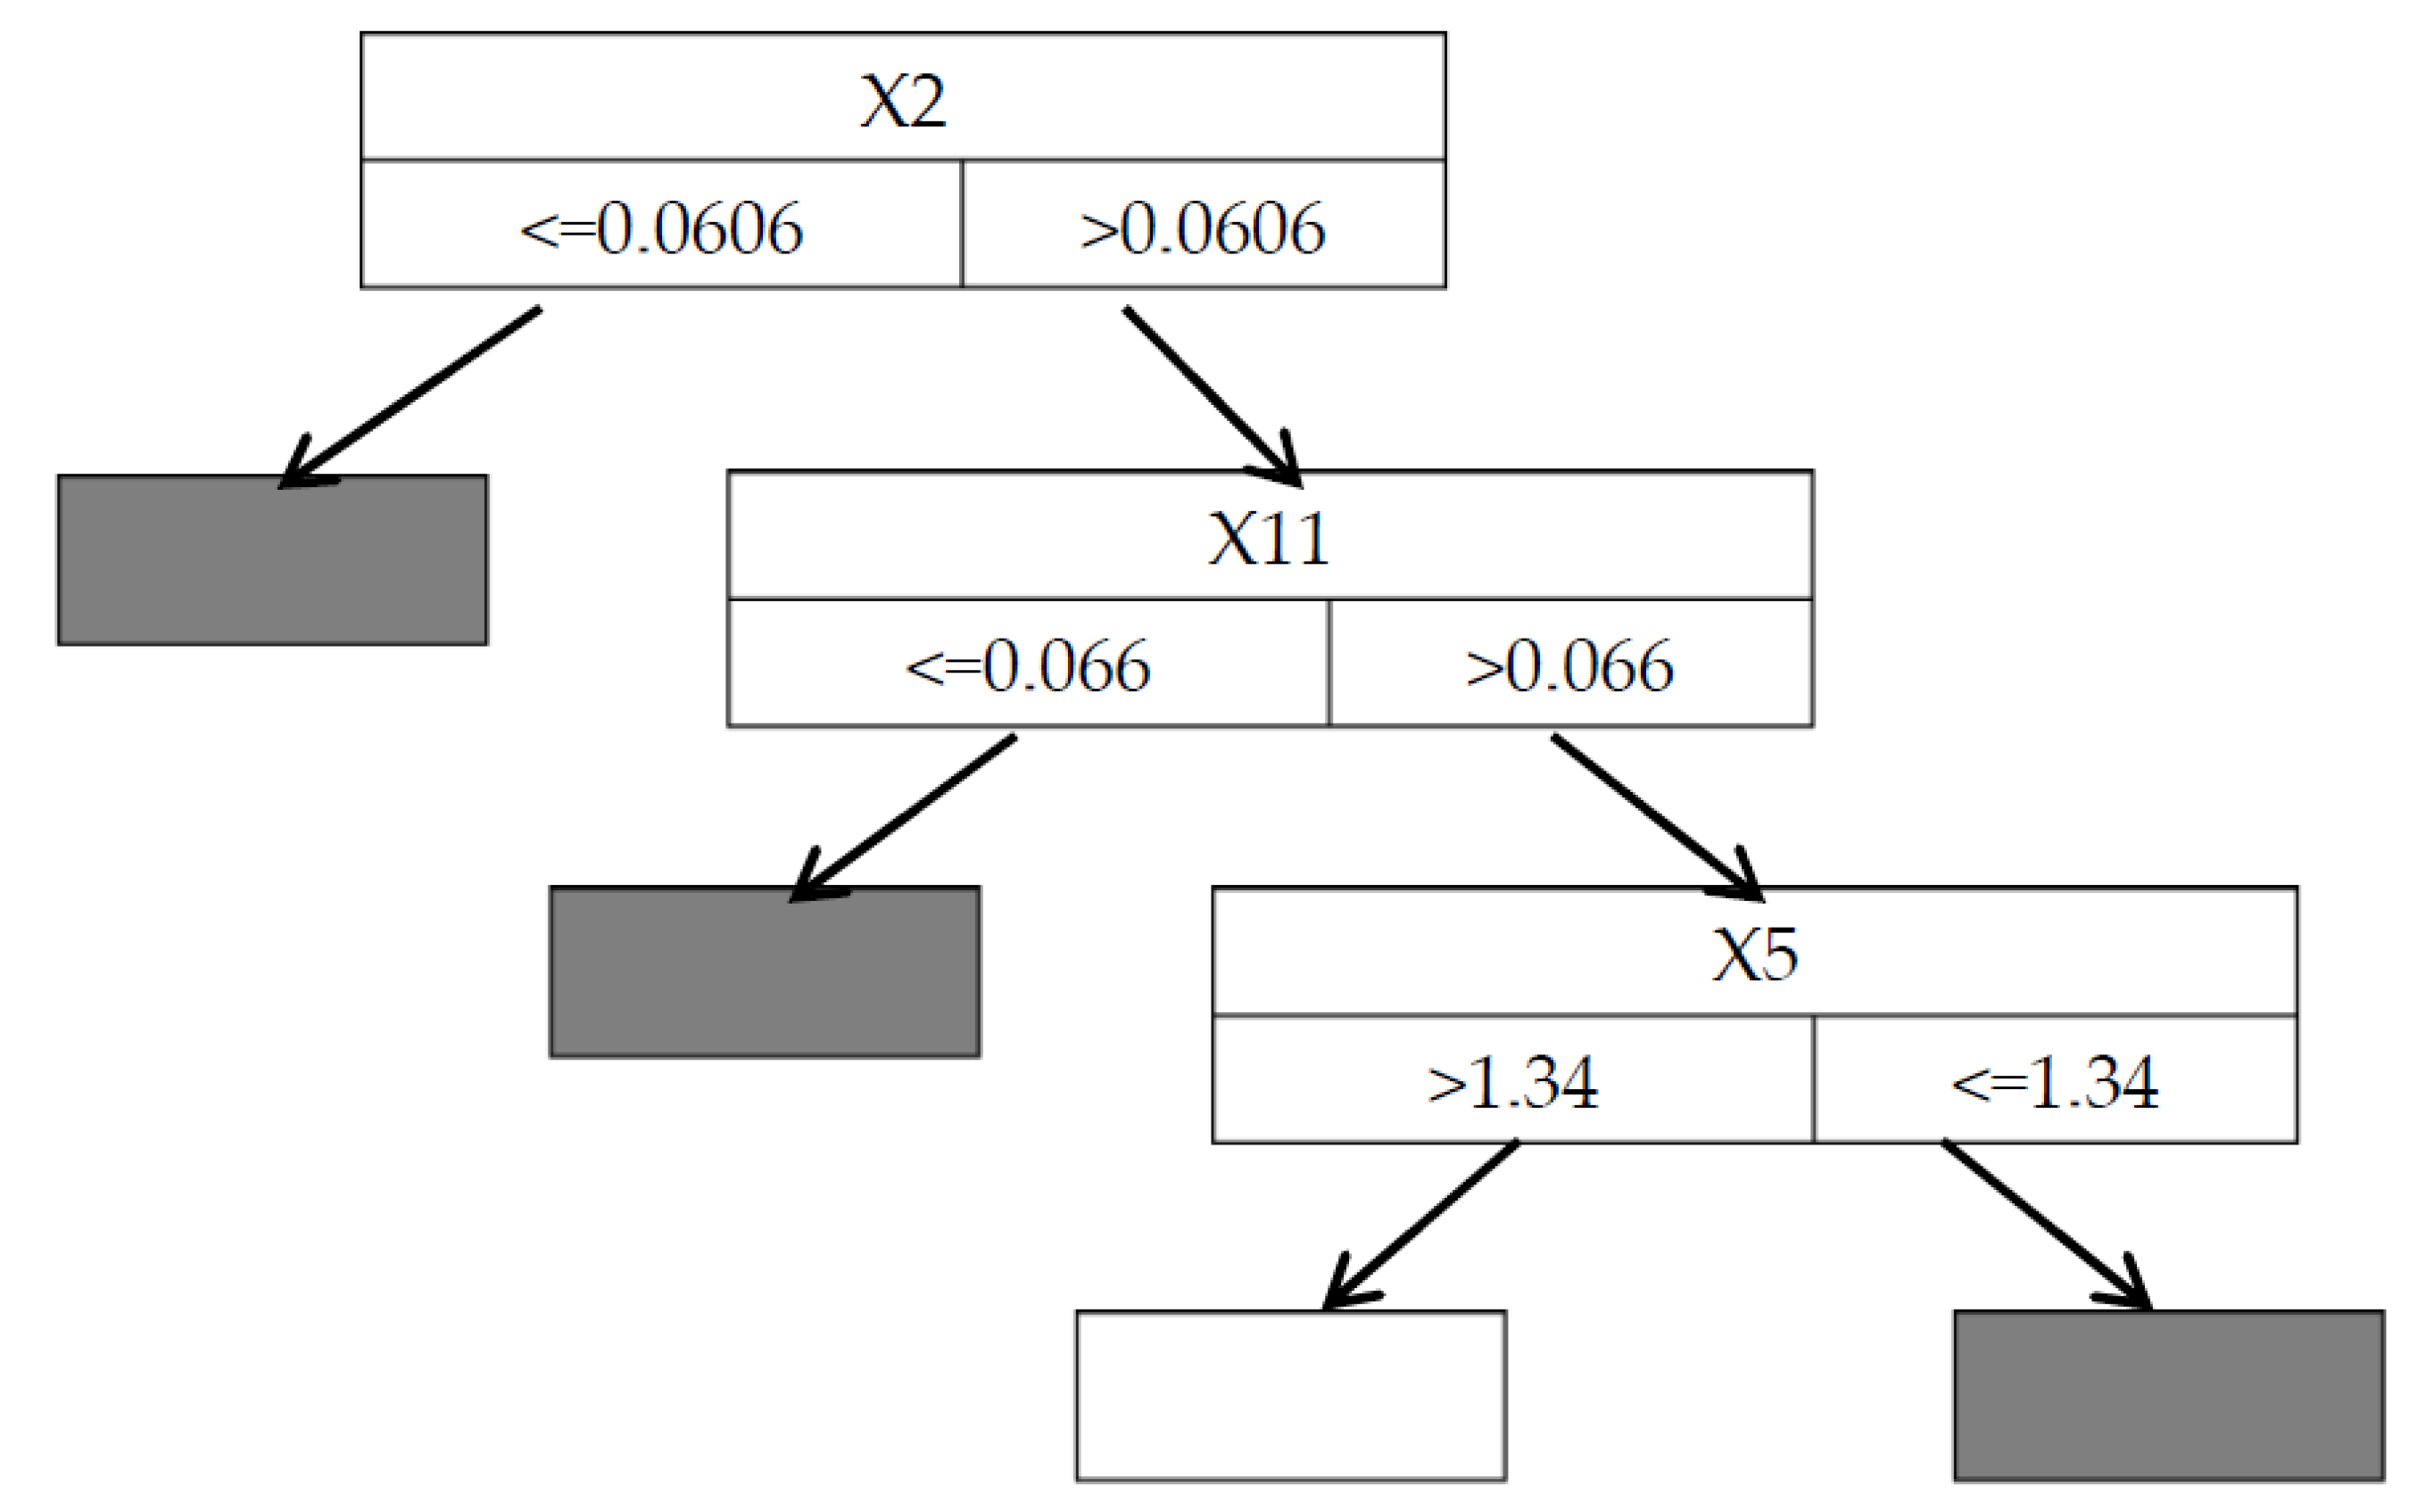
The third type of a model developed to predict the financial energy of households was a decision tree model (C&RT).
Figure 4 shows the structure of the decision tree model for the European sample of consumers.
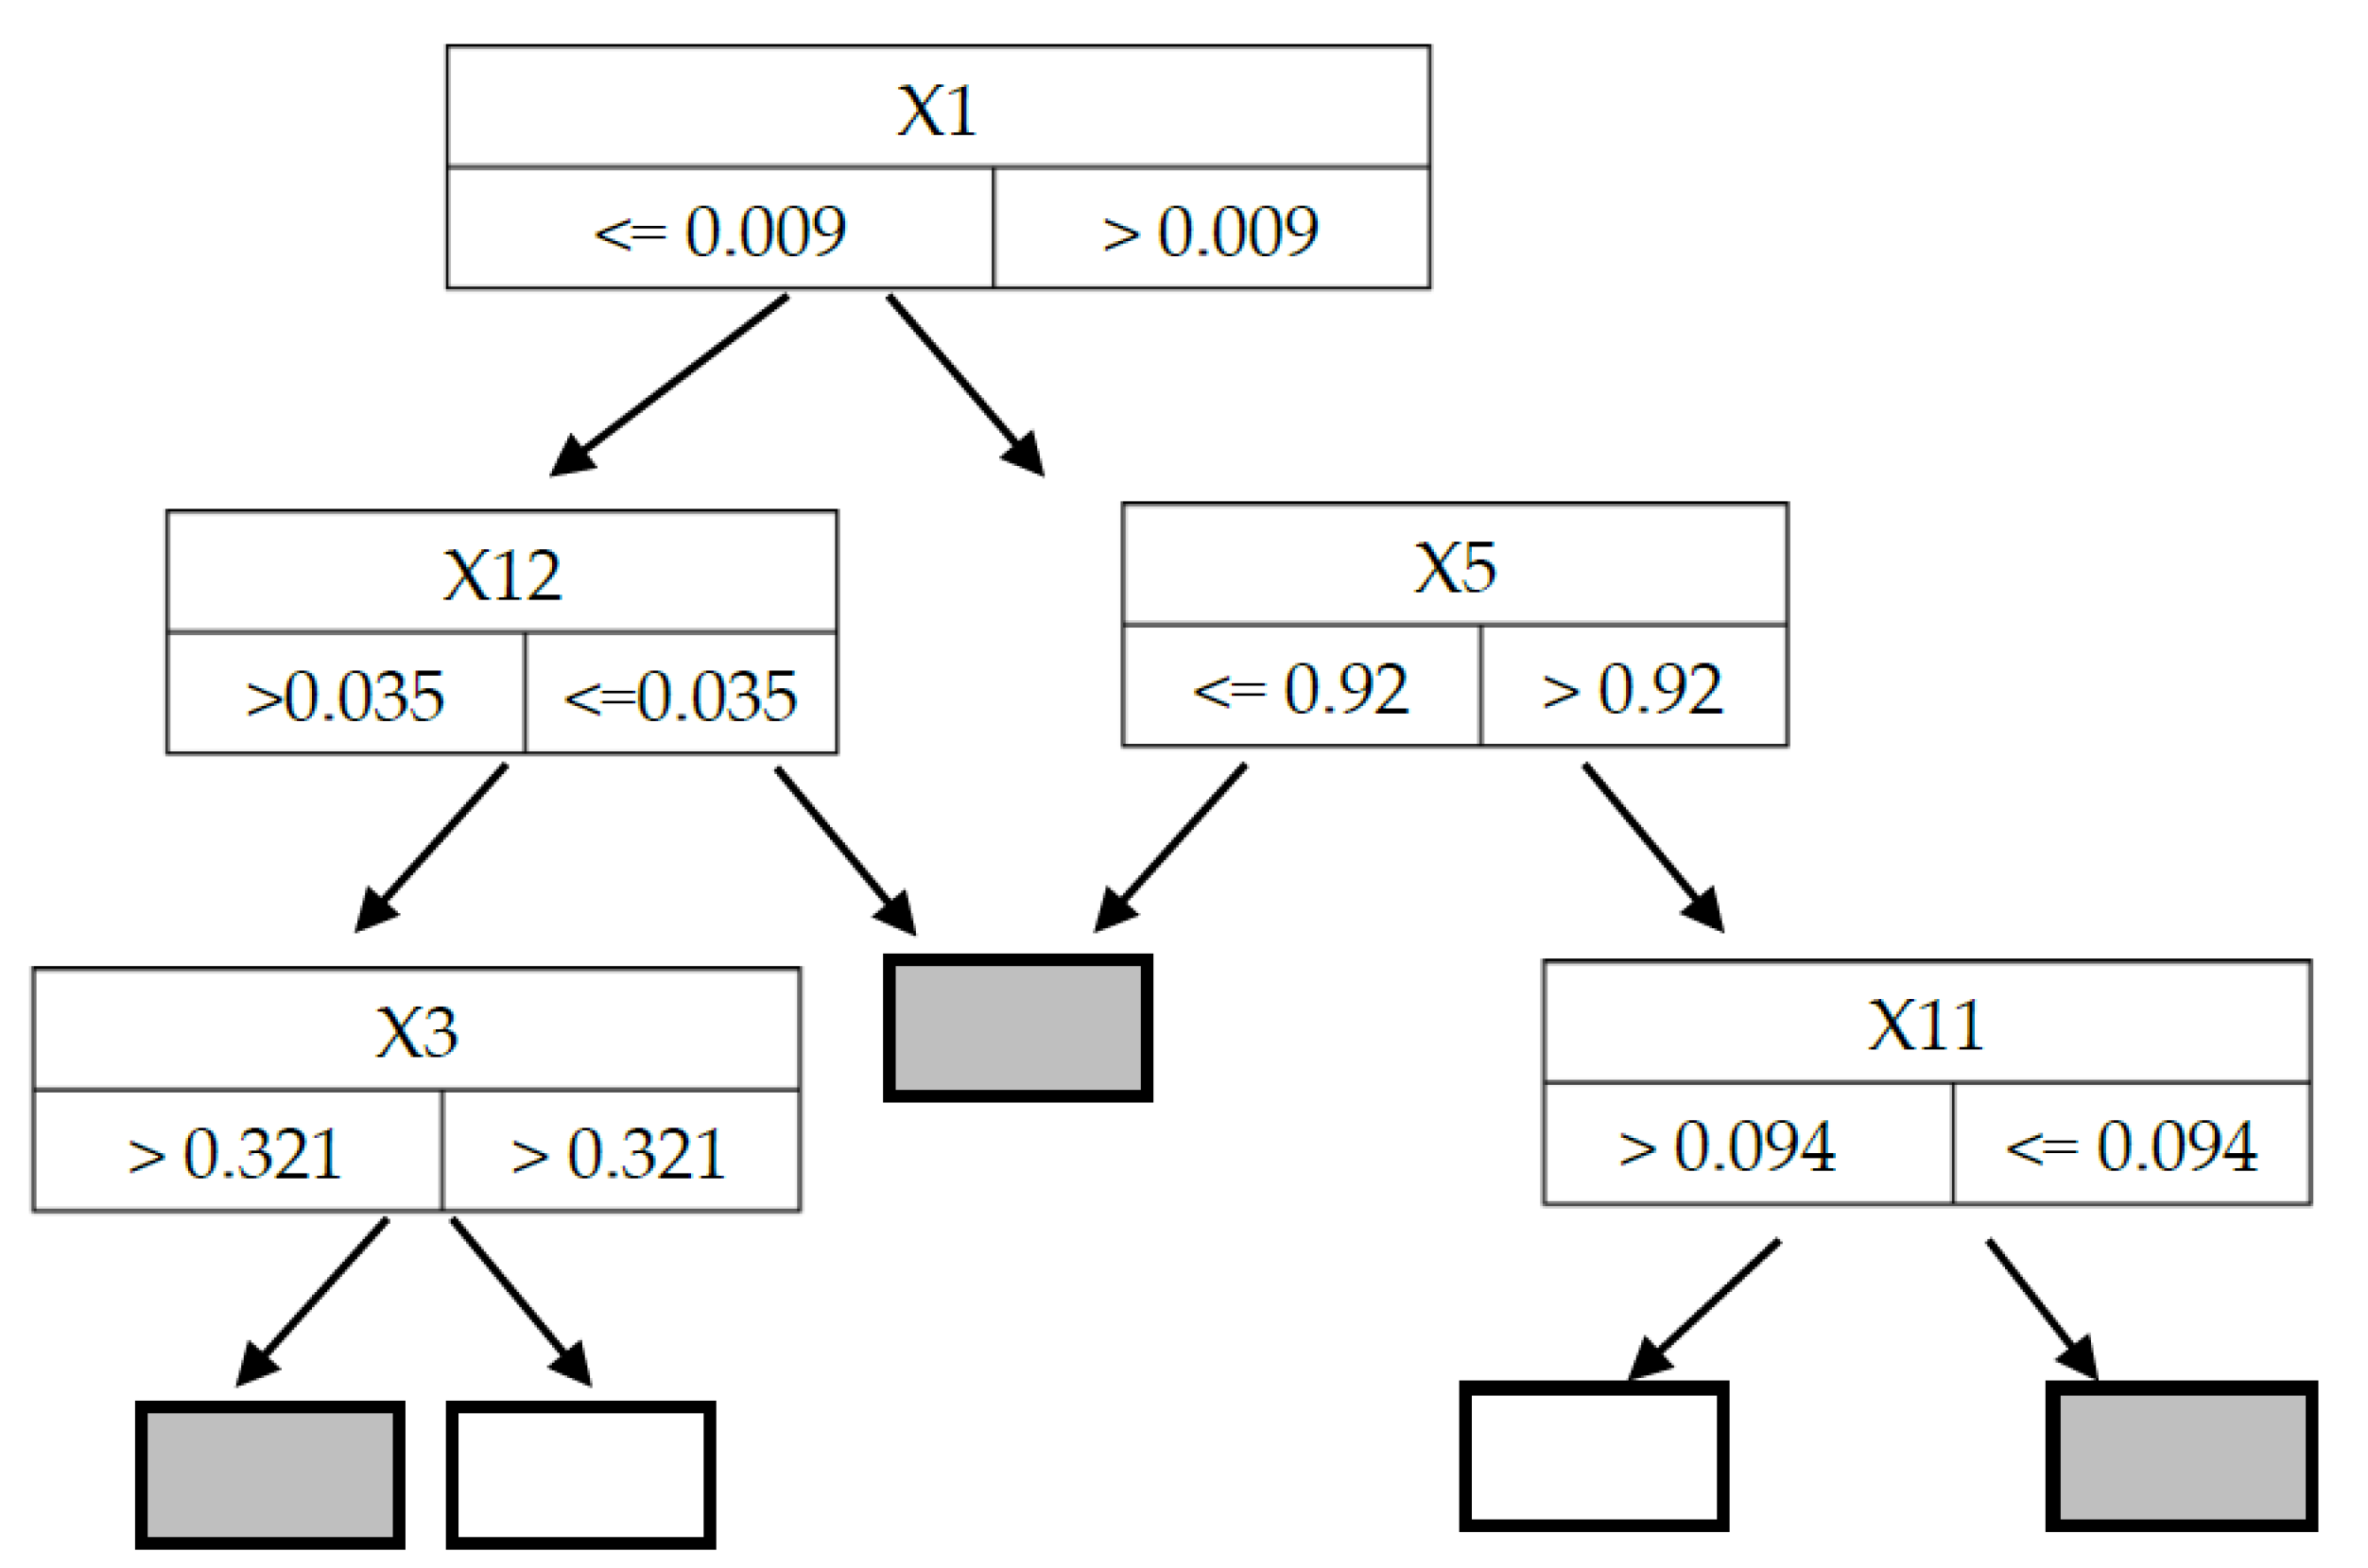
Figure 5 shows the structure of such decision trees for the analysis of Asian households. Once again, it is interesting to observe that, in the case of the C&RT model for European and Asian consumers, the models share only one common financial ratio (X5), and one demographic ratio (X11). The model for Taiwanese consumers comprises very distinct structure (
Figure 5) of five ratios compared to the model for a Polish household that is relatively simpler and consists of only three ratios. Two out of these five ratios are again ratios that include a combination of financial and demographic variables (X11 and X12).
Table 4 presents the results of all created models for European and Asian consumers obtained by the testing samples consisting of 500 bankrupt and 500 nonbankrupt households. Analyzing the results for European consumers, it can be seen that the highest effectiveness was achieved using the logit model, with 92.70% correct classifications. The second highest effectiveness was obtained by a multivariate discriminant analysis model (89.60% of correct classifications). The decision tree model is characterized by 85.60% effectiveness.
Although the C&RT model, for both European and Asian households, achieved the worst results, it is necessary to note that the effectiveness above 80% is considered a very good level of forecasting quality. Looking at the results of models for Asian households, it is evident that the logit model has the best predictive properties (90.10% effectiveness). The second-best model for the Asian sample is the MDA model with 87.70% correct predictions.
It is also interesting to note that all three forecasting models for Central European households generated fewer Type I errors (E1) than did models developed for evaluating Far-East Asian consumers. Such errors indicate how many bankrupt consumers are classified as nonbankrupt ones. Type I errors, for clear financial reasons, are far more dangerous than Type II errors (E2).
What it is more important to note is that the logit model has the fewest Type I errors for both European and Asian consumers, and, is the only model that achieved effectiveness above 90%. Based on overall effectiveness and Type I errors among all six models, both logit models are shown to be the best bankruptcy predictive techniques for households from analyzed economic regions. The multivariate discriminant analysis models are the second-best models if we take into account overall effectiveness and Type I errors.
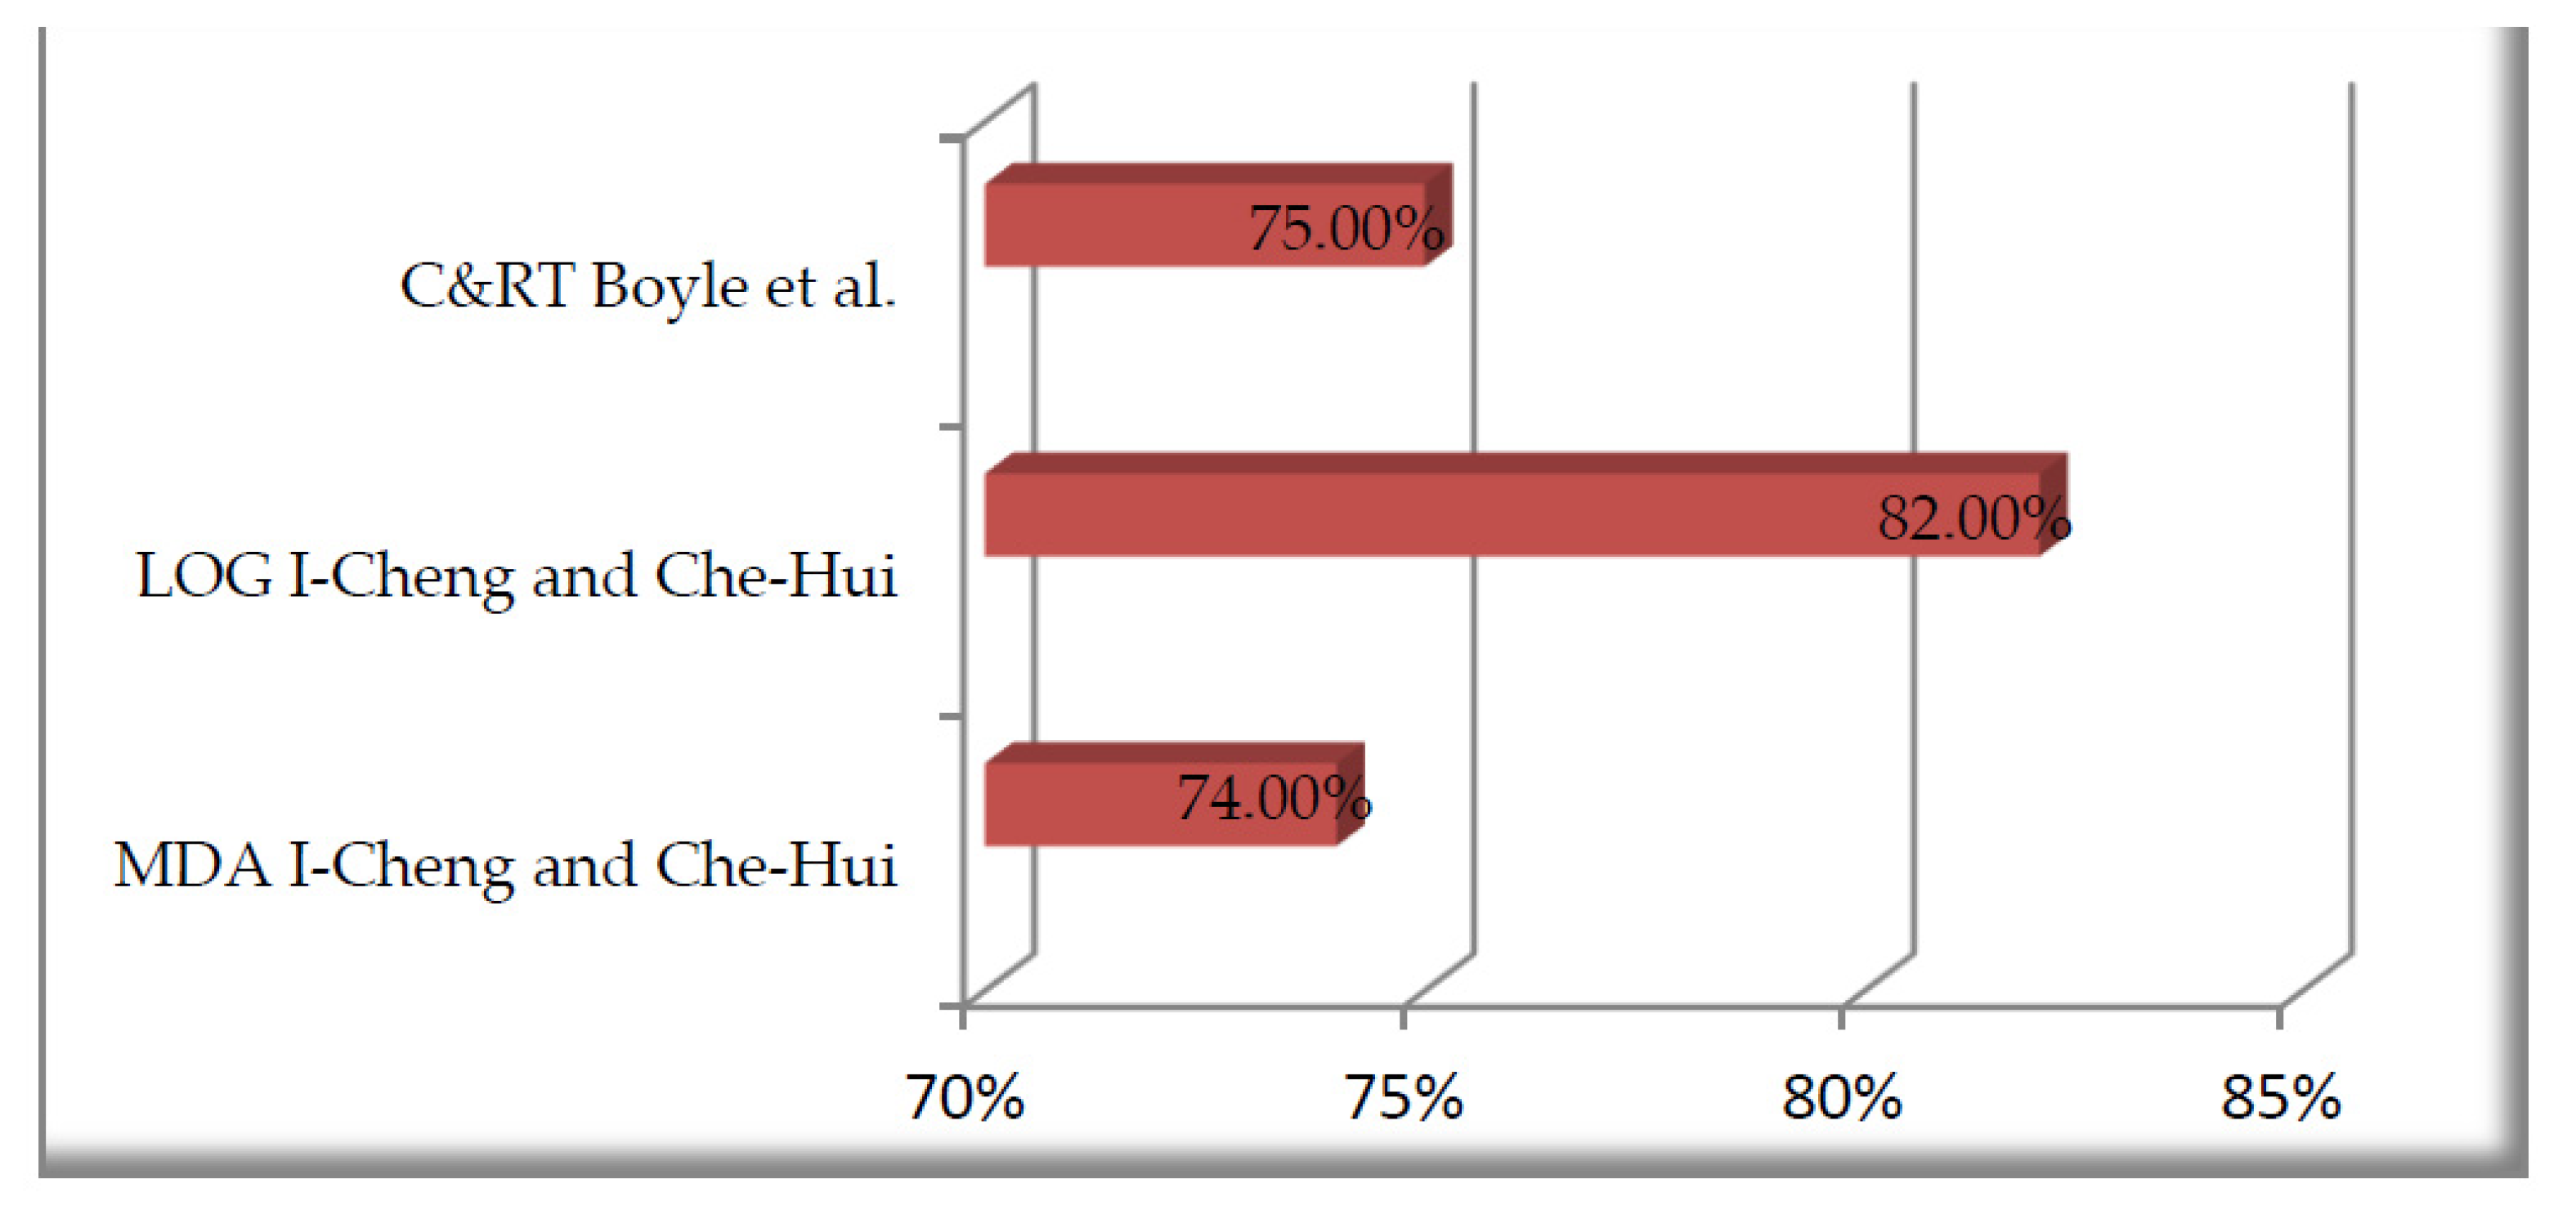
To enrich the study, the author conducted comparative analyses of overall effectiveness of created models (MDA, LOG, and C&RT) with effectiveness of models available in literature—MDA and LOG model of I-Cheng and Che-Hui [
32] for Taiwanese consumers, and C&RT model of Boyle et al. [
33] for British households. In both studies, the authors used traditional demographic and financial ratios without any attempt at combining both variables in one ratio as in the proposed research.
Comparing the overall effectiveness of the models found in literature for the effectiveness of models created by the author, it can be seen (
Figure 6) that the author’s models are characterized by:
10.6 percentage points better effectiveness in case of the C&RT model for Polish consumers and 8.7 percentage points in case of the C&RT model for Taiwanese consumers,
10.7 percentage points higher effectiveness in case of the LOG model for Polish households and 8.1 percentage points in case of the LOG model for Taiwanese consumers,
15.6 percentage points for better effectiveness in case of the MDA model for European households and 13.7 percentage points in case of the MDA model for Asian consumers.
Such results support the idea of creating the ratios that consists a combination of financial and demographic information. It is evident that proposed research generated much better effectiveness of the models and the created models are characterized by high versatility of usage in completely different economic regions.
5. Conclusions
Although many studies have aimed at forecasting the financial standing of the households, the vast majority of them used the individual financial or demographic variables without any attempts of combining these two very different types of information into one relation in the form of the ratios.
The presented empirical study shows that such a research approach aiming at using the set of demographic-financial ratios gives us a much wider spectrum of possibilities at evaluating the financial energy of consumers. We have to remember that a single demographic variable (e.g., age) or financial variable (e.g., annual income) itself does not support the forecasting model with a large load of information important from the point of view of financial strength of the household.
This paper presents one of the first attempts at implementing such ratios in the forecasting process in the literature worldwide. A conducted research approach provided clear evidence that developing the forecasting models with such ratios increases the versatility of the models. First, the models use relative values that allow using them in different countries and regions with different currencies and the level of wealth (e.g., with different values of the average income and credits taken). Second, the models consist of information that contains the relation of financial burden to demographic capabilities (e.g., high level of taken credits compared to young vs. an old age of the consumer, or a high level of taken credits in relation to a well-educated consumer vs. a poorly educated one). All these factors directly and indirectly influence the financial power of the household.
Moreover, this empirical study revealed that, among used statistical techniques, the logit models are the most effective for households in both economic regions. These models showed fewer Type I errors than Type II errors, and obtained the highest overall effectiveness of the forecast. Another conclusion is that the forecasting models for European and Asian consumers very often use the same type of proposed ratios, which means that similar information is necessary to evaluate the process of forecasting the financial energy of consumers, but the models for European households are characterized by a lower cost of the errors (smaller level of type I errors than type II errors).
The main limitation of the research is limited data access. The author met many obstacles and difficulties to collect the reliable data with such a wide variety of information. For each household, the data was collected and calculated individually. It was a long computational process. The author is going to continue the research toward the use of macroeconomic variables of selected countries in predicting the financial standing of consumers.


