
Increasing Access to Electricity: An Assessment of the Energy and Power Generation Potential from Biomass Waste Residues in Tanzania


Abstract
1. Introduction
2. Materials and Methods
2.1. Agricultural Residues
2.2. Forestry Waste
- The most important industrial plantation species are various species of pines, cypress, eucalyptus, and teak.
- Most of the commercial wood grown (~85%) is dominated by softwoods.
- Softwood plantations cover approximately 85% of the gross plantations area. This is dominated by varies species of pines.
- The remainder (15%) will be assumed to be made of various hardwood species.
2.3. Energy from Animal Waste
2.4. Urban Human Waste
3. Results
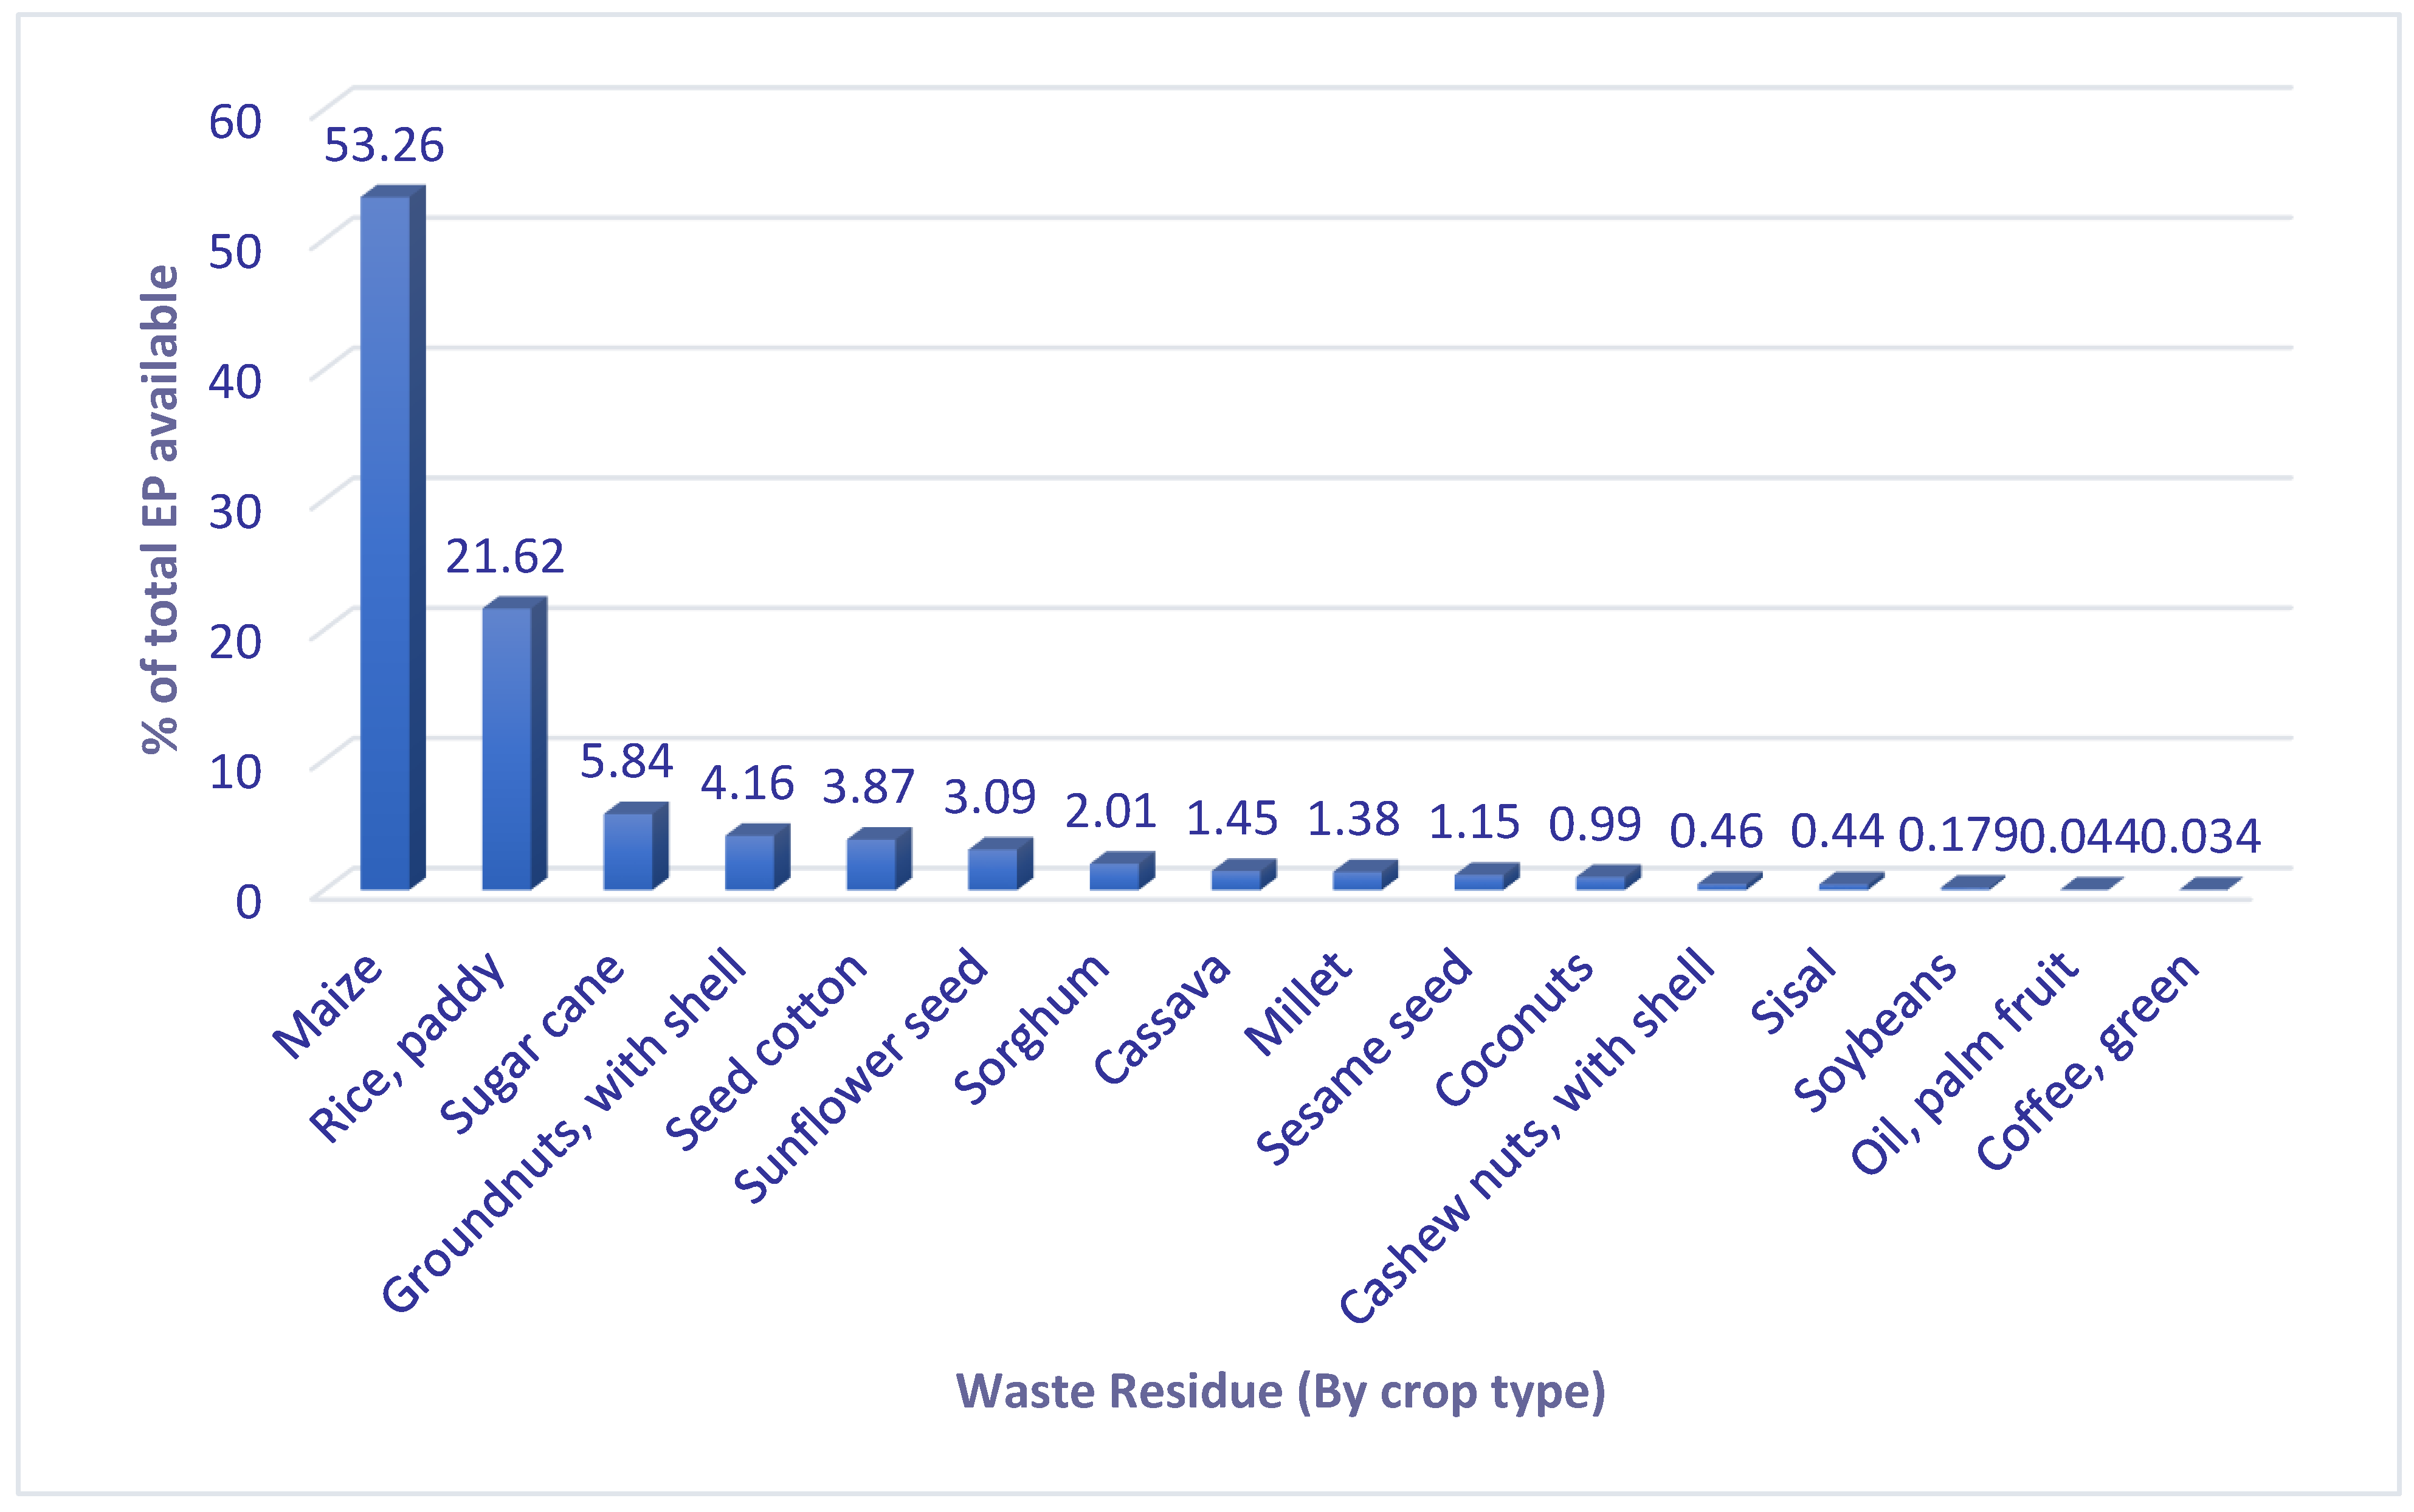
3.1. Agricultural Residues
3.2. Forestry Residues
3.3. Livestock Residues
3.4. Urban Human Residues
4. Discussion
4.1. Agricultural Residues
4.2. Forestry Residues
4.3. Livestock Residues
4.4. Urban Human Waste Residues
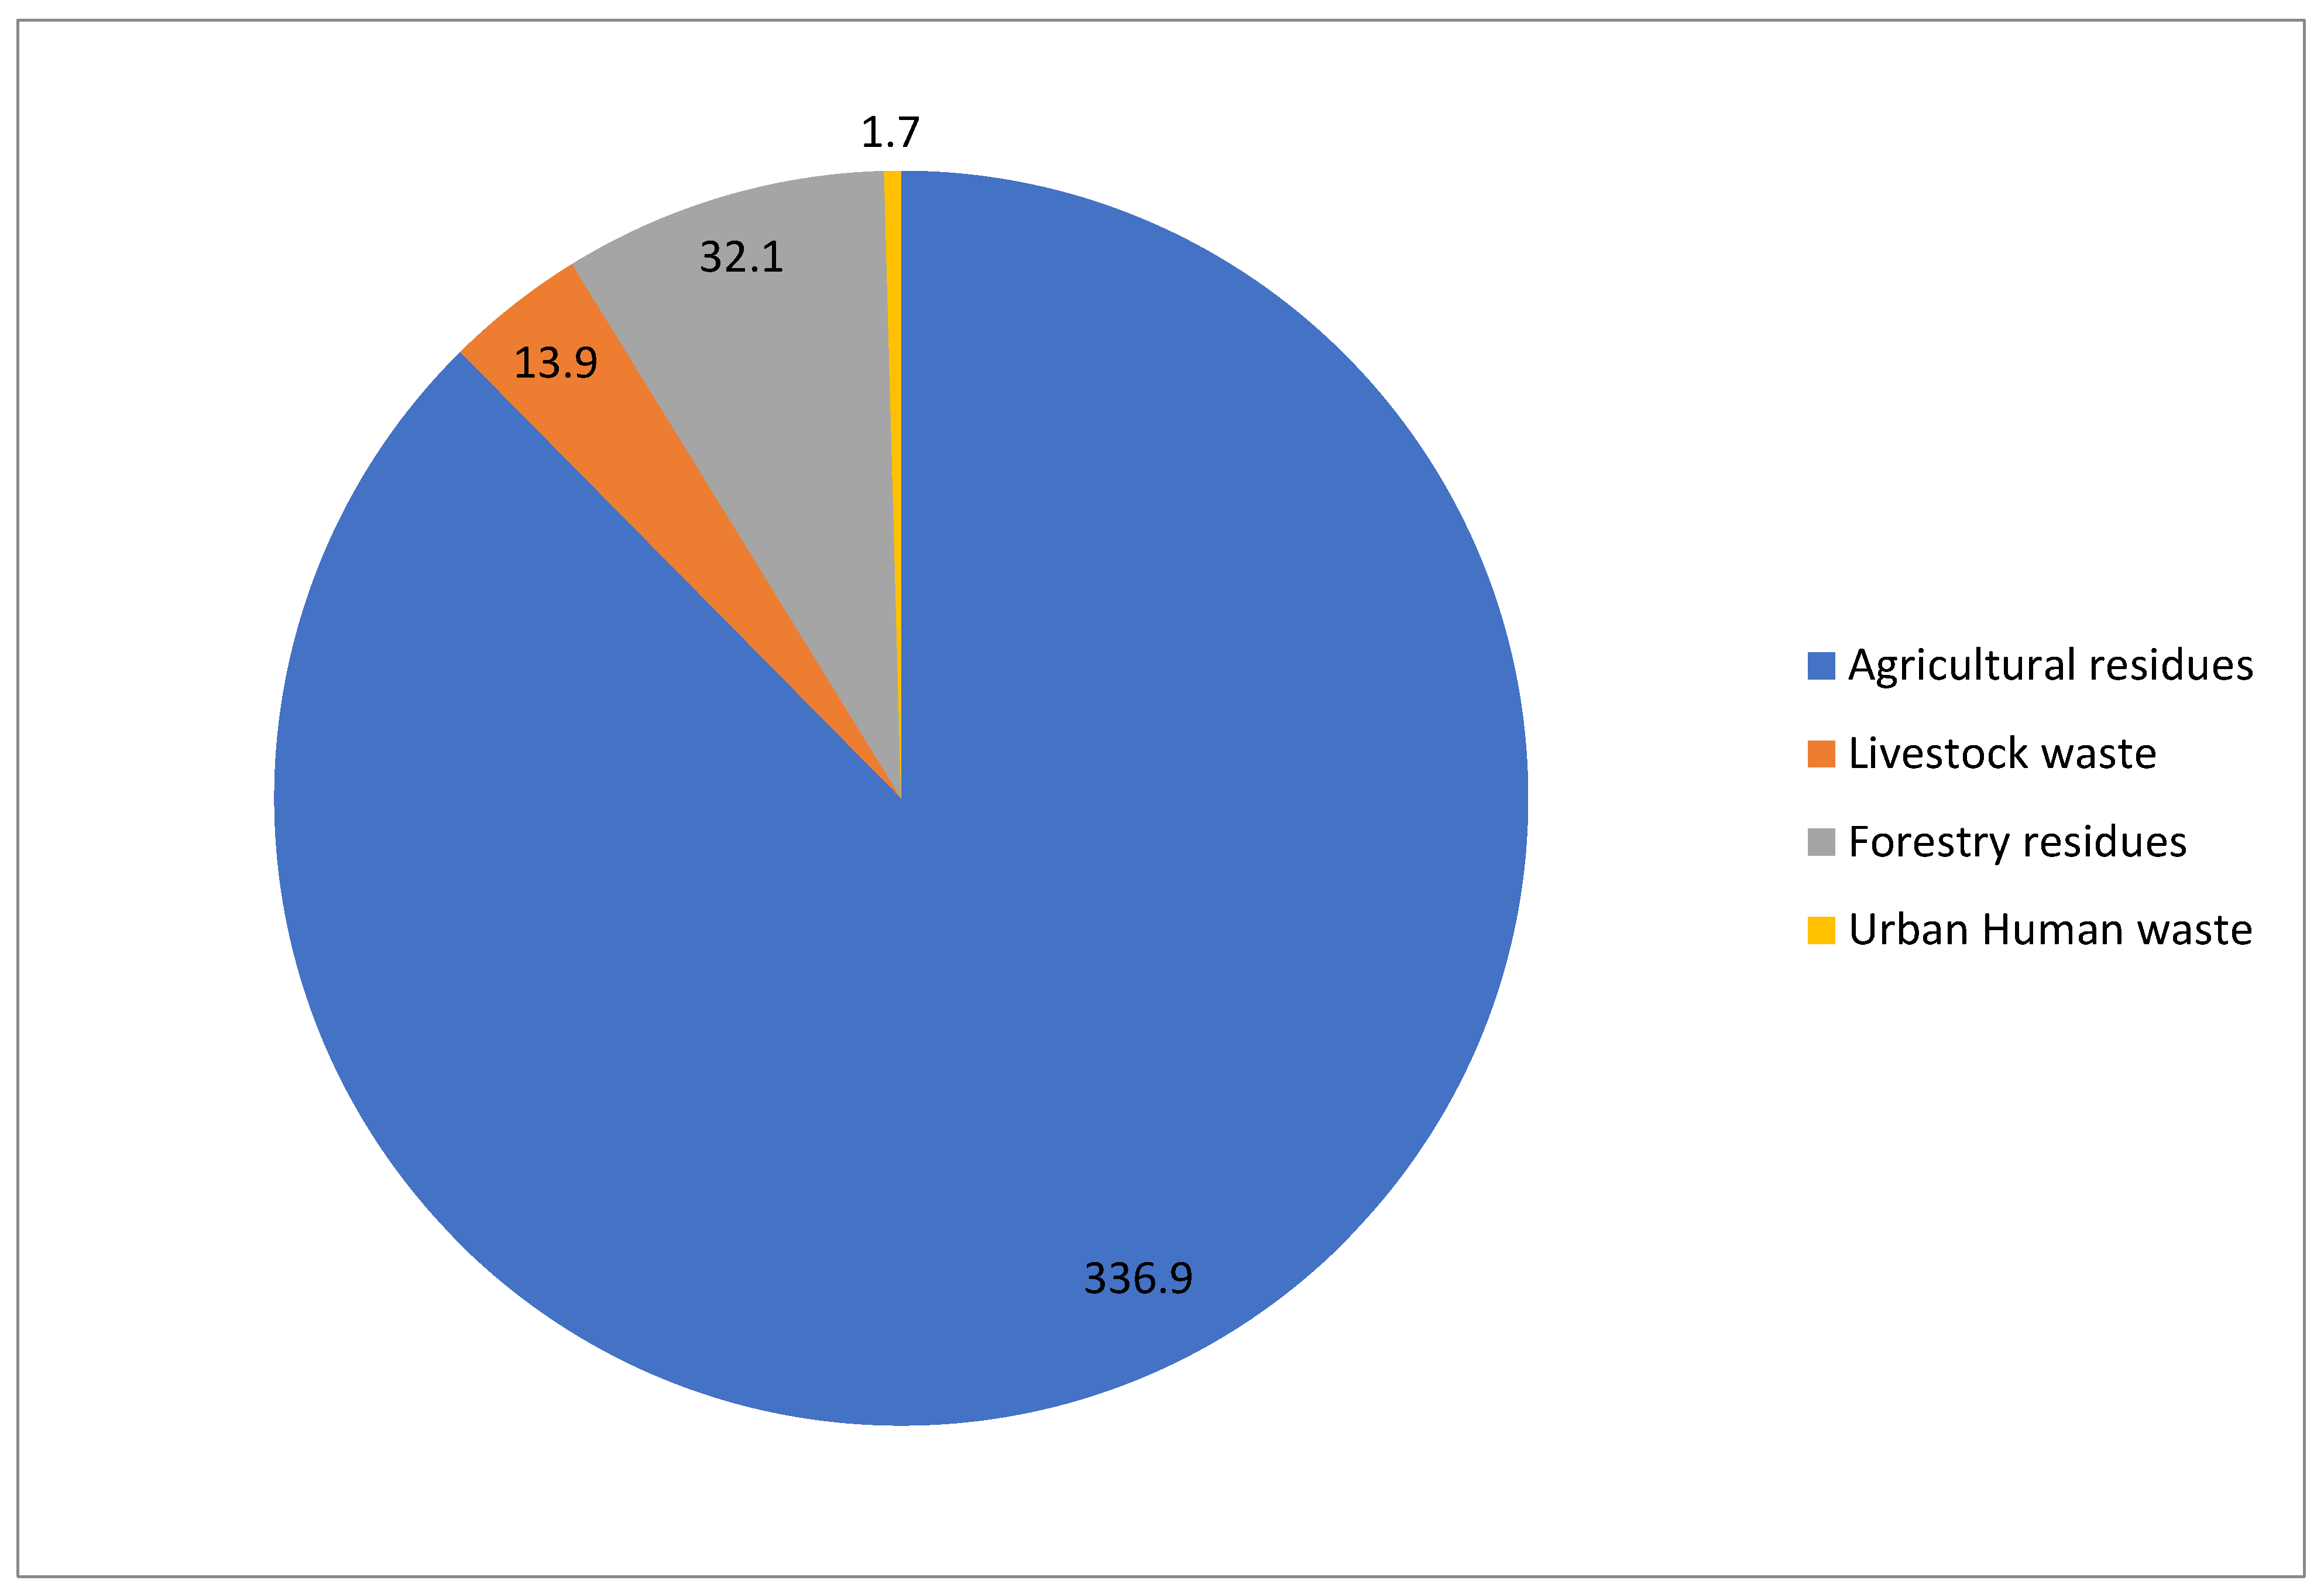
4.5. The Combined Energy Potential of All Four Waste Streams
5. Conclusions
Author Contributions
Funding
Institutional Review Board Statement
Informed Consent Statement
Data Availability Statement
Conflicts of Interest
Nomenclature & Abbreviations
| ABPmanure | Amount of biogas from recoverable manure (Nm3 yr−1) |
| AC | Alternating current |
| AD | Anaerobic digestion |
| AH | Annual harvest of the crop or product (t) |
| ARG | Amount of a residue generated annually (t yr−1) |
| CO2 | Carbon dioxide |
| CV | Calorific value |
| daf | Dry ash free |
| DC | Direct current |
| DM | Dry matter (kg head−1 day−1) |
| DMR | Amount of dry matter recoverable from a type of animal manure (kg DM yr−1) |
| EP | Energy potential |
| EPmanure | Energy potential of the recoverable manure (J yr−1) |
| EPresidue | Total energy potential of residue (J t−1) |
| EUF | Energy use factor (dimensionless) |
| FA | Fraction available |
| FAO | Food and Agriculture Organization (of the United Nations) |
| FR | Fraction of animal manure recoverable |
| GWh(e) | Gigawatt hour (equivalent) |
| ICE | Internal combustion engine |
| J | Joule |
| kt | Kilotonne |
| kWe | Kilowattequivalent |
| kW(h) | Kilowatt (hour) |
| LHVbiogas | Lower heating value of biogas |
| LHV | Lower heating value |
| MC | Moisture content |
| MW | Megawatt |
| NA | Number of animals |
| od | Oven dried |
| OECD | Organisation for Economic Cop-operation and Development |
| PJ | Petajoule |
| PV | Photovoltaic |
| REA | Rural Energy Agency |
| RPM | Revolutions per minute |
| RPR | Residue to product ratio |
| SAF | Surplus availability factor (dimensionless) |
| SG | Specific gravity |
| T&D | Transmission & distribution |
| VS | Fraction of volatile solids in dry matter (kg vs. kg−1 DM) |
| Ybiogas | Biogas yield (Nm3 kg−1 VS) |
Appendix A

| Species Name (Common/Scientific) | OD wt/Green Volume (g/cm3) | Source(s) |
|---|---|---|
| Slash Pine/Pinus elliottii | 0.54 | [78] |
| Caribbean Pine/Pinus caribaea | 0.51 | [80] |
| Patula Pine/Pinus patula | 0.45 | [81] |
| Khasi Pine/Pinus kesiya | 0.45 | [82] |
| Radiata Pine/Pinus radiata | 0.41 | [83] |
| African Juniper/Juniperus procera | 0.44 | [84] |
| Mexican Cypress/Cupressus lusitanica | 0.40 | [85] |
| Average SG | 0.457 |
| Species Name (Common/Scientific) | OD wt/Green Volume (g/cm3) | Source(s) |
|---|---|---|
| Black Wattle/Acacia mearnsii | 0.59 | [86] |
| Australian Blackwood/Acacia melanoxylon | 0.54 | [87] |
| Sheaok/Casuarina spp | 0.62 | [97] |
| Spanish Cedar/Cedrela odorata | 0.38 | [88] |
| Camphor/Cinnamomum camphora | 0.43 | [89] |
| Iroko/Chlorophora regia | 0.55 | [79] |
| River Red Gum/Eucalyptus camaldulensis | 0.67 | [90] |
| Blue Gum/Eucalyptus maidenii | 0.68 | [91] |
| Rose Gum/Eucalyptus grandis | 0.48 | [92] |
| Southern Silky Oak/Grevillea robusta | 0.49 | [93] |
| Olive/Olea capensis | 0.72 | [94] |
| Idigbo/Terminalia ivorensis) | 0.43 | [95] |
| Teak/Tectona grandis | 0.55 | [96] |
| Average SG | 0.548 |
| Animal | Fresh Waste (kg/Head/Day) | Source |
|---|---|---|
| Cattle–Beef | 5 | [49] |
| Cattle–Dairy | 15 | [49] |
| Chicken | 0.03 | [49] |
| Pigs 1 | 1.2 | [49] |
| Sheep | 1 | [106] |
| Goat | 1 | [106] |
| Animal | FA | (%) DM | VS/DM Ratio | Biogas Yield (m3/kg VS) |
|---|---|---|---|---|
| Cattle–Beef | 0.5 [49] | 17.44 [49] | 0.934 [107] | 0.307 [49] |
| Cattle–Dairy | 0.8 [49] | 17.44 [49] | 0.934 [107] | 0.307 [49] |
| Chicken | 0.8 [49] | 33.99 [49] | 0.465 [107] | 0.18 [107] |
| Pigs | 0.8 [49] | 35.22 [49] | 0.893 [107] | 0.217 [49] |
| Sheep | 0.3 [50] | 25 [108] | 0.912 [107] | 0.31 [107] |
| Goat | 0.4 [50] | 25 [108] | 0.598 [107] | 0.31 [107] |
References
- United Nations. Goal 7: Ensure Access to Affordable, Reliable, Sustainable and Modern Energy for All. 2016. Available online: https://unstats.un.org/sdgs/report/2016/goal-07/ (accessed on 16 November 2020).
- IBRD-IDA. Population, Total 2021a, The World Bank Group—DataBank. Available online: https://data.worldbank.org/indicator/SP.POP.TOTL?locations=TZ (accessed on 17 November 2020).
- IBRD-IDA. % of the Population with Access to Electricity, Total in Tanzania. The World Bank Group—DataBank. 2021. Available online: https://data.worldbank.org/indicator/EG.ELC.ACCS.ZS?locations=TZ (accessed on 17 November 2020).
- IBRD-IDA. Rural population (% of Total Population) in Tanzania. The World Bank Group—DataBank. 2021. Available online: https://data.Worldbank.org/indicator/SP.RUR.TOTL.ZS?locations=TZ (accessed on 17 November 2020).
- IBRD-IDA. Access to Electricity, Rural (% of Rural Population) in Tanzania. The World Bank Group. 2021. Available online: https://data.worldbank.org/indicator/EG.ELC.ACCS.RU.ZS?locations=TZ (accessed on 17 November 2020).
- IEA. Africa Energy Outlook 2019. Overview: Tanzania. World Energy Outlook Special Report. 2019. Available online: www.iea.org/reports/africa-energy-outlook-2019 (accessed on 14 February 2021).
- Ahlborg, H.; Hammar, L. Drivers and barriers to rural electrification in Tanzania and Mozambique—Grid-extension, off-grid, and renewable energy technologies. Renew. Energy 2014, 61, 117–124. [Google Scholar] [CrossRef]
- Bertheau, P.; Cader, C.; Müller, H.; Blechinger, P.; Seguin, R.; Breyer, C. Energy Storage Potential for Solar Based Hybridization of Off-grid Diesel Power Plants in Tanzania. Energy Procedia 2014, 46, 287–293. [Google Scholar] [CrossRef]
- The United Republic of Tanzania. Tanzania’s SE4ALL Action Agenda; UNDP, Ed.; Ministry of Energy and Minerals: Dar es Salaam, Tanzania, 2015.
- Moner-Girona, M.; Ghanadan, R.; Solano-Peralta, M.; Kougias, I.; Bódis, K.; Huld, T.; Szabó, S. Adaptation of Feed-in Tariff for remote mini-grids: Tanzania as an illustrative case. Renew. Sustain. Energy Rev. 2016, 53, 306–318. [Google Scholar] [CrossRef]
- Teske, S.; Morris, T.; Kriti, N. 100% Renewable Energy for Tanzania—Access to Renewable and Affordable Energy for All within One Generation. Report Prepared by ISF for Bread for the World. October 2017. Available online: https://www.worldfuturecouncil.org/wp-content/uploads/2017/11/Tanzania-Report-8_Oct-2017-BfdW_FINAL.pdf (accessed on 14 February 2021).
- African Development Group. Renewable Energy in Africa: TANZANIA Country Profile; Immeuble du Centre de Commerce International d’Abidjan—CCIA: Abidjan, Côte d’Ivoire, 2015. [Google Scholar]
- Felix, M.; Gheewala, S.H. A Review of Biomass Energy Dependency in Tanzania. Energy Procedia 2011, 9, 338–343. [Google Scholar] [CrossRef]
- Titcombe, M.; Simcik, M. Personal and indoor exposure to PM2.5 and polycyclic aromatic hydrocarbons in the southern highlands of Tanzania: A pilot-scale study. Environ. Monit. Assess. 2011, 180, 461–476. [Google Scholar] [CrossRef] [PubMed]
- Aberilla, M.J.; Gallego-Schmid, A.; Azapagic, A. Environmental sustain ability of small-scale biomass power technologies for agricultural communities in developing countries. Renew. Energy 2019, 141, 493–506. [Google Scholar] [CrossRef]
- Kemausuor, F.; Adaramola, M.S.; Morken, S. A Review of Commercial Biogas Systems and Lessons for Africa. Energies 2018, 11, 2984. [Google Scholar] [CrossRef]
- Rupf, G.V.; Bahri, P.A.; de Boer, K.; McHenry, M.P. Broadening the potential of biogas in Sub-Saharan Africa: An assessment of feasible technologies and feedstocks. Renew. Sustain. Energy Rev. 2016, 61, 556–571. [Google Scholar] [CrossRef]
- Kusekwa, M.A. Biomass Conversion to Energy in Tanzania: A Critique. In New Developments in Renewable Energy [online]; Arman, H., Yuksel, I., Eds.; InTechOpen: London, UK, 2013; Available online: https://www.intechopen.com/books/new-developments-in-renewable-energy/biomass-conversion-to-energy-in-tanzania-a-critique (accessed on 14 February 2021).
- Ferronato, N.; Torretta, V. Waste Mismanagement in Developing Countries: A Review of Global Issues. Int. J. Environ. Res. Public Health 2019, 16, 1060. [Google Scholar] [CrossRef]
- Lebuhn, M.; Munk, B.; Effenberger, M. Agricultural biogas production in Germany—From practice to microbiology basics. Energy Sustain. Soc. 2014, 4, 1–21. [Google Scholar] [CrossRef]
- FAO. Burning—Crop Residues. Food and Agricultural Organisation of the United Nations. 2021. Available online: http://www.fao.org/faostat/en/#data/GB (accessed on 17 February 2021).
- Clauser, N.M.; González, G.; Mendieta, C.M.; Kruyeniski, J.; Area, M.C.; Vallejos, M.E. Biomass Waste as Sustainable Raw Material for Energy and Fuels. Sustainability 2021, 13, 794. [Google Scholar] [CrossRef]
- Laramee, J.; Davis, J. Economic and environmental impacts of domestic bio-digesters: Evidence from Arusha, Tanzania. Energy Sustain. Dev. 2013, 17, 296–304. [Google Scholar] [CrossRef]
- Gebreegziabher, Z.; Naik, L.; Melamu, R.; Balana, B.B. Prospects and challenges for urban application of biogas installations in Sub-Saharan Africa. Biomass Bioenergy 2014, 70, 130–140. [Google Scholar] [CrossRef]
- Chaves, L.I.; DaSilva, M.J.; Melegari de Souza, S.N.; Secco, D.; Rosa, H.A.; Nogueria, C.E.C.; Frigo, E.P. Small-scale power generation analysis: Downdraft gasifier coupled to engine generator set. Renew. Sustain. Energy Rev. 2016, 58, 491–498. [Google Scholar] [CrossRef]
- LTS International Limited, T.U.o. Edinburgh, and E4tech. Bioenergy for Sustainable Energy Access in Africa. In Project Completion and Handover Report; Penicuik: Scotland, UK, 2017. [Google Scholar]
- Roopnarain, A.; Adeleke, R. Current status, hurdles and future prospects of biogas digestion technology in Africa. Renew. Sustain. Energy Rev. 2017, 67, 1162–1179. [Google Scholar] [CrossRef]
- Park, C.S.; Roy, P.S.; Kim, S.H. Current Developments in Thermochemical Conversion of Biomass to Fuels and Chemicals, Gasification for Low-Grade Feedstock. In Gasification-for-Low-Grade-Feedstock [online]; Yun, Y., Ed.; InTechOpen: London, UK, 2018; Available online: https://www.intechopen.com/books/gasification-for-low-grade-feedstock/current-developments-in-thermochemical-conversion-of-biomass-to-fuels-and-chemicals (accessed on 17 November 2020). [CrossRef]
- Bhattacharyya, S.C. Viability of off-grid electricity supply using rice husk: A case study from South Asia. Biomass Bioenergy 2014, 68, 44–54. [Google Scholar] [CrossRef]
- Lyakurwa, F.S. Assessment of the energy potential of crop residues and animal wastes in Tanzania. Indep. J. Manag. Prod. 2016, 7, 1227–1239. [Google Scholar] [CrossRef]
- Terrapon-Pfaff, J.C. Linking Energy- and Land-Use Systems: Energy Potentials and Environmental Risks of Using Agricultural Residues in Tanzania. Sustainability 2012, 4, 278–293. [Google Scholar] [CrossRef]
- Overend, R. Village Power ’98 Scaling Up Electricity Access for Sustainable Rural Development. In Status of Biomass Gasifier Village Systems in Village Power ’98; World Bank Headquarters, National Renewable Energy Laboratory: Washington, DC, USA, 1988. [Google Scholar]
- Dasappa, S. Potential of biomass energy for electricity generation in sub-Saharan Africa. Energy Sustain. Dev. 2011, 15, 203–213. [Google Scholar] [CrossRef]
- Martínez, J.D.; Mahkamov, K.; Andrade, R.V.; Silva Lora, E.E. Syngas production in downdraft biomass gasifiers and its application using internal combustion engines. Renew. Energy 2012, 38, 1–9. [Google Scholar] [CrossRef]
- Tinaut, F.V.; Melgar, A.; Horrillo, A.; Díez de la Rosa, A. Method for predicting the performance of an internal combustion engine fuelled by producer gas and other low heating value gases. Fuel Process. Technol. 2006, 87, 135–142. [Google Scholar] [CrossRef]
- Garcia-Bacaicoa, P.; Bilbao, R.; Arauzo, R.; Luisa Salvadoret, M. Scale-up of downdraft moving bed gasifiers (25–300 kg/h)—Design, experimental aspects and results. Bioresour. Technol. 1994, 48, 229–235. [Google Scholar] [CrossRef]
- Dogru, M.; Howarth, C.R.; Akay, G.; Keskinler, B.; Malike, A.A. Gasification of hazelnut shells in a downdraft gasifier. Energy 2002, 27, 415–427. [Google Scholar] [CrossRef]
- Kirubakaran, V.; Sivaramakrishnan, V.; Nalini, R.; Sekar, T.; Premalatha, M.; Subramanian, P. A review on gasification of biomass. Renew. Sustain. Energy Rev. 2009, 13, 179–186. [Google Scholar] [CrossRef]
- Tippayawong, N.; Promwungkwa, P.; Rerkkriangkrai, P. Long-term operation of a small biogas/diesel dual-fuel engine for on-farm electricity generation. Biosyst. Eng. 2007, 98, 26–32. [Google Scholar] [CrossRef]
- Dasappa, S.; Subbukrishna, D.N.; Suresh, K.C.; Paul, P.J.; Prabhu, G.S. Operational experience on a grid connected 100 kWe biomass gasification power plant in Karnataka, India. Energy Sustain. Dev. 2011, 15, 231–239. [Google Scholar] [CrossRef]
- Dasappa, S.; Sridhar, H.V.; Rajan, N.K.S.; Paul, P.J.; Upasani, A. Producer gas engines—Proponent of clean energy technology. In Proceedings of the 15th European Biomass Conference and Exhibition, Berlin, Germany, 7–11 May 2007. [Google Scholar]
- Dasappa, S.; Sridhar, S.H. Performance of a diesel engine in a dual fuel mode using producer gas for electricity power generation. Int. J. Sustain. Energy 2013, 32, 153–168. [Google Scholar] [CrossRef]
- Hirsch, A.; Yael, P.; Josep, G. Microgrids: A review of technologies, key drivers, and outstanding issues. Renew. Sustain. Energy Rev. 2018, 90, 402–411. [Google Scholar] [CrossRef]
- Eisentraut, A. Sustainable Production of Second-Generation Biofuels: Potential and Perspectives in Major Economies and Developing Countries; IEA Energy Papers, No. 2010/01; OECD Publishing: Paris, France, 2010. [Google Scholar]
- FAO. FAOSTAT Official Crops Processed Data. Food & Agriculture Organisation of the United Nations (FAOSTAT). 2021. Available online: http://www.fao.org/faostat/en/#data/QC (accessed on 19 January 2021).
- IEA. IEA—Statistics Search Tanzania, United Republic of Tanzania, United Republic IEA Atlas of Energy 2021. Total Electricity Generation in TWh by Country. Available online: https://www.iea.org/data-and-statistics/data-tables?country=TANZANIA&energy=Electricity&year=2018 (accessed on 19 January 2021).
- Bhattacharya, S.C.; Pham, H.L.; Shrestha, R.M.; Vu, Q.V. CO2 Emissions due to Fossil and Traditional Fuels, Residues and Wastes in Asia. In Proceedings of the AIT Workshop on Global Warming Issues in Asia, Bangkok, Thailand, 1–3 July 1993; AIT: Bangkok, Thailand, 1993. [Google Scholar]
- Koopmans, A.; Koppejan, J. Agricultural and Forest Residues—Generation, Utilization and Availability. In Proceedings of the Regional Consultation on Modern Applications of Biomass Energy, Kuala Lumpur, Malaysia, 6–10 January 1997. [Google Scholar]
- Sajjakulnukit, B.; Yinguad, R.; Maneekhao, V.; Pongnarintasut, V.; Bhattacharya, S.C.; Abdul Salam, P. Assessment of sustainable energy potential of non-plantation biomass resources in Thailand. Biomass Bioenergy 2005, 29, 214–224. [Google Scholar] [CrossRef]
- Simonyan, K.J.; Fasina, O. Biomass resources and bioenergy potentials in Nigeria. Afr. J. Agric. Res. 2013, 8, 4975–4989. [Google Scholar]
- Philippine Coconut Authority (PCA). Technical Data Handbook on the Coconutts Products and by-Products; Philippine Coconut Authority: Diliman, Quezon City, Philippines, 1979.
- Ma, A.N.; Ong, A.S.H. Biomass Energy from the Palm Oil Industry. In Proceedings of the ASEAN Conference on Energy from Biomass, Penang, Malaysia, 13–15 October 1986. [Google Scholar]
- Lim, K.O. The energy potential and current utilization of agriculture and logging wastes in Malaysia. Renew. Energy Rev. 1986, 8, 57–75. [Google Scholar]
- Kabissa, J.C.B. Cotton and Its by-Products in the United Republic of Tanzania; UNCTAD: Geneva, Switzerland, 2016. [Google Scholar]
- Terrapon-Pfaff, J.C.; Fischedick, M.; Monheim, H. Energy potentials and sustainability—The case of sisal residues in Tanzania. Energy Sustain. Dev. 2012, 16, 312–319. [Google Scholar] [CrossRef]
- Jekayinfa, S.O.; Scholz, V. Potential Availability of Energetically Usable Crop Residues in Nigeria. Energy Sources Part A Recovery Util. Environ. Effects 2009, 31, 687–697. [Google Scholar] [CrossRef]
- AIT-EEC. Evaluation and Selection of Lingo-Cellulose Wastes Which Can Be Converted into Substitute Fuels; AIT-EEC: Brussels, Belgium, 1983. [Google Scholar]
- Vimal, O.P.; Tyagi, P.D. Energy from Biomass—An Indian Experience; Agricole Publishing Academy: New Delhi, India, 1984. [Google Scholar]
- Ryan, P.; Openshaw, K. Assessment of Biomass Energy Resources: A Discussion on Its Needs and Methodology; Energy Series Paper 48; Industry and Energy Department: Washington, DC, USA, 1991. [Google Scholar]
- Vimal, O.P. Residue utilization, management of agricultural and agro industrial residues of selected tropical crops (Indian experience). In Proceedings of the UNEP/ESCAP/FAO Workshop on Agricultural and Agro Industrial Residue Utilization in Asia and Pacific Region, Pattaya, Thailand, 10–14 December 1979; UNEP: Moscaow, Russia, 1984. [Google Scholar]
- U.S. Agency for International Development. Baling Sugarcane Tops and Leaves: The Thai Experience; Prepared by Winrock International, Report No. 91-15. Document No PN-ABI-900; Office of Energy and Infrastructure: Arlington, VA, USA, 1989.
- Şahin, S.; Elhussein, E.A.A. Assessment of sesame (Sesamum indicum L.) cake as a source of high-added value substances: From waste to health. Phytochem. Rev. 2018, 17, 691–700. [Google Scholar] [CrossRef]
- Yasothai, R. Processing method and composition of sesame oil cake—A review. Int. J. Sci. Environ. Technol. 2014, 3, 993–996. [Google Scholar]
- Yasothai, R. Energy content and protein quality of sesame oil cake—A review. Int. J. Sci. Environ. Technol. 2014, 3, 901–904. [Google Scholar]
- Pathak, N.K.; Kamra, D.N. A Text Book of Livestock Feeding in Tropics; A Falcon Book from Cosmo Publications; Cosmo Publications: New Delhi, India, 1989; pp. 246–257. [Google Scholar]
- Mehta, B.V. Sea Millennium Handbook 2000; The Solvent Extractors Association of India: Mumbai, India, 1989; Volume 7. [Google Scholar]
- Swick, R. Considerations in using protein meals for poultry. Poult. Fortune 2001, 2, 30–38. [Google Scholar]
- Ozyuguran, A.; Akturk, A.; Yaman, S. Optimal use of condensed parameters of ultimate analysis to predict the calorific value of biomass. Fuel 2018, 214, 640–646. [Google Scholar] [CrossRef]
- Heuzé, V.; Tran, G.; Hassoun, P.; Bastianelli, D.; Lebas, F. Cottonseed Meal. 2020, Feedipedia, a Programme by INRA, CIRAD, AFZ and FAO. Available online: https://www.feedipedia.org/node/550 (accessed on 5 January 2021).
- Magasiner, N.; de Kock, J.W. Design criteria for fibrous fuel fired boilers. Energy World 1987, 8–9, 4–12. [Google Scholar]
- ECN. Phyllis2, Database for (Treated) Biomass, Algae, Feedstocks for Biogas Production and Biochar. ECN.TNO. 2021. Available online: https://phyllis.nl/Biomass/View/370 (accessed on 5 January 2021).
- Gerçel, H.F. The production and evaluation of bio-oils from the pyrolysis of sunflower-oil cake. Biomass Bioenergy 2002, 23, 307–314. [Google Scholar] [CrossRef]
- FAO. Sunflower Crude and Refined Oils. In Agribusiness Handbook; FAO, Ed.; FAO Investment Centre Division: Rome, Italy, 2010. [Google Scholar]
- ECN. Phyllis2, Database for (Treated) Biomass, Algae, Feedstocks for Biogas Production and Biochar. ECN. TNO Biomass & Energy Efficiency. Sunflower Seed Husk (#378). 2021. Available online: https://www.ecn.nl/phyllis2/Biomass/View/378 (accessed on 5 January 2021).
- Bhattacharya, S.C.A.S.; Runqing, P.; Somashekar, H.; Racelis, H.I.; Rathnasiri, D.A.; Yingyuad, P.G. An assessment of the potential for non-plantation biomass resources in selected Asian countries for 2010. Biomass Bioenergy 2005, 29, 153–166. [Google Scholar] [CrossRef]
- FAO. Official Forestry Data. Food & Agricultural Organisation to the UN (FAOSTAT). 2021. Available online: http://www.fao.org/faostat/en/#data/FO (accessed on 5 January 2021).
- Ngaga, Y.M. Forest Plantations and Woodlots in Tanzania; African Forest Forum Working Paper Series; African Forest Forum: Nairobi, Kenya, 2011; Volume 1, Available online: https://landmatrix.org/media/uploads/sifisewp-contentuploads201202forest-plantations-and-woodlots-in-tanzaniapdf.pdf (accessed on 5 January 2021).
- The Wood Database. Slash Pine|The Wood Database—Lumber Identification. 2021. Available online: http://www.wood-database.com/slash-pine/ (accessed on 5 January 2021).
- The Wood Database. Iroko|The Wood Database—Lumber Identification (Hardwood). 2021. Available online: http://www.wood-database.com/iroko/ (accessed on 5 January 2021).
- The Wood Database. Caribbean Pine|The Wood Database—Lumber Identification 2021. Available online: http://www.wood-database.com/caribbean-pine/ (accessed on 5 January 2021).
- The Wood Database. Patula Pine|The Wood Database—Lumber Identification. 2021. Available online: http://www.wood-database.com/patula-pine/ (accessed on 5 January 2021).
- The Wood Database. Khasi Pine|The Wood Database—Lumber Identification (Hardwood). 2021. Available online: http://www.wood-database.com/khasi-pine/ (accessed on 5 January 2021).
- The Wood Database. Radiata Pine|The Wood Database—Lumber Identification (Hardwood). 2021. Available online: http://www.wood-database.com/radiata-pine/ (accessed on 5 January 2021).
- The Wood Database. African Juniper|The Wood Database—Lumber Identification (Hardwood). 2021. Available online: http://www.wood-database.com/african-juniper/ (accessed on 5 January 2021).
- The Wood Database. Mexican Cypress|The Wood Database—Lumber Identification. 2021. Available online: http://www.wood-database.com/mexican-cypress/ (accessed on 5 January 2021).
- The Wood Database. Black Wattle|The Wood Database—Lumber Identification. 2021. Available online: http://www.wood-database.com/black-wattle/ (accessed on 5 January 2021).
- The Wood Database. Australian Blackwood|The Wood Database. 2021. Available online: http://www.wood-database.com/australian-blackwood/ (accessed on 5 January 2021).
- The Wood Database. Spanish Cedar|The Wood Database—Lumber Identification. 2021. Available online: http://www.wood-database.com/spanish-cedar/ (accessed on 5 January 2021).
- The Wood Database. Camphor|—The Wood Database -Lumber Identification. 2021. Available online: https://www.wood-database.com/camphor/ (accessed on 5 January 2021).
- The Wood Database. River Red Gum|The Wood Database—Lumber Identification. 2021. Available online: http://www.wood-database.com/river-red-gum/ (accessed on 5 January 2021).
- The Wood Database. Blue Gum|The Wood Database—Lumber Identification. 2021. Available online: https://www.wood-database.com/blue-gum/ (accessed on 5 January 2021).
- The Wood Database. Rose Gum|The Wood Database—Lumber Identification. 2021. Available online: http://www.wood-database.com/rose-gum/ (accessed on 5 January 2021).
- The Wood Database. Southern Silky Oak|The Wood Database—Lumber Identification. 2021. Available online: http://www.wood-database.com/southern-silky-oak/ (accessed on 5 January 2021).
- The Wood Database. Olive|The Wood Database—Lumber Identification. 2021. Available online: https://www.wood-database.com/olive/ (accessed on 5 January 2021).
- The Wood Database. Idigbo|The Wood Database—Lumber Identification. 2021. Available online: http://www.wood-database.com/idigbo/ (accessed on 5 January 2021).
- The Wood Database. Teak|The Wood Database—Lumber Identification. 2021. Available online: http://www.wood-database.com/teak/ (accessed on 5 January 2021).
- The Wood Database. Sheoak|The Wood Database. 2021. Available online: http://www.wood-database.com/sheoak (accessed on 5 January 2021).
- Harris, R.; Phillips, D. Density of Selected Wood Fuels. In Georgia Forestry Comission; Research Division, Georgia Forestry Commission: Macon, GA, USA, 1986. [Google Scholar]
- ECN. Phyllis2, Database for (Treated) Biomass, Algae, Feedstocks for Biogas Production and Biochar. Wood, Plywood (#1487). 2021. Available online: https://www.ecn.nl/phyllis2/Biomass/View/1487 (accessed on 5 January 2021).
- ECN. Phyllis2, Database for (Treated) Biomass, Algae, Feedstocks for Biogas Production and Biochar. Industrial Wood Waste (#657). 2021. Available online: https://www.ecn.nl/phyllis2/Biomass/View/ (accessed on 5 January 2021).
- ECN. Phyllis2, Database for (Treated) Biomass, Algae, Feedstocks for Biogas Production and Biochar. Forest waste (#312021). 2021. Available online: https://www.ecn.nl/phyllis2/Biomass/View/3121 (accessed on 5 January 2021).
- ECN. Phyllis2, Database for (Treated) Biomass, Algae, Feedstocks for Biogas Production and Biochar. Wood (#3116). 2021. Available online: https://phyllis.nl/Browse/Standard/ECN-Phyllis#3116. (accessed on 5 January 2021).
- ECN. Phyllis2, Database for (Treated) Biomass, Algae, Feedstocks for Biogas Production and Biochar. Wood, Plywood Scraps (#443). 2021. Available online: https://www.ecn.nl/phyllis2/Biomass/View/443 (accessed on 5 January 2021).
- FAO. Official Live Animal Data. Food & Agricultural Organization to the UN (FAOSTAT). 2021. Available online: http://www.fao.org/faostat/en/#data/QA (accessed on 5 January 2021).
- Njombe, A.P.; Msanga, Y.; Mbwambo, N.; Makembe, N. The Tanzania Dairy Industry: Status, Opportunities and Prospects. In Proceedings of the 7th African Dairy Conference and Exhibition, MovenPick Palm Hotel, Dar es Salaam, Tanzania, 25–27 May 2011; United Republic of Tanzania, Ministry of Livestock and Fisheries Development: Dar es Salaam, Tanzania, 2011. [Google Scholar]
- Shane, A.; Gheewala, S.H.; Phiri, S. Rural domestic biogas supply model for Zambia. Renew. Sustain. Energy Rev. 2017, 78, 683–697. [Google Scholar] [CrossRef]
- Bhattacharya, S.C.T.; Jossy, M.; Abdul Salam, P. Greenhouse gas emissions and the mitigation potential of using animal wastes in Asia. Energy 1997, 22, 1079–1085. [Google Scholar] [CrossRef]
- Ozcan, M.; Öztürk, S.; Oguz, Y. Potential evaluation of biomass-based energy sources for Turkey. Eng. Sci. Technol. Int. J. 2015, 18, 178–184. [Google Scholar] [CrossRef]
- Okello, C.; Pindozzi, S.; Faugno, S.; Boccia, L. Bioenergy potential of agricultural and forest residues in Uganda. Biomass Bioenergy 2013, 56, 515–525. [Google Scholar] [CrossRef]
- Msibi, S.S.; Kornelius, G. Potential for domestic biogas as household energy supply in South Africa. J. Energy S. Afr. 2017, 28, 1–13. [Google Scholar] [CrossRef]
- Perera, K.K.C.K.; Rathnasiri, P.G.; Senarath, S.A.S.; Sugathapala, A.G.T.; Bhattacharya, S.C.; Abdul Salam, P. Assessment of sustainable energy potential of non-plantation biomass resources in Sri Lanka. Biomass Bioenergy 2005, 29, 199–213. [Google Scholar] [CrossRef]
- IBRD-IDA. Urban Population Total in Tanzania. The World Bank Group—DataBank. 2021. Available online: https://data.worldbank.org/indicator/SP.URB.TOTL?locations=CG-TZ (accessed on 5 January 2021).
- Mwakaje, A.G. Dairy farming and biogas use in Rungwe district, South-west Tanzania: A study of opportunities and constraints. Renew. Sustain. Energy Rev. 2008, 12, 2240–2252. [Google Scholar] [CrossRef]
- Orskov, E.R.; Yongabi Anchang, K.; Subedi, M.; Smith, J. Overview of holistic application of biogas for small scale farmers in Sub-Saharan Africa. Biomass Bioenergy 2014, 70, 4–16. [Google Scholar] [CrossRef]


| Power (kW) | Overall Efficiency (%) | Dual Fuel Type | Reference |
|---|---|---|---|
| <10 | 10 | Gasification/diesel | [32] |
| 10–100 | 10–20 | Gasification/diesel | [32] |
| <50 | 20 | Gasification/diesel | [33,40,41] |
| 25–50 | >25 | Gasification/diesel | [33,40,41] |
| 100 | 18 | Gasification/diesel | [33,40] |
| 12–16 | 21–24 | Gasification/diesel | [34,35] |
| 15–20 | 25 | Gasification/diesel | [34,37] |
| 11.44 | 11.69 | Gasification/diesel | [34,36] |
| 17.5 | 16.6 | Gasification/diesel | [34,38] |
| 68.4 | 11.7–20.7 | Gasification/diesel | [42] |
| 5.5 | Max 23 | Biogas/diesel | [39] |
| Crop | Type | RPR | FA | MC (%) | LHV (MJ/kg) |
|---|---|---|---|---|---|
| Cashew | Husks | 2.10 [31,47] | 0.17 [31] | 6.5 [31,47] | 14.9 [31,47] |
| Coffee | Husks | 0.25 [31,47] | 1.0 [31] | 15 [47,48] | 12.38 [47,48] |
| Coconut | Husks | 0.419 [47,48] | 0.884 [49] | 10.3 [47,48] | 18.62 [47,48] |
| Coconut | Shells | 0.12 [47,48] | 0.75 [47,50,51] | 8.7 [47,48] | 18.09 [47,48] |
| Oil, Palm | Shell | 0.065 [48,52] | 0.625 [49] | 10 [48,52] | 18.83 [48,52] |
| Oil, Palm | Fibre | 0.13 [48,52] | 0.80 [50,52,53] | 40 [48,52] | 11.34 [48,52] |
| Oil, Palm | Empty bunches | 0.23 [48,52] | 0.614 [49] | 50 [48,52] | 8.16 [48,52] |
| Soybean | Straw | 2.5 [47,48] | 0.767 [49] | 15 [47,48] | 12.38 [47,48] |
| Soybean | Pods | 1 [47,48] | 0.767 [49] | 15 [47,48] | 12.38 [47,48] |
| Sorghum | Straw | 1.25 [47,48] | 0.766 [49] | 15 [47,48] | 12.38 [47,48] |
| Seed cotton | Stalk | 3.743 [47,50] | 0.8 [54] | 12 [47,50] | 13.07 [49] |
| Sisal | Pulp | 24 [31,47,55] | 1 [31] | 91 * [31,47] | 14.4 [31,47] |
| Sisal | Ball/fibre | 3.55 * [30] | 1 ** [31] | 71 *** [55] | 14.4 ** [31,47] |
| Crop | Type | RPR | FA | MC (%) | LHV (MJ/kg) |
|---|---|---|---|---|---|
| Cassava | Stalks | 0.062 [47,48,56] | 0.2 [50,57] | 15 [47,48] | 17.5 [47,48] |
| Peelings | 0.25 [56] | 0.3 [56] | 50 [48] | 10.61 [56] | |
| Groundnuts including shells | Shells | 0.477 [47,48] | 1.0 [56] | 8.2 [47,48] | 15.66 [47,48] |
| Straw | 2.3 [48,56] | 0.5 [50,58,59] | 15 [48] | 14.4 [56] | |
| Maize | Straw/stalk | 2.0 [48,50,58] | 0.7 [48,50,58] | 15 [48,50,58] | 19.66 [48,50,58] |
| Cob | 0.273 [47,48] | 0.863 [49] | 7.53 [47,48] | 16.28 [47,48] | |
| Husk | 0.2 [48,50,56,60] | 0.6 [50,56,60] | 11.11 [50,56,60] | 15.56 [50,56,60] | |
| Millet | Straw/stalk | 1.75 [47,48] | 0.8 [47,50] | 15 [47,48] | 12.39 [47,48] |
| Rice, paddy | Straw | 1.757 [47,48] | 0.684 [49] | 12.71 [47,48] | 16.02 [47,48] |
| Husk | 0.267 [47,48] | 1.0 [49] | 12.37 [47,48] | 19.33 [47,50] | |
| Sugar | Top and leaves | 0.30 [48,61] | 0.986 [49] | 10 [50,61] | 15.81 [48,50,61] |
| Bagasse | 0.29 [47,48] | 0.8 [47,50] | 50 [47,50,57] | 18.10 [47,48] |
| Oilseed Crop | % Oil from Seed | Waste Type | Waste (Based on % of Seed/Bean) | LHV (MJ/kg) |
|---|---|---|---|---|
| Sesame | 50 [62] | Cake | 35 * [63] | 9.54 ** [64,65,66] |
| Sesame | Hull | 15 [63,67] | 18.22 [68] | |
| Cotton | 12 [54] | Cake | 50 [54] | 18.6 [69] |
| Cotton | Hull | 26 [54] | 18.01 [70,71] | |
| Sunflower | 40 [72] | Cake | 35 [73] | 15.86 [72] |
| Sunflower | Hull | 25 [73] | 19.5 [74] |
| Crop | Amount (t) | Residue | Dry Residue (t) | EPresidue (PJ) | % of Total EPresidue |
|---|---|---|---|---|---|
| Cashew nuts, inc shell | 313,826 | Husks | 104,753.5 | 1.56 | 0.46 |
| Cassava | 8,372,217 | Stalks | 88,243.2 | 1.54 | 1.45 |
| Peelings | 313,958.1 | 3.33 | |||
| Coconuts | 436,800 | Husks | 145,124.7 | 2.70 | 0.99 |
| Shells | 35,891.9 | 0.65 | |||
| Coffee, green | 43,193 | Husks | 9178.5 | 0.114 | 0.034 |
| Groundnuts, inc shell | 670,000 | Shells | 293,383.6 | 4.59 | 4.16 |
| Straw | 654,925.0 | 9.43 | |||
| Maize | 6,273,151 | Straw/Stalk | 7,465,049.7 | 146.76 | 53.26 |
| Cob | 1,366,658.6 | 22.25 | |||
| Husks | 669,144.5 | 10.41 | |||
| Millet | 316,194 | Straw | 376,270.9 | 4.66 | 1.38 |
| Oil, palm fruit | 75,086 | Shells | 2745.3 | 0.052 | 0.044 |
| Fibre | 4685.4 | 0.053 | |||
| EB | 5301.8 | 0.043 | |||
| Rice, paddy | 3,414,815 | Straw | 3,582,280.1 | 57.39 | 21.62 |
| Husks | 798,971.4 | 15.44 | |||
| Seed cotton | 269,393 | Stalks | 709,870.0 | 9.28 | 3.87 |
| * Cake | 134,696.5 | 2.51 | |||
| * Hull/husks | 70,042.2 | 1.26 | |||
| Sesame seed | 640,000 | * Cake | 224,000 | 2.14 | 1.15 |
| * Hull | 96,000 | 1.75 | |||
| Sisal | 32,460 | Pulp | 70,113.6 | 1.01 | 0.44 |
| Ball/fibre | 33,417.6 | 0.48 | |||
| Sorghum | 672,235 | straw | 547,115.3 | 6.77 | 2.01 |
| Soybeans | 21,321 | Straw | 34,750.6 | 0.43 | 0.18 |
| Pods | 13,900.2 | 0.17 | |||
| Sugar cane | 3,117,812 | Tops/leaves | 830,023.9 | 13.12 | 5.84 |
| Bagasse | 361,666.2 | 6.55 | |||
| Sunflower seed | 1,000,000 | * Cake | 350,000 | 5.55 | 3.09 |
| * Hull | 250,000 | 4.88 | |||
| TOTAL | 19,642,162.2 | 336.9 |
| Data | GWh Equivalent |
|---|---|
| Gross GWhe at 100% efficiency | 93,580 |
| For an overall efficiency of 10% before any losses | 9358 |
| Net GWhe (for an overall efficiency of 10%) after T&D losses | 7775 |
| For an overall efficiency of 25% before any losses | 23,395 |
| Net GWhe (for an overall efficiency of 25%) after T&D losses | 19,438 |
| Type | Residue | % Availability | Residues | Energy Potential | ||
|---|---|---|---|---|---|---|
| m3 | OD Mass (t) | PJ (1) | PJ (2) | |||
| Logging | Solid Wood | 40 | 646,400 | 304,454 | 5.75 | 6.30 |
| Dust | 20 | 323,200 | 71,104 | 1.31 | 1.31 | |
| Sawmilling | Solid Wood | 38 | 614,080 | 289,232 | 5.46 | 5.98 |
| Dust | 12 | 193,920 | 42,662 | 0.79 | 0.79 | |
| Plywood | Solid Wood | 45 | 6750 | 3179 | 0.06 | 0.06 |
| Dust | 5 | 750 | 165 | 0.003 | 0.003 | |
| Total | 1,785,100 | 710,797 | 13.4 | 14.4 | ||
| Data | GWh Equivalent Based on PJ (1) | GWh Equivalent Based on PJ (2) |
|---|---|---|
| Gross (100% efficiency) | 3715 | 4014 |
| Overall efficiency of 10% before any losses | 372 | 401 |
| Net GWhe (for an overall efficiency of 10%) after T&D losses | 309 | 334 |
| Overall efficiency of 25% before any losses | 929 | 1004 |
| Net GWhe (for an overall efficiency of 25%) after T&D losses | 772 | 834 |
| Type of Animal | NA (Head) | FA | DM (%) | DMR (kt DM/y) | VS/DM | Biogas Yield (m3/kg VS) | ABPManure (Mm3/y) | EPmanure (PJ) |
|---|---|---|---|---|---|---|---|---|
| Cattle: Beef | 26,398,742 | 0.5 | 17.44 | 4201.1 | 0.934 | 0.307 | 1204.6 | 24.09 |
| Cattle: Dairy | 883,960 | 0.8 | 17.44 | 675.2 | 0.934 | 0.307 | 193.6 | 3.87 |
| Chicken | 37,992,000 | 0.8 | 33.99 | 113.1 | 0.465 | 0.18 | 9.5 | 0.19 |
| Pigs/swine | 520,853 | 0.8 | 35.22 | 64.3 | 0.893 | 0.217 | 12.5 | 0.25 |
| Sheep | 7,945,775 | 0.3 | 25.0 | 217.5 | 0.912 | 0.31 | 61.5 | 1.23 |
| Goat | 18,497,912 | 0.4 | 25.0 | 675.2 | 0.598 | 0.31 | 125.2 | 2.50 |
| TOTAL | 5946.4 | 1607 | 32.1 |
| Data | GWh Equivalent |
|---|---|
| Gross GWhe at 100% efficiency | 8927 |
| For an overall efficiency of 10% before microgrid losses | 893 |
| Net GWhe (for an overall efficiency of 10%) after microgrid losses | 803 |
| For an overall efficiency of 25% before microgrid losses | 2232 |
| Net GWhe (for an overall efficiency of 25%) after microgrid losses | 2008 |
| Item | Value |
|---|---|
| Urban population in 2018 [112] | 19,022,085 |
| Average dry matter production, (kg/head/day) [50,107] | 0.090 |
| Total dry matter/year, (tonnes) | 624,875.5 |
| Total Biogas produced (M m3 in 2018) | 83.4 |
| LHV of biogas (MJ/m3) | 20 |
| Biogas yield, (Biogas m3/kg VS) [107] | 0.20 |
| Total EP (PJ) in 2018 | 1.67 |
| Data | GWh Equivalent |
|---|---|
| Gross—at 100% efficiency | 463 |
| For an overall efficiency of 10% before any losses | 46 |
| Net GWhe (for an overall efficiency of 10%) after T&D losses | 38 |
| For an overall efficiency of 25% before any losses | 116 |
| Net GWhe (for an overall efficiency of 25%) after T&D losses | 96 |
| GWhe for Overall Efficiencies of: | |||||
|---|---|---|---|---|---|
| Residue: | Gross GWhe at 100% Efficiency | 10% before Losses | 25% before Losses | 10% after Losses | 25% after Losses |
| Agricultural | 93,580 | 9358 | 23,395 | 7775 | 19,438 |
| Forestry | * 3865 | * 387 | * 966 | * 322 | * 803 |
| Livestock | 8927 | 893 | 2232 | 803 | 2008 |
| Urban Human | 463 | 46 | 116 | 38 | 96 |
| TOTAL | 106,835 | 10,684 | 26,709 | 8938 | 22,345 |
| % of the electricity generation capacity possible (2018) | 1478 | 148 | 369 | 124 | 309 |
Publisher’s Note: MDPI stays neutral with regard to jurisdictional claims in published maps and institutional affiliations. |
© 2021 by the authors. Licensee MDPI, Basel, Switzerland. This article is an open access article distributed under the terms and conditions of the Creative Commons Attribution (CC BY) license (http://creativecommons.org/licenses/by/4.0/).
Share and Cite
Aslam, Z.; Li, H.; Hammerton, J.; Andrews, G.; Ross, A.; Lovett, J.C. Increasing Access to Electricity: An Assessment of the Energy and Power Generation Potential from Biomass Waste Residues in Tanzania. Energies 2021, 14, 1793. https://doi.org/10.3390/en14061793
Aslam Z, Li H, Hammerton J, Andrews G, Ross A, Lovett JC. Increasing Access to Electricity: An Assessment of the Energy and Power Generation Potential from Biomass Waste Residues in Tanzania. Energies. 2021; 14(6):1793. https://doi.org/10.3390/en14061793
Chicago/Turabian StyleAslam, Zahida, Hu Li, James Hammerton, Gordon Andrews, Andrew Ross, and Jon C. Lovett. 2021. "Increasing Access to Electricity: An Assessment of the Energy and Power Generation Potential from Biomass Waste Residues in Tanzania" Energies 14, no. 6: 1793. https://doi.org/10.3390/en14061793
APA StyleAslam, Z., Li, H., Hammerton, J., Andrews, G., Ross, A., & Lovett, J. C. (2021). Increasing Access to Electricity: An Assessment of the Energy and Power Generation Potential from Biomass Waste Residues in Tanzania. Energies, 14(6), 1793. https://doi.org/10.3390/en14061793