Article

Numerical Simulation of Acoustic Resonance Enhancement for Mean Flow Wind Energy Harvester as Well as Suppression for Pipeline

1
College of Safety and Ocean Engineering, China University of Petroleum, Beijing 102249, China
2
National Engineering Laboratory for Pipeline Safety, MOE Key Laboratory of Petroleum Engineering, Beijing Key Laboratory of Urban Oil and Gas Distribution Technology, China University of Petroleum, Beijing 102249, China
*
Author to whom correspondence should be addressed.
Energies 2021, 14(6), 1725; https://doi.org/10.3390/en14061725
Submission received: 23 December 2020 / Revised: 13 March 2021 / Accepted: 15 March 2021 / Published: 19 March 2021
(This article belongs to the Special Issue Advanced Energy Harvesting Technologies)

Abstract

:
Acoustic resonance in closed side branches should be enhanced to improve the efficiency of wind energy harvesting equipment or thermo-acoustic engine. However, in gas pipeline transportation systems, this kind of acoustic resonance should be suppressed to avoid fatigue damage to the pipeline. Realizable k-ε delayed detached eddy simulations (DDES) were conducted to study the effect of different branch pipe shapes on acoustic resonance. At some flow velocities, the pressure amplitude of the simulation results is twice as large as that of the experimental results, but the simulation can accurately capture the flow velocity range where acoustic resonance occurs. The results prove the feasibility of the method of the equivalent diameter of the circular cross-section pipe and the square cross-section pipe to predict acoustic resonance. The pressure pulsation amplitude of acoustic resonance in a square cross-section pipe is significantly increased than that in a circular square cross-section pipe, indicating that the square cross-section branch configuration can be more conducive to improving the efficiency of wind energy harvesting. The influence of the angle between the branch and the main pipe on the acoustic resonance was studied for the first time, which has an obvious influence on the acoustic resonance. It is found that the design of a square wind energy harvester is better than that of a circular one; meanwhile, changing the branch angle can increase or suppress the acoustic resonance, which can improve the utilization efficiency of the acoustic resonance and provide a new method for suppressing the acoustic resonance.

1. Introduction

Acoustic resonance occurs as a gas flows through a closed side branch at a certain velocity. In industry, this kind of acoustic resonance may exhibit the two sides like a coin, a valuable side and a harmful side.
  • For wind-energy harvesting, acoustic resonance can output standing waves in the closed side branch without moving parts, providing continuous pressure fluctuation for wind harvesting equipment [1,2,3,4] or temperature difference for thermo-acoustic engines [5,6], the acoustic resonance, in this case, needs to be strengthened to improve utilization efficiency [7].
  • Closed side branches exist widely in industry, such as natural gas transmission pipelines [8,9], safety valves of the steam pipeline in nuclear power plant [10,11,12,13,14,15], a vertical-lift system of fighters [16,17,18]. Acoustic resonance in these cases can induce severe vibration and noise, cause fatigue damage to the pipeline, threaten the safe operation of the pipeline, and even cause safety accidents, which need to be avoided or suppressed. Therefore, it is of practical significance to enhance or suppress acoustic resonance.
The mechanism of acoustic resonance has been clarified [19,20]. When the gas flows through the branch mouth, the wall friction of the main pipe disappears, and the shear layer falls off from the upstream wall, forming periodic vortices, which spread to the downstream of the main pipe into the branch. As the vortex reattaches to the downstream wall, the acoustic energy accumulates into the branch pipe, and the vortex interacts with the gas in the branch, which further promotes to form of a large vortex. The sound wave generated by the vortex propagates to the branch and reflects at the bottom of the branch. The incident wave and the reflected waveform a standing wave in the closed side branch, resulting in great pressure fluctuations [21,22,23,24,25,26,27] (Figure 1). From the perspective of the acoustic resonance mechanism, the branch shape affects the shedding and reattachment of the acoustic vortex, so the branch shape can affect the acoustic resonance, which is worthy of in-depth study.
The cross-section shapes of the pipes studied before are square and circular. The square pipe is convenient for the visualization of research. After the tracer particles are injected into the flow, the flow mode can be directly captured, avoiding the influence of the intersection line at the T-shaped intersection of the circular pipe. In general, square pipes or circular pipes were studied separately. Both square and circular pipes were studied by Bruggeman et al. [28]. Bruggeman et al. pointed out that the mechanisms of acoustic resonance in square and circular pipes are the same and proposed that the results studied in a circular pipe can roughly evaluate whether acoustic resonance occurs in the range of Strouhal number in an equivalent square pipe, in which the equivalent diameter is calculated as deff = πd/4, where d is the circular branch diameter. The validity of this equivalence method means that the visualization results in a square pipe can be used to predict the acoustic resonance in an equivalent circular pipe. Moreover, there is no curve intersecting lines in the flow area of square pipes, so it is easier to obtain high-quality orthogonal grids. This not only saves the workload of grid generation in Computational Fluid Dynamics (CFD) preprocessing but also reduces the hardware resources and time cost in the computer solving process. However, the acoustic resonance characteristics of the equivalent diameter configurations have not been studied.
The previous studies focus on the mechanism, characteristics, and suppression methods of the acoustic resonance in closed side branches, in which all the branches are perpendicular to the main pipeline [8,9,10,11,13,14,15,16,17,18,19,20,23,24,26,27]. Some visualization studies of acoustic resonance in square cross-section pipe are to capture the acoustic vortex mode [9,13]. The mechanism and characteristics of acoustic resonance in the high-pressure natural gas transmission pipeline [29], the mean flow wind energy harvester (atmospheric air pipeline) [1,2], and the steam pipeline of nuclear power plant [10,12] are studied. The main purpose of changing the branch shape is to suppress acoustic resonance. Baldwin et al. [11] proposed that the internal structure of the safety valve should be designed out of the St-range at which acoustic resonance occurs. Jungbauer et al. [30] proposed to increase the diameter of the branch at the connection with the main pipe and use a reducer to connect the original branch pipe to change the St-range of acoustic resonance, thereby suppressing acoustic resonance. These two methods are effective, but the velocity in the main velocity is limited to a certain range once the pipeline structure is designed and constructed.
Compared with the branch cross-section and the branch diameter, the branch angle has a greater influence on acoustic resonance and has more potential in suppressing or enhancing acoustic resonance. However, all the pipeline structures in the previous study are branch pipelines perpendicular to the main pipeline [19,20]. In the field of mean flow wind energy harvesting, all the research only focused on the structure of the circular cross-section and the branch perpendicular to the main pipe [2,3,4,5,6,31]. There is currently a lack of research on the influence of branch angle on acoustic resonance.
Therefore, in this paper, the acoustic resonance of a circular pipe and an equivalent diameter square pipe are simulated with the realizable k-ε DDES model. In addition, the influences of the intersecting line of the pipe on the acoustic resonance are discussed. Furthermore, the influence of the branch angle on acoustic resonance is studied. Current simulations show that these changes can improve mean flow wind harvesting and suppress the acoustic resonance in industrial pipelines.

2. Mathematical Methods

The method workflow of the simulation is shown in Figure 2. In this section, the CFD method is introduced in the order shown in Figure 2. The higher the pressure potential energy, the more beneficial it is to improve the efficiency of the wind energy harvester. Therefore, the pressure distribution determines the installation position of piezoelectric devices in the wind energy harvester. The wider the velocity range and the more consistent the frequency are, the more convenient it is to harvest wind energy. Moreover, the velocity field can show the mechanism of pressure amplitude enhancement. Therefore, velocity, pressure and vorticity are analyzed.

2.1. Geometry Model

The geometric model is shown in Figure 3, which is the flow area in the pipe. D is the main pipe internal diameter, L is the main pipe length, the left is the inlet, and the right is the outlet. The closed side branch is located at the symmetry center of the main pipe. l is the length of the branch (from the bottom of the branch to the inner wall of the main pipe), d is the diameter of the branch (or the width of the equivalent square pipe branch), and the center point p1 at the bottom of the branch is the pressure monitoring point. α is the angle between the branch and the pipe.
Six cases of different structures of pipes were configured (Table 1). In all cases, the shapes of main pipes and branch pipes were, respectively, configured as circular or square. As the unstable shedding of the boundary layer at the branch mouth was the cause of acoustic resonance, the shape configurations of the main pipe were based on the same Reynolds number to ensure that the flow in the boundary layer of the main pipeline was similar. The shape configurations of branch pipe were based on the equivalent method proposed in reference [28]. The geometric size of case 1 (Figure 3a) was consistent with the experimental pipe size in reference [27], which was convenient for comparison and validation of the results. In case 1, D = 0.089 m, D/d = 0.135, L = 0.9 m, l = 0.17 m. Different shapes of the main pipe and branch pipe were arranged in cases 1–2 (Figure 3a,b) to study the influence of cross-section shape on acoustic resonance, and different angles were set in cases 3–6 (Figure 3c–f) to study the influence of branch angle on acoustic resonance. In order to ensure that the acoustic resonance frequency was basically the same, the branch lengths of all geometric models were kept the same to avoid the influence of the branch length on the acoustic resonance. Among them, case 3 and case 6 were mirror bodies about the XOZ plane, and case 4 and case 5 were mirror bodies about the XOZ plane. Using this strategy, case 3 and case 6 could share a set of grids, which reduces the meshing work. In the simulation solution, only the inlet and outlet boundary conditions need to be exchanged; case 4 and case 5 had the same effect.

2.2. Grid Partition

Only the grid details of case 1 are shown here because the mesh densities of cases 2–6 are similar. The grid-type was a hexahedral structured grid, and all grid blocks of the flow area were O-shaped to improve the grid quality (Figure 4). The thickness of the first boundary layer was 0.3 mm, and the internal grid size increased with a rate of 1.2. In the branch entrance and its adjacent area, the flow turbulence was more intense, so the grid in this area was refined, and the grid size was kept at about 0.9 mm.
The branch angle and the intersection line of the main pipe and the branch pipe of the circular cross-section had an influence on the mesh quality. The grid quality of all cases was as follows: the mesh quality of the main pipe with a circular cross-section was the worst, but it was guaranteed to be greater than 0.5 (case 1); the mesh quality of the main pipe with square cross-section was better, as the branch angle α = 90°, all grids were orthogonal, and the mesh quality was equal to 1 (case 2); as the branch angle α = 80° and α = 100°, the mesh quantities were the same, greater than 0.9 (case 4 and case 5), as the branch angle α = 60° and α = 120°, the mesh quantities were the same, greater than 0.85 (case 3 and case 6).

2.3. Boundary Conditions

The inlet boundary condition was the mass-flow inlet, the outlet boundary condition was the pressure outlet, the outlet pressure value was set to 0, and the reference pressure was set to 0.35 MPa.

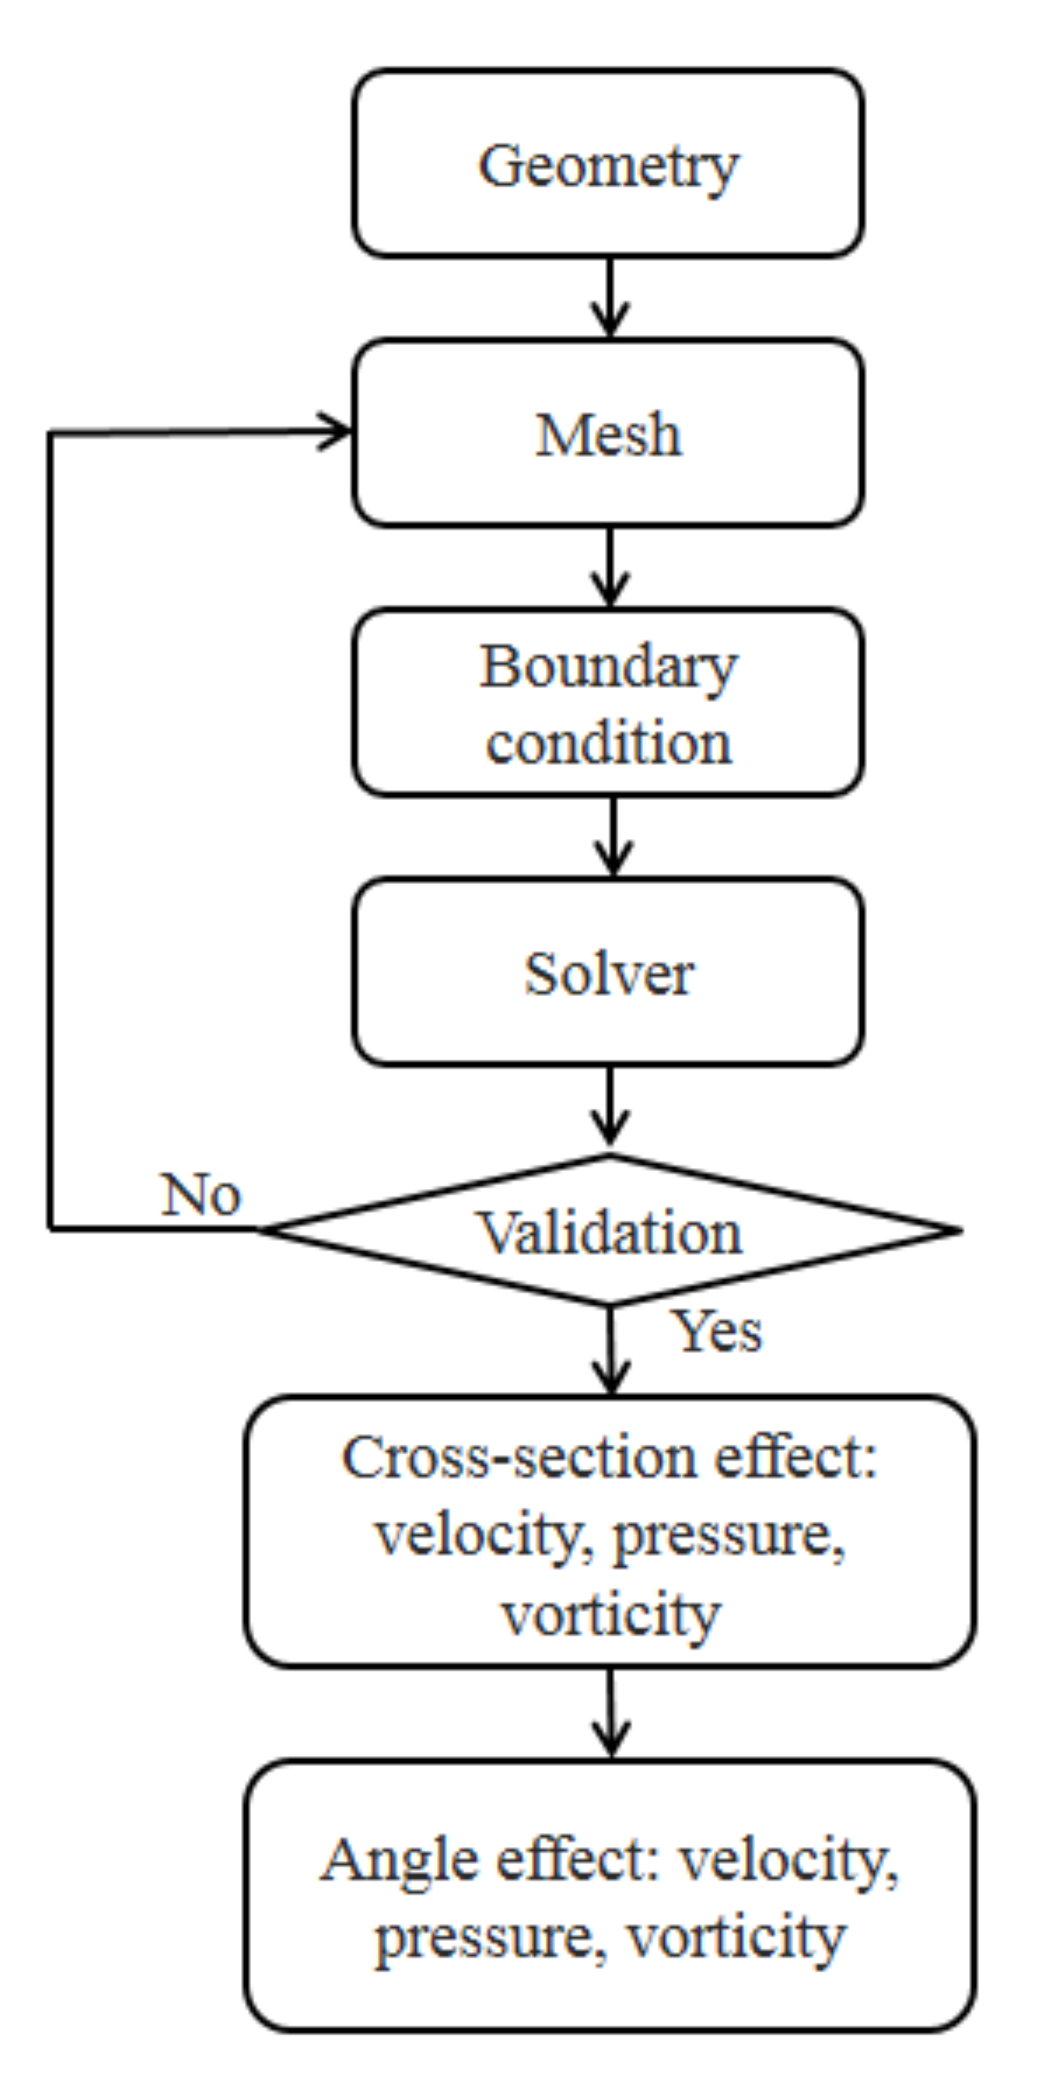
2.4. CFD Turbulence Model and Solver

In CFD numerical simulation, the choice of turbulence model affects the accuracy of numerical calculation and the cost of computing hardware and time. The LES model can provide more accurate calculation results, but its calculation cost is high. For example, Morita et al. [32] used the LES turbulence model to simulate the acoustic resonance in the closed side branch successfully, but the number of grids was greater than 5 million, which lead to the numerical calculation cost high. Radavich et al. [33] used the RANS turbulence model to simulate the acoustic resonance phenomenon and obtained the mode of acoustic resonance, but the pressure fluctuation simulated by Radavich is smaller than the experimental results. Because the wall is rigid in the simulation, it may not be reasonable that the simulation results are smaller than the experimental results. In addition, our simulation experience shows that the pressure fluctuation results of the RANS model are easy to decay, and it is not easy to simulate the acoustic resonance phenomenon that should exist. In this paper, we used delayed detached-eddy simulation (DDES), a hybrid model of LES-RANS extended by Spalart et al. [34], which is widely and effectively used [35,36,37,38,39]. Due to the advantages of accuracy and economy, the k–ε turbulence model is the most commonly used CFD model, among which the realizable k–ε model shows the best performance in simulating separated flows [40]. The excitation source of acoustic resonance in the closed side branch is the separated shear layer of the main pipe at the branch mouth. Therefore, in the present simulation, the RANS region is solved by the realizable k–ε model.
The commercial CFD software ANSYS Fluent v19.2 was used to simulate the acoustic resonance in the closed side branch. The following equations (the mass, momentum, and energy conservation equations as well as ideal gas law) were solved in the simulation process.
ρ t + x j ρ u i = 0
t ρ u i + x j ρ u i u j = p x i + τ i j x j
t ( ρ E ) + x i u i ( ρ E + p ) = x i k e f f T x i h J + u j τ i j e f f
p = ρ T R M
where ρ is the density, τ is the viscous stress, p is the gas pressure, E is the summation of kinetic energy and internal energy, T is the gas temperature, J is the gas diffusion energy, h is the enthalpy, keff is the thermal conductivity. τeff is the viscous dissipation coefficient, R is the gas constant, M is the molecular weight.
The pressure-based solver was applied. In order to ensure the solution convergence, the residual of the energy equation was set to 10−6. The residual of other equations was set to 10−5. The simulation time step was 10−5, and the number of iterations of each time step was set to 20.

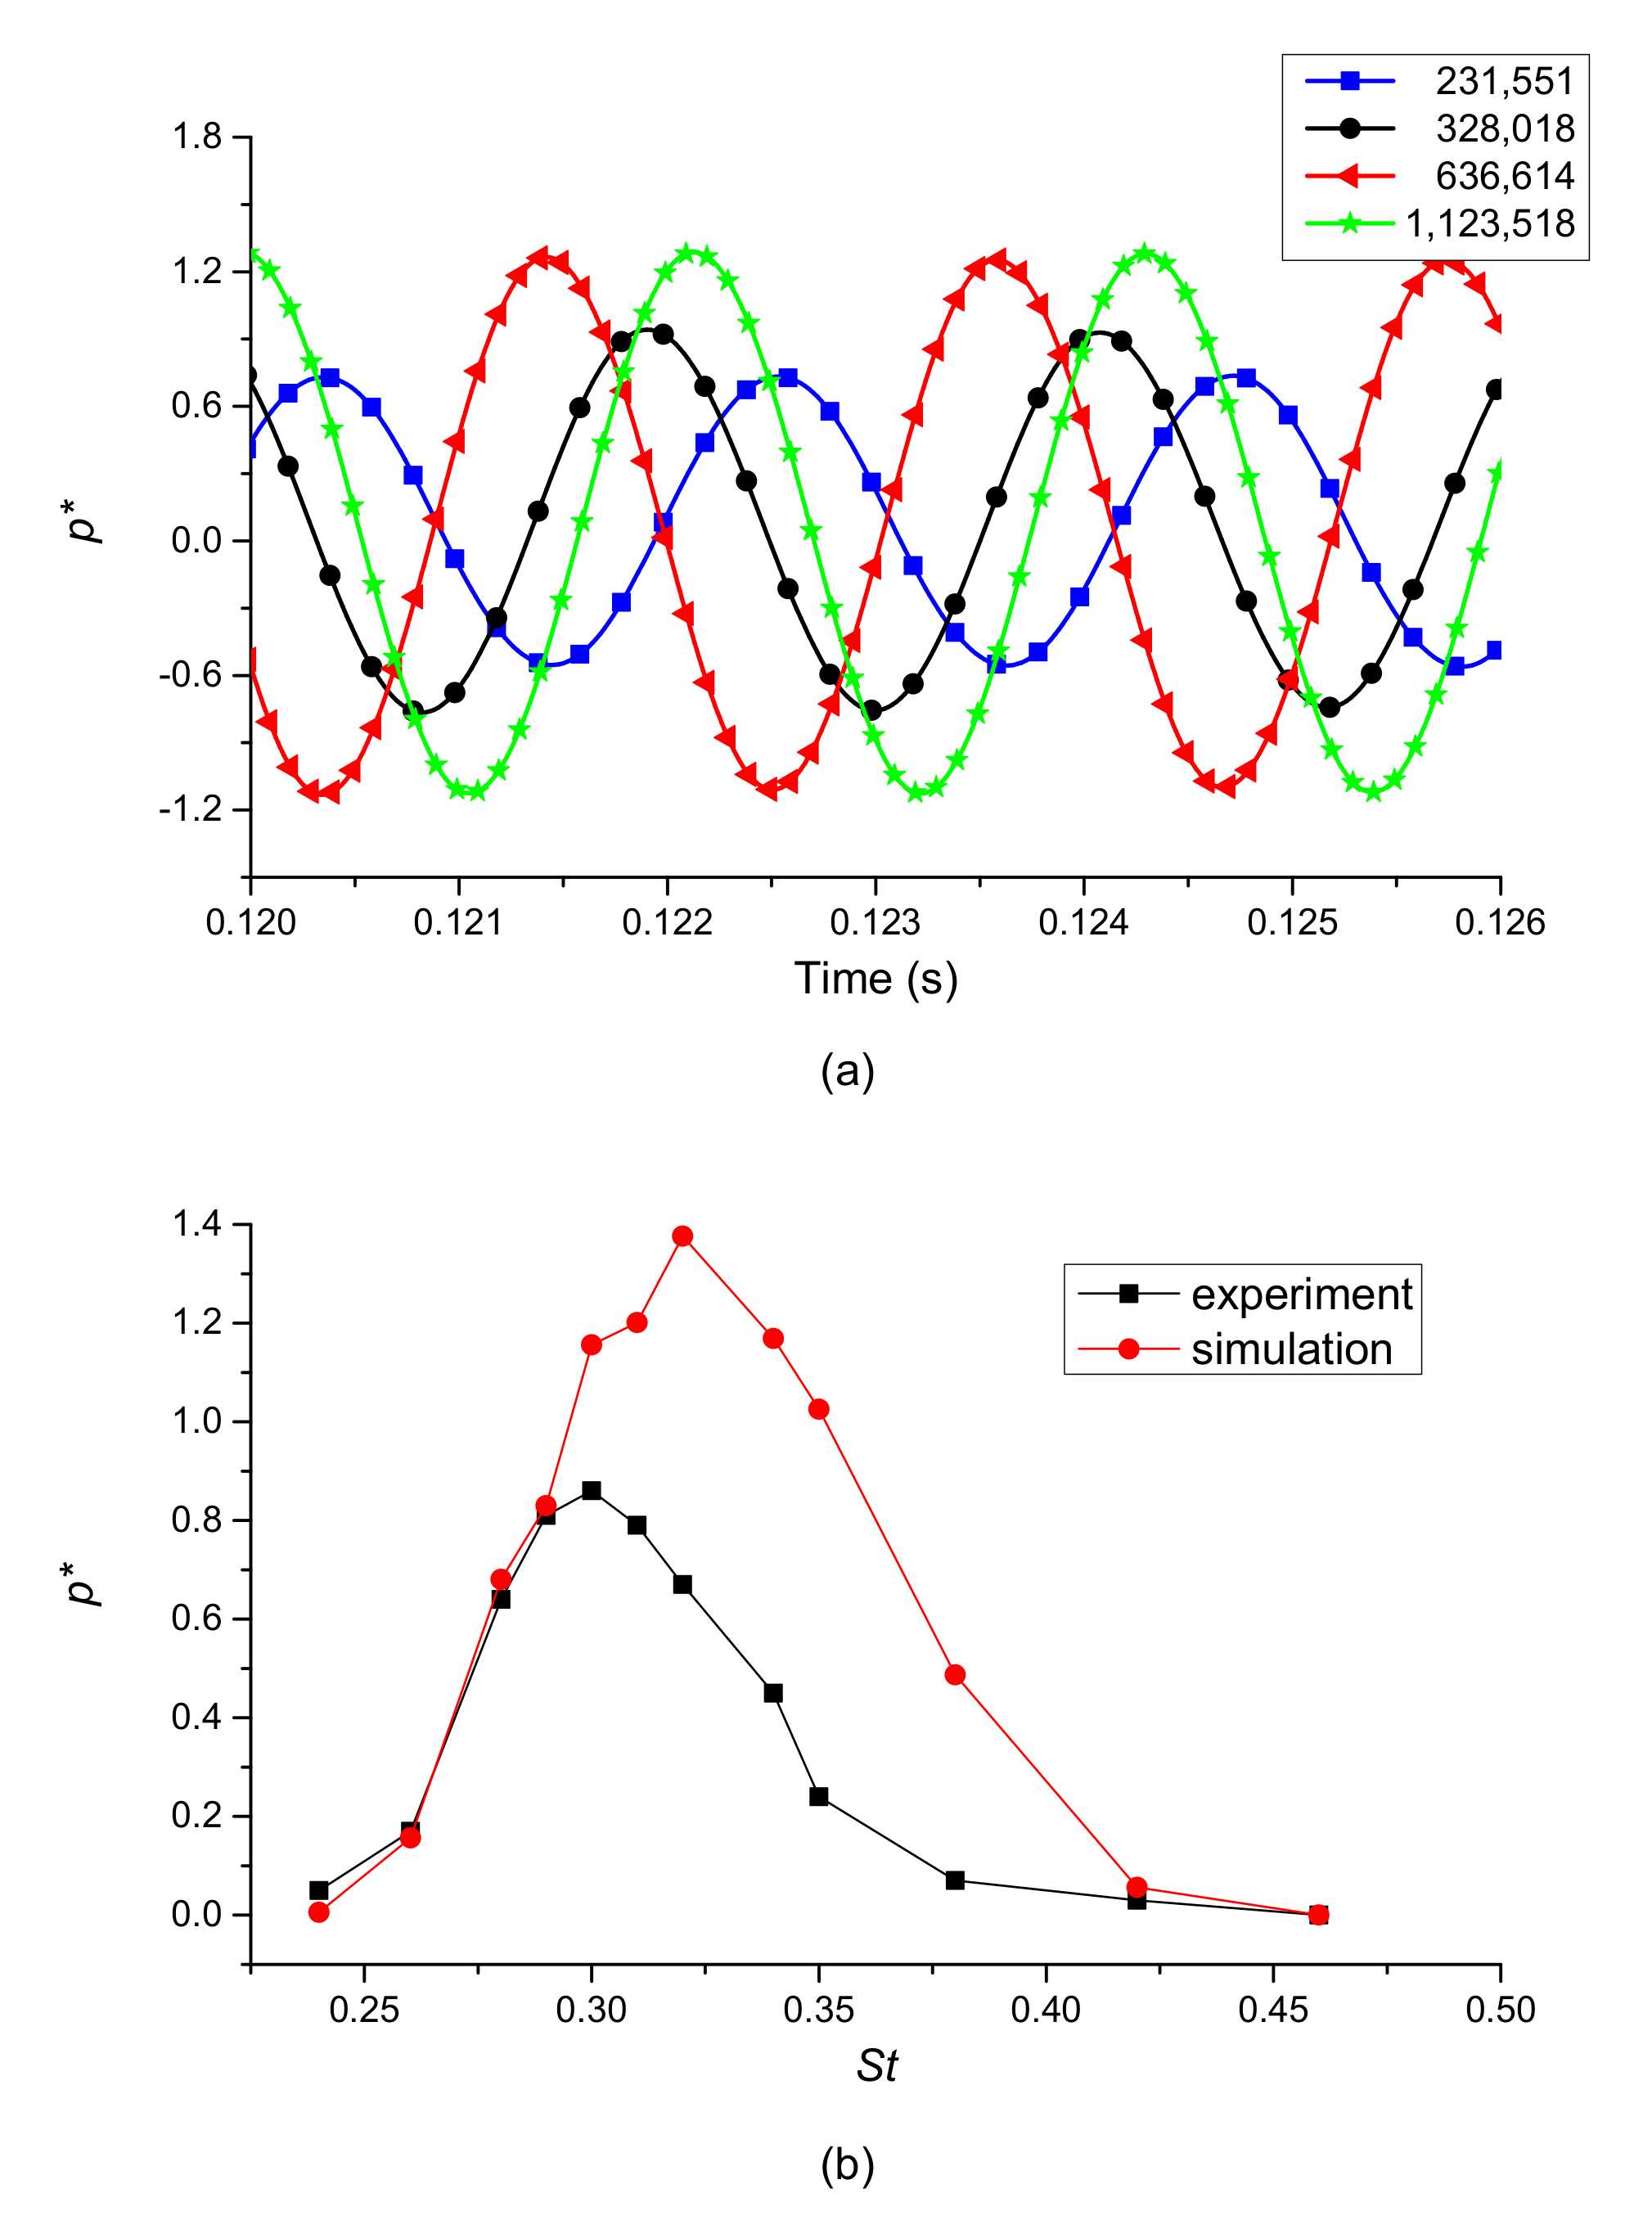
2.5. Grid Analysis and Validation

The purpose of grid independence verification was to avoid numerical simulation errors caused by grid quality. According to the method in reference [41,42], four sets of grids were prepared to compute with the boundary condition of inlet velocity of 19.55 m/s. The cell number of grids was 231,551, 328,018, 636,614, and 1,123,518, respectively. In order to ensure the convergence of numerical calculation, the time steps of 231,551 and 328,018 were 2·10−5 s, and those of 636,614 and 1,123,518 were 10−5 s. All the cased were simulated to 0.126 s, at which the pressure fluctuation amplitude was steady (Figure 5a). The normalized pressure p* was calculated as Equation (5), where v was the mean flow velocity in the main pipeline, p was the pressure amplitude, ρ was the gas density. As the grid increased from 636,614 to 1,123,518, the pressure amplitude did not change much. In Figure 5a, compared with the pressure pulsation amplitude of grid number 1,123,518, the amplitude errors of grid number 636,614, 328,018 and 231,551 were 1.7%, 30.1% and 46.5%, respectively. Therefore, the result of the 636,614 grid was considered as a grid-independent solution.
p * = p ( 1 / 2 ) ρ v 2
The flow conditions of reference [27] were simulated with the grid of 636,614 in case 1. The experimental data of Ziada et al. [27] and the current simulation results were basically consistent (Figure 5b), which proves the validity of the DDES model. At most flow velocities, the pressure fluctuation amplitude of the simulation results was larger than that of the experiment because the wall was rigid, and there was no radiation penetration of sound energy in the simulation.
In experiments, sound energy radiated through the pipe wall, and the vibration of the pipe wall attracted a certain amount of the sound source energy of the flow. In the simulation, the wall was only be set as a non-penetrating and rigid wall boundary; therefore, the pressure pulsation amplitudes obtained by the simulation were bigger than that obtained by the experiment. However, it was difficult to quantitatively determine the influence of wall boundary conditions.

3. Influences of Pipe Cross-Section Shape

In this section, the acoustic resonance characteristics of circular cross-section pipe and equivalent square cross-section pipe are compared to study the influences of pipe cross-section shape on the acoustic resonance. First, the time histories of static pressure at the monitoring point p1 and their frequency domain signals were compared, including the onset, offset and the maximum amplitude point of acoustic resonance in the middle of St. Second, the vortex modes of the exciting acoustic source at the branch mouth were compared and analyzed to determine the difference of the mechanisms between these two cross-section structures. Finally, the influence of the intersecting line shape on the z-direction oscillation of the acoustic vortex at the branch mouth was analyzed.

3.1. Onset and Offset of Acoustic Resonance

Figure 6 and Figure 7 show the amplitude and frequency characteristics of the monitoring point p1 pressure of circular and square pipes for St = 0.26, 0.30, and 0.42, correspondingly. The normalized pressure p* was calculated as Equation (5), where v was the mean flow velocity in the main pipeline, p was the pressure amplitude, ρ is the gas density. In Figure 6, the spectrum pressure (right) after Fast Fourier Transform (FFT) of the time history pressure (left) was also normalized according to Equation (5). The frequency f (left) in the FFT analysis was normalized by dividing the first-order acoustic resonance frequency f1. The acoustic resonance in the circular pipe and the square pipe exhibit similar characteristics with the St. At a certain St, a stable acoustic resonance was formed in both circular and square branches. At low St (high velocity) and high St (low velocity), the amplitude of pressure fluctuation decreased finally. At high St (low velocity), the energy generated by the initial acoustic vortex was insufficient to make up for the dissipation of acoustic resistance and radiation and could not maintain sustained pressure pulsation; at low St (high velocity), the energy generated by the initial acoustic vortex was also large, but the flow in the main pipe took more energy from the branch inlet, so the pressure pulsation could not be sustained. It can be seen from the spectrogram that both the circular pipe and the square pipe could show pure tones when acoustic resonance occurred. When acoustic resonance did not occur, the noise of the circular pipe was more obvious than that of the square pipe. It shows that the cross-section shape of the branch mouth affects the frequency of the initial vortex shedding, but after the acoustic resonance was formed, the frequency of the pressure pulsation was dominated by the first-order acoustic resonance frequency of the branch.
It can be seen from Figure 8 that the modes of the circular section pipe and the equivalent square section pipe were basically the same. At the peak pressure value, the acoustic vortex beats the branch cavity from the main pipe, and at the nadir pressure value, the acoustic vortex was pushed to the main pipe by the gas in the branch. The difference was that the structure and strength of vortices in the equivalent square pipe were larger, which determines that the amplitude of pressure fluctuation was higher. Another subtle difference was that the vortices near the downstream branch wall of the circular cross-section pipe were more complex than that of the square cross-section pipe.

3.2. Vorticity Around the Branch Mouth

The onset and offset of acoustic resonance with St in the circular pipe and the equivalent diameter square pipe were almost the same, but the acoustic resonance pressure amplitude in the equivalent square pipe was generally larger than that of the circular one (Figure 9). Therefore, although the results of equivalent diameter square pipe were relatively overestimated as predicting the pressure amplitude in the circular pipe, they were effective in predicting the onset and offset acoustic resonance. The increase in the pressure pulsation amplitude was beneficial to the efficiency improvement for the wind energy harvesting equipment or the thermo-acoustic engine [7,43,44,45]. Therefore, the design of a square cross-section branch in wind energy utilization equipment with can greatly improve the efficiency in a wide range of flow velocity.

3.3. Influence of Intersection Line on Vortex Oscillation of z-Velocity

Figure 10 shows the z-velocity at the center of the branch entrance of cases 1–2. The z-velocity vz* was normalized by vz* = vz/v, where vz was the actual z-velocity, v was the mean flow velocity in the main pipeline. Although in both cases, the low regions were symmetric with respect to the z = 0 planes, the z-velocity was not zero, indicating the asymmetry of flow. The vortex oscillated up and down along the y-direction at the branch mouth (Figure 8) but at a certain speed along the z-direction at the same time. When acoustic resonance was stable, the FFT analysis of the oscillation velocity along the z-direction shows that the oscillation amplitude was the largest in case 1 and the swing amplitude in case 2 was smaller. It was revealed that the circular shape had a greater influence on the z-direction oscillation, while the square shape had a smaller influence. In a circular pipe, more energy was consumed in the z-direction, which explains the higher pressure pulsation amplitude in the equivalent square pipe (Figure 9).

4. Effects of Branch Angle

It was necessary to avoid the occurrence of acoustic resonance in the pipeline design stage, so the range of St of acoustic resonance occurrence was focused on. According to the results in Section 3, the shape of the branch only affects the amplitude of the pressure fluctuation when the acoustic resonance occurred, and the onset and offset of the acoustic resonance of St was consistent in the equivalent pipe. Therefore, in order to obtain a high-quality grid and save the hardware resources and time cost of calculation, in this section, the configuration of equivalent square cross-section pipe was used to study the influence of branch angle on acoustic resonance. The abnormal beat phenomenon in acoustic resonance in different branch angles was analyzed. The influence of the branch angle on the pressure amplitude and frequency of the acoustic resonance and vortex modes at the branch mouth and the pressure contours are analyzed in this section.

4.1. Beats Phenomena

In the flow velocity of v = 70 m/s, the acoustic resonance in the perpendicular branch (α = 90°) and the backward-swept branch (α = 60°) exhibited beat vibration (Figure 11), which indicates the instability of pressure pulsation as the flow velocity increases. This shows that the appearance of beat vibration was not determined by the branch angle but by the flow velocity.
However, as the flow rate increased, the acoustic resonance was no longer stable, and when St < 0.08, the acoustic resonance ends (Figure 12). It can be seen from the spectrogram that the pressure pulsations of both were affected by the second-order acoustic resonance frequency of the branch. The difference was that the acoustic resonance in the backward-swept branch was the first-order dominant frequency, and in the perpendicular branch, the acoustic resonance was the third-order dominant frequency.

4.2. Acoustic Resonance Characteristics

The branch angle α had a significant effect on the acoustic resonance (Figure 12). In the cased of α > 90°, acoustic resonance was suppressed. In the case of α = 120°, acoustic resonance was greatly suppressed at all flow velocities. In the case of α = 100°, to a certain extent, the pressure pulsation amplitude of the first-order acoustic resonance was suppressed, while the pressure pulsation of the second-order acoustic resonance pressure pulsation was completely suppressed, and no acoustic resonance occurred. In the field where acoustic resonance needs to be suppressed, the design of branch angle α = 120° was simple and effective, showing great application potential. In the cased of α < 90°, acoustic resonance shows a tendency to be enhanced. In the case of α = 60°, the velocity range and pressure fluctuation amplitude of the acoustic resonance were greatly enhanced, compared with acoustic resonance in the case of α = 90°, which could provide about 2 times of the velocity range and several times of the amplitude of pressure fluctuation of acoustic resonance. It should be pointed out that at St = 0.07–0.15, acoustic resonance occurred in the case of α = 90°, but in the second and third-order acoustic resonance frequencies, respectively (Figure 12). Acoustic resonance in the case of α = 60° keeps the first-order frequency acoustic resonance unchanged, which could simplify the design of wind energy harvesting equipment.

4.3. Vortex Modes and Pressure Contours

The vortex modes of branch mouths are important characterizations for studying the mechanism of acoustic resonance. Figure 13 shows the vortex modes of acoustic resonance in the different branch angles. Compared to in other cases, in the case of α = 60°, the distance of the vortex pressed in (or pushed out) the branch distance was larger, and the vortex area was also larger (Figure 13a). In the case of α = 90°, the sound vortex took on the form of whipping (Figure 13b), and the sound vortex exhibited the similar mode in the case of α = 80°. In the cases of α > 90°, the shear layer shed from the upstream main pipe wall propagated backward along the flow direction, and it was basically no swing (Figure 13c). The results show that the acoustic vortices were more likely to fall into the branches and accumulate the sound energy more easily in the backward-swept branch structure (α < 90°), which caused greater pressure fluctuation amplitude in a wider range of velocity, while in the cases of α > 90° the results were just the opposite. It was revealed that the acoustic vortex at the branch mouth was the exciting source of acoustic resonance.
Figure 14 shows the pressure contours in the pipe of different branch angles in the flow velocity of v = 50 m/s. In the case of α = 60°, a 1/4 wavelength standing wave of the first-order acoustic frequency was formed. In the case, α = 90°, a 3/4 wavelength standing wave of the second-order frequency was formed, and similar phenomena occur in the case of α = 80°. However, in the case of α = 120°, the pressure in the branch was uniform, the standing wave did not exist, and only a continuous high-pressure point was formed at the vertex of the branch mouth downstream wall (Figure 14c), and similar phenomena occur in the case of α = 100°.

5. Conclusions

The realizable k-ε DDES model was used to simulate the acoustic resonance in different shape closed side branches. The results show that the realizable k-ε DDES model could effectively predict the acoustic resonance, and it was found that the shape of the branch had a significant effect on the acoustic resonance. The conclusions are summarized as follows:
  • The Strouhal number range from onset to offset of acoustic resonance were consistent in the circular branch and the equivalent diameter square branch, which indicated that the results studied in these two shapes pipe were universal for predicting the occurrence of acoustic resonance. The vortex modes in the branch mouths were similar, which indicated the similarity of the mechanisms in these two shapes;
  • The intersection line of the circular pipe intensified the z-direction oscillation of the sound vortex at the branch mouth, which led to energy dissipation and reduced the pressure fluctuation amplitude of the acoustic resonance caused by the sound source excitation. Therefore, compared with the circular branch, acoustic resonance in the equivalent square branch provided higher pressure pulsation and was more efficient in wind energy harvesting. The design of a square wind energy harvester was better than that of a circular one;
  • At a certain flow rate, acoustic resonance show unstable beats phenomena. These phenomena were independent of the shape of the pipe and were related to whether the flow velocity in the main pipe was close to the frequency conversion point;
  • The branch angle α had a significant effect on the acoustic resonance. It was found that changing the branch angle could increase or suppress the acoustic resonance, which could improve the utilization efficiency of the acoustic resonance and provide a new method for suppressing the acoustic resonance. As α = 60°, the acoustic resonance maintains the first-order frequency in a wide range of flow velocity, which could be more efficient in wind energy harvesting. As α = 120°, the acoustic resonance was suppressed in a wide range of velocity, which could be more efficient and economical to suppress the acoustic resonance in the gas transmission pipeline system;
  • In the present simulation, all cases were initialized from the inlet with the corresponding mass-flow rate. Taking the quasi-steady acoustic resonance state of one flow velocity as the initial state of another flow velocity was expected to reduce the cost of the solution. However, the impact of this operation should be further studied. In addition, the effect of changing the branch angle shows great potential application value. Therefore, it is worthy of further study to verify this effect by experimental method.

Author Contributions

Conceptualization, L.J. and H.Z.; methodology, L.J., Q.D. and H.Z.; validation, L.J., H.Z., Q.D. and X.L.; data curation, L.J.; writing—original draft preparation, L.J.; writing—review and editing, H.Z.; supervision, H.Z.; project administration, H.Z.; funding acquisition, H.Z. and X.L. All authors have read and agreed to the published version of the manuscript.

Funding

This research was funded by China National Key Research and Development Plan (no. 2016YFC0802105).

Institutional Review Board Statement

Not applicable.

Informed Consent Statement

Not applicable.

Data Availability Statement

The data used to support the findings of this study are available from the corresponding author upon request.

Conflicts of Interest

The authors declare no conflict of interest.

References

  1. Sun, D.; Xu, Y.; Chen, H.; Shen, Q.; Zhang, X.; Qiu, L. Acoustic characteristics of a mean flow acoustic engine capable ofwind energy harvesting: Effect of resonator tube length. Energy 2013, 55, 361–368. [Google Scholar] [CrossRef]
  2. Sun, D.; Xu, Y.; Chen, H.; Wu, K.; Liu, K.; Yu, Y. A mean flow acoustic engine capable of wind energy harvesting. Energy Conver. Manag. 2012, 63, 101–105. [Google Scholar] [CrossRef]
  3. Yu, Y.S.W.; Sun, D.; Zhang, J.; Xu, Y.; Qi, Y. Study on a Pi-type mean flow acoustic engine capable of wind energy harvesting using a CFD model. Appl. Energy 2017, 189, 602–612. [Google Scholar] [CrossRef]
  4. Yu, Y.; Sun, D.; Wu, K.; XU, Y.; Chen, H.; Zhang, X.; Qiu, L. CFD study on mean flow engine for wind power exploitation. Energy Convers. Manag. 2011, 52, 2355–2359. [Google Scholar] [CrossRef]
  5. Slaton, W.V.; Zeegers, J.C.H. Acoustic power measurements of a damped aeroacoustically driven resonator. J. Acoust. Soc. Am. 2005, 118, 83–91. [Google Scholar] [CrossRef] [PubMed]
  6. Slaton, W.V.; Zeegers, J.C.H. An aeroacoustically driven thermoacoustic heat pump. J. Acoust. Soc. Am. 2005, 117, 3628. [Google Scholar] [CrossRef] [PubMed]
  7. Luo, E. Experimental Study on Thermoacoustic Refrigerators Driven by a Travelling-Wave Thermoacoustic Engine. In AIP Conference Proceedings; AIP Publishing: New York, NY, USA, 2003. [Google Scholar]
  8. Tonon, D.; Hirschberg, A.; Golliard, J.; Ziada, S. Aeroacoustics of pipe systems with closed branches. Noise Notes 2011, 10. [Google Scholar] [CrossRef]
  9. Kriesels, P.C.; Peters, M.C.A.M.; Hirschberg, A. High amplitude vortex-induced pulsations in a gas transport system. J. Sound Vibrat. 1995, 184, 343–368. [Google Scholar] [CrossRef]
  10. DeBoo, G.; Gesior, R.; Ramsden, K.; Strub, B. Identification of quad cities main steam line acoustic sources and vibration reduction. In American Society of Mechanical Engineers, Pressure Vessels and Piping Division (Publication) PVP; American Society of Mechanical Engineers: New York, NY, USA, 2008; Volume 4, pp. 485–491. [Google Scholar]
  11. Baldwin, R.M.; Simmons, H.R. Flow-induced vibration in safety relief valves. J. Press. Vessel Technol. 2009, 120, 267–272. [Google Scholar] [CrossRef]
  12. Okuyama, K.; Tamura, A.; Takahashi, S.; Ohtsuka, M.; Tsubaki, M. Flow-induced acoustic resonance at the mouth of one or two side branches. Nuclear Eng. Des. 2012, 249, 154–158. [Google Scholar] [CrossRef]
  13. Xiao, Y.; Gu, H.; Gao, X.; Zhang, H.; Zhao, W. Flow visualization study of flow-induced acoustic resonance in closed side branches. Ann. Nuclear Energy 2018, 149, 107783. [Google Scholar] [CrossRef]
  14. Xiao, Y.; Zhao, W.; Gu, H.; Gao, X. Effects of branch length and chamfer on flow-induced acoustic resonance in closed side branches. Ann. Nuclear Energy 2018, 121, 186–193. [Google Scholar] [CrossRef]
  15. Tamura, A.; Okuyama, K.; Takahashi, S.; Ohtsuka, M. Development of numerical analysis method of flow-acoustic resonance in stub pipes of safety relief valves. J. Nuclear Sci. Technol. 2012, 49, 793–803. [Google Scholar] [CrossRef]
  16. Bravo, R.; Ziada, S.; Dokainish, M. Aeroacoustic Response of an Annular Duct with Coaxial Closed Side Branches. In Collection of Technical Papers, Proceedings of the 11th AIAA/CEAS Aeroacoustics Conference, Monterrey, CA, USA, 23–25 May 2005; ARC: Reston, VA, USA, 2005. [Google Scholar]
  17. Arthurs, D.; Ziada, S.; Bravo, R. Flow induced acoustic resonances of an annular duct with co-axial side branches. In American Society of Mechanical Engineers, Pressure Vessels and Piping Division (Publication) PVP; American Society of Mechanical Engineers: New York, NY, USA, 2006. [Google Scholar]
  18. Arthurs, D.; Ziada, S. Flow-excited acoustic resonances of coaxial side-branches in an annular duct. J. Fluids Struct. 2009, 25, 42–59. [Google Scholar] [CrossRef]
  19. Ziada, S. Flow-excited acoustic resonance in industry. J. Press. Vessel Technol. Trans. ASME 2010, 132, 015001. [Google Scholar] [CrossRef]
  20. Ziada, S.; Lafon, P. Flow-excited acoustic resonance excitation mechanism, design guidelines, and counter measures. Appl. Mech. Rev. 2014, 66, 010802. [Google Scholar] [CrossRef]
  21. Dequand, S.; Hulshoff, S.J.; Hirschberg, A. Self-sustained oscillations in a closed side branch system. J. Sound Vibrat. 2003, 265, 359–386. [Google Scholar] [CrossRef]
  22. Li, Y.; Someya, S.; Okamoto, K.; Inagaki, T.; Nishi, Y. Study on flow-induced acoustic resonance in symmetrically located side-branches using dynamic PIV technique. J. Fluid Sci. Technol. 2014, 9. [Google Scholar] [CrossRef] [Green Version]
  23. Li, Y.; Someya, S.; Okamoto, K.; Inagaki, T.; Nishi, Y. Visualization study of flow-excited acoustic resonance in closed tandem side branches using high time-resolved particle image velocimetry. J. Mech. Sci. Technol. 2015, 29, 989–999. [Google Scholar] [CrossRef]
  24. Salt, E.; Mohamed, S.; Arthurs, D.; Ziada, S. Aeroacoustic sources generated by flow-sound interaction in a T-junction. J. Fluids Struct. 2014, 51, 116–131. [Google Scholar] [CrossRef]
  25. Salt, E.; Mohamed, S.; Arthurs, D.; Ziada, S. Identification of aeroacoustic sources in a T-junction. In American Society of Mechanical Engineers, Pressure Vessels and Piping Division (Publication) PVP; American Society of Mechanical Engineers: New York, NY, USA, 2014. [Google Scholar]
  26. Ziada, S. A flow visualization study of flow- acoustic coupling at the mouth of a resonant side-branch. J. Fluids Struct. 1994, 8, 391–416. [Google Scholar] [CrossRef]
  27. Ziada, S.; Shine, S. Strouhal numbers of flow-excited acoustic resonance of closed side branches. J. Fluids Struct. 1999, 13, 127–142. [Google Scholar] [CrossRef]
  28. Bruggeman, J.C.; Hirschberg, A.; van Dongen, M.E.H.; Wijnands, A.P.J.; Gorter, J. Self-sustained aero-acoustic pulsations in gas transport systems: Experimental study of the influence of closed side branches. J. Sound Vib. 1991, 150, 371–393. [Google Scholar] [CrossRef]
  29. Jiang, L.; Zhang, H.; Duan, Q.; Zhang, Y. Numerical study on acoustic resonance excitation in closed side branch pipeline conveying natural gas. Shock Vibrat. 2020, 2019, 8857838. [Google Scholar] [CrossRef]
  30. Jungbauer, D.E.; Eckhardt, L.L. Flow-induced noise and vibration in turbocompressors and piping systems. Hydrocarb. Process. 2000, 79, 7. [Google Scholar]
  31. Yu, Y.; Sun, D.M.; Ma, J.F.; Xu, Y.Q.; Chen, H.; Wu, K.; Ao, W.; Yan, W.; Qiu, L. Experimental study on acoustic characteristics of mean flow acoustic engine. J. Eng. Thermophys. 2012, 33, 23–26. [Google Scholar]
  32. Morita, R.; Takahashi, S.; Okuyama, K.; Inada, F.; Ogawa, Y.; Yoshikawa, K. Evaluation of acoustic- and flow-induced vibration of the BWR main steam lines and dryer. J. Nuclear Sci. Technol. 2011, 48, 759–776. [Google Scholar] [CrossRef]
  33. Radavich, P.M.; Selamet, A.; Novak, J.M. A computational approach for flow–acoustic coupling in closed side branches. J. Acoust. Soc. Am. 2001, 116, 105–112. [Google Scholar] [CrossRef] [Green Version]
  34. Spalart, P.R.; Deck, S.; Shur, M.L.; Squires, K.D.; Strelets, M.K.; Travin, A. A new version of detached-eddy simulation, resistant to ambiguous grid densities. Theor. Comput. Fluid Dyn. 2006, 20, 181–195. [Google Scholar] [CrossRef]
  35. Tan, X.M.; Xie, P.P.; Yang, Z.G.; Gao, J.Y. Adaptability of turbulence models for pantograph aerodynamic noise simulation. Shock Vibrat. 2019, 2019, 6405809. [Google Scholar] [CrossRef]
  36. Zhang, Y.; Zhang, J.; Li, T.; Zhang, L.; Zhang, W. Research on aerodynamic noise reduction for high-speed trains. Shock Vibrat. 2016, 2016. [Google Scholar] [CrossRef]
  37. Jeong, S.M.; Choi, J.Y. Combined diagnostic analysis of dynamic combustion characteristics in a scramjet engine. Energies 2020, 13, 29. [Google Scholar] [CrossRef]
  38. Sedano, C.A.; Berger, F.; Rahimi, H.; Lopez Mejia, O.D.; Kühn, M.; Stoevesandt, B. CFD validation of a model wind turbine by means of improved and delayed detached eddy simulation in openFoam. Energies 2019, 12, 1306. [Google Scholar] [CrossRef] [Green Version]
  39. Li, J.; Hu, J.; Zhang, C. Investigation of vortical structures and turbulence characteristics in corner separation in an axial compressor stator using DDES. Energies 2020, 13, 2123. [Google Scholar] [CrossRef]
  40. ANSYS. ANSYS Fluent User’s Guide; ANSYS Inc.: Canonsburg, PA, USA, 2019. [Google Scholar]
  41. Yuan, Q.; Yu, B.; Li, J.; Han, D.; Zhang, W. Study on the restart algorithm for a buried hot oil pipeline based on wavelet collocation method. Int. J. Heat Mass Transf. 2018. [Google Scholar] [CrossRef]
  42. Zhang, K.; Li, J.; Yu, B.; Han, D.; Chen, Y. Fast prediction of the replacement process of oil vapor in horizontal tank and its improved safety evaluation method. Process Saf. Environ. Protect. 2019, 122, 298–306. [Google Scholar] [CrossRef]
  43. Shao, Z.; Zhou, T.; Zhu, H.; Zang, Z.; Zhao, W. Amplitude enhancement of flow-induced vibration for energy harnessing. E3S Web Conf. 2020, 160. [Google Scholar] [CrossRef]
  44. Zhu, H.; Zhao, Y.; Zhou, T. CFD analysis of energy harvesting from flow induced vibration of a circular cylinder with an attached free-to-rotate pentagram impeller. Appl. Energy 2018, 212, 304–321. [Google Scholar] [CrossRef]
  45. Zhu, H.; Zhao, Y.; Hu, J. Performance of a novel energy harvester for energy self-sufficiency as well as a vortex-induced vibration suppressor. J. Fluids Struct. 2019, 91, 102736. [Google Scholar] [CrossRef]
Figure 1. The gas flows through a closed side branch.
Energies 14 01725 g001
Figure 2. The method workflow of the simulation.
Energies 14 01725 g002
Figure 3. Geometry model schematic of pipe shapes, (a) case 1: circular pipe, α = 90°, (b) case 2: square pipe, α = 90°, (c) case 3: square pipe, α = 60°, (d) case 4: square pipe, α = 80°, (e) case 5: square pipe, α = 100°, and (f) case 6: square pipe, α = 120°.
Energies 14 01725 g003
Figure 4. Grid partition of case 1.
Energies 14 01725 g004
Figure 5. Verification for grid-independent solutions (a); validation between the experimental data of Ziada et al. [27] and the current simulation results (b).
Energies 14 01725 g005
Figure 6. Time histories of static pressure at the monitoring point p1 of circular pipe (case 1), St = 0.26 (a), St = 0.30 (b), St = 0.42 (c).
Energies 14 01725 g006
Figure 7. Time histories of static pressure at the monitoring point p1 of square pipe (case 2), St = 0.26 (a), St = 0.30 (b), St = 0.42 (c).
Energies 14 01725 g007
Figure 8. The vorticity (unit: s−1) at the peak pressure value (left) and the nadir pressure value (right) of the circular section pipe (a) and the equivalent square section pipe (b), St = 0.3.
Energies 14 01725 g008
Figure 9. Variation of pressure fluctuation with St.
Energies 14 01725 g009
Figure 10. The z-velocity at the center of the branch entrance. (a) Case 1; (b) Case 2.
Energies 14 01725 g010
Figure 11. The beating phenomenon at the flow velocity of v = 70 m/s, (a) α = 60°, (b) α = 90°.
Energies 14 01725 g011
Figure 12. Variation of pressure fluctuation with St.
Energies 14 01725 g012
Figure 13. The vorticity (unit: s−1) at the peak pressure value (left) and the nadir pressure value (right) of α = 60° (a), α = 90° (b) and α = 120°(c), v = 50 m/s.
Energies 14 01725 g013
Figure 14. The pressure (unit: Pa) contour at the peak pressure value (left) and the nadir pressure value (right) of α = 60° (a), α = 90° (b) and α = 120° (c), v = 50 m/s.
Energies 14 01725 g014
Table 1. Configuration of the cases.
CaseMain Pipe Cross-Section ShapeBranch Cross-Section ShapeBranch Angle A
1CircularCircular90°
2SquareSquare90°
3SquareSquare60°
4SquareSquare80°
5SquareSquare100°
6SquareSquare120°
Publisher’s Note: MDPI stays neutral with regard to jurisdictional claims in published maps and institutional affiliations.

