
Techno-Economic Analysis of On-Site Energy Storage Units to Mitigate Wind Energy Curtailment: A Case Study in Scotland


Abstract
1. Introduction
- Feed in Tariffs—proposed for a limited scale action [11].
- Renewables Obligation (RO)–Renewables Obligation (RO)—this scheme is an obligation of electricity suppliers in the UK to resource a rising rate of renewable energy in their electricity consumption or effective payments for certificates instead [12].
- Contracts for Difference (CfDs)—this is a kind of grant for renewable projects through an auction process for selected candidates. They get a fixed Strike Price for the period of the agreement which is regularly 15 years to minimise the consumer’s prices [13].
2. Literature Review
2.1. Constraint Payments, Energy Wastage, and Financial Losses
2.2. Energy Storage Systems for Wind Farm Curtailment
- Increases the efficiency of intermittent renewable sources that can be integrated into intelligent integrated energy systems,
- Leads to reducing the need for maximum production capacity,
- Supports grid stability (grids provide solutions in restricted areas),
- Allows performance development and cost improvement,
- Supports the energy security of nations [45],
- Optimises the demand and supply tension [44].
2.2.1. Mechanical Storage Systems (MSS)
2.2.2. Electrochemical Energy Storage Systems (EESS)
Lead-Acid Batteries
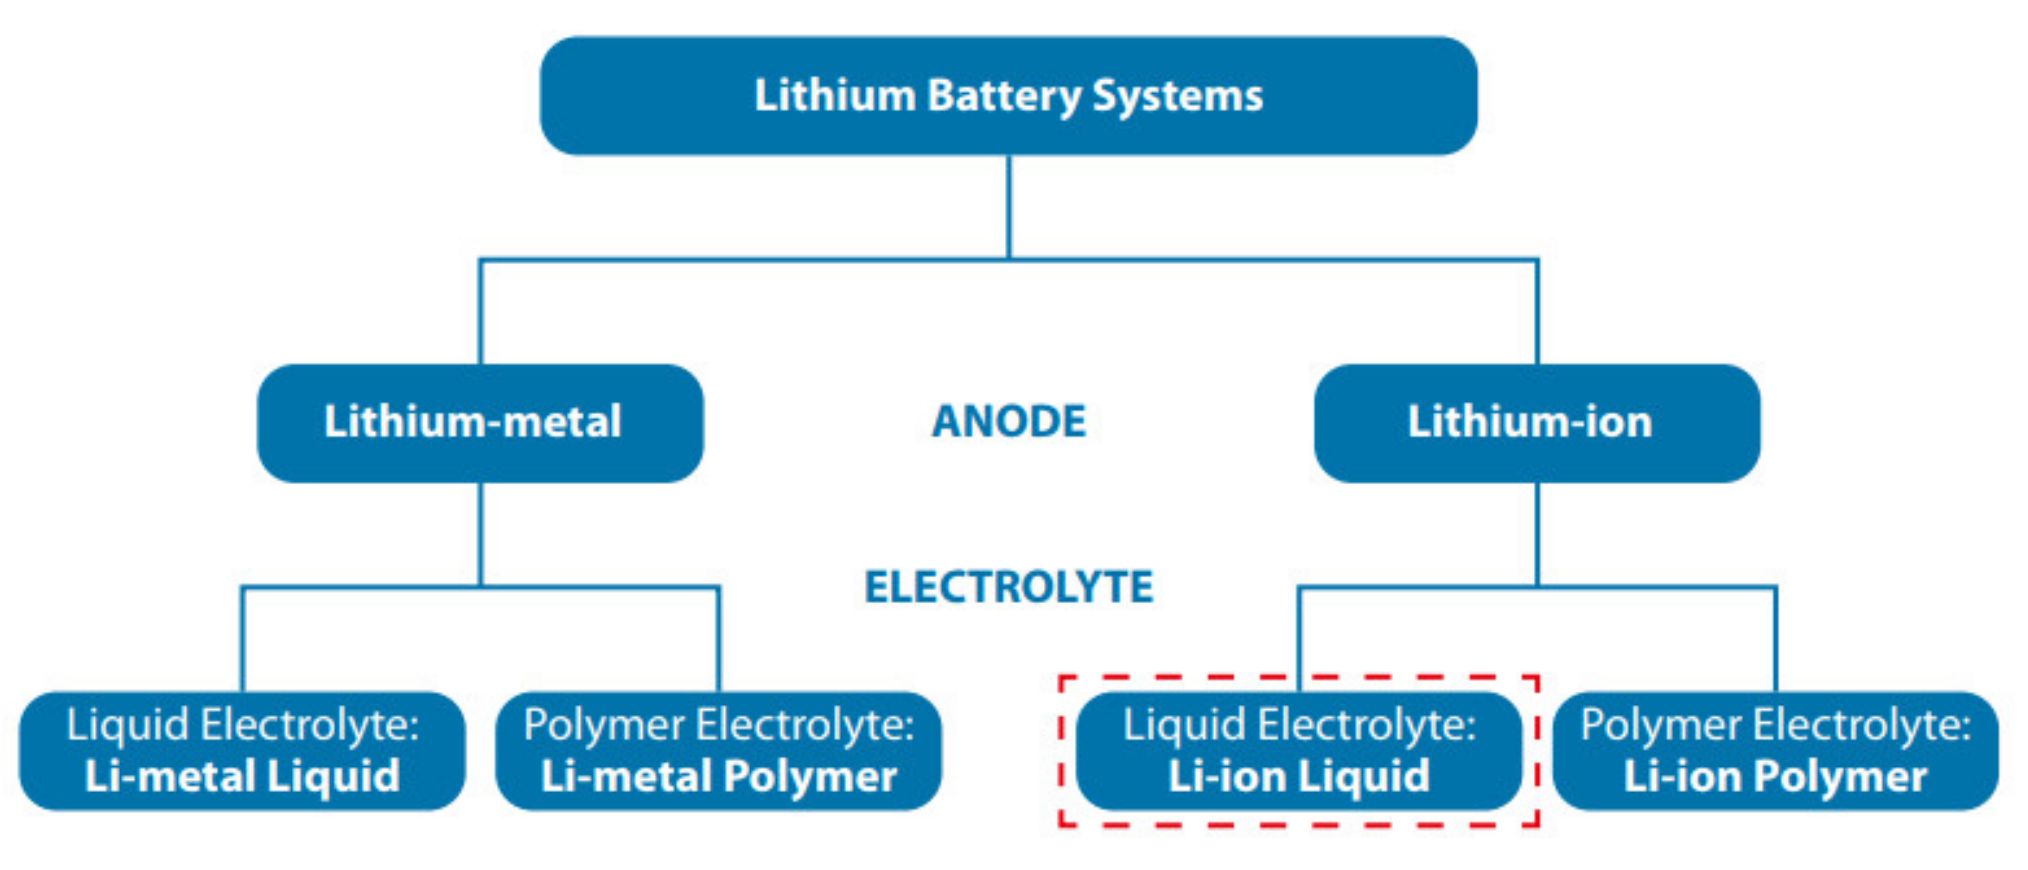
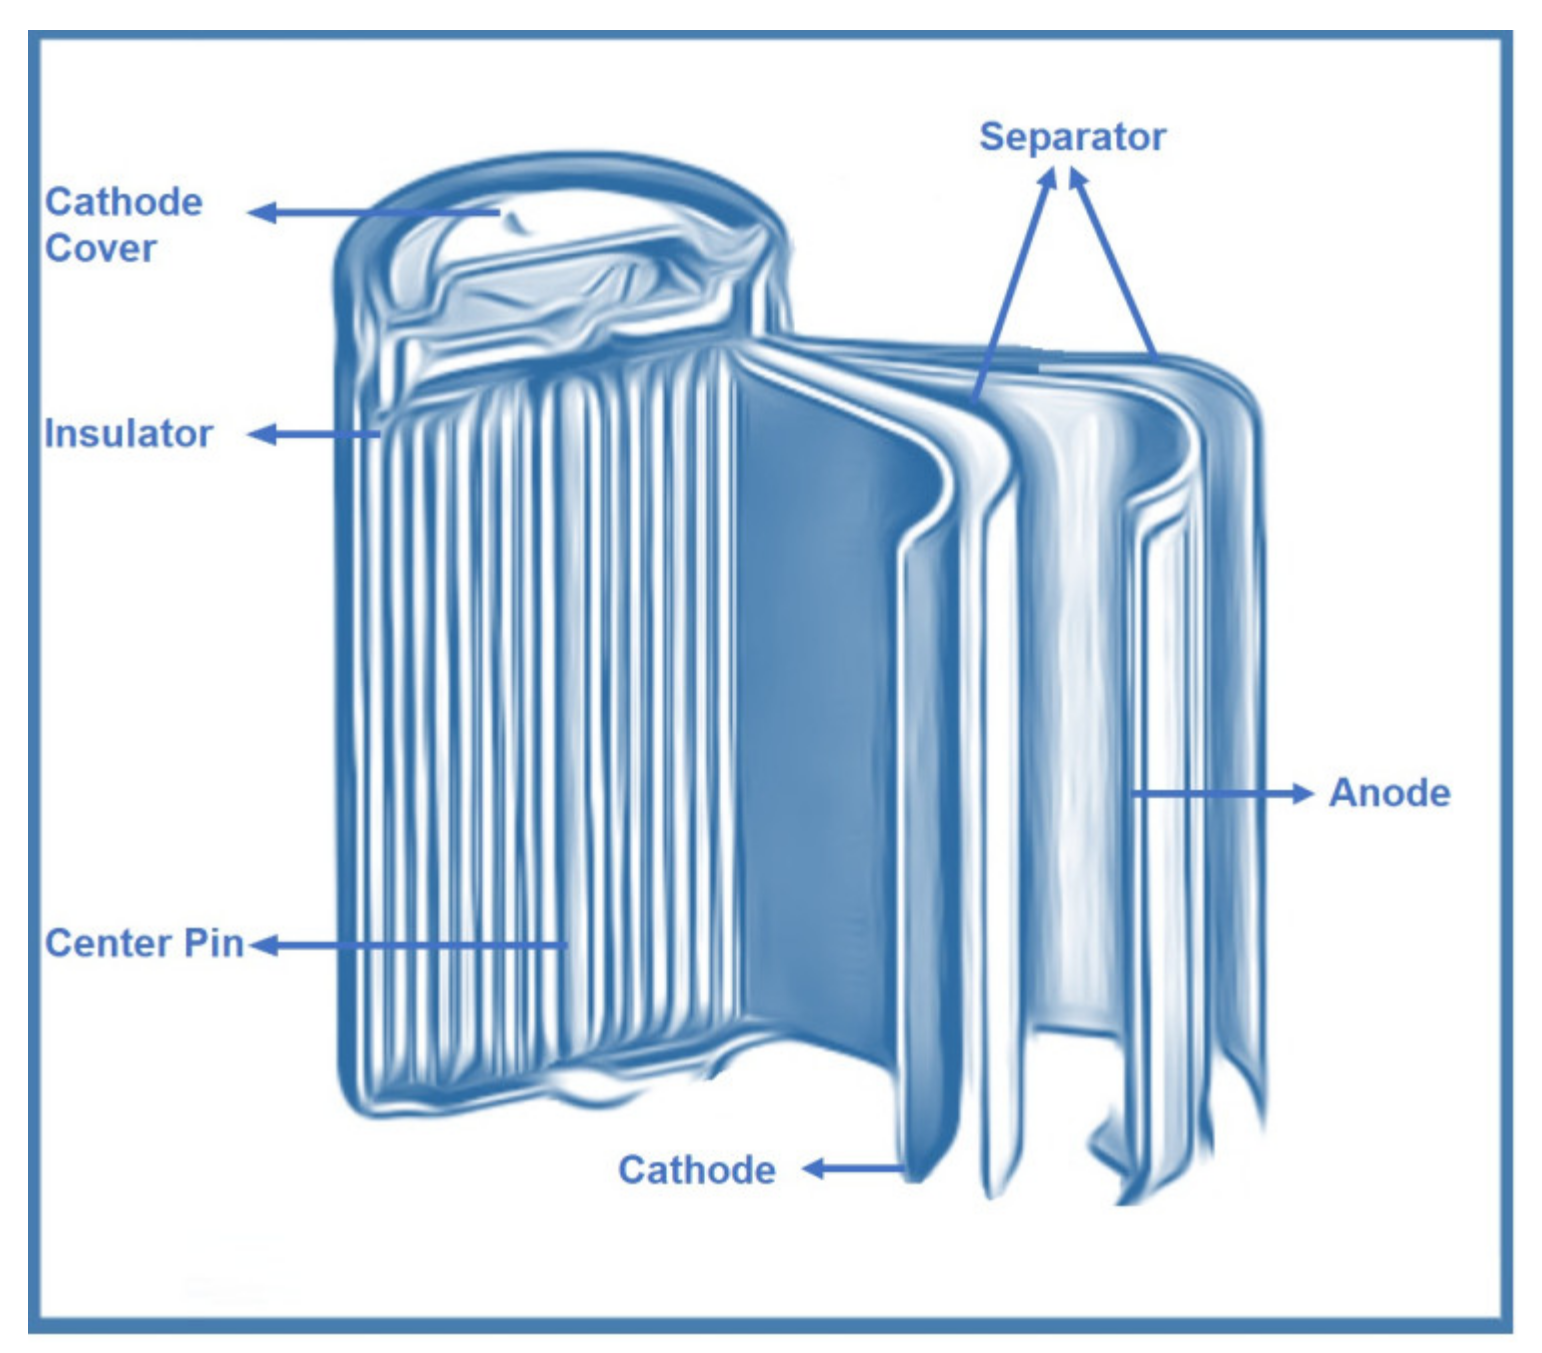
Lithium-Ion Batteries
Chemical Energy Storage Systems
2.3. Mathematical Models for Energy Storage Systems
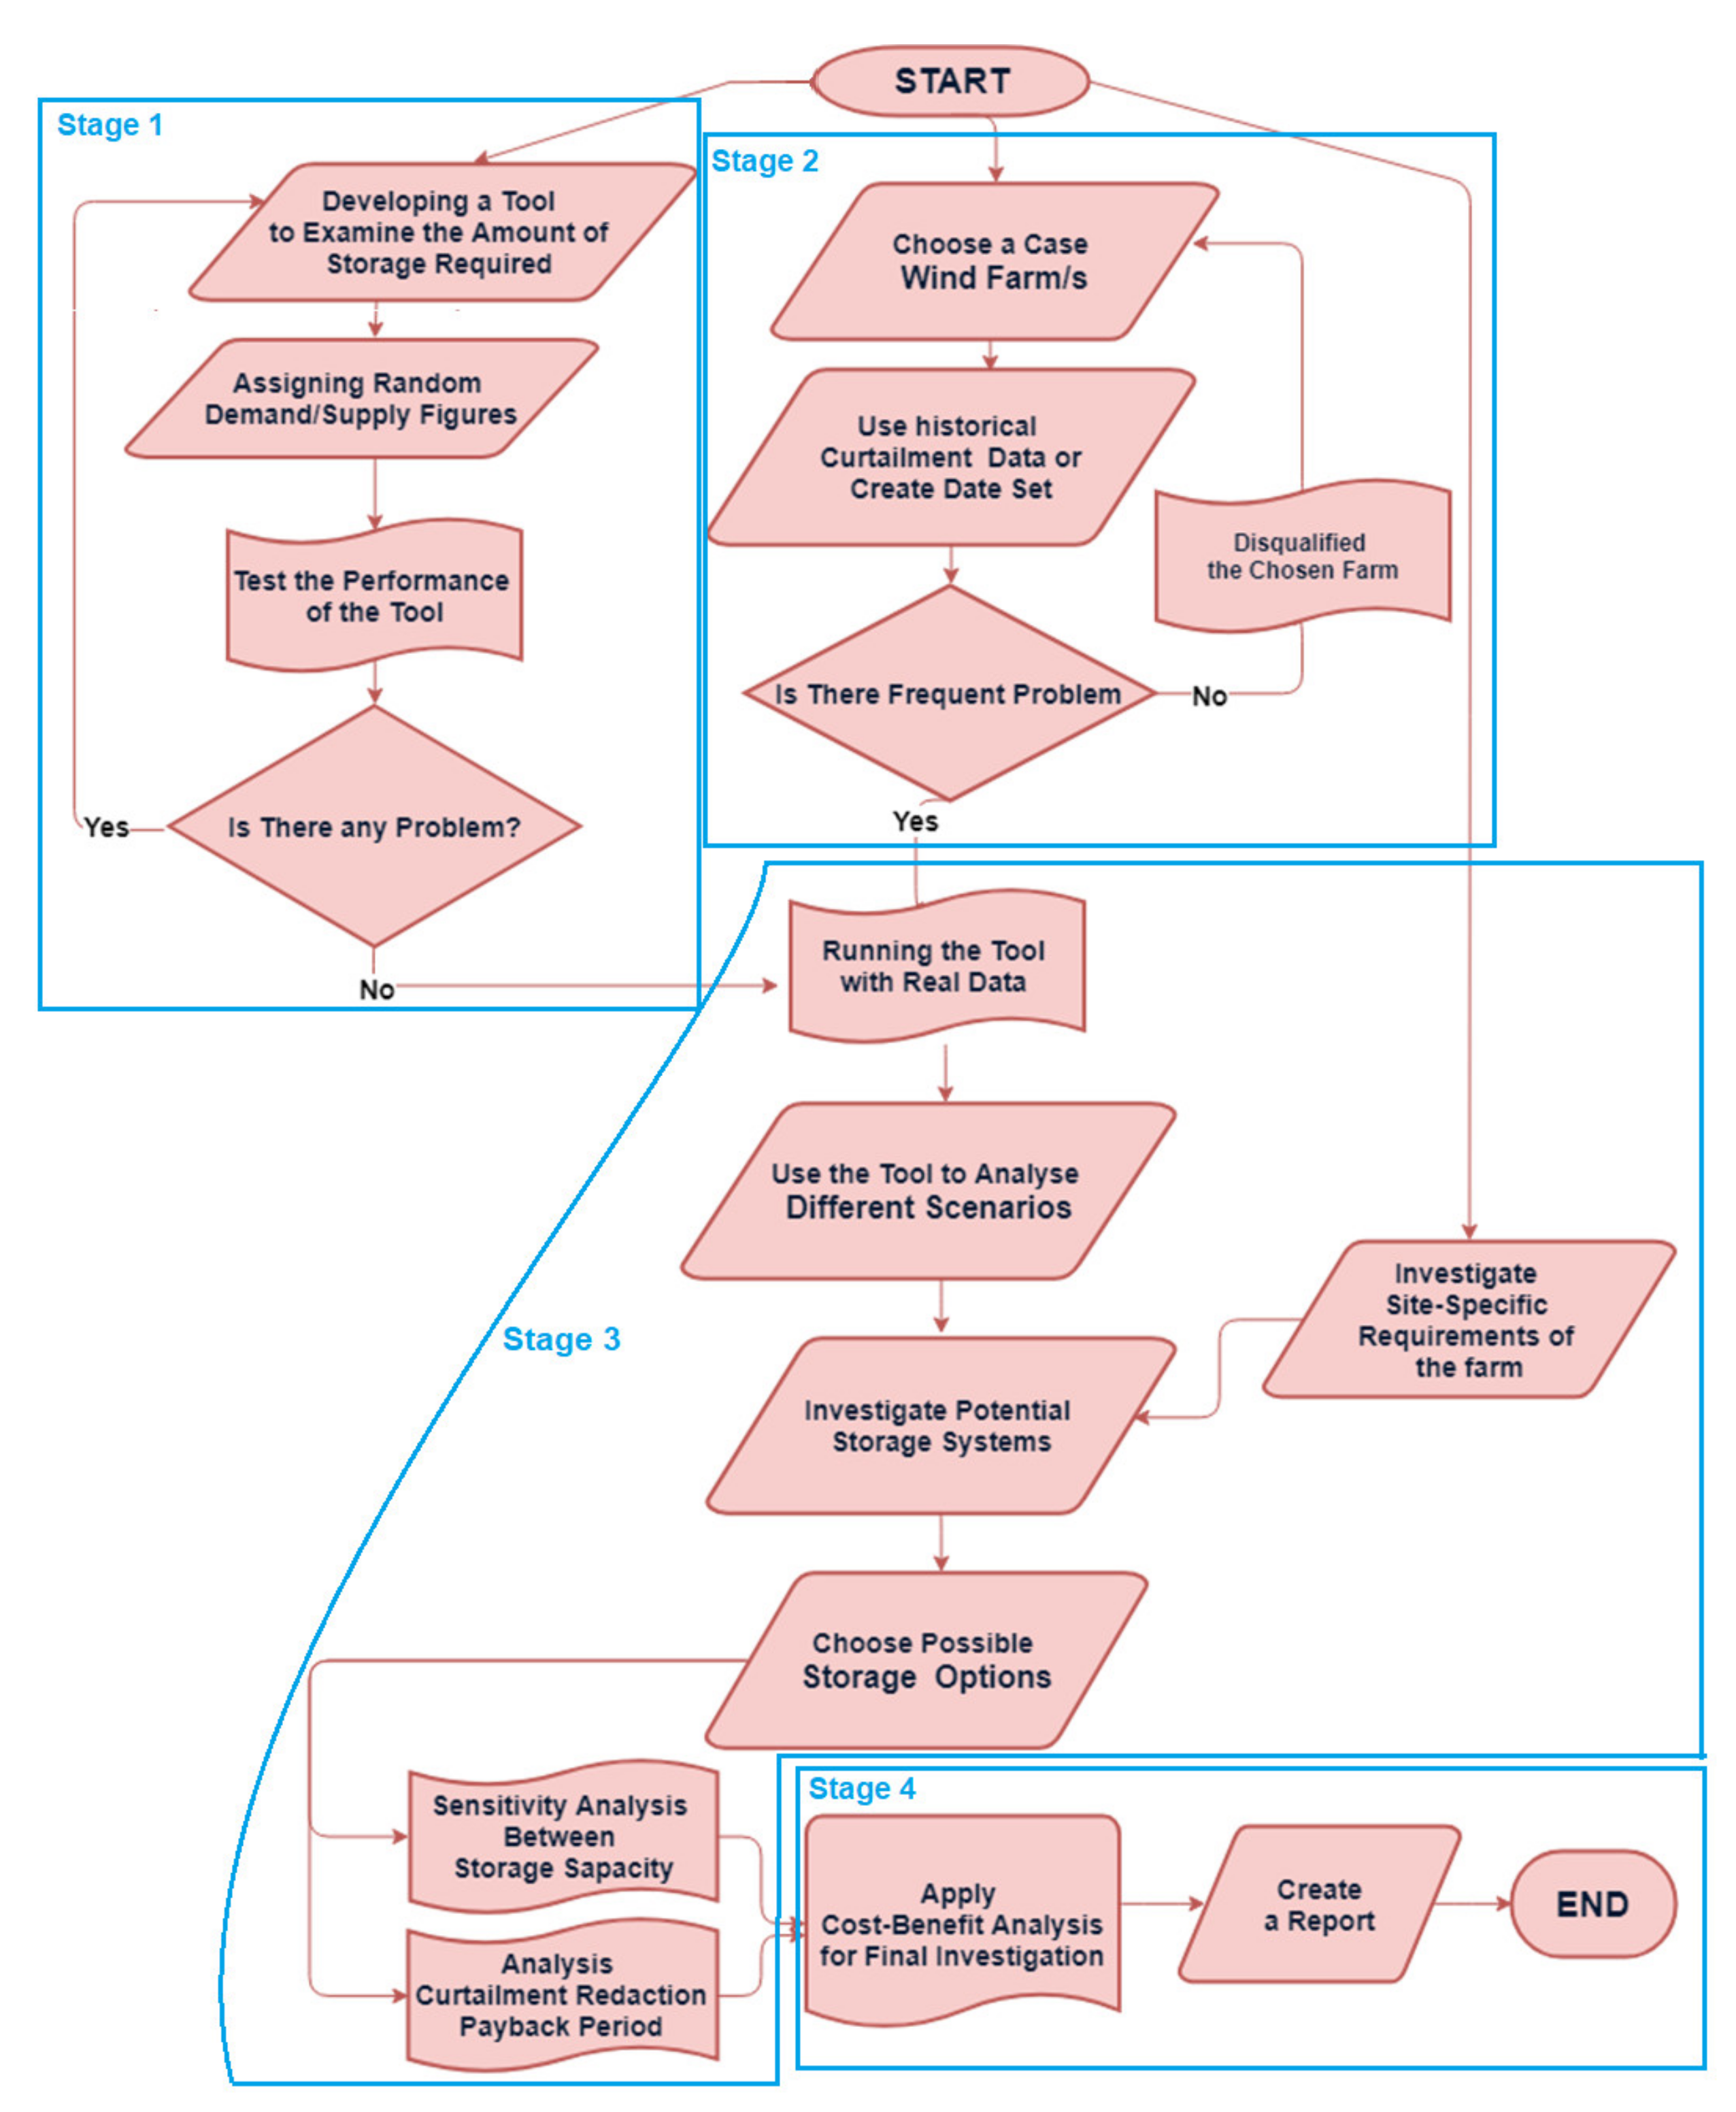
3. Research Method
- Stage 1 is developing a tool to examine the size of storage required to utilise curtailed wind energy for a wind power plant. The first step of this part is developing a tool to utilise curtailed wind energy. The second step is assigning random demand/supply figures to test the performance of the tool. The final step is testing the performance of the tool.
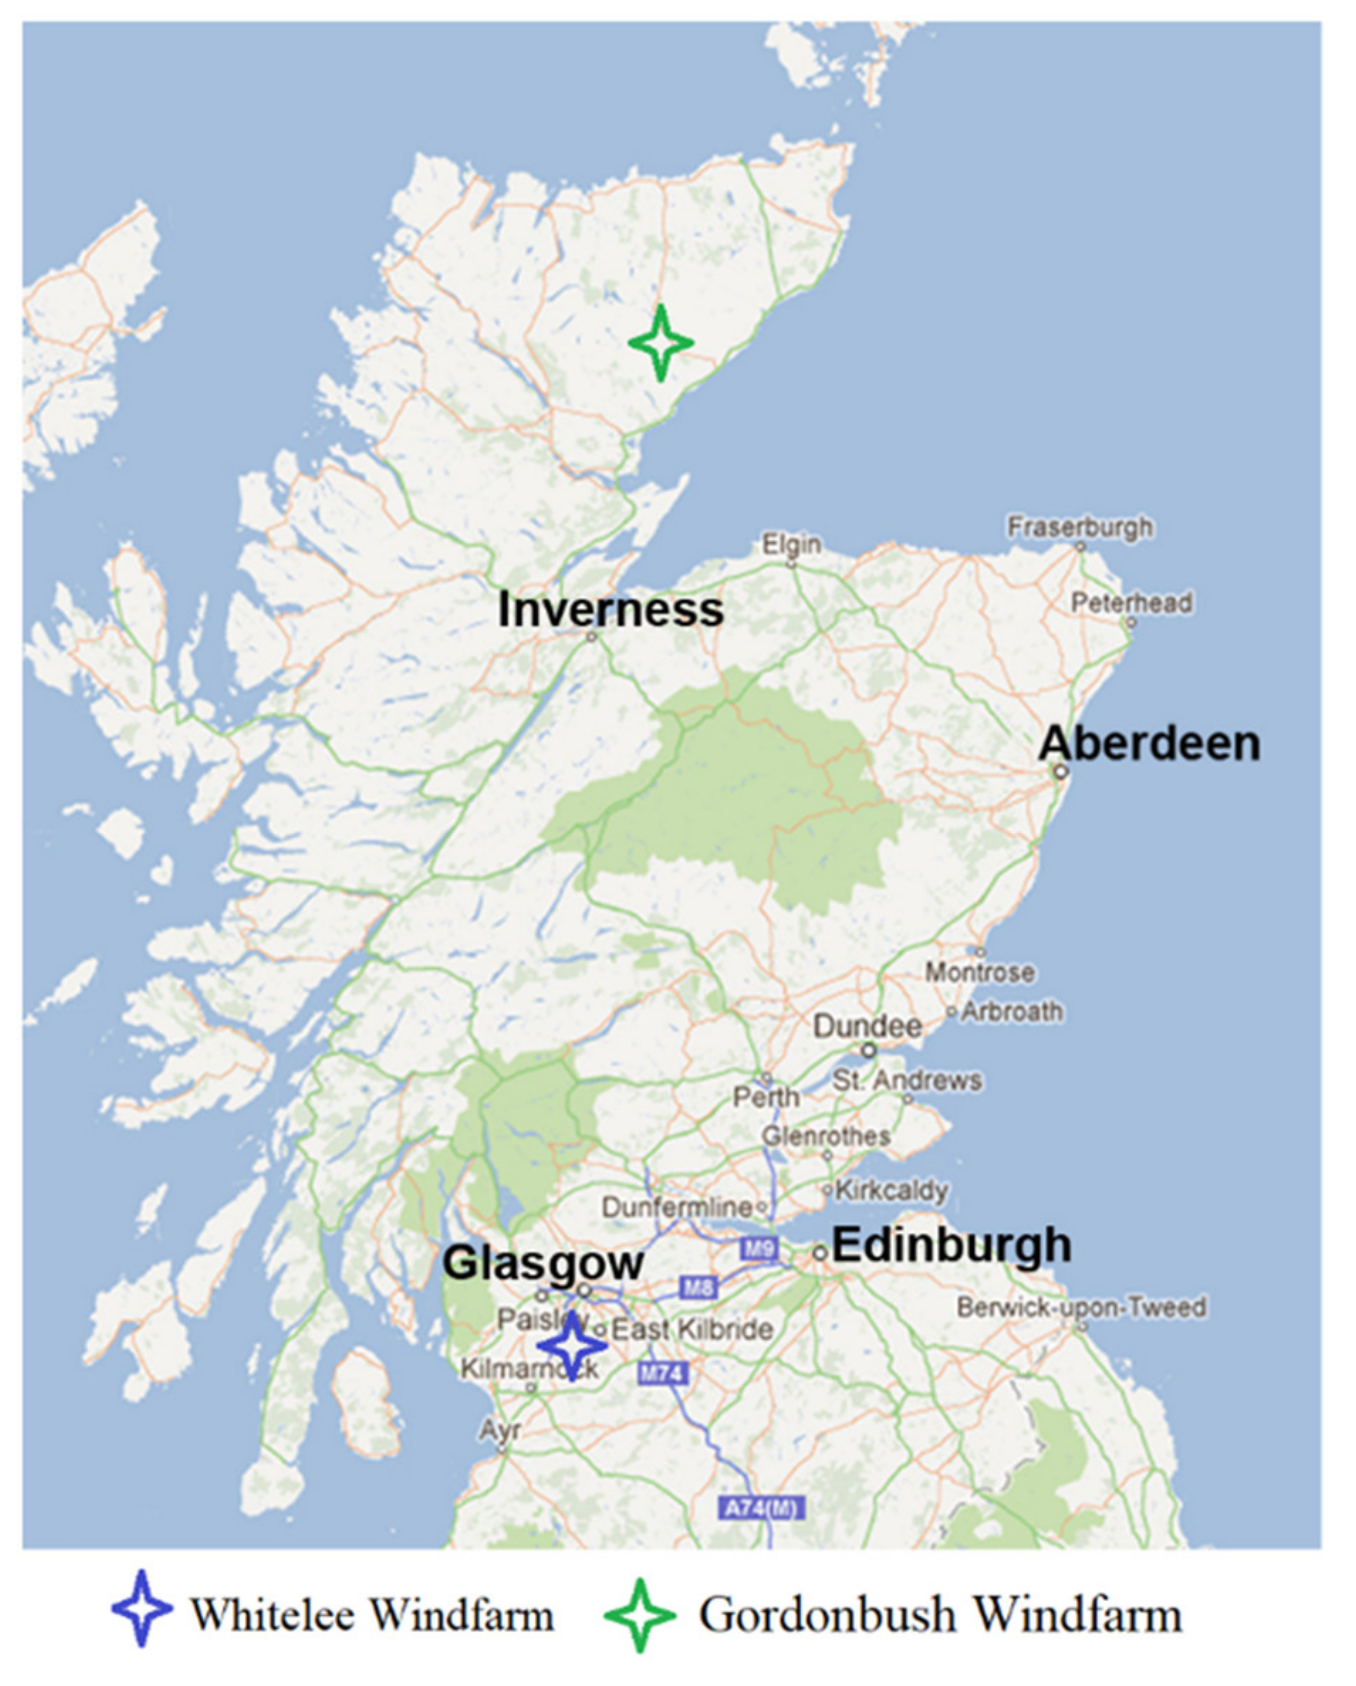
- Stage 2 is the case study selection. Wind farms are chosen among the ones that suffer the most from curtailment in Scotland. However, any wind farm can be chosen if they are having curtailment problems and offer easy access to data.
- Stage 3 is about the application of the tool into the chosen cases. Firstly, running the tool with real data from the selected wind power plant based on the different scenarios takes place in this stage. Then, investigation takes place to figure out the capacity of the potential storage systems based on the site-specific requirements for the selected wind farm. After that, this stage carries out sensitivity analysis between storage capacity change and the curtailment reduction or payback period of the investment.
- Stage 4 is the final one in which the cost–benefit analysis of the selected scenarios is performed and results of the research are documented. This technique identifies the costs and benefits to compare them to discuss if the costs outweigh the benefits or vice versa. While reporting the result outcomes, different techniques may be used to examine the sensibility of the results.
4. Results and Discussion
- Whitelee wind farm has two stages. The export capacity of the wind farm was assumed as 161 MW for Whitlee-1 108.5 MW for Whitelee 2 and in total 269.5 MW for Whitelee 1 and 2 for the period of 2013–2014; 152.5 MW for Whitelee 1, 103 MW for Whitelee 2, in total 255.5 MW for Whitelee 1 and 2 for the period of 2014–2015 and 35 MW for the Gordonbush wind farms for both periods;
- As the appropriate storage type was selected as Li-ion batteries, the efficiency of the battery cycle was taken as 85% [67];
- Average cash flow bids (£) per MWh was taken as GBP 76.532 [46];
- Li-ion battery cost per MWh was taken as GBP 207,000 [68];
- Average electricity price (£) per MWh was taken as GBP 45.903 [69];
- The data was recorded as a financial year (start of April to end of March) instead of a calendar year. Therefore, the data range chosen for wind farms starts from the beginning of April 2013 to the end of March 2015;
- Life of the lithium-ion battery is assumed to be 15 years with today’s technologies. However, by considering future technological breakthroughs, this study did not consider any lifetime limits and ignored when the results of payback periods exceeded 15 years.
Limitations of the Study
5. Conclusions
Author Contributions
Funding
Acknowledgments
Conflicts of Interest
References
- Krymm, R.; International Atomic Energy Agency (IAEA). The Economic Impact of Oil Prices. Available online: https://www.iaea.org/sites/default/files/publications/magazines/bulletin/bull16–1/161_204006065.pdf (accessed on 17 July 2018).
- Energy World. Clean Growth Strategy Must be Translated Urgently into Action. Energy Institute: London, UK, 2018; 8.
- Carrington, D. Renewable Energy Defies Covid-19 to Hit Record Growth in 2020. Available online: https://www.theguardian.com/environment/2020/nov/10/renewable-energy-covid-19-record-growth-2020 (accessed on 15 January 2021).
- Blakers, A.; Stocks, M. Solar PV and wind are on track to replace all coal, oil and gas within two decades. Sci. Educ. News 2018, 67, 44–45. [Google Scholar]
- Kåberger, T. Progress of renewable electricity replacing fossil fuels. Glob. Energy Interconnect. 2018, 1, 48–52. [Google Scholar]
- Roth, B.M.; Jaramillo, P. Going nuclear for climate mitigation: An analysis of the cost effectiveness of preserving existing US nuclear power plants as a carbon avoidance strategy. Energy 2017, 131, 67–77. [Google Scholar] [CrossRef]
- Williams, E.; Hittinger, E.; Carvalho, R.; Williams, R. Wind power costs expected to decrease due to technological progress. Energy Policy 2017, 106, 427–435. [Google Scholar] [CrossRef]
- WWEA. World Wind Capacity at 650,8 GW, Corona Crisis Will Slow Down Markets in 2020, Renewables to Be Core of Economic Stimulus Programmes. Available online: https://wwindea.org/world-wind-capacity-at-650-gw/ (accessed on 17 January 2021).
- Independent. Renewable Energy Sets New Record by Producing Nearly a Third of UK Electricity. 29 September 2017. Available online: https://www.independent.co.uk/climate-change/news/renewable-energy-electricity-new-record-uk-wind-solar-a7972266.html (accessed on 22 August 2018).
- Wood, G.; Dow, S. What lessons have been learned in reforming the Renewables Obligation? An analysis of internal and external failures in UK renewable energy policy. Energy Policy 2011, 39, 2228–2244. [Google Scholar] [CrossRef]
- Huenteler, J. International support for feed-in tariffs in developing countries—A review and analysis of proposed mechanisms. Renew. Sustain. Energy Rev. 2014, 39, 857–873. [Google Scholar] [CrossRef]
- Woodman, B.; Mitchell, C. Learning from experience? The development of the Renewables Obligation in England and Wales 2002–2010. Energy Policy 2011, 39, 3914–3921. [Google Scholar] [CrossRef]
- Marijke, W.; Poudineh, R. Auctions for allocation of offshore wind contracts for difference in the UK. Renew. Energy 2020, 147, 1266–1274. [Google Scholar]
- Jaganmohan, M. Onshore and Offshore Wind Power Capacity in the United Kingdom from 2010 to 2019. 2021. Available online: https://www.statista.com/statistics/240205/uk-onshore-and-offshore-wind-power-capacity/ (accessed on 16 January 2021).
- Hill, J.S. Renewables Provide Almost Half of UK Electricity in First Three Months of 2020. 2020. Available online: https://reneweconomy.com.au/renewables-provide-almost-half-of-uk-electricity-in-first-three-months-of-2020/ (accessed on 15 January 2021).
- Energy World. Scotland’s Energy Strategy Extends Renewables to Heat and Transportation; Energy Institute: London, UK, 2018; p. 10. [Google Scholar]
- Scottish Government. Renewable Electricity Generation. 2021. Available online: https://scotland.shinyapps.io/sg-scottish-energy-statistics/?Section=RenLowCarbon&Subsection=RenElec&Chart=RenElecGen (accessed on 18 January 2021).
- Harrison, J. Scottish Renewable Energy: Almost All of Scotland’s Electricity Generated by Clean Sources. 2020. Available online: https://www.heraldscotland.com/news/18955259.scottish-renewable-energy-almost-scotlands-electricity-generated-clean-sources/ (accessed on 17 January 2021).
- Scottish Renewables. Statistics. 2021. Available online: https://www.scottishrenewables.com/our-industry/statistics (accessed on 14 January 2021).
- Balci, K. Utilizing Curtailed Wind Energy by the Deployment of Large-Scale Storage Systems. Master’s Thesis, University of Strathclyde, Glasgow, UK, August 2016. [Google Scholar]
- Lori, B.; Lew, D.; Milligan, M.; Carlini, E.M.; Estanqueiro, A.; Flynn, D.; Gomez-Lazaro, E.; Hannele, H.; Nickie, M.; Antje, O.; et al. Wind and solar energy curtailment: A review of international experience. Renew. Sustain. Energy Rev. 2016, 65, 577–586. [Google Scholar]
- OFGEM. Impact Assessment on the License Condition to Prohibit Potential Abuse of Transmission Constraints by Generators in the Balancing Mechanism. 2017. Available online: https://www.ofgem.gov.uk/ofgem-publications/110681 (accessed on 24 July 2018).
- Golden, R.; Paulos, B. Curtailment of Renewable Energy in California and Beyond. 2015. Available online: https://pdfs.semanticscholar.org/0af3/9008296cbc2f0e21700f4b6d66f65cfd5ee5.pdf (accessed on 26 July 2018).
- Frederik, G.; Brijs, T.; Kathan, J.; Driesen, J.; Belmans, R. An overview of large-scale stationary electricity storage plants in Europe: Current status and new developments. Renew. Sustain. Energy Rev. 2015, 52, 1212–1227. [Google Scholar]
- Luo, X.; Wang, J.; Dooner, M.; Clarke, J. Overview of current development in electrical energy storage technologies and the application potential in power system operation. Appl. Energy 2015, 137, 511–536. [Google Scholar] [CrossRef]
- Francisco, D.í.; Sumper, A.; Gomis-Bellmunt, O.; Villafáfila-Robles, R. A review of energy storage technologies for wind power applications. Renew. Sustain. Energy Rev. 2012, 16, 2154–2171. [Google Scholar] [CrossRef]
- Behnam, Z.; Syri, S. Electrical energy storage systems: A comparative life cycle cost analysis. Renew. Sustain. Energy Rev. 2015, 42, 569–596. [Google Scholar]
- Kaldellis, J.K.; Zafirakis, D.; Kavadias, K. Techno-economic comparison of energy storage systems for island autonomous electrical networks. Renew. Sustain. Energy Rev. 2009, 1, 378–392. [Google Scholar] [CrossRef]
- George, C.; Christakopoulos, T.; Karellas, S.; Gao, Z. Analysis of energy storage systems to exploit wind energy curtailment in Crete. Renew. Sustain. Energy Rev. 2019, 103, 122–139. [Google Scholar]
- Siddique, M.B.; Thakur, J. Assessment of curtailed wind energy potential for off-grid applications through mobile battery storage. Energy 2020, 201, 117601. [Google Scholar] [CrossRef]
- Paul, D.; Hand, M. Grid flexibility and storage required to achieve very high penetration of variable renewable electricity. Energy Policy 2011, 39, 1817–1830. [Google Scholar]
- Solomon, A.A.; Daniel, M.K.; Callaway, D. The role of large-scale energy storage design and dispatch in the power grid: A study of very high grid penetration of variable renewable resources. Appl. Energy 2014, 134, 75–89. [Google Scholar] [CrossRef]
- McPhee, D. Exclusive: Scottish Onshore Wind Farms Costing Millions in Constraint Payments. 2017. Available online: https://www.energyvoice.com/otherenergy/151233/exclusive-scottish-onshore-wind-farms-costing-millions-constraint-payments/?cv=1 (accessed on 22 August 2018).
- Macaskill. Turbines Spread Amid £127m Bill. 2019. Available online: https://www.thetimes.co.uk/article/turbines-spread-amid-127m-bill-b3v50pxgf (accessed on 19 January 2021).
- Michael, J.; Staffell, I. Short-term integration costs of variable renewable energy: Wind curtailment and balancing in Britain and Germany. Renew. Sustain. Energy Rev. 2018, 86, 45–65. [Google Scholar]
- REF. A Decade of Constraint Payments. Available online: https://www.ref.org.uk/ref-blog/354-a-decade-of-constraint-payments (accessed on 19 January 2021).
- DUKES. Where Are Onshore Wind Farms Located in the UK and Where Are the Proposed Future Sites? 2016. Available online: http://www.lse.ac.uk/GranthamInstitute/faqs/where-are-onshore-wind-farms-located-in-the-uk-and-where-are-the-proposed-future-sites/ (accessed on 28 July 2018).
- UK Government. Sub-National Electricity and Gas Consumption Statistics. 2018. Available online: https://assets.publishing.service.gov.uk/government/uploads/system/uploads/attachment_data/file/678653/Sub-national_electricity_and_gas_consumption_summary_report_2016.pdf (accessed on 25 July 2018).
- Mendick, R. Wind Farms Paid £100m to Switch Power Off. The Telegraph. 2018. Available online: https://www.telegraph.co.uk/news/2018/01/08/wind-farms-paid-100m-switch-power/ (accessed on 15 August 2018).
- Safak, B.I.; Devetsikiotis, M. Analytical models for emerging energy storage applications. In Advanced Data Analytics for Power Systems; Cambridge University Press: Cambridge, UK, 2021; p. 455. [Google Scholar]
- Windeurope. Win Energy and On-Site Energy Storage, Exploring Market Opportunities. November 2017. Available online: https://windeurope.org/wp-content/uploads/files/policy/position-papers/WindEurope-Wind-energy-and-on-site-energy-storage.pdf (accessed on 19 January 2021).
- ScottishPower. Super Battery Plan to Boost UK’s Biggest Onshore Windfarm. 2019. Available online: https://www.scottishpower.com/news/pages/super_battery_plan_to_boost_uks_biggest_onshore_windfarm.aspx (accessed on 17 January 2021).
- Grundy, A. Ingeteam to Supply 50MWh Battery Storage System at 539MW Wind Farm in Scotland. 2020. Available online: https://www.energy-storage.news/news/ingeteam-to-supply-50mwh-battery-storage-system-at-539mw-wind-farm-in-scotl (accessed on 28 January 2021).
- Amiryar Mustafa, E.; Pullen, K.R. A review of flywheel energy storage system technologies and their applications. Appl. Sci. 2017, 7, 286. [Google Scholar] [CrossRef]
- David, I.I.; Hill, J. Literature Review: Electrical Energy Storage for Scotland; ClimateXChange: Glasgow, UK, 2015. [Google Scholar]
- Canbulat, S. Wind Energy Curtailment in Scotland and Case Study Applications of Utilisation of Storage Systems by Applying Cost-Benefit Base Analysis. Master’s Thesis, University of Strathclyde, Glasgow, UK, 2018. [Google Scholar]
- David, I.; Freris, L. Renewable Energy in Power Systems; John Wiley & Sons: West Sussex, UK, 2020. [Google Scholar]
- Gogus, Y. (Ed.) Energy Storage Systems; EOLSS Publications: Paris, France, 2009; Volume I. [Google Scholar]
- Michael, M.; Mursch, D.; Tilford, K. Challenges and Opportunities for New Pumped Storage Development; A White Paper Developed by NHA’s Pumped Storage Development Council; NHA—Pumped Storage Development Council: Washington, DC, USA, 2012. [Google Scholar]
- Energy Storage Sense. Pumped Hydroelectric Storage (PHS). 2011. Available online: energystoragesense.com/pumped-hydroelectric-storage-phs/ (accessed on 3 August 2018).
- Froese, M. An Overview of 6 Energy Storage Methods. 2018. Available online: https://www.windpowerengineering.com/business-news-projects/uncategorized/an-overview-of-6-energy-storage-methods/ (accessed on 2 August 2018).
- Taylor, P.; Bolton, R.; Stone, D.; Zhang, X.; Martin, C.; Upham, P. Pathways for Energy Storage in the UK, Centre for Low Carbon Futures. 2012. Available online: https://www.birmingham.ac.uk/Documents/college-eps/energy/research/CLCF-Pathwaysforenergystorage,2012.pdf (accessed on 3 August 2018).
- Akinyele, D.O.; Rayudu, R.K. Review of energy storage technologies for sustainable power networks. Sustain. Energy Technol. Assess. 2014, 8, 74–91. [Google Scholar] [CrossRef]
- Stroud, N. Mechanical Energy Storage. 2014. Available online: https://www.slideshare.net/alaamohammed9026/mechanical-energy-storage (accessed on 1 August 2018).
- Martin, R.; Murach, L. Advanced Batteries for Utility-Scale Energy Storage Applications Will Surpass $2.5 Billion in Annual Revenue by 2023. Business Wire. Forecasts Navigant Research. 2014. Available online: https://www.businesswire.com/news/home/20140218005579/en/Advanced-Batteries-Utility-Scale-Energy-Storage-Applications-Surpass (accessed on 5 August 2018).
- Badwal Sukhvinder, P.S.; Giddey, S.S.; Munnings, C.; Bhatt, A.I.; Hollenkamp, A.F. Emerging electrochemical energy conversion and storage technologies. Front. Chem. 2014, 2, 79. [Google Scholar]
- Zafirakis, D.P. Overview of energy storage technologies for renewable energy systems. In Stand-Alone and Hybrid Wind Energy Systems; Woodhead Publishing: Cambridge, UK, 2010; pp. 29–80. [Google Scholar]
- Battery University. How Does the Flow Battery Work? Available online: https://batteryuniversity.com/index.php/learn/article/bu_210b_flow_battery (accessed on 6 August 2018).
- Barbour, A. Electrochemical Batteries. Energy Storage Sense. 2014. Available online: http://energystoragesense.com/electrochemical-batteries/ (accessed on 2 August 2018).
- IRENA. Electricity Storage and Renewables: Costs and Markets to 2030. 2017. Available online: http://www.irena.org/-/media/Files/IRENA/Agency/Publication/2017/Oct/IRENA_Electricity_Storage_Costs_2017.pdf (accessed on 2 August 2018).
- Grand View Research. Lithium-Ion Battery Market Worth $93.1 Billion by 2025|CAGR: 17.0%. 2017. Available online: https://www.grandviewresearch.com/press-release/global-lithium-ion-battery-market (accessed on 22 August 2018).
- Diouf, B.; Pode, R. Potential of lithium-ion batteries in renewable energy. Renew. Energy 2015, 76, 375–380. [Google Scholar] [CrossRef]
- John, Z.Z.; Ramadass, P. Lithium-ion battery systems and technology. In Batteries for Sustainability; Springer: New York, NY, USA, 2013; pp. 319–357. [Google Scholar]
- Sevket, G.M.; Tepe, Y. Classification and assessment of energy storage systems. Renew. Sustain. Energy Rev. 2017, 75, 1187–1197. [Google Scholar]
- Ingo, S.; Sterner, M. Urban energy storage and sector coupling. In Urban Energy Transition; Elsevier: Edinburgh, UK, 2018; pp. 225–244. [Google Scholar]
- Denis, S.; Muftahov, I.; Tomin, N.; Karamov, D.; Panasetsky, D.; Dreglea, A.; Liu, F.; Foley, A. A dynamic analysis of energy storage with renewable and diesel generation using Volterra equations. IEEE Trans. Ind. Inform. 2019, 16, 3451–3459. [Google Scholar]
- Michael, S.; Naumann, M.; Truong, N.; Hesse, H.C.; Santhanagopalan, S.; Saxon, A.; Jossen, A. Energy efficiency evaluation of a stationary lithium-ion battery container storage system via electro-thermal modeling and detailed component analysis. Appl. Energy 2018, 210, 211–229. [Google Scholar]
- BloombergNEF. Battery Pack Prices Cited below $100/kWh for the First Time in 2020, While Market Average Sits at $137/kWh. 2020. Available online: https://about.bnef.com/blog/battery-pack-prices-cited-below-100-kwh-for-the-first-time-in-2020-while-market-average-sits-at-137-kwh/ (accessed on 21 December 2020).
- Wholesale Electricity Price Guide. Available online: https://www.businesselectricityprices.org.uk/retail-versus-wholesale-prices/ (accessed on 2 August 2018).
- Whitlee Windfarm. Available online: https://www.whiteleewindfarm.co.uk/ (accessed on 1 March 2021).
- Gordonbush Windfarm. Available online: https://www.sserenewables.com/onshore-wind/great-britain/gordonbush/ (accessed on 1 March 2021).
- Sibyl, N.; Kuriakose, A.T. Gender and Renewable Energy: Entry Points for Women’s Livelihoods and Employment; Climate Investment Funds: Washington, DC, USA, 2017. [Google Scholar]
- Johnson, O.W.; Han, J.Y.C.; Knight, A.L.; Mortensen, S.; Aung, M.T.; Boyland, M.; Resurrección, B.P. Intersectionality and energy transitions: A review of gender, social equity and low-carbon energy. Energy Res. Soc. Sci. 2020, 70, 101774. [Google Scholar] [CrossRef]


| Wind Farm | Generation (MWh) | Curtailment (MWh) | Curtailment Percentage |
|---|---|---|---|
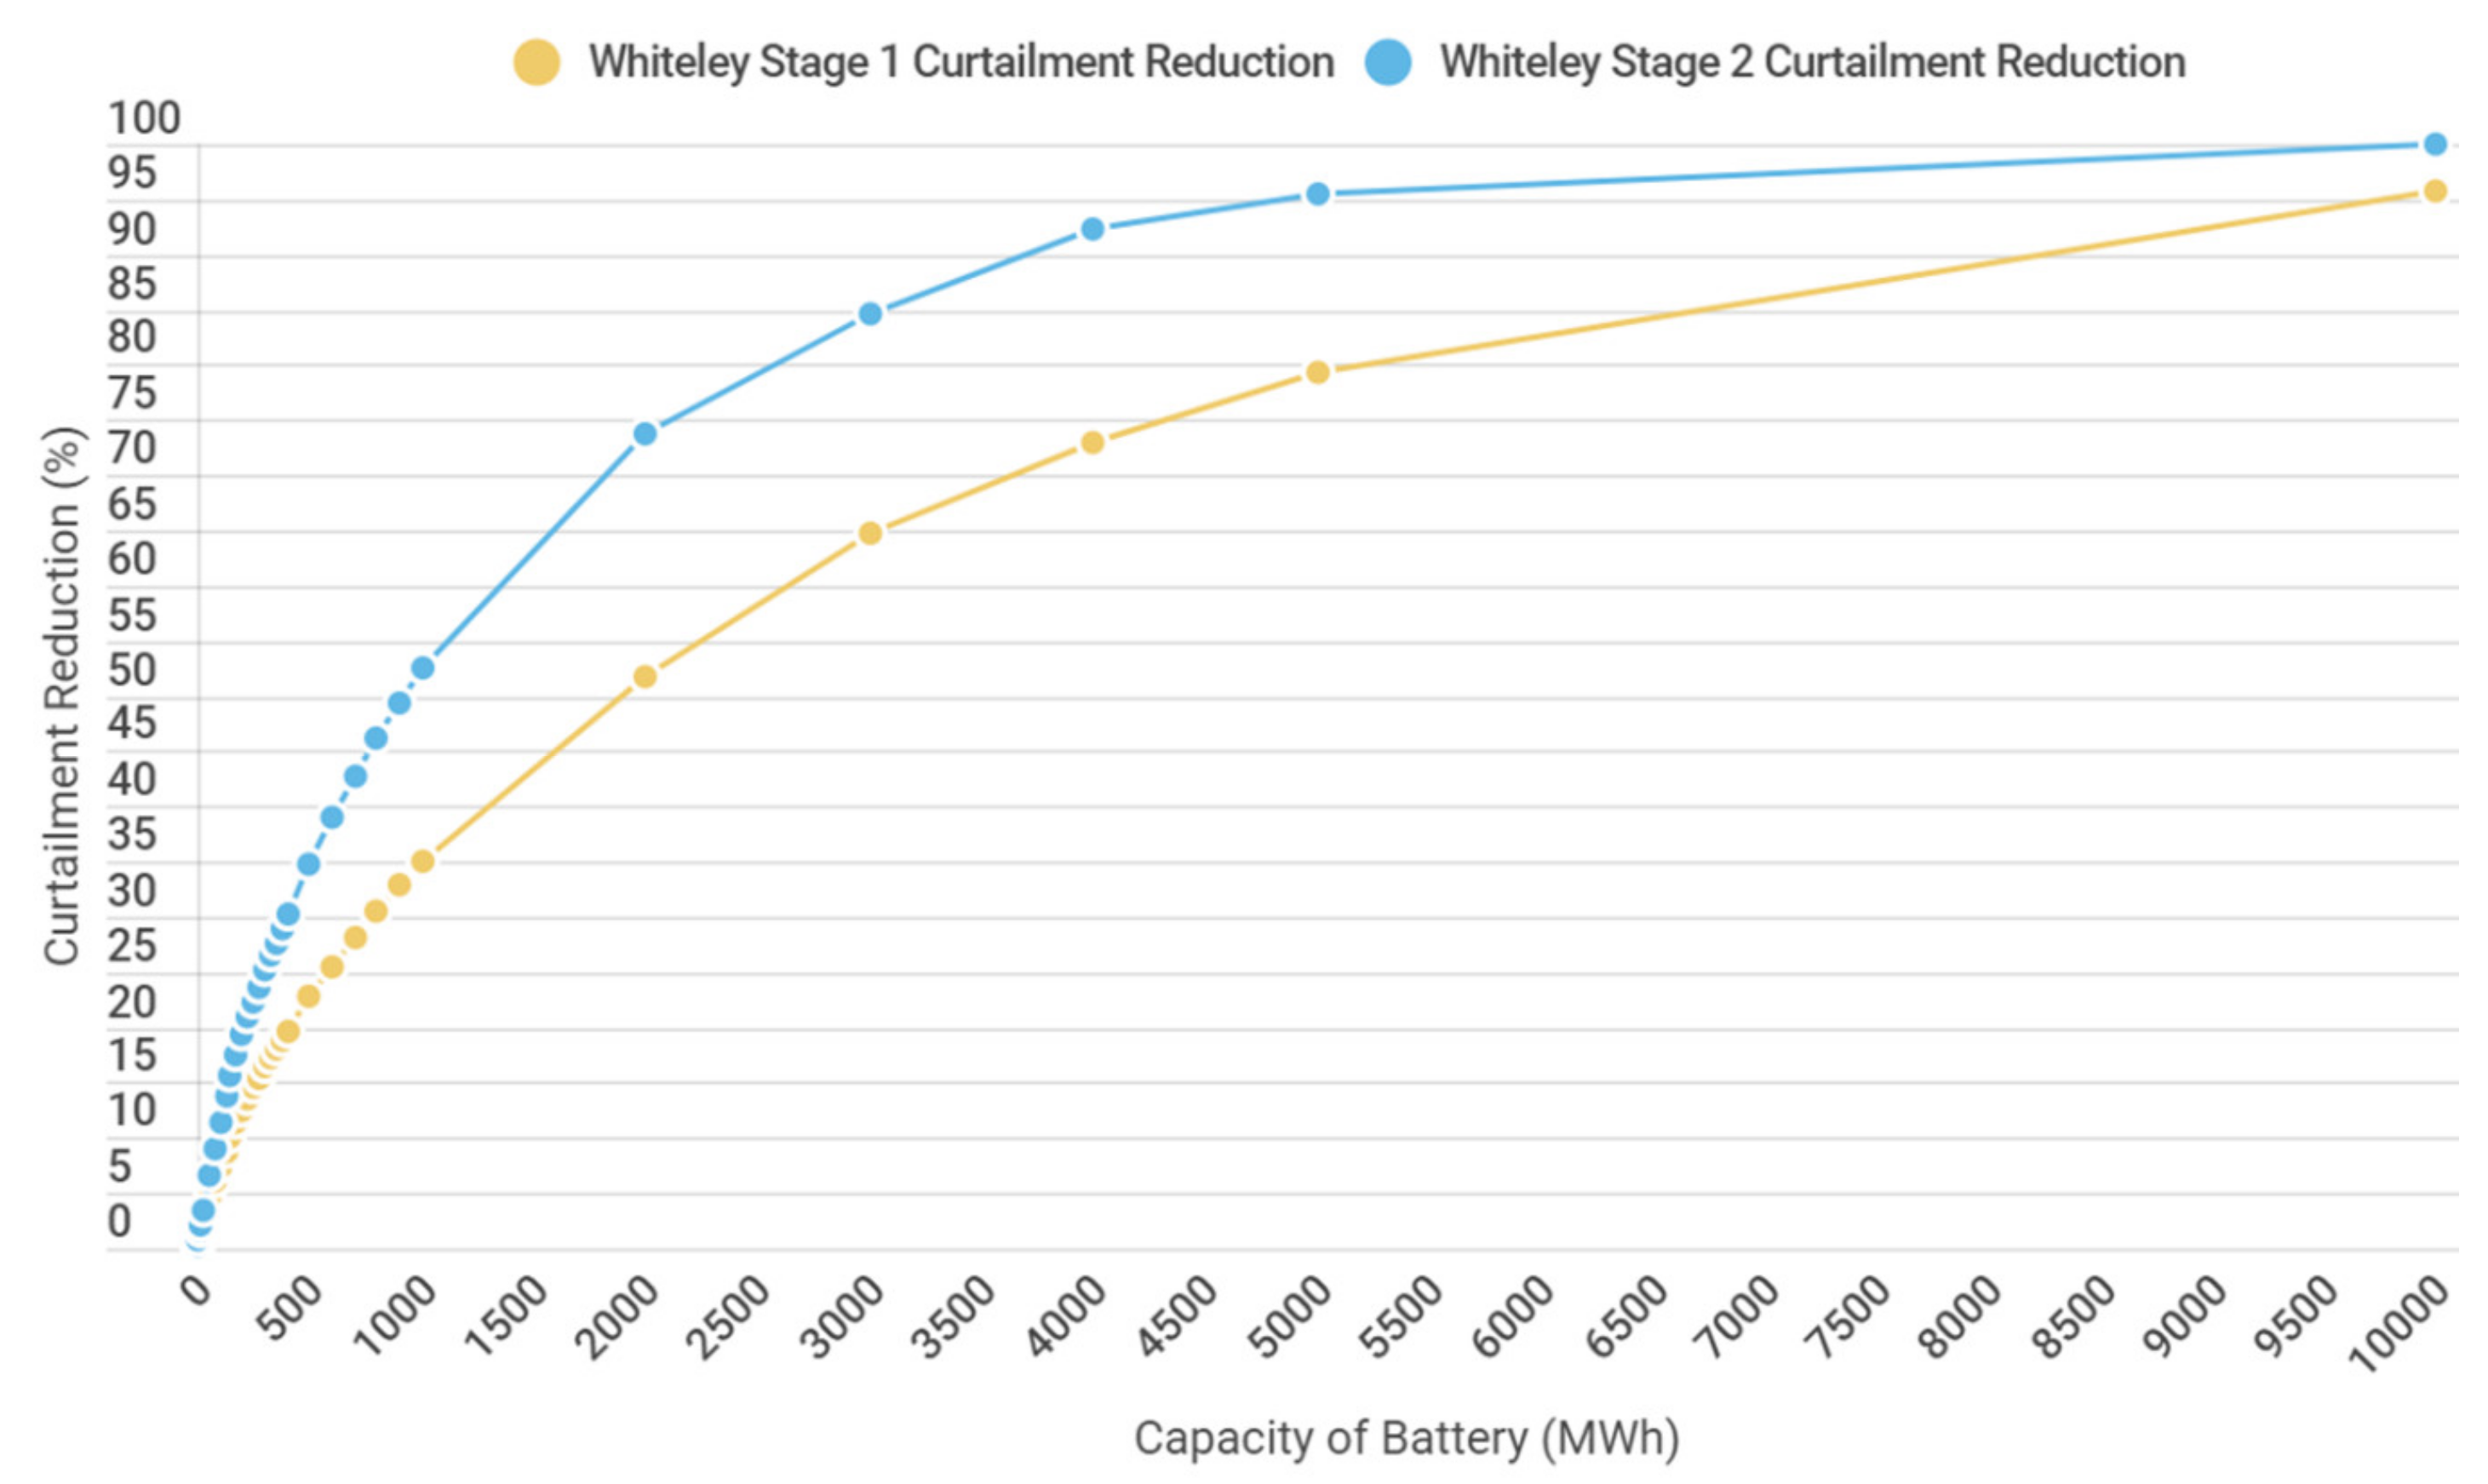
| Whiteley Stage 1 | 725,072 | 170,842 | 23.60% |
| Whiteley Stage 2 | 453,093 | 80,952 | 17.90% |
| Whiteley Stage 1&2 | 1,178,165 | 251,795 | 21.40% |
| Gordonbush | 274,299 | 46,467 | 16.90% |
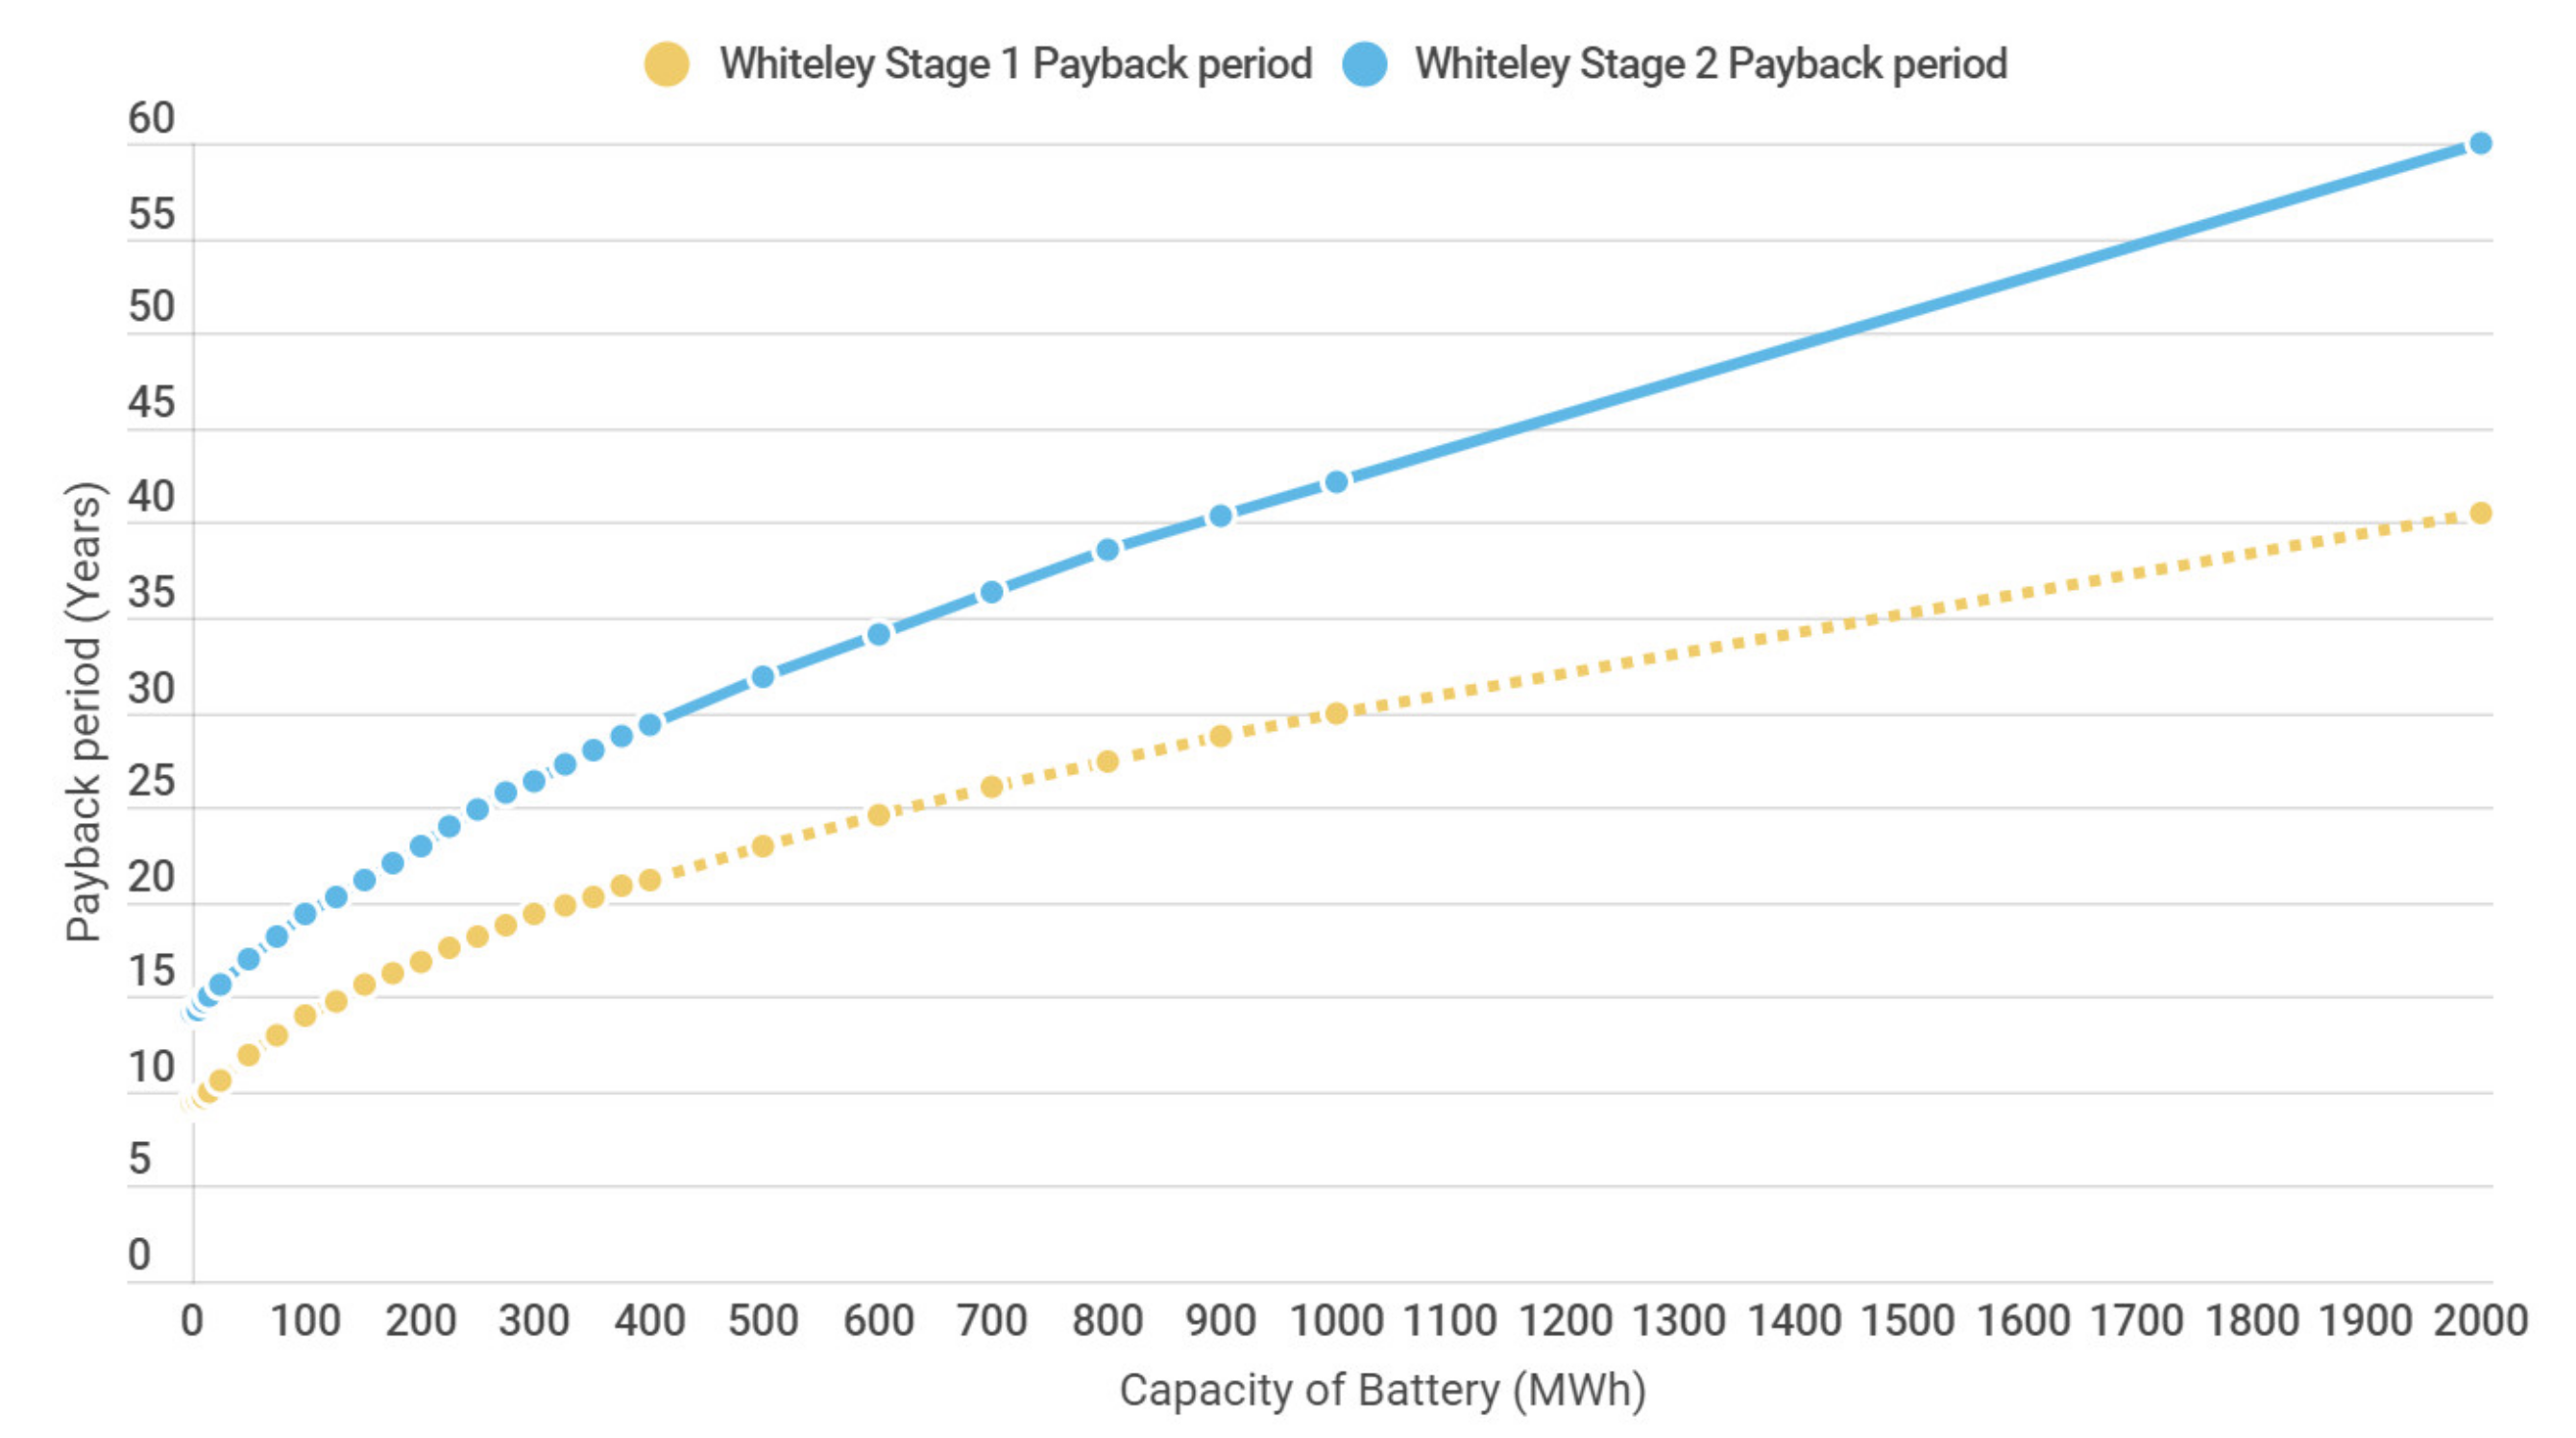
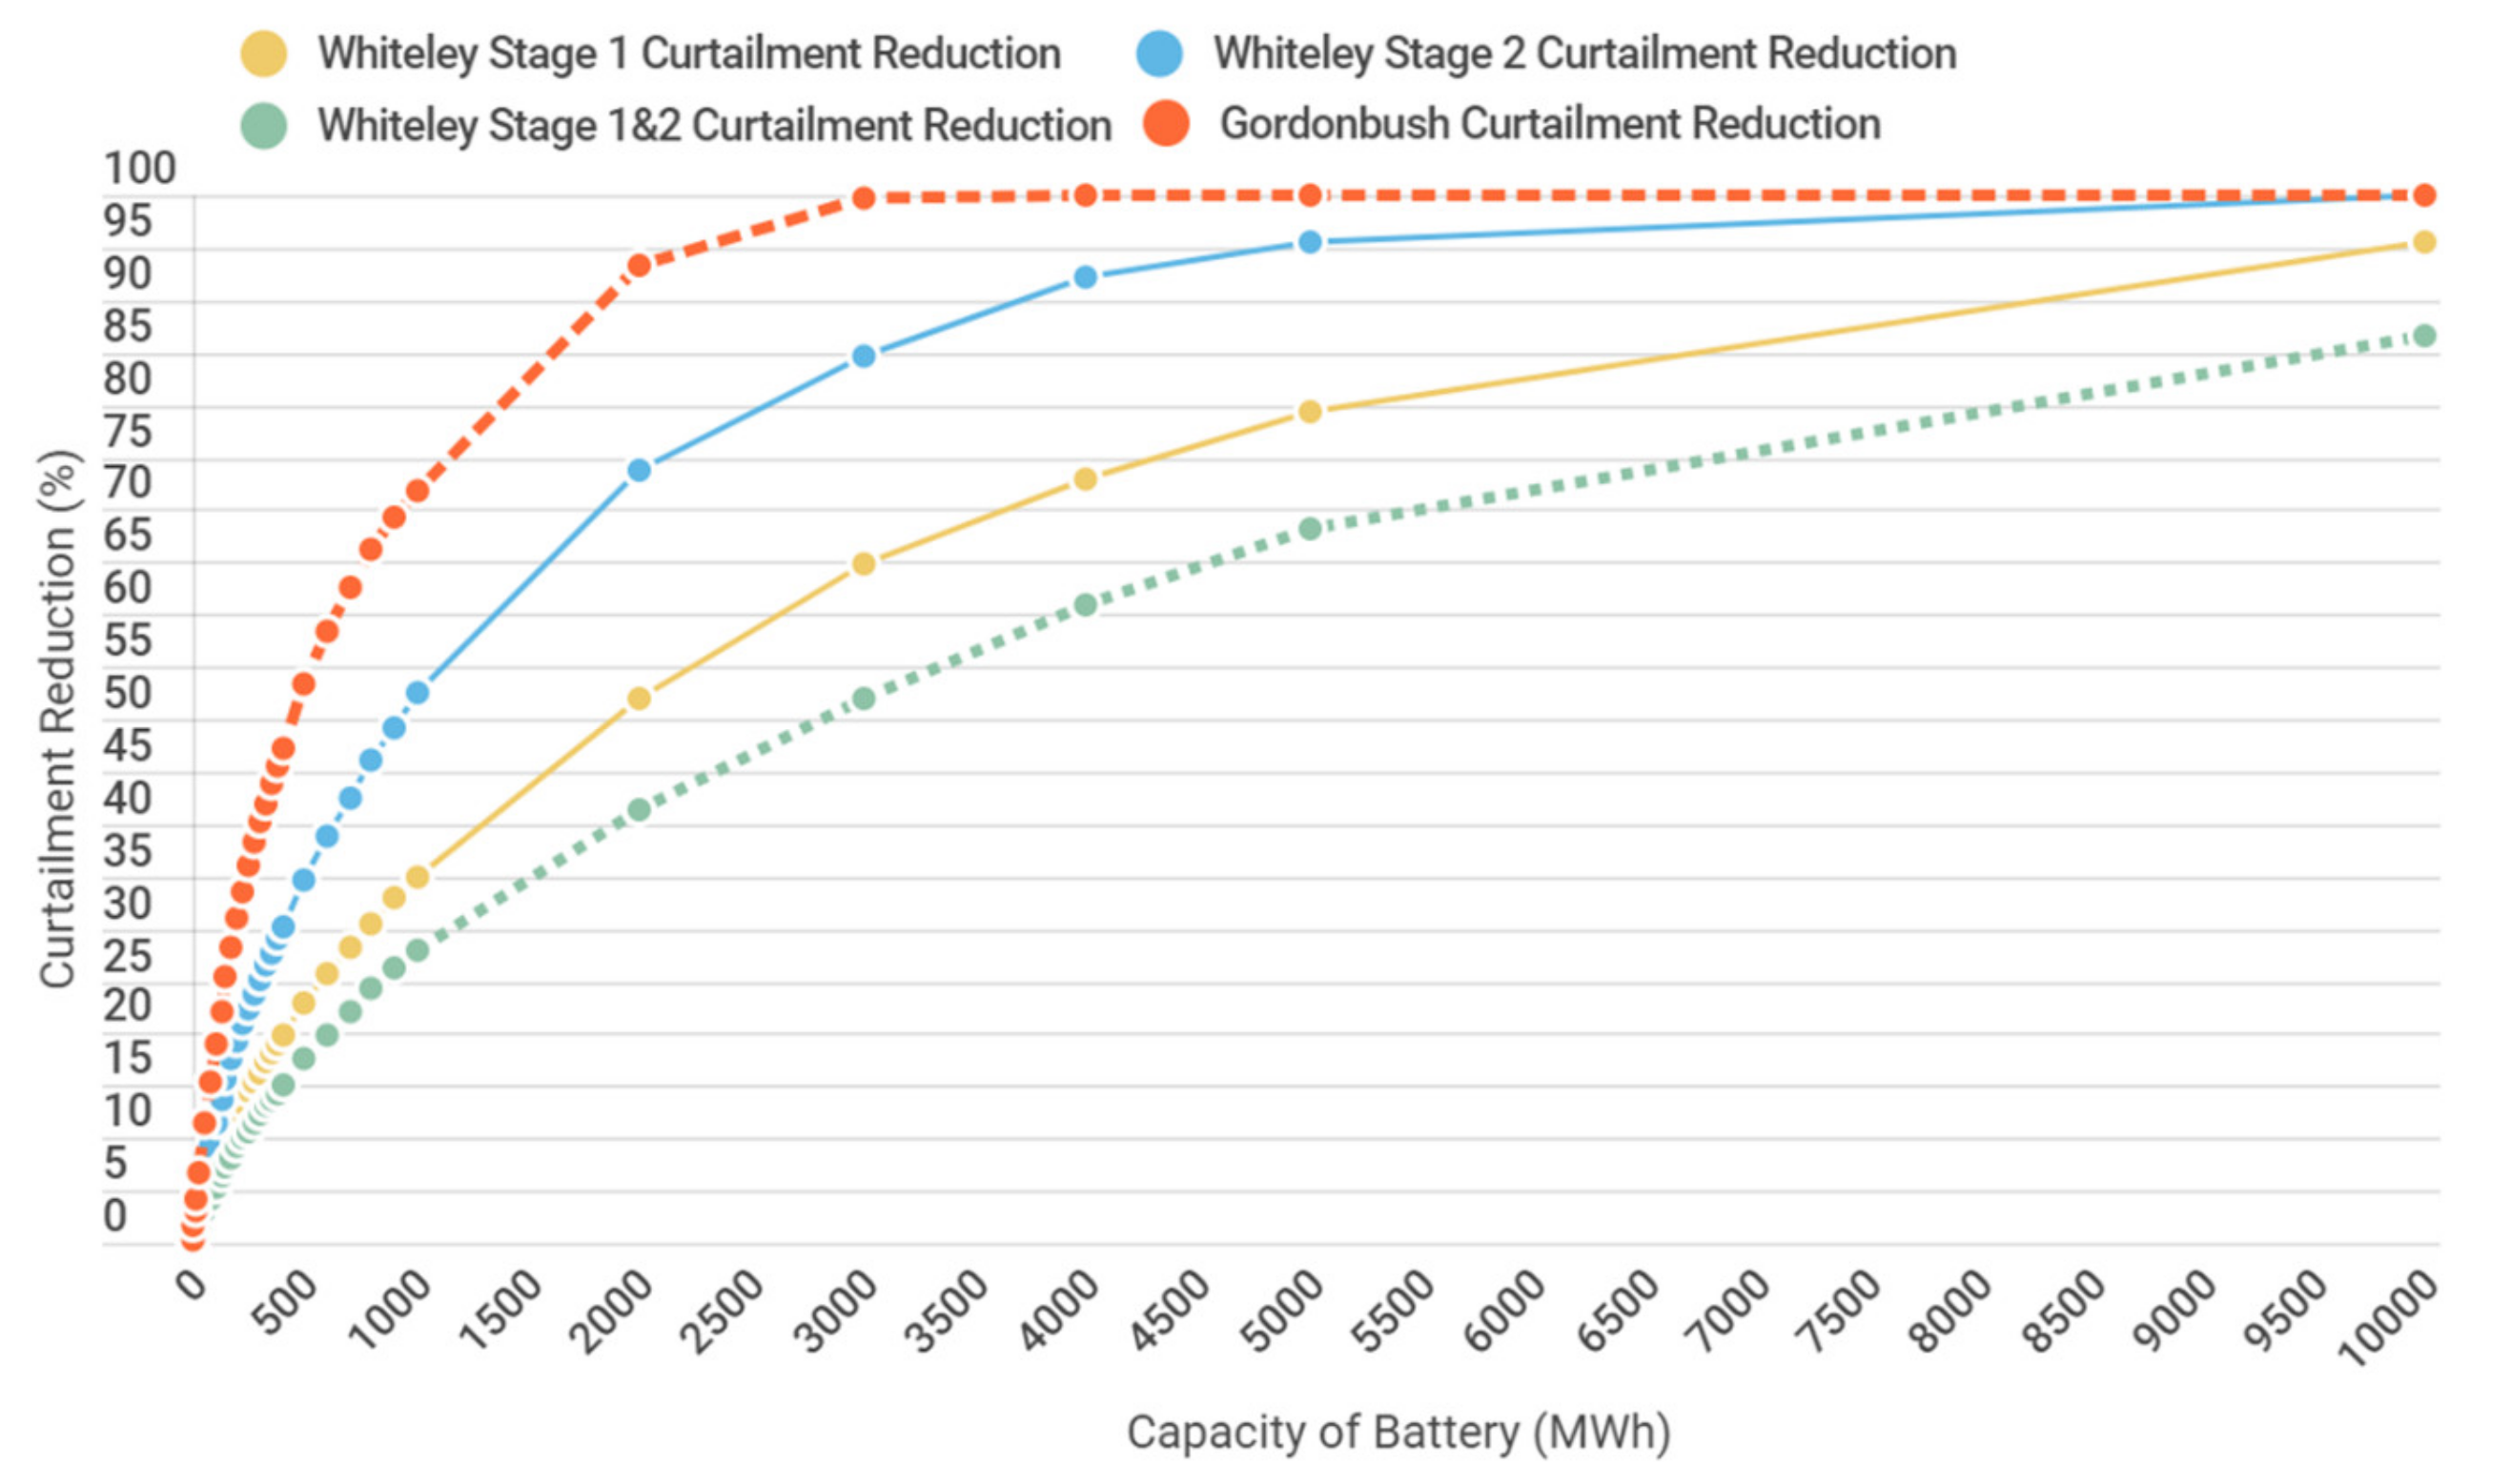
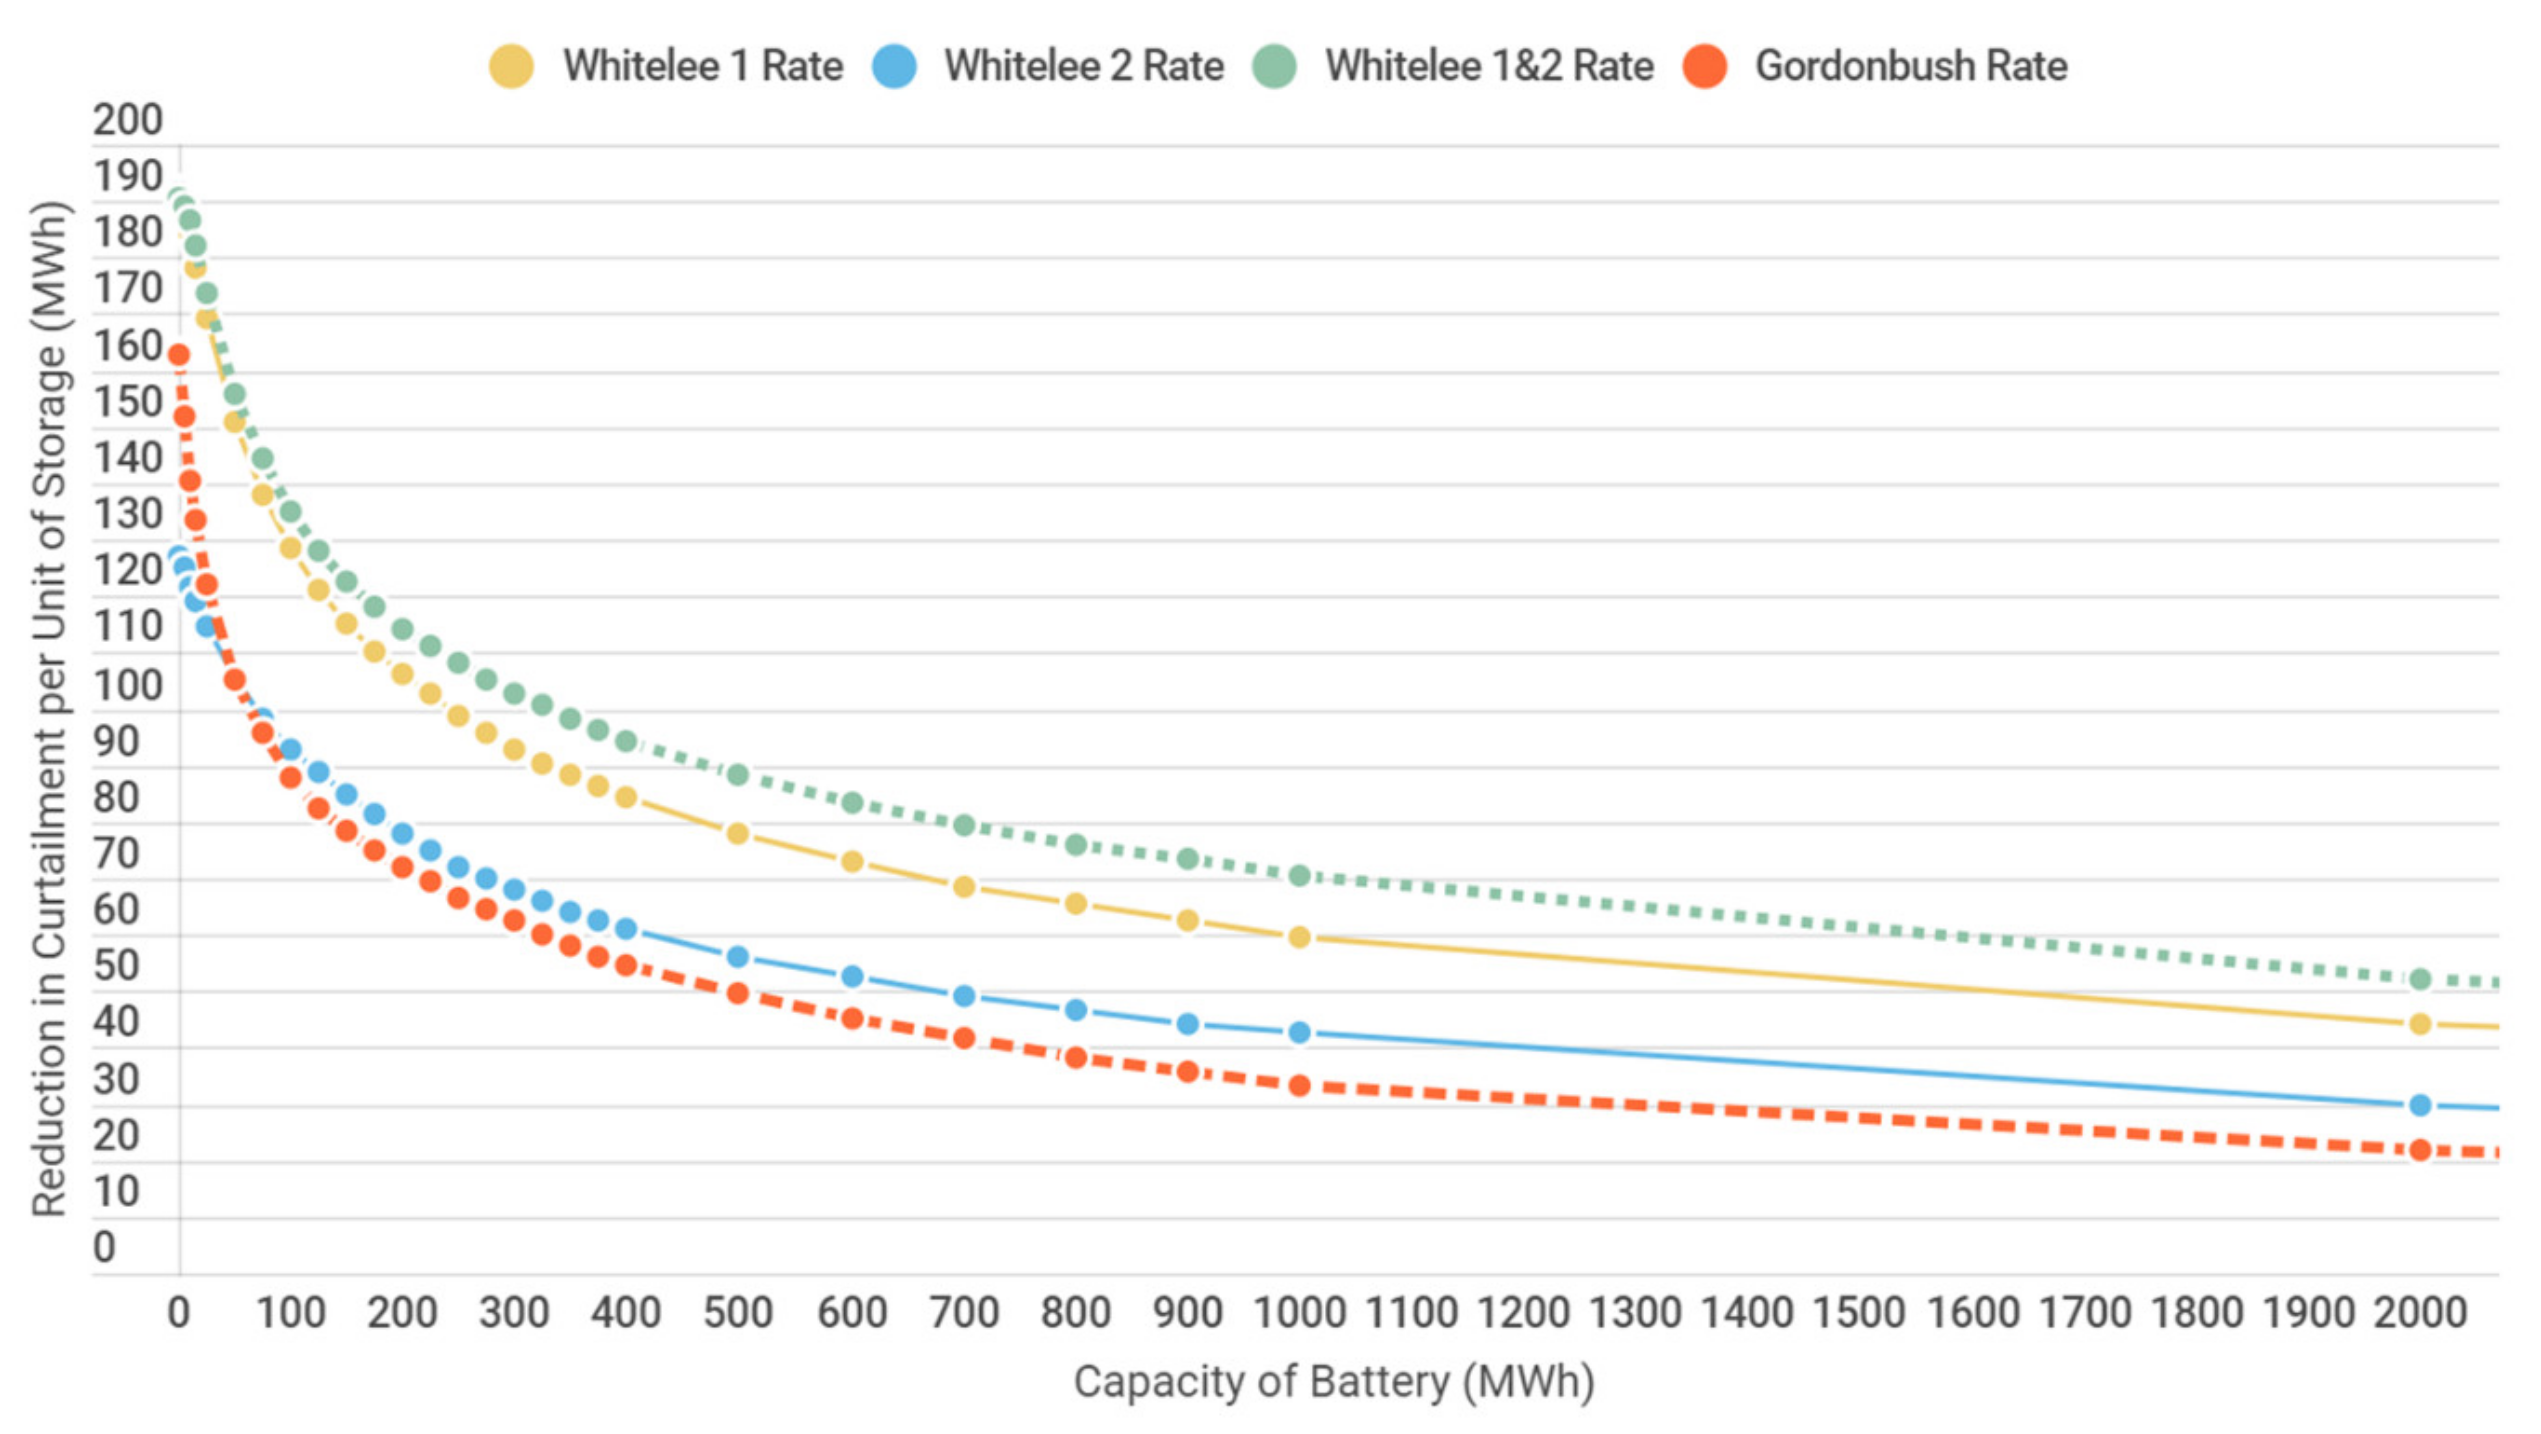
| Capacit of Battery (MWh) | Whiteley Stage 1 Payback Period | Whiteley Stage 1 Curtailment Reduction | Whiteley Stage 2 Payback Period | Whiteley Stage 2 Curtailment | Whiteley Stage 1&2 Payback | Whiteley Stage 1&2 Curtailment | Gordonbush Payback Period | Gordonbush Curtailment Reduction |
|---|---|---|---|---|---|---|---|---|
| 1 | 9.4 | 0.112 | 14 | 0.157 | 9.4 | 0.076 | 11 | 0.35 |
| 5 | 9.5 | 0.553 | 14 | 0.773 | 9.5 | 0.376 | 12 | 1.634 |
| 25 | 11 | 2.472 | 16 | 3.537 | 10 | 1.726 | 15 | 6.582 |
| 50 | 12 | 4.412 | 17 | 6.522 | 12 | 3.098 | 17 | 11.32 |
| 75 | 13 | 6.061 | 18 | 9.106 | 12 | 4.294 | 19 | 15.44 |
| 100 | 14 | 7.511 | 19 | 11.49 | 13 | 5.353 | 20 | 18.93 |
| 125 | 15 | 8.849 | 20 | 13.71 | 14 | 6.346 | 22 | 22.19 |
| 150 | 16 | 10.11 | 21 | 15.71 | 15 | 7.291 | 23 | 25.31 |
| 175 | 16 | 11.31 | 22 | 17.55 | 15 | 8.197 | 24 | 28.28 |
| 200 | 17 | 12.45 | 23 | 19.31 | 16 | 9.079 | 25 | 31.07 |
| 225 | 18 | 13.51 | 24 | 20.84 | 16 | 9.932 | 26 | 33.57 |
| 250 | 18 | 14.49 | 25 | 22.29 | 17 | 10.74 | 27 | 35.9 |
| 275 | 19 | 15.42 | 26 | 23.71 | 17 | 11.5 | 28 | 38.15 |
| 300 | 19 | 16.32 | 26 | 25.11 | 17 | 12.26 | 29 | 40.19 |
| 325 | 20 | 17.21 | 27 | 26.43 | 18 | 13.01 | 30 | 42.03 |
| 350 | 20 | 18.07 | 28 | 27.7 | 18 | 13.7 | 31 | 43.76 |
| 375 | 21 | 18.92 | 29 | 28.93 | 19 | 14.36 | 32 | 45.47 |
| 400 | 21 | 19.74 | 29 | 30.17 | 19 | 15.02 | 33 | 47.15 |
| 500 | 23 | 22.82 | 32 | 34.71 | 20 | 17.52 | 36 | 53.34 |
| 600 | 25 | 25.56 | 34 | 38.96 | 22 | 19.88 | 40 | 58.29 |
Publisher’s Note: MDPI stays neutral with regard to jurisdictional claims in published maps and institutional affiliations. |
© 2021 by the authors. Licensee MDPI, Basel, Switzerland. This article is an open access article distributed under the terms and conditions of the Creative Commons Attribution (CC BY) license (http://creativecommons.org/licenses/by/4.0/).
Share and Cite
Canbulat, S.; Balci, K.; Canbulat, O.; Bayram, I.S. Techno-Economic Analysis of On-Site Energy Storage Units to Mitigate Wind Energy Curtailment: A Case Study in Scotland. Energies 2021, 14, 1691. https://doi.org/10.3390/en14061691
Canbulat S, Balci K, Canbulat O, Bayram IS. Techno-Economic Analysis of On-Site Energy Storage Units to Mitigate Wind Energy Curtailment: A Case Study in Scotland. Energies. 2021; 14(6):1691. https://doi.org/10.3390/en14061691
Chicago/Turabian StyleCanbulat, Seda, Kutlu Balci, Onder Canbulat, and I. Safak Bayram. 2021. "Techno-Economic Analysis of On-Site Energy Storage Units to Mitigate Wind Energy Curtailment: A Case Study in Scotland" Energies 14, no. 6: 1691. https://doi.org/10.3390/en14061691
APA StyleCanbulat, S., Balci, K., Canbulat, O., & Bayram, I. S. (2021). Techno-Economic Analysis of On-Site Energy Storage Units to Mitigate Wind Energy Curtailment: A Case Study in Scotland. Energies, 14(6), 1691. https://doi.org/10.3390/en14061691