Article

Performance of Hydraulically Fractured Wells in Xinjiang Oilfield: Experimental and Simulation Investigations on Laumontite-Rich Tight Glutenite Formation

1
State Key Laboratory of Petroleum Resources and Prospecting, China University of Petroleum, Beijing 102249, China
2
College of Petroleum Engineering, China University of Petroleum, Beijing 102249, China
3
Xinjiang Oilfield Corporation, Karamay 834000, China
*
Author to whom correspondence should be addressed.
Energies 2021, 14(6), 1667; https://doi.org/10.3390/en14061667
Submission received: 31 January 2021 / Revised: 9 March 2021 / Accepted: 13 March 2021 / Published: 17 March 2021
(This article belongs to the Section H: Geo-Energy)

Abstract

:
PetroChina’s Xinjiang oilfield has a large quantity of tight oil reserves and hydraulic fracturing technology has been widely used to achieve commercial production. Some parts of this tight glutenite formation are laumontite-rich and the actual productivity of the hydraulically fractured wells is less than expected. To figure out the ways that laumontite affects tight glutenite well productivity, comprehensive experimental and numerical simulation studies have been conducted to investigate the rock mechanical properties, fluid flow behaviors and the major controlling factor of productivity. Laboratory results indicate that the tight glutenite formation with higher laumontite content has higher initial porosity, permeability but lower yield strength and more severe stress sensitivity in both permeability and fracture conductivity. For laumontite-rich glutenite rocks, there are commonly three types of rock deformation during the loading process: elastic compression, shear dilation and shear enhanced compaction. Both elastic compression and shear enhanced compaction will cause the reduction on rock porosity and permeability. A fully coupled finite element model (FEM) considering stress-induced permeability evolution was introduced to simulate the production process. Permeability evolution models of three different deformation stages were presented, respectively. Simulation results showed that our model is in good agreements with the well testing data. The simulated oil production characteristics for permeability evolution coupled and uncoupled models were discussed. Results showed the strong stress-induced permeability reduction is the major factor that laumontite causing the low and quickly declining oil rates. Initial permeability has a positive effect on productivity and stress-induced fracture conductivity reduction has slight influence on productivity. The results of this paper indicate that the stress-induced permeability evolution in the oil production process must be considered to accurately evaluating reservoirs in the studied area.

1. Introduction

With the depletion of conventional oil resources, the exploitation of unconventional resources (including shale gas, heavy oil, tight oil and so on) has been more and more important for both China and the world [1,2,3,4]. Geological exploration shows that PetroChina’s Xinjiang oilfield has a large quantity of tight oil reserves, which are estimated to be hundreds of millions of tons. One of the main tight oil layers comes from the glutenite reservoirs of the Permian Wuerhe deposit formation, which overlies on the central region of the Junggar basin. The burial depth of the reservoir glutenite is between 3800 m and 4600 m, with an in situ stress gradient ranging from 1.77 MPa/100 m to 2.48 MPa/100 m. The reservoir thickness ranges from 4.0 m to 18.0 m, with an average reservoir thickness of 12.8 m. The reservoir is very heterogeneous with porosity ranging from 2.1% to 12.8% and permeability ranging from 0.001 mD to 12.3 mD. The reservoir is considered to have the characteristics of low porosity and ultralow permeability. Hydraulic fracturing technology has been widely used in this area to achieve commercial production as the glutenite formation has low core permeability. Some parts of this tight glutenite formation are laumontite-rich, which means there are high contents of laumontite existing in the formation rocks as the major cement mineral. According to previous geological investigations on this block, there should be good oil reserves in the studied reservoir. However, the actual productivity of the hydraulically fractured wells on this laumontite-rich tight glutenite formation is less than expected. Some wells even show poor and rapidly declining oil productivity. Since most of these wells are located at the laumontite-rich formation, the laumontite mineral is assumed to be one of the key factors that influences the performances of these hydraulically fractured wells [5].
Laumontite (formulated Ca (AlSi2O6)2·4H2O) is a common hydrated calcium and sodium aluminosilicate mineral belonging to the zeolite family. Laumontite is widely distributed not only in sedimentary rocks but also in sandstones that are rich in volcanic lithic fragments and anorthites [6,7]. Scholars have previously conducted plenty of experimental studies on laumontite-rich rocks to explore physical and rock mechanical properties and there are two common features obtained from these studies. Firstly, laumontite dissolution is likely to occur under acidic conditions (commonly formed by organic acids or CO2 dissolved in water) and the corroded pores increase reservoir space for oil and gas [8,9,10]. In terms of this view, the laumontite mineral may directly affect the original porosity and permeability of the formation. Another notable feature of laumontite-rich rocks is that the existence of laumontite can lead to strong deformation potentials and stress sensitivity in permeability. As a kind of zeolite mineral, laumontite usually has strong sensitivity to stress and temperature [11]. Experimental investigation on laumontite-rich sandstone shows that the permeability can be reduced by 70% when applied by a confining pressure of 24 MPa [12]. Besides, rock mechanical experiments indicate that glutenite samples containing a high content of laumontite commonly have a low elastic modulus and yield strength, which reflects a strong deformation potential [5]. On one hand, strong stress sensitivity in permeability means there is a large variation of permeability under different confining pressures, which can also be called stress-dependent permeability evolution [13]. Since the permeability of tight glutenite reservoir is usually low, the decrease in permeability of this level is very harmful to oil productivity. On the other hand, hydraulic fractures in the laumontite-rich formation are more likely to deform under increasing closure stress and suffering severe fracture conductivity loss due to strong deformation potentials. Similarly, fracture conductivity loss can also result in oil productivity declining. Although previous studies on laumontite-rich rocks have revealed some possible reasons for poor and rapidly decreasing oil productivity in this area, there is still a lot of work to be done. Currently, there is a lack of basic experimental data in this area, especially data of permeability evolution under various stress states. Chen has conducted a series of experimental tests and simulation works on laumontite-rich glutenite in this area [11]. However, the study mainly focuses on how to induce shear dilation during the hydraulically fracturing process to improve productivity of laumontite-rich formations and the key factors that influence well productivity are still unknown.
In this study, aim to figuring out the ways in which laumontite affects tight glutenite well productivity. Firstly, comprehensive experimental studies have been conducted to investigate the effects of the laumontite content on the rock deformation and fluid flow behaviors during the production process. X-ray diffraction (XRD) analysis, permeability and porosity experiments were conducted on glutenite samples to investigate the target formation’s mineral composition and physical properties. Triaxial compression tests, stress-coupled permeability evolution tests and fracture proppant conductivity analysis were also performed to reveal the rock mechanical properties and fluid flow behaviors under different loading paths. Then based on these experimental results, a fully coupled finite element model considering stress-induced permeability evolution is introduced to simulate the oil production process of a tight glutenite reservoir. Finally, the effects of the initial permeability, stress-induced permeability evolution and fracture permeability on well productivity were discussed to reveal the major factors.

2. Laboratory Investigation on Laumontite-Rich Tight Glutenite

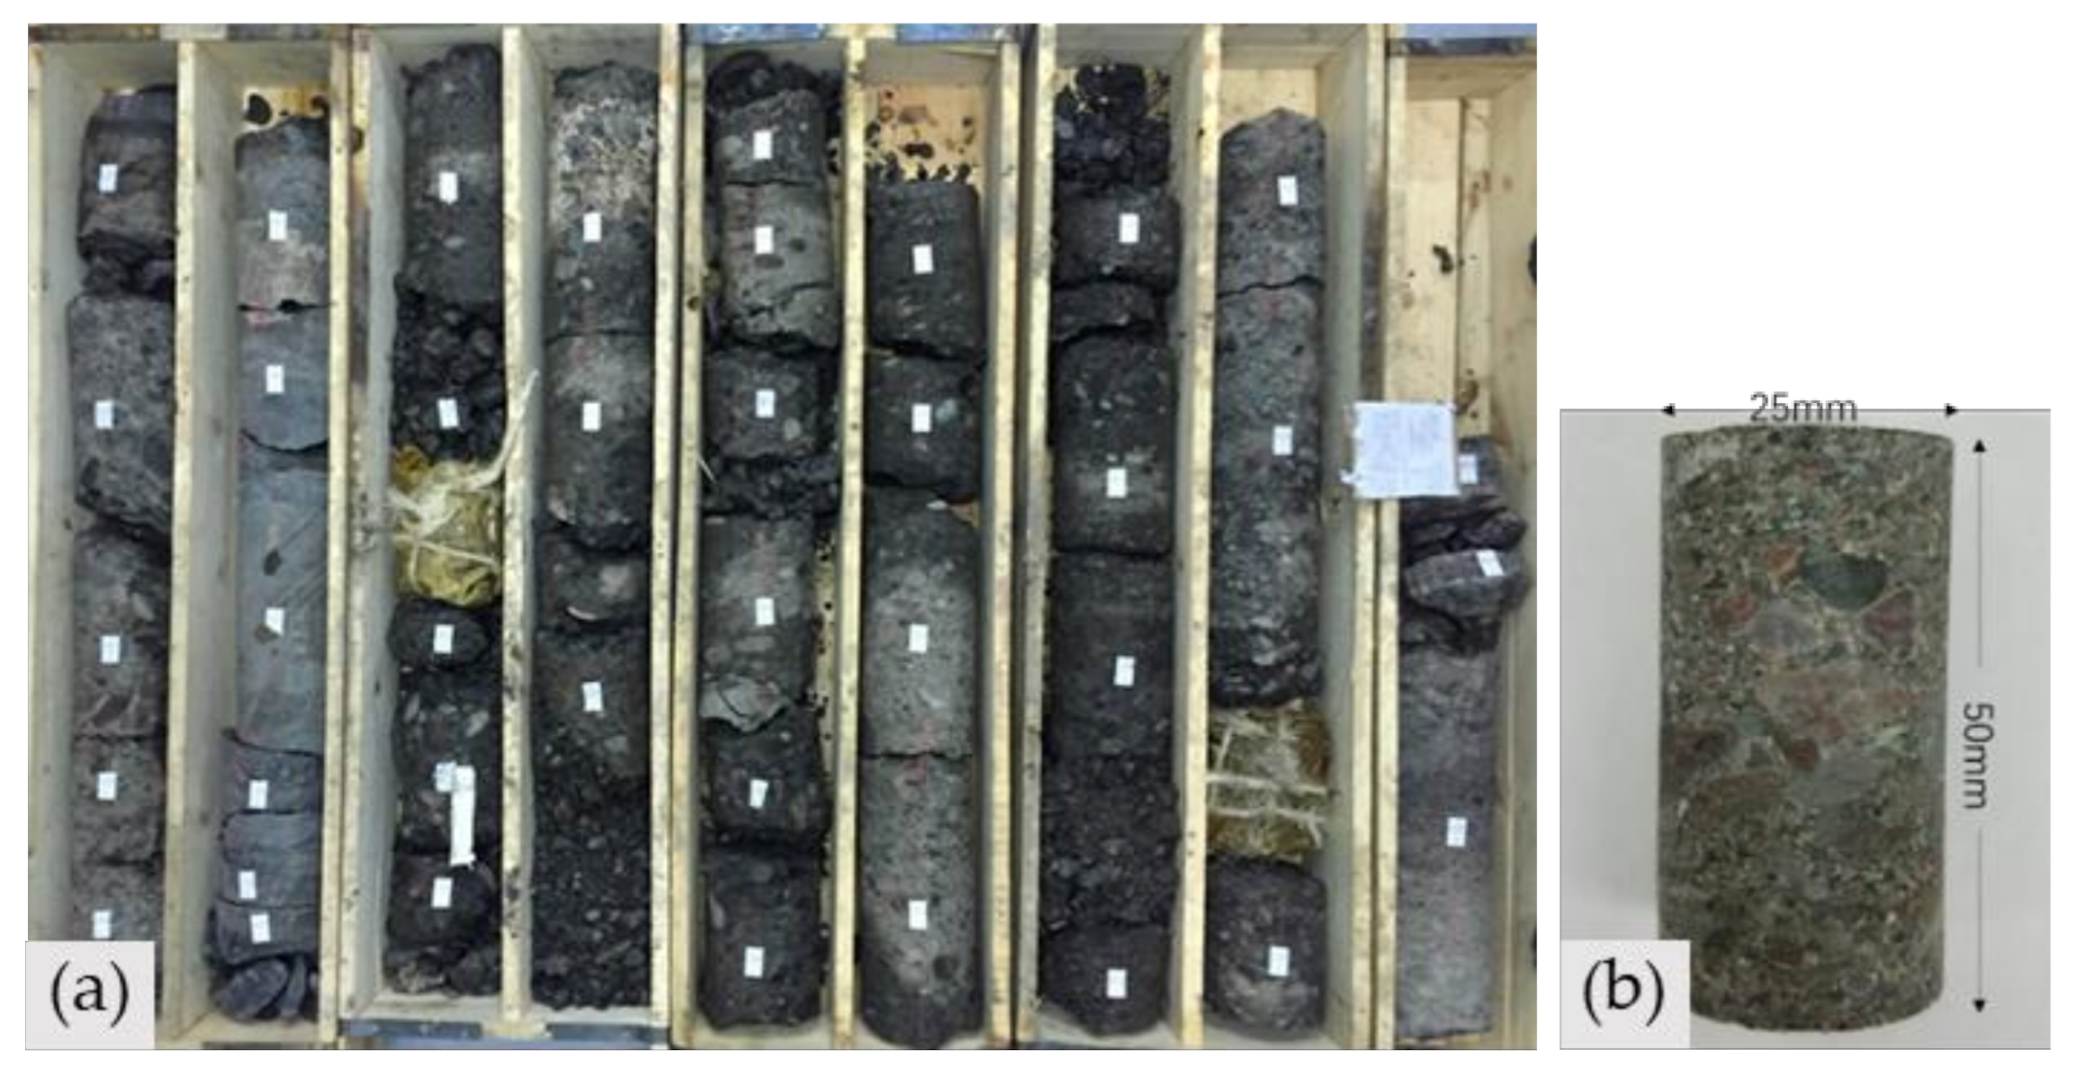
2.1. Sample Preparation

The samples used for experimental tests were obtained from in situ glutenite formation rocks drilled from several wells that belonging to the studying block. According to Figure 1a, in situ laumontite-rich glutenite rocks become loose and fragile after being transported to the ground. By traditional sample drilling method using a core bit, the cores are more easily to be fragmentized, which increases the experimental error. Thus, to lower the mechanical damage caused by core bit, the wire cutting method was introduced to process the rocks into cylindrical shape with a diameter of 25 mm and height of 50 mm, as shown in Figure 1b. The sample coring method we used here was consistent with ISRM suggested methods [14]. In order to ensure the ends of the cores were smooth and parallel to each other in the horizontal direction as well as perpendicular to vertical axial, a polishing machine was used to polish the end face of the samples at both ends.

2.2. Experimental Contents

The effects of the petrophysical, rock mechanical and fracture properties are of vital importance throughout the entire tight oil recovery process. Therefore, the key points of our experimental research involved figuring out the mineral composition and investigating how laumontite content influences these properties, as mentioned. A summary of the pertinent lab tests which were performed includes:
  • Mineral composition and physical properties analysis;
  • Triaxial compression tests;
  • Stress-coupled permeability tests;
  • Fracture proppant conductivity tests.

2.3. Experimental Results

2.3.1. Mineral Composition and Physical Properties

The XRD analysis was first conducted on prepared specimens to obtain the mineral composition of the reservoir formation and classify the glutenite types by laumontite content. The XRD analysis was conducted on powder samples and the standard approach for mineral identification was applied, so detailed description of the experimental procedure is outside of the scope of this paper. In this section, XRD tests were conducted on glutenite reservoir samples obtained from four different wells in this area, each well contained four samples to avoid heterogeneity, and the depth of each sample location is elaborated in Table 1. As presented in Table 1, there is an obvious variance of mineral composition between the four tested wells, which means there are strong heterogeneities of the laumontite contents across the target formation. In general, the rock constituents mainly contain quartz, feldspar and laumontite, with the average contents of laumontite ranging from 7.38% to 48.79%. As shown in Table 1 and Figure 2, according to laumontite content the glutenite rocks can be classified into two types according to laumontite content: (a) Type I and (b) Type II. Type I represents glutenite rocks with high laumontite content (>40%) and type II represents glutenite rocks with low laumontite content (<25%).
According to our previous experimental studies, although the clay minerals are mainly composed of an illite/smectite mixture (I/S), which belongs to swelling clay minerals in this area, the total amount of clay in the tested samples is very low (around 5%) as shown in Table 1. Therefore, we hold the view that the I/S of such small amounts will only have a trivial influence on rock mechanical properties and fluid flow behaviors. Thus, we did not perform clay mineral composition analysis at this time.
Based on mineral composition results, original porosity and permeability tests were also performed on those samples to investigate how the laumontite content influences the physical properties of glutenite rocks. In total 16 samples from 4 wells were tested for initial porosity and permeability. The porosity tests were conducted based on the method of Boyle’s law and the testing medium used was nitrogen. Since the permeability of laumontite-rich glutenite rocks in this area is ultralow, the traditional method of permeability measurement is time-consuming and inaccurate. Therefore, we introduced the pulse method for permeability testing to reduce the testing time [15]. The medium used for permeability tests was self-prepared brine to avoid rock swelling and permeability damage. The brine was prepared by water with potassium chloride of 3% by weight. All the permeability measurements were conducted under a low confining pressure of 2.5 MPa. The final results are presented in Figure 3. On the whole, the porosity of the collected laumontite-rich glutenite samples is less than 12%. According to Figure 3a, with the content of laumontite increasing, the average porosity of the collected rock samples has a significant increasing trend. The relationship between the laumontite content and the porosity can be linearly fitted, and it can also be inferred that the pores of the studied glutenite reservoir are dominated by laumontite dissolved pores. Similarly, the relationship between permeability and porosity is also depicted. As shown in Figure 3b, the permeability of the samples increases with the increase in porosity, and the relationship curve can be approximated with an exponential function. According to the experimental results of the rock samples, the initial porosity and permeability of reservoir with a high laumontite content is larger than that with a low laumontite content. It is generally considered that high porosity and permeability of reservoir indicates good productivity [16]. However, the actual oil testing results indicate that in the studied area, reservoirs with higher laumontite content tend to have poor productivity or productivity that declines faster, which is contrary to conventional understanding. As discussed earlier, laumontite-rich rocks have strong deformation potentials and stress sensitivity in permeability, which can significantly affect productivity. Therefore, experimental tests related to rock mechanical properties and fluid flow behaviors should be conducted to investigate how these properties influence well productivity.

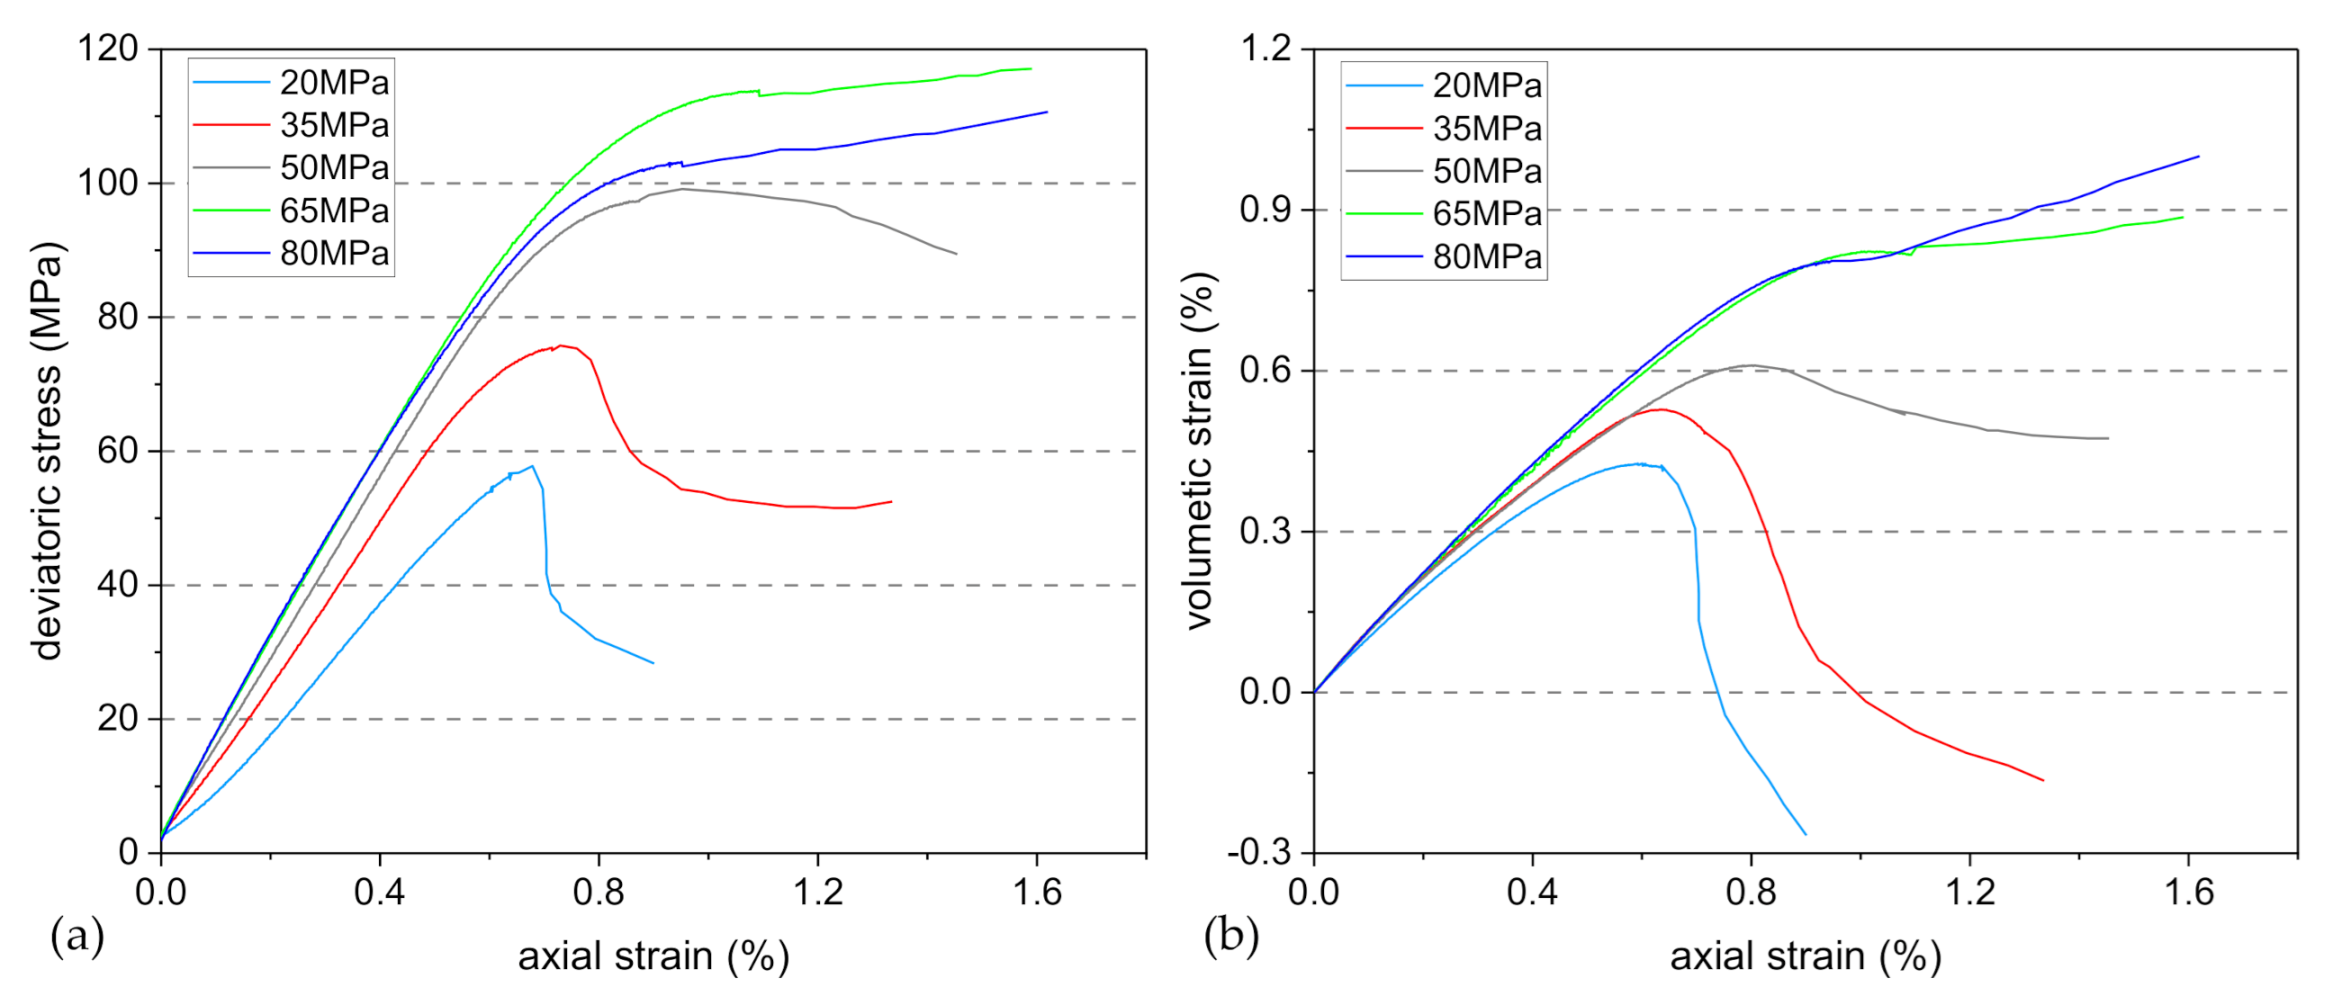
2.3.2. Rock Mechanical Properties

In this section, triaxial compression tests under different confining pressures were conducted to investigate the rock mechanical properties of laumontite rich glutenite rocks. All the triaxial experiments were performed by an advanced GCTS (Geotechnical Consulting Testing System) triaxial testing system at China University of Petroleum, Beijing. To get an accurate stress–strain curve, a shrinkable tube with a rubber belt was used to seal the sample and precision displacement transducers were applied to measure the axial and radial strains. The testing system used a precision servo pump to control the axial loading rate. All the tested samples were loaded under a constant axial strain rate of 0.05%/min. Before the axial loading process, the samples were first applied with hydrostatic pressure equal to the designed confining pressure. After that the axial load procedure was executed with a constant axial strain rate. Meanwhile, data including deviatoric stress, axial strain and radial strain were synchronously recorded with time, respectively. In total 10 glutenite rock samples including 5 samples with high laumontite content and 5 samples with low laumontite content were tested under various confining pressures. As the studied formations were at a great depth, the confining pressures were set at a high level, ranging from 20 MPa to 80 MPa (20, 35, 50, 65 and 80 MPa).
(1)
Elastic deformation and strength analysis
Figure 4a displays the elastic modulus variation with confining pressure. It can be inferred that the elastic modulus of the high laumontite content glutenite rocks is lower than that of the low laumontite content glutenite rocks under the same confining pressure. Another notable feature is that the elastic modulus increases as the confining pressure increases, which reflects a stress-dependent property of laumontite-rich formation. The relationship between yield stress (Mises stress) and mean effective stress from each triaxial test is also depicted in Figure 4b. According to the figure, the mechanical strength of a higher laumontite content sample is also lower than that of a lower content one under the same confining pressure. As for yield criterion, yield stress can be fitted by the linear Drucker–Prager plasticity strength criterion under low confining pressures. When the confining pressure exceeds 50 MPa, the yield stress tends to decrease with the mean effective stress. It can be inferred that the yield stress cannot keep increasing with confining pressure. Therefore, we describe the yield surface by an extended Drucker–Prager model with cap plasticity [17].
(2)
Post yield deformation analysis
Rock deformation is usually divided into two stages: elastic deformation before yielding and plastic deformation after yielding [18]. The deformation of the rock means the deformation of the pores, especially when the load continues after yielding, the shear dilation and shear-enhanced compaction phenomenon will occur, which will greatly affect the permeability of the reservoir and further affect production rates [19,20]. Here we focus on the analysis of the triaxial stress-strain curves of five type I (high laumontite content) glutenite samples under various confining pressures.
All the stress–strain curves of tested samples are depicted in Figure 5. In order to compare the strain changes under different confining pressures more intuitively, we set the initial strain 0 and the strain formed during the hydrostatic pressure loading process is temporarily subtracted. As shown in Figure 5a, the deformation of studied glutenite samples can also be divided into two stages. Under low confining pressures (20, 35, 50 MPa), it can be seen from the stress-strain curves that stress softening occurs after the peak strength, which indicates an obvious brittle failure. Meanwhile, according to the volumetric-axial strain curves presented in Figure 5b, there is an apparent deflection of volumetric strain after entering the yield stage. After the peak strength, the volumetric strain decreases in the opposite direction as the axial strain increases, and shear dilation occurs. Under the condition of high confining pressure (above 50 MPa), the amplitude of stress increasing with axial strain decreases after yield point, which indicates the characteristics of stress hardening. The volumetric strain of rock continues to increase after the yield point, and shear-enhanced compaction occurs.
Some literatures have discussed about this phenomenon of shear enhanced dilation/compaction [19,20,21,22,23,24]. There are basically three types of mechanical deformation modes that relate to volumetric deformation in porous rocks when loaded under constant confining pressure: elastic compression, shear dilation and shear enhanced compaction. When porous rock is applied with stress before yield, only elastic compression occurs. In this situation the pores are compressed, resulting in the reduction of pore volume and permeability. When porous rock is sheared under low confining pressure, shear dilation occurs. There are microcracks produced inside the rock matrix and pores are partially connected, causing the enhancement of permeability. For porous rock under a high confining pressure, shear enhanced compaction and strain localization occur after volumetric compression stage. Under this type of failure, the rock matrix is destroyed and the pores collapse. The rock deformation at this time will cause a significant decrease in permeability, which is different from the permeability decrease mechanism caused by volumetric compression in the elastic stage.

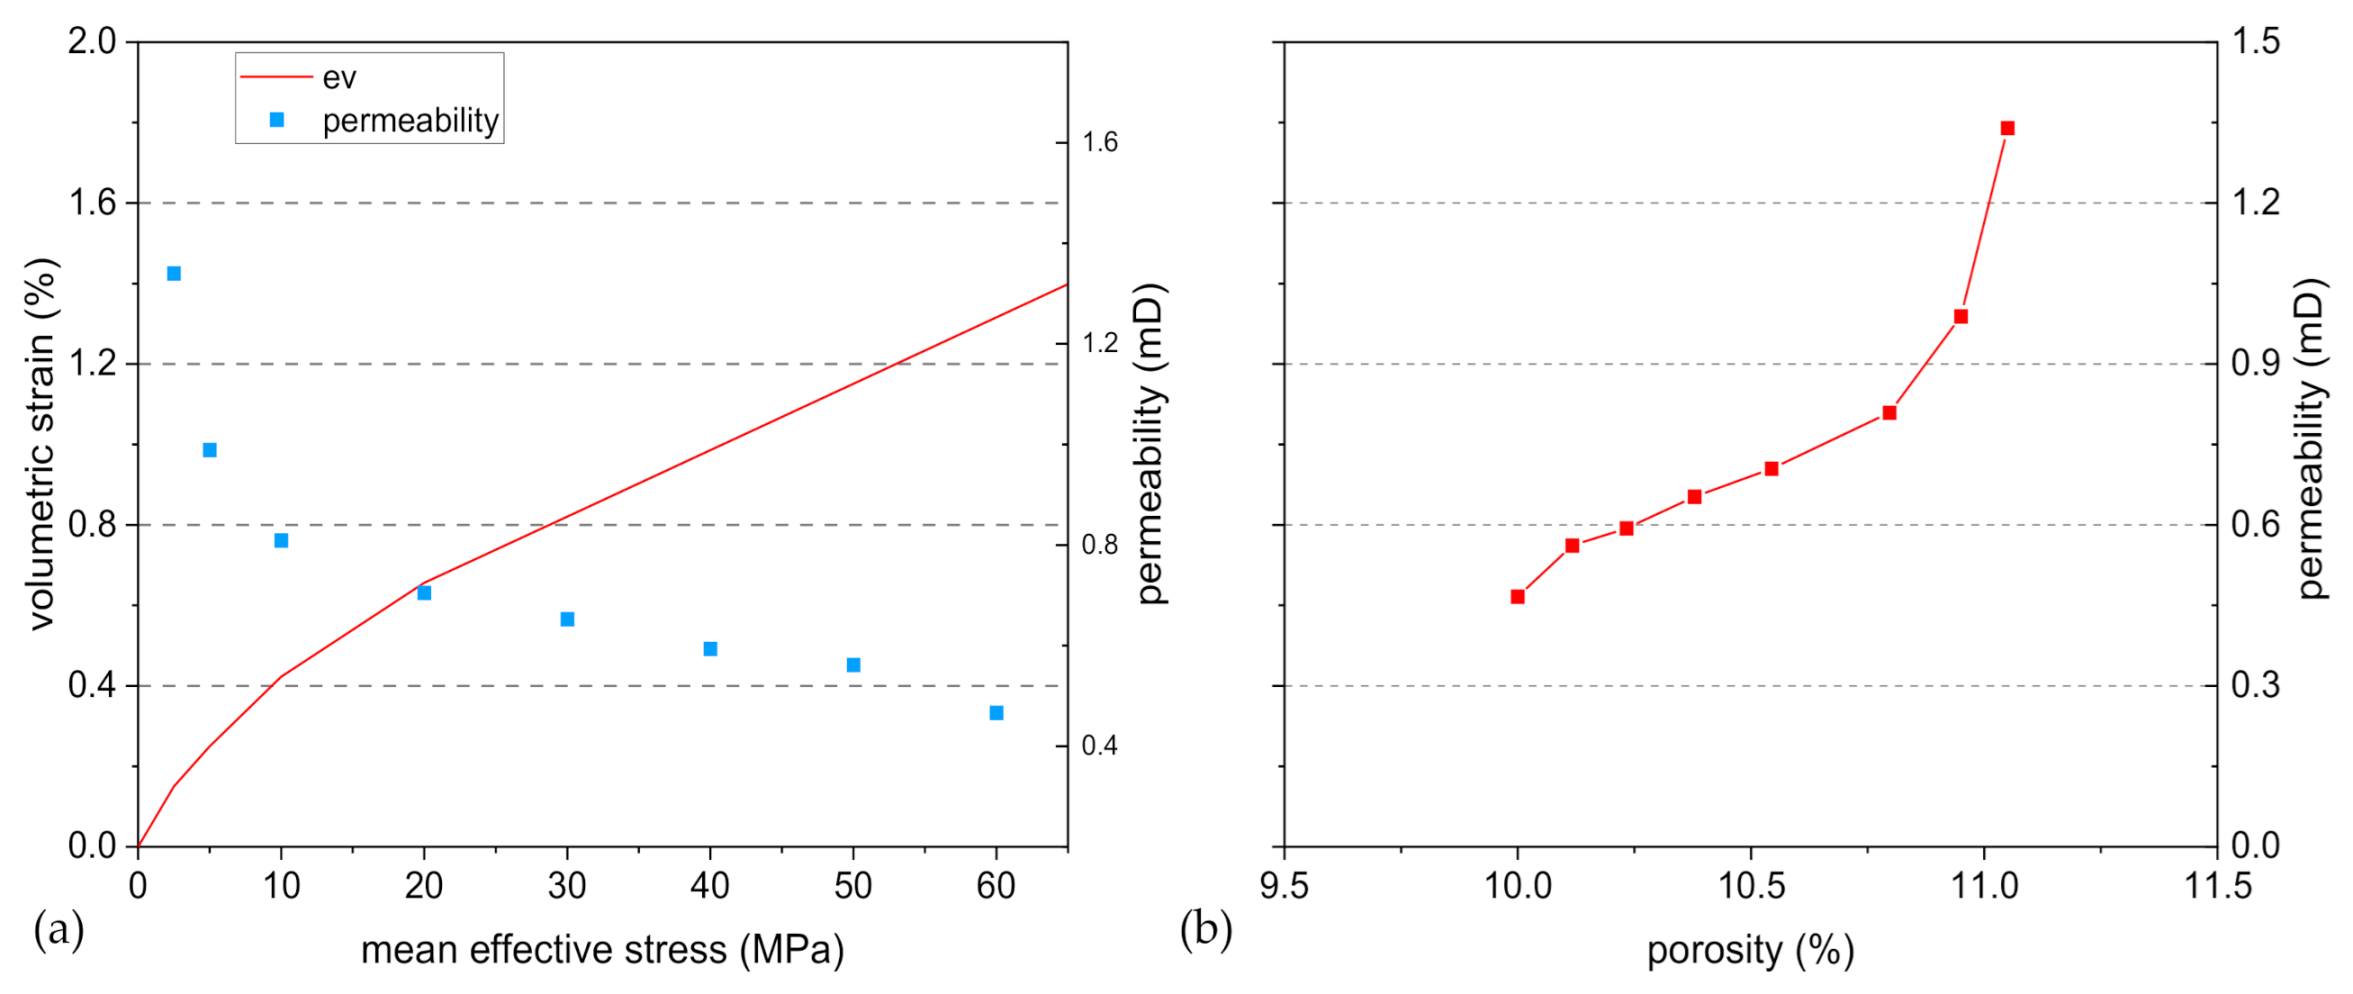
2.3.3. Stress-induced Permeability Reduction or Enhancement

According to the triaxial compression tests results, it can be inferred that there are three deformation forms of a rock sample under different stress states: elastic compression, shear dilation and shear enhanced compaction. As the volumetric variation mechanism of pores caused by each form is quite different, stress-induced permeability reduction or enhancement experiments were performed to quantitatively investigate how permeability changes under different stress paths. Three samples of type I glutenite were selected to conduct the tests. The first sample were loaded under hydrostatic pressure ranging from 0 to 80 MPa, the stress state of which is below yield surface. The other two samples were applied with axial load under corresponding confining pressure of 20 MPa and 65 MPa, representing shear dilation and compaction loading path, respectively. Permeability was measured repeatedly during the whole loading process, including the elastic compression stage, dilation stage and compaction stage. The medium used for permeability tests here is also self-prepared brine.
Figure 6 shows the variation of volumetric strain and permeability of rocks in hydrostatic loading experiment. The common perspective is that permeability variation is related to volumetric strain and the porosity variation caused by volumetric strain. Volumetric strain variation is usually related to mean stress variation, while rock shape variation is usually related to deviatoric stress variation [18]. Therefore, our analysis mainly focuses on the relationship among permeability, volumetric strain and mean effective stress. As shown in Figure 6a, as mean effective stress increases, rock pores undergo compression deformation and volume strain increases accordingly. Volumetric strain increases fast when mean effective stress is lower than 20 MPa, which is caused by the closure of microcracks inside rocks at early loading stage. As mean effective stress continues to increase, the increasing rate of volumetric strain first decreases and then remains constant. The variation trend of permeability is consistent with that of volumetric strain. The decreasing rate of permeability remains high when mean effective stress is under 20 MPa and decreases as mean effective stress continues to increase. Figure 6b shows the variation of permeability as porosity increases, and the curve can be fitted by an exponential model. In the whole loading range, the rock is under elastic deformation, so there is no deflection on the volumetric strain curve. In this case, there is little change in pore connectivity and the permeability decrease mainly results from the elastic compression of the pores. Therefore, the decreased permeability is still at the same order of magnitude as the original permeability.
Figure 7 shows the variation of the volumetric strain and the permeability of the rocks in the axial loading experiment under 20 MPa confining pressure. According to the previous mechanical analysis, rocks undergo shear dilatancy after yielding under this loading path. When the mean effective stress is lower than the yield stress, the variation rule of volumetric strain and permeability is consistent with that in hydrostatic loading experiment. After the yield point, the volumetric strain curve is deflected. As axial loading continues to increase, the mean effective stress continues to increase, but the increase in volumetric strain slows down. This indicates that shear dilatation starts (compression is denoted as positive, and expansion is denoted as negative). After the peak strength point, mean effective stress and volumetric strain start to decrease as axial loading continues to increase. In this stage, cracks start to initiate and the permeability of the rock increases in a small extent as volumetric strain decreases. The permeability increase is not obvious because the generated cracks do not penetrate the specimen. Figure 7b shows the variation of permeability with porosity.
Figure 8 shows the variation of the volumetric strain and the permeability of the rocks in the axial loading experiment under 65 MPa confining pressure. Under this loading path, rocks undergo shear compaction after yielding. When the mean effective stress is lower than the yield stress, the variation rule of the volumetric strain and permeability is consistent with that in the hydrostatic loading experiment. The rock is yielded when mean effective stress reaches 100 MPa, at which point a slight deflection occurs on the volumetric curve. After the deflection point, the increasing rate of the volumetric strain increases and the rock undergoes further compaction. The rock is stress-hardened and does not reach the peak strength. The permeability decreases sharply as the mean effective stress increases, and the decreased permeability is one order of magnitude lower than the original permeability. The reason for this is that shear compaction causes pore collapse and local plastic flow, resulting in the large decrease in pore flow capacity and permeability. Figure 8b shows the variation relationship between rock permeability and volumetric strain.

2.3.4. Fracture Proppant Conductivity Evolution

Fracture conductivity evaluation experiments are conducted to investigate the proppant conductivity in different fracture closure pressure. It was shown in the previous tests that the laumintite-rich glutenite samples have strong deformation potential. Considering different closure pressure due to in situ stress, the reservoir pressure and different producing pressures, it is speculated that the compression, deformation and embedding of the proppant may result in different conductivity of the formation under closure pressure. Experiments were performed on samples from type I and II reservoir formation. The proppant used in this test was 30/50 mesh ceramsite, which is generally used in field fracturing. As the average sanding concentration of the wells in the study area is 3.2 kg/m2, the proppant was laid at a concentration of approximately 3.2 kg/m2. In order to simulate the real fracture of formation, the proppant was added to the sample stimulation after the Brazilian tests. The closure pressure was adopted according to the in situ stress, reservoir pressure and wellbore pressure of wells in this block.
The experimental result is shown in Figure 9. It shows that the two reservoir formations have similar conductivity in the low closure stress. The conductivity decreases with the increase in closure pressure, and the conductivity of the high laumontite content glutenite declines more quickly than that of the low laumontite content glutenite. In conclusion, laumontite softens the rock matrix causing the proppant to embed within the rock matrix more easily, which leads to the flow channel narrowing down and conductivity decreasing more severely.

2.4. Hints for Well Production Evaluation

The experimental section has investigated rock mechanical deformation and fluid flow behaviors of laumontite-rich glutenite reservoirs. According to the experimental results, hints for well production evaluation are as followed:
  • Glutenite rocks with higher laumontite content have higher initial porosity and permeability. However, the permeability may vary significantly due to the pore deformation caused by the stress state. Therefore, initial porosity and permeability are not always the decisive factor of production.
  • Formations with higher laumontite content have lower elastic modulus and yield strength, which means they are more likely to deform and yield. There are three types of rock deformation: elastic shear compression, shear dilation and plastic shear enhanced compaction. The mechanisms by which these three deformation forms change the pore structure are quite different, so their influence on permeability is different. As a consequence, permeability evolution under different stress state must be considered for evaluating production.
  • Experiments on fracture proppant conductivity show that formations with higher laumontite content have a higher degree of proppant embedding, and the conductivity decreases faster with the increase in closure stress. Since hydraulic fractures are the main drainage channels for tight oil, fracture conductivity evolution should also be considered when evaluating production.

3. Fully Coupled Finite Element Model (FEM) for Production Simulation

In this section, a fully coupled elasto-plastic finite element model considering stress-induced permeability evolution has been established to study the stress states and permeability changing near the wellbore during the production testing of the fractured laumontite-rich tight glutenite well. Then oil productivity is analyzed to investigate the main factors affecting production.
In the simulated works, we have made some reasonable simplifications. Firstly, the simulation is performed under plane strain conditions to reduce computational expense. Secondly, fracture parameters like fracture length and fracture width were already known after fracturing, so the fracturing simulation was not the key point. Fractured well productivity was focused on instead. Finally, based on the previous rock mechanics results, to calculate the stress state and failure condition near wellbore and simplify the whole calculation process, an elasto-plastic constitutive was proposed in the model.

3.1. Numerical Scheme

3.1.1. Mechanical Models

The dependent variable of the mechanical equilibrium equation is displacement u, and the main governing equations are described as follows:
0 = · S + F v
where F v is body force and S is the effective stress tensor, which can be expressed as:
S = S α b p I
where S is the stress tensor, α b is the Boit’s coefficient, p is pore pressure and I is the identity matrix. The stress S also can be expressed by:
S = S 0 + C : ε
where S 0 is the initial stress tensor, C is the elastic coefficient matrix, ε is the total strain tensor, which can be expressed as:
ε = 1 2 u + u T
u = u x u y u z v x v y v z w x w y w z
The total strain ε can be decomposed into elastic ε i j e and inelastic parts ε i j p :
ε i j = ε i j e +   ε i j p
The plastic strain increment is calculated using the plastic potential energy function [25,26]:
ε ˙ i j p = λ Q S
The potential Q is written in terms of at most three invariants of Cauchy’s stress tensor. Q = Q I 1 , J 2 , J 3 , I 1 , J 2 , J 3 are invariants of stress tensor. λ is a scalar that is determined from the consistency condition to keep the stress point on the yield surface. The yield function f S = 0 .
The DP yield surface is given by:
f s = q p tan β d
where p is the mean effective stress, q is the Mises stress, β is the rock’s DP angle of friction and d is the rock’s cohesion. The elliptical cap yield surface is given as:
f c = p c 2 a 2 + q 2 b 2 1

3.1.2. Fluid Flow Models

The fluid flow equation can be expressed as:
ρ ϕ t + ρ v ρ ϕ ε v t = q m
where v represents seepage velocity and it can be expressed by:
v = k μ
where k is permeability and μ is fluid viscosity.

3.1.3. Permeability Evolution Model

According to the previous experiment results, the stress-induced permeability evolution model was considered as three types under different stress states:
(1)
Elastic deformation stage.
The effective stress increases when the bottom hole pressure drops. The rock might undergo elastic deformation when the stress state is below the yield surface. We adopt an exponential model to describe the evolution in permeability with stress [27]:
k = k 0 e α p C p p ,         f S < 0
where k is the current permeability, k 0 is the initial permeability, C p is the pore compressibility, α p is the porosity exponent and p is the mean effective stress.
(2)
Shear dilation stage.
When the stress state of the formation reaches the DP yield surface, shear dilation occurs. The microcracks inside the rock connect the pores and shorten the fluid flow path to some extent. Combined with the experimental results, the equivalent channel model for permeability is adopted in this paper [28]. The proposed model relates the permeability with volumetric strain and is expressed by:
k = C m 2 ϕ ε v τ 2 ,         f s S = 0 ,   f c S < 0
where C is the shape coefficient, m is the hydraulic radius and τ is the tortuosity.
(3)
Shear enhanced compaction stage.
When effective stress reaches the Cap yield surface, shear enhanced compaction occurs. Shear compaction causes pore collapse and local plastic flow, resulting in the large decrease in pore flow capacity and permeability. The flow path is narrower and more tortuous. Thus, the irreversible damage of permeability is induced. Combined with experimental results, the effective permeability of this case can be expressed as [22]:
k = k m ε p β k m k c b 1 + 1 ,         f s S < 0 ,   f c S = 0
where k m and k c b are the permeability of the matrix and of the shear bands, β is shear bands coefficient, ε p is the plastic volumetric strain.
(4)
Fracture permeability evolution
Fracture permeability evolution was also considered in our numerical model. Here we adopt an exponential model to describe the evolution of fracture permeability with normal stress:
k f = k f 0 e α f σ n
where k f 0 is initial fracture permeability and α f is the fracture exponent.

3.2. Case Verification

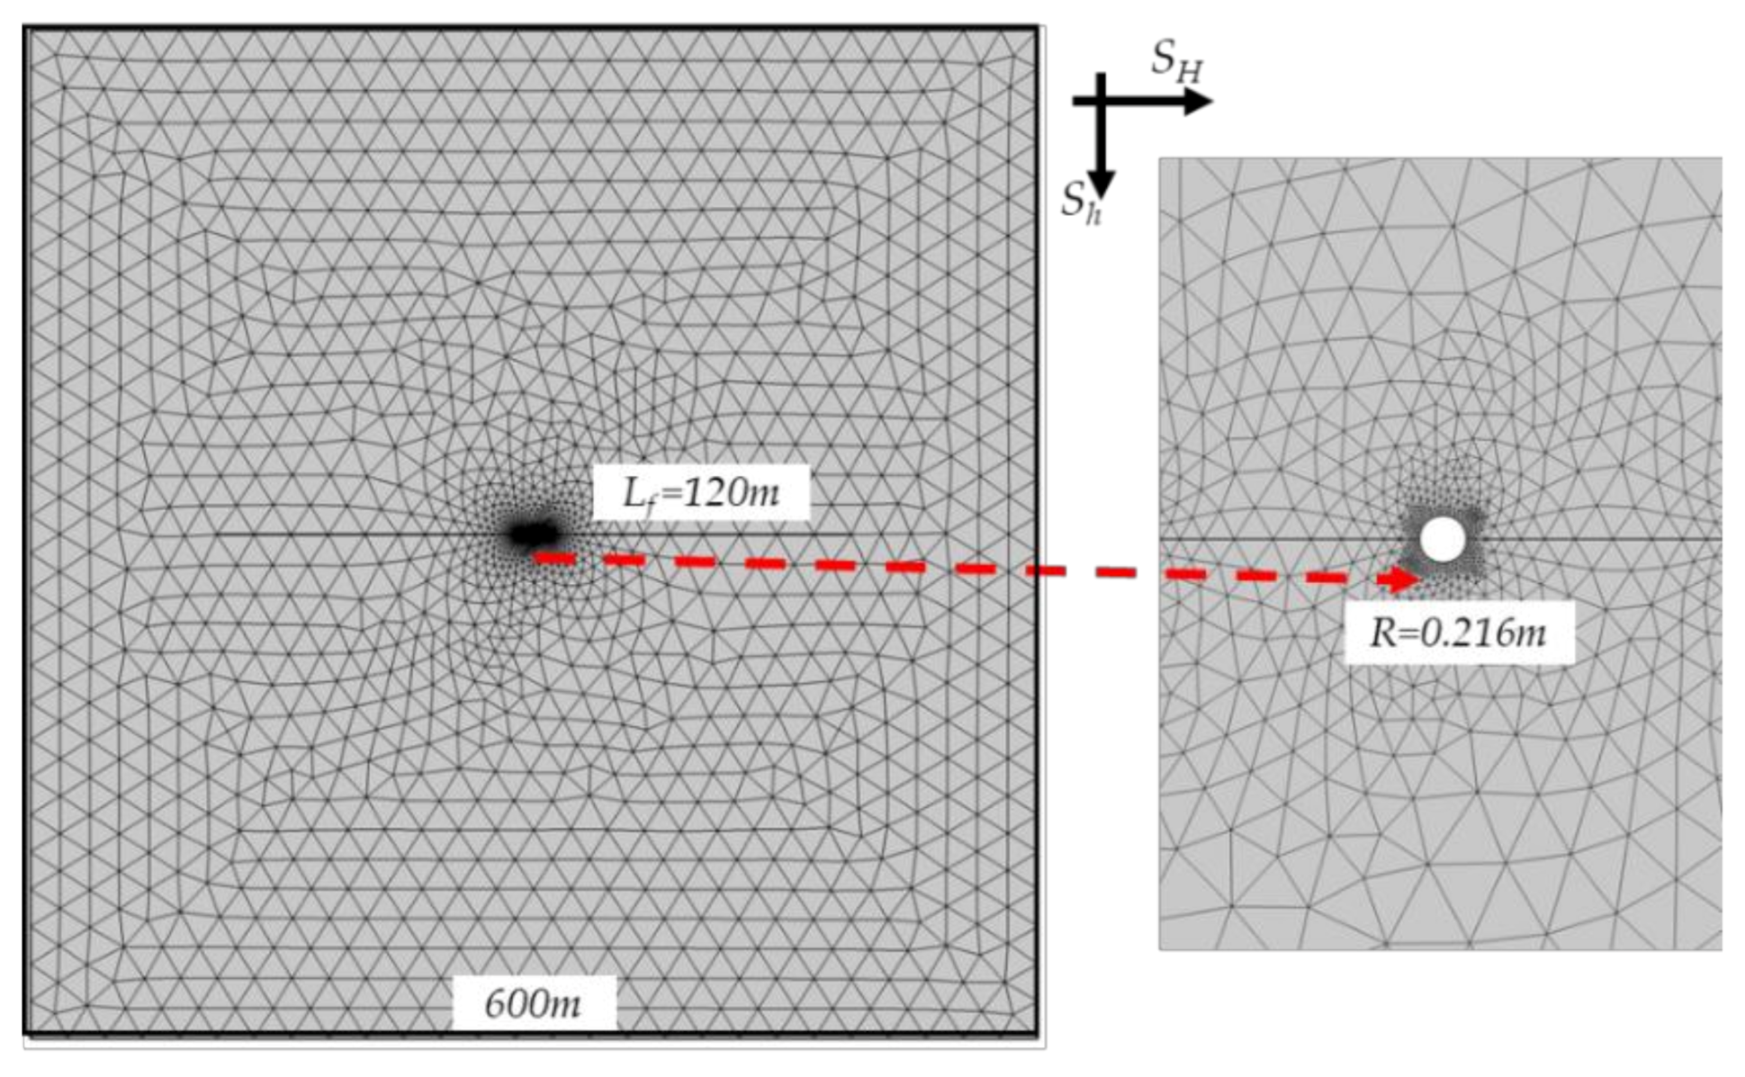
3.2.1. Model Description and Parameters

In this study, we applied our model to simulate the production of hydraulic fractured well-1 in the studied area to validate the proposed model. The geometry model and parameters are set according to the actual data of well-1. As shown in Figure 10, a plane strain elastoplastic finite element model is developed. The dimension of the model is 600 m × 600 m. In the middle part of the model, there is a wellbore. The detailed reservoir parameters in the simulation are listed in Table 2. The varying bottom-hole pressure is applied according to field data as the oil nozzle is adjusted during the well testing, which is shown in Figure 11.

3.2.2. Comparison of Simulation and Field Data

Figure 12 shows the oil production changes with the production time of the simulation and well testing data. It can be seen from the figure that the results of the numerical simulation are basically consistent with the trends of the field data. What is worth noting is that the initial oil production rate will not always increase with the increase in production pressure difference. The increase in the production pressure difference will cause the effective stress around the wellbore and the hydraulic fracture to increase, resulting in a significant decrease in permeability and a decrease in production.
Figure 13 shows the simulated pore pressure, mean effective stress and current permeability distribution of different production time. It can be inferred that as the bottom hole pressure decreases and production time goes by, the pore pressure drop region has a significant reduction in permeability. This explains why the oil production rate will continue to decline.

3.3. Discussion

There are three ways that laumontite affects oil production rate: initial permeability, stress-dependent permeability and fracture conductivity. We will discuss these three factors in detail. In this section, the wellbore pressure was set as constant and the parameters including initial permeability, stress-dependent permeability and fracture conductivity were coupled in our model.

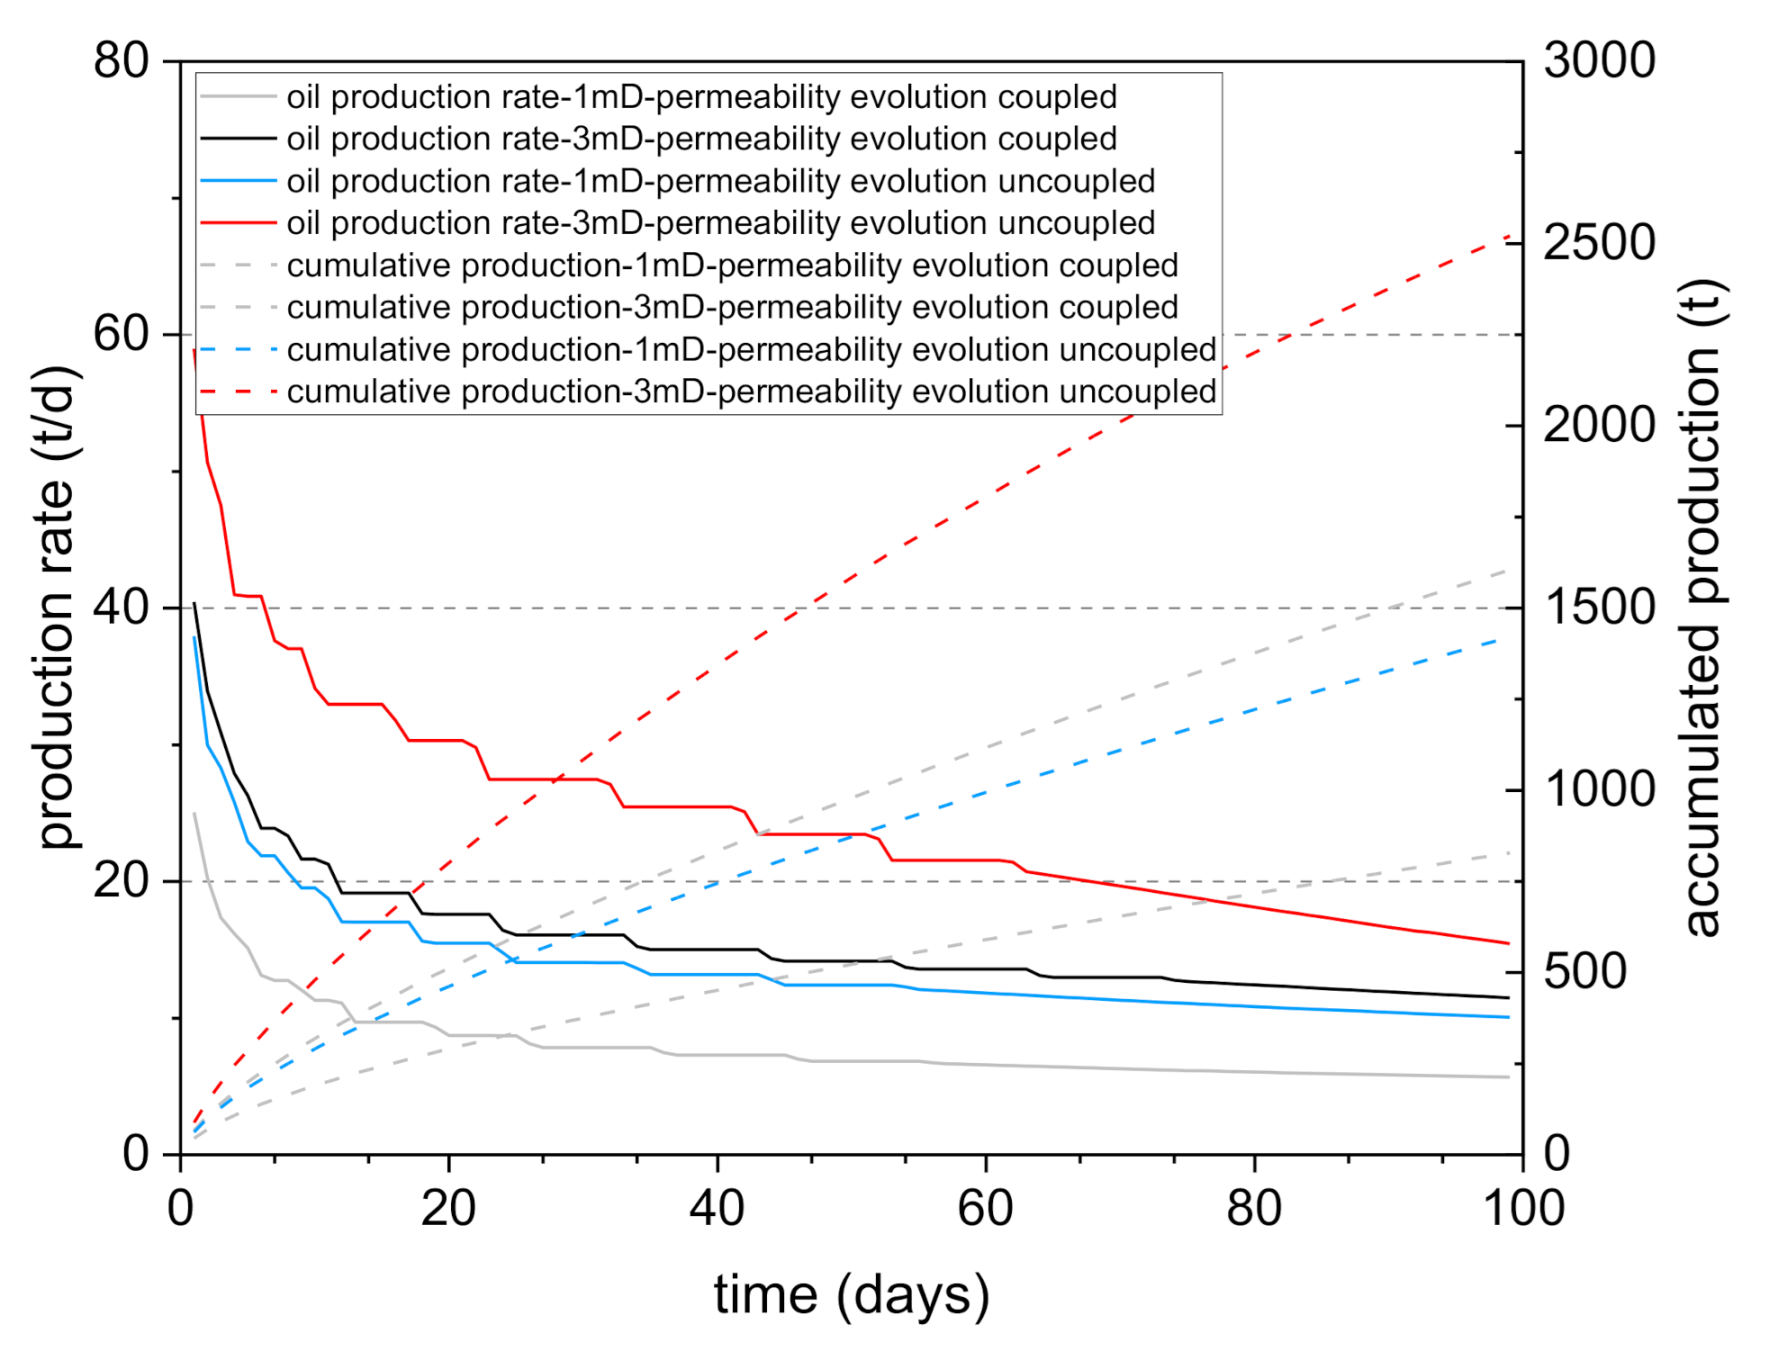
3.3.1. Effect of Stress-Induced Permeability Evolution on Production

Figure 14 shows the oil production rate and accumulated oil production variation with production time for stress-induced permeability evolution in the coupled and uncoupled models, respectively. The oil production rate of the permeability evolution coupled model is significantly larger than that of the uncoupled model and this situation will continue until the late period of the production. Since the accumulated oil production is the sum of the daily oil production, the accumulated production predicted by the permeability evolution coupled model is also higher than that of the uncoupled one. The production difference will become more obvious as the production time goes by. Therefore, the strong stress-dependent permeability evolution may be one of the reasons causing the low and quickly declining oil rates of the laumontite-rich glutenite wells in this area.

3.3.2. Effect of Initial Permeability on Production

To analyze how initial permeability influences productivity, the initial permeability was set 1 mD and 3 mD in the production simulation. As shown in Figure 15, the simulated oil production rate of the models with higher initial permeability is larger than that with lower permeability for permeability evolution coupled and uncoupled models. Therefore, initial permeability is one of the ways that laumontite affects the productivity in this area. What is worth noting is that when permeability evolution is considered, the productivity difference caused by the initial permeability will reduce. Actually, glutenite formation with higher laumontie content commonly has a more severe stress sensitivity in permeability, so the productivity difference will be further reduced.

3.3.3. Effect of Fracture Conductivity Evolution on Production

The impact of the fracture conductivity evolution on productivity was also investigated by simulation. According to Figure 16, the predicted oil production rate of the fracture conductivity evolution coupled model is slightly larger than that of uncoupled one. Therefore, the conductivity reduction of the fracture may not be a major factor causing the low and quickly declining oil rates of the laumontite-rich glutenite wells in this area.

4. Conclusions

The actual productivity of the hydraulically fractured wells on this laumontite-rich tight glutenite formation is less than expected. Some wells are even related to poor and rapidly declining oil productivity. In this study, comprehensive experimental and numerical simulation studies have been conducted to investigate the rock deformation, fluid flow behaviors and the major controlling factors of productivity. The conclusions are as follows:
  • The laboratory data indicated that the tight glutenite formation with higher laumontite content has higher initial porosity and permeability but lower yield strength and more severe stress sensitivity in permeability. Through the rock mechanical tests and stress-coupled permeability tests, we found that there are three types of rock deformation that occur during the loading process: elastic compression, shear dilation and shear enhanced compaction. Both elastic compression and shear enhanced compaction will cause a reduction in rock porosity and permeability.
  • Experiments on fracture proppant conductivity showed that formations with higher laumontite content have a higher degree of proppant embedding, and the conductivity decreases faster with the increase in closure stress.
  • A fully coupled finite element model (FEM) considering stress-induced permeability evolution was introduced to simulate the production process. Permeability evolution models of three different deformation stages were presented, respectively. Simulation results showed that our model is in good agreements with the well testing data.
  • The simulated oil production characteristics for permeability evolution coupled and uncoupled models were compared. Results showed the strong stress-induced permeability reduction is the major factor that laumontite causing the low and quickly declining oil rates. The initial permeability has a positive effect on productivity and the productivity variance will reduce when stress-induced permeability reduction is considered. Stress-induced fracture permeability reduction has a slight influence on productivity, which can be neglected when evaluating reservoirs in the studied area.

Author Contributions

Conceptualization, S.Y.; funding acquisition, Y.J.; methodology, S.Y.; data curation, B.C.; writing, S.Y.; writing—review and editing, Y.L.; revision, Y.Z. All authors have read and agreed to the published version of the manuscript.

Funding

This research received no external funding.

Institutional Review Board Statement

Not applicable.

Informed Consent Statement

Not applicable.

Data Availability Statement

The data presented in this study are available on request from the corresponding author.

Acknowledgments

This study is supported by the United Fund Key Program (No. U1762215) and Chinese National Natural Science Foundation (No. U19B6003-05). This study is also supported by the State Key Laboratory of Petroleum Resource and Prospecting, China University of Petroleum, Beijing.

Conflicts of Interest

The authors declare no conflict of interest.

References

  1. EIA. Natural Gas Gross Withdrawals and Production. Natural Gas. 2017. Available online: https://www.eia.gov/todayinenergy/detail.php?id=34212 (accessed on 10 March 2021).
  2. Zhang, R.; Hou, B.; Tan, P.; Muhadasi, Y.; Fu, W.; Dong, X.; Chen, M. Hydraulic fracture propagation behavior and diversion characteristic in shale formation by temporary plugging fracturing. J. Pet. Sci. Eng. 2020, 190, 107063. [Google Scholar] [CrossRef]
  3. Chen, Y.; Jin, Y.; Chen, M.; Yi, Z.; Zheng, X. Quantitative evaluation of rock brittleness based on the energy dissipation principle, an application to type II mode crack. J. Nat. Gas Sci. Eng. 2017, 45, 527–536. [Google Scholar] [CrossRef]
  4. Du, H.; Carpenter, K.; Hui, D.; Radonjic, M. Microstructure and micromechanics of shale rocks: Case study of marcellus shale. Facta Univ. Ser. Mech. Eng. 2017, 15, 331–340. [Google Scholar] [CrossRef] [Green Version]
  5. Chen, B.; Xu, B.; Li, B.; Kong, M.; Wang, W.; Chen, H. Understanding the performance of hydraulically fractured wells in the laumontite-rich tight glutenite formation. J. Pet. Sci. Eng. 2020, 185, 106600. [Google Scholar] [CrossRef]
  6. Noh, J.; Boles, J. Origin of Zeolite Cements in the Miocene Sandstones, North Tejon Oil Fields, California. J. Sediment. Res. 1993, 63, 248–260. [Google Scholar]
  7. Hall, A. The occurrence of laumontite in volcanic and volcaniclastic rocks from southern Sumatra. J. Asian Earth Sci. 1997, 15, 55–59. [Google Scholar] [CrossRef]
  8. Frost, B.; Surdam, R.; Crossey, L. Secondary porosity in laumontite-bearing sandstones. AAPG Bull. Am. Assoc. Pet. Geol. 1982, 66, 569–570. [Google Scholar]
  9. Duan, W.; Luo, C.; Lou, Z.; Liu, J.; Jin, A.; Zhu, R. Diagenetic differences caused by the charging of natural gases with various compositions—A case study on the lower Zhuhai Formation clastic reservoirs in the WC-A sag, the Pearl River Mouth Basin. Mar. Pet. Geol. 2017, 81, 149–168. [Google Scholar] [CrossRef]
  10. Yuan, G.; Cao, Y.; Zhang, Y.; Gluyas, J. Diagenesis and reservoir quality of sandstones with ancient “deep” incursion of meteoric freshwater—An example in the Nanpu Sag, Bohai Bay Basin, East China. Mar. Pet. Geol. 2017, 82, 444–464. [Google Scholar] [CrossRef] [Green Version]
  11. White, C.; Ruiz-Salvador, A.R.; Lewis, D. Pressure-Induced Hydration Effects in the Zeolite Laumontite. Angew. Chem. Int. Ed. 2004, 43, 469–472. [Google Scholar] [CrossRef] [PubMed]
  12. Zhang, Y.; Ding, X.; Yang, P.; Liu, Y.; Jiang, Q.; Zhang, S. Reservoir formation mechanism analysis and deep high-quality reservoir prediction in Yingcheng Formation in Longfengshan area of Songliao Basin, China. Petroleum 2016, 2, 334–343. [Google Scholar] [CrossRef] [Green Version]
  13. David, C.; Wong, T.-F.; Zhu, W.; Zhang, J. Laboratory measurement of compaction-induced permeability change in porous rocks: Implications for the generation and maintenance of pore pressure excess in the crust. Pure Appl. Geophys. 1994, 143, 425–456. [Google Scholar] [CrossRef]
  14. Ulusay, R. The ISRM Suggested Methods for Rock Characterization, Testing and Monitoring: 2007–2014; Springer International Publishing: Cham, Switzerland, 2015; p. 293. [Google Scholar]
  15. Brace, W.F.; Walsh, J.B.; Frangos, W.T. Permeability of granite under high pressure. J. Geophs. Res. 1968, 73, 2225–2236. [Google Scholar] [CrossRef]
  16. Rider, M.H. The Geological Interpretation of Well Logs; Cambridge University Press: Cambridge, UK, 2018. [Google Scholar]
  17. Wong, T.; Baud, P. The brittle-ductile transition in porous rock: A review. J. Struct. Geol. 2012, 44, 25–53. [Google Scholar] [CrossRef]
  18. Wang, R. Fundamentals of rock mechanics. Eng. Geol. 1981, 17, 302. [Google Scholar] [CrossRef]
  19. Meng, F.; Baud, P.; Ge, H.; Wong, T. The Effect of Stress on Limestone Permeability and Effective Stress Behavior of Damaged Samples. J. Geophys. Res. Solid Earth 2019, 124, 376–399. [Google Scholar] [CrossRef]
  20. Wang, J.; Ge, H.; Wang, X.; Shen, Y.; Liu, T.; Zhang, Y.; Meng, F. Effect of Clay and Organic Matter Content on the Shear Slip Properties of Shale. J. Geophys. Res. Solid Earth 2019, 124, 9505–9525. [Google Scholar] [CrossRef]
  21. Wong, T.; David, C.; Zhu, W. The transition from brittle faulting to cataclastic flow in porous sandstones; mechanical deformation. J. Geophys. Res. Solid Earth 1997, 102, 3009–3025. [Google Scholar] [CrossRef]
  22. Baud, P.; Reuschlé, T.; Ji, Y.; Cheung, C.S.N.; Wong, T.F. Mechanical compaction and strain localization in Bleurswiller sandstone. J. Geophys. Res. Solid Earth 2015, 120, 6501–6522. [Google Scholar] [CrossRef]
  23. Baud, P.; Klein, E.; Wong, T.F. Compaction localization in porous sandstones: Spatial evolution of damage and acoustic emission activity. J. Struct. Geol. 2004, 26, 603–624. [Google Scholar] [CrossRef]
  24. Wu, R.; Deng, J.; Liu, W.; Mao, S.; Sun, J.; Yan, M.; Li, M.; Li, Y. Numerical investigation of fluid injection into poorly consolidated geomaterial considering shear dilation and compaction. J. Pet. Sci. Eng. 2018, 168, 119–132. [Google Scholar] [CrossRef]
  25. Ottosen, N.S.; Ristinmaa, M. The Mechanics of Constitutive Modeling; Elsevier Science Ltd.: Amsterdam, The Netherlands, 2005; pp. 145–202. [Google Scholar]
  26. Li, L.; Li, X.; Wang, Y.; Qin, C.; Li, B.; Luo, Y.; Feng, J. Investigating the Interaction Effects between Reservoir Deformation and Hydrate Dissociation in Hydrate-Bearing Sediment by Depressurization Method. Energies 2021, 14, 548. [Google Scholar]
  27. McKee, C.R.; Bumb, A.C.; Koenig, R.A. Stress-Dependent Permeability and Porosity of Coal and Other Geologic Formations. SPE Form. Eval. 1988, 3, 81–91. [Google Scholar] [CrossRef]
  28. Paterson, M.S. The equivalent channel model for permeability and resistivity in fluid-saturated rock—A re-appraisal. Mech. Mater. 1983, 2, 345–352. [Google Scholar] [CrossRef]
Figure 1. Sample preparation. (a) in situ glutenite formation rocks, (b) a standard core drilled from in situ rocks.
Energies 14 01667 g001
Figure 2. Classified sample types according to laumontite content. (a) Type I: sample of high laumontite content, (b) Type II: sample of low laumontite content.
Energies 14 01667 g002
Figure 3. Measured porosity and permeability of glutenite samples containing various laumontite contents. (a) porosity variation with laumontite contents, (b) permeability variation with porosity.
Energies 14 01667 g003
Figure 4. Measured (a) elastic modulus and (b) strengths of laumontite-rich glutenite samples.
Energies 14 01667 g004
Figure 5. Measured (a) stress–axial strain curve and (b) volumetric strain curve of type I glutenite samples under confining pressures of 20, 35, 50, 65 and 80 MPa, respectively.
Energies 14 01667 g005
Figure 6. Measured permeability of type I glutenite sample under hydrostatic loading path: (a) volumetric strain and permeability variation with mean effective stress, (b) permeability variation with current porosity.
Energies 14 01667 g006
Figure 7. Measured permeability of type I glutenite sample under 20 MPa confining pressure: (a) volumetric strain and permeability variation with mean effective stress, (b) permeability variation with current porosity.
Energies 14 01667 g007
Figure 8. Measured permeability of type I glutenite sample under 65 MPa confining pressure: (a) volumetric strain and permeability variation with mean effective stress, (b) permeability variation with current porosity.
Energies 14 01667 g008
Figure 9. Proppant conductivity changing under different closure stresses.
Energies 14 01667 g009
Figure 10. Finite element geometry model and mesh scheme.
Energies 14 01667 g010
Figure 11. Tubing pressure data of Well 1.
Energies 14 01667 g011
Figure 12. Oil production variation with production time compared with well testing data.
Energies 14 01667 g012
Figure 13. Simulated (a) pore pressure distribution, (b) mean effective stress distribution, (c) current permeability distribution of different production time (1 day, 5 days and 8 days).
Energies 14 01667 g013
Figure 14. Oil production rate and cumulative oil production variation with production time for induced permeability evolution, coupled and uncoupled.
Energies 14 01667 g014
Figure 15. Oil production rate and cumulative oil production variation with production time for different initial permeability with induced permeability evolution, coupled and uncoupled.
Energies 14 01667 g015
Figure 16. Oil production rate and cumulative oil production variation with production time for fracture conductivity evolution, coupled and uncoupled.
Energies 14 01667 g016
Table 1. Average mineral contents and porosity results of selected samples.
WellDepth (m)TypeAverage Mineralogy Composition (%)Porosity (%)
ClayQuartzFeldsparCalciteLaumontite
Well-14200–4207I3.0732.1513.692.348.7911.00
Well-24160–4172I4.5329.3117.636.3842.1510.36
Well-33958–3965II4.6944.221.96.4522.768.51
Well-44012–4025II3.9949.7128.4110.517.386.55
Table 2. Detailed reservoir parameters in the simulation.
ParametersValueUnitDefinition
H15mReservoir thickness
ϕ0.11-Porosity
k01.12mDInitial permeability
kcb0.1mDPermeability of shear bands
kf030,000mDInitial fracture conductivity
E14GPaElastic modulus
υ0.2-Poisson’s ratio
αb0.8-Biot’s coefficient
Pp72MPaPore pressure
σv118.5MPaVertical stress
σH107.3MPaMinimum horizontal stress
σh83.0MPamaximum horizontal stress
Lf120mFracture length
ρ0.84g/m3Oil density
μo7mPa·sOil viscosity
d20.79MPaCohesive
β41.26°DP angle of friction
a118.3MPaCoefficient of cap model
b100.2MPaCoefficient of cap model
c91.5MPaCoefficient of cap model
Publisher’s Note: MDPI stays neutral with regard to jurisdictional claims in published maps and institutional affiliations.

