1. Introduction
Wind turbines (WTs) enable the conversion of wind energy into electricity. However, the power production of wind energy conversion systems (WECSs) varies in an unscheduled and intermittent manner due to the stochastic nature of wind. The stability and reliability of electricity supply may be enhanced by introducing an energy storage system. There are several available technologies of energy storage that can be used for wind power applications, such as batteries [
1,
2,
3,
4], flywheels [
5,
6], supercapacitors [
7,
8,
9], pumped hydro [
10,
11], compressed air [
5], or hydrogen-based storage systems [
12,
13]. Among these, batteries are most commonly used. The most mature battery technology today is lead–acid technology. Thanks to recent developments, lead–acid batteries now have much longer cycle lives compared to a couple of decades ago, they have the lowest installation cost (several times lower compared to Li-ion batteries), and they are almost completely recycled, as opposed to other available battery technologies, whereas their lower energy density (again several times lower compared to Li-ion batteries) is of no crucial importance for small, stationary systems [
14]. The energy storage systems can be used in WECSs with different objectives in mind, including power fluctuation suppression [
1,
6,
9], peak shaving [
5,
11,
13], voltage control support [
2,
7], spinning reserve [
4,
5,
10], and oscillation damping [
3,
8,
12]. A comprehensive review of the energy storage technologies used in WECSs is provided in [
15].
Maximum power production from a WECS is ensured through operation at a maximum power point (MPP). The algorithms dedicated to achieving this goal are known as maximum power point tracking (MPPT) algorithms. Combined with energy storage systems and MPPT algorithms, WECSs can be considered suitable for standalone operation in locations with no viable connection to the utility grid. A squirrel-cage induction generator (SCIG) represents an attractive solution for such WECSs due to its small size, simple and rugged construction, and lower unit cost compared to a permanent-magnet synchronous generator (PMSG) [
16]. In addition, field-oriented control (FOC) ensures decoupled control of the SCIG operating torque and flux. This is especially convenient in the context of WECS given the fact that these two variables can be utilized for the WT and SCIG optimization, respectively. On the downside, SCIGs require a gearbox and excitation capacitors and have somewhat lower efficiency compared to PMSGs with the same rating.
It is clear that power efficiency plays a key role in terms of cost-effectiveness of small-scale WECSs; thus, many different control strategies have been developed in this regard [
17,
18,
19]. Maximum power of variable-speed WTs can be achieved for any wind speed within the rated operating range by adjusting the WT rotational speed, which makes them attractive for small-power applications. Moreover, most small-scale WTs have a fixed pitch angle; hence, their speed can be adjusted only through generator torque control. Three most common MPPT strategies for WTs are those based on the optimal tip speed ratio (TSR) [
17,
20,
21,
22,
23], those based on the power signal feedback (PSF) [
24,
25], and perturb and observe (P&O) MPPTs [
19,
26,
27,
28]. The MPPTs from the first group require measurement of the wind speed, which increases the system cost and complexity, while reducing its reliability. In addition, the optimal TSR value varies with atmospheric conditions and differs from one WT to another. The WT maximum power curve—required for the PSF-based MPPTs—is obtained through time-consuming and costly aerodynamic tests of individual WTs. In addition, such a curve may differ from the actual curve due to the atmospheric conditions or WT aging. The great advantage of the P&O-based MPPTs is that they do not require wind speed measurement or prior knowledge of the WT parameters. However, their convergence is comparatively slower. Due to the introduced delay, these MPPT algorithms are more suitable for small-scale, lower-inertia WECSs.
The overall WECS output power can be further increased through minimization of the generator losses, which implies adjustment of the generator magnetization. The loss-model-based strategies converge quickly but are inherently sensitive to machine parameter variations, and their accuracy largely relies on the loss model accuracy [
22,
27,
29]. The online-search-based (P&O) strategies, such as those proposed in [
18,
28,
30], rely on direct online measurement or estimation of the generator output power. Hence, their performance depends on the power measurement/estimation accuracy, and they can be computationally demanding.
The quasi-Z-source inverter (qZSI) is a single-stage inverter with boost capability [
31]. The input direct current (DC) voltage is boosted by introducing the additional switching state, known as the shoot through (ST) state. This state is achieved by short-circuiting one or all inverter phase legs during traditional zero states of the utilized pulse width modulation (PWM) scheme, thus leaving the output voltage waveforms unaffected. In addition, if the ST state is not injected, the qZSI operates in the same manner as a standard voltage source inverter (VSI). The qZSI can be used in a WECS in place of a standard VSI, which usually needs to be combined with an additional DC/DC boost converter or a line-frequency transformer in order to achieve the required DC or alternating current (AC) voltage level, respectively. Another significant advantage of the qZSI is simple battery integration, without introducing additional switching components. The batteries are typically connected in parallel with one of the two impedance network capacitors [
32,
33,
34,
35], which allows the input DC voltage to be adjusted independently of the battery voltage. Several papers can be found in which the qZSI application in PMSG-based standalone WECSs was considered [
36,
37,
38], but the only paper to consider the qZSI as part of a SCIG-based WECS was our previous study reported in [
39]. However, the analysis in [
39] was limited to simulations, it did not include the system startup procedure or the operation with no or low wind, and it lacked an extensive steady-state analysis with regard to system parameter variations. Furthermore, the battery discharging current in [
39] had to be limited to half the input current of the qZSI for numerical reasons related to the modeling of the impedance network diode.
This paper presents the first experimental study of the performance of a battery-assisted qZSI in a standalone SCIG-based WECS. This involves both transient and steady-state analysis, including the system startup procedure, low-wind operation, responses to load and wind speed perturbations, and variations of the qZSI input and output voltages. In the considered system, the maximum power is captured from both the WT and the SCIG through application of the fuzzy logic (FL) based P&O MPPT algorithms, with the SCIG being controlled by means of an indirect-rotor-field-oriented control (IRFOC) algorithm [
18]. The input and output voltages of the qZSI are controlled by means of the ST duty ratio and modulation index, respectively [
39], except during low-wind operation, when the output voltage is controlled by means of the ST duty ratio. The proposed control algorithm additionally includes tracking and control of the battery state of charge (SOC). Real-time implementation was achieved by means of the DS1103 and MicroLabBox controller boards (dSpace).
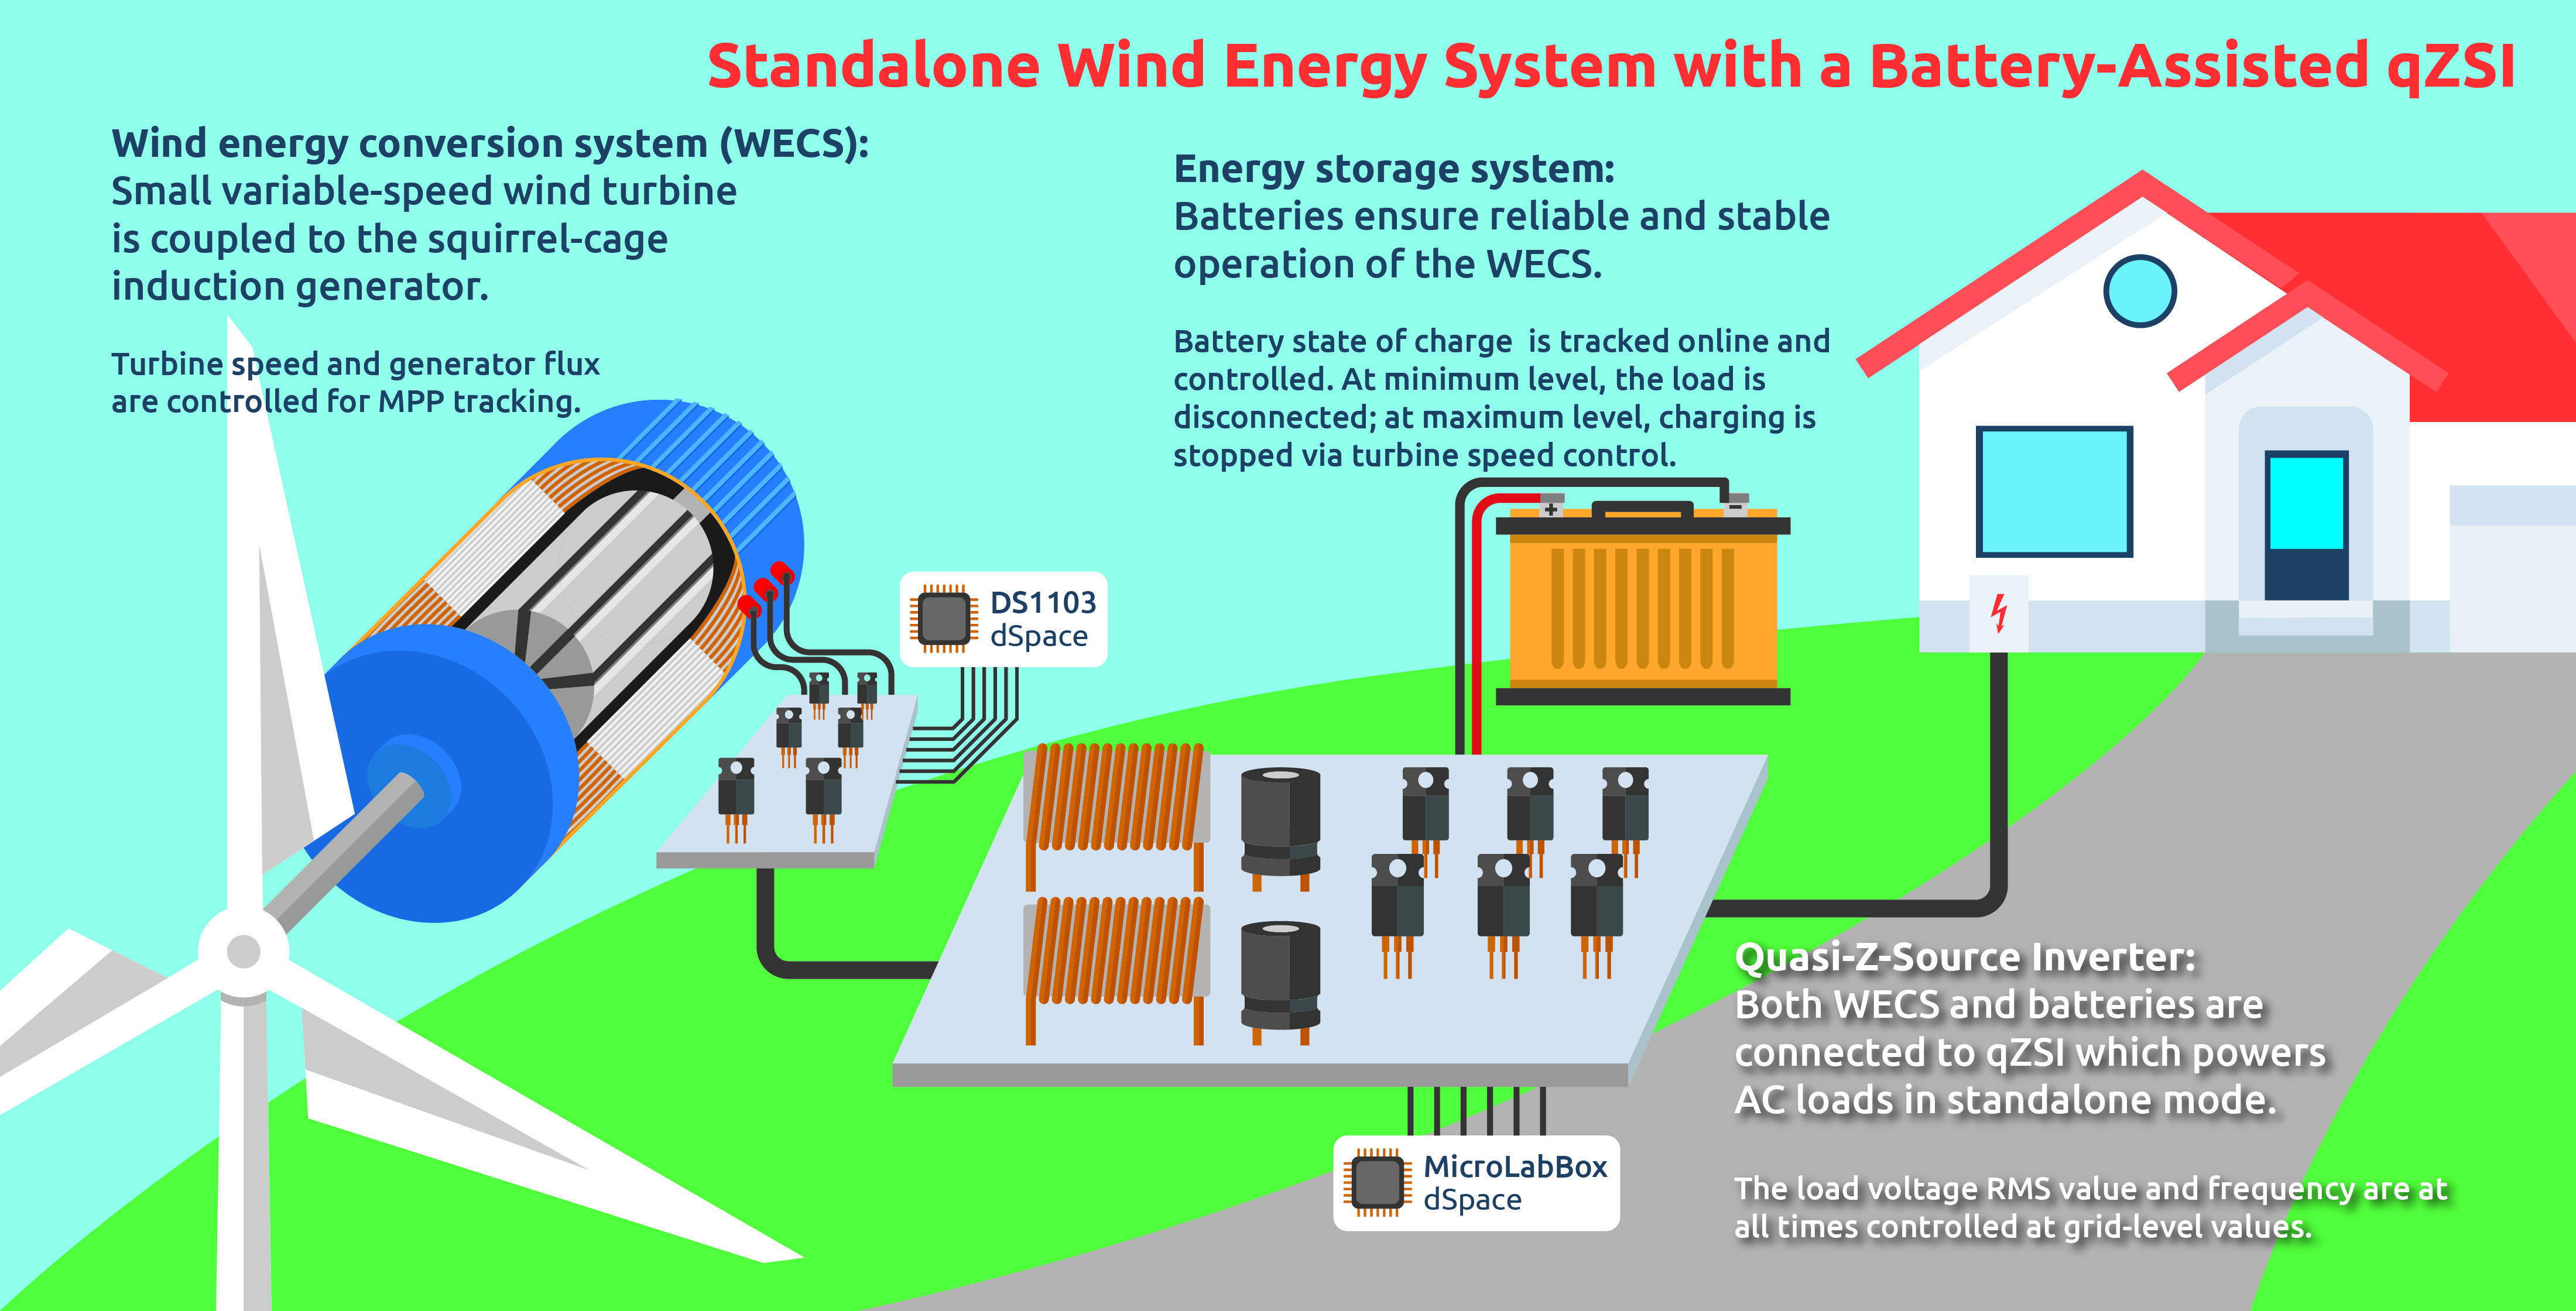
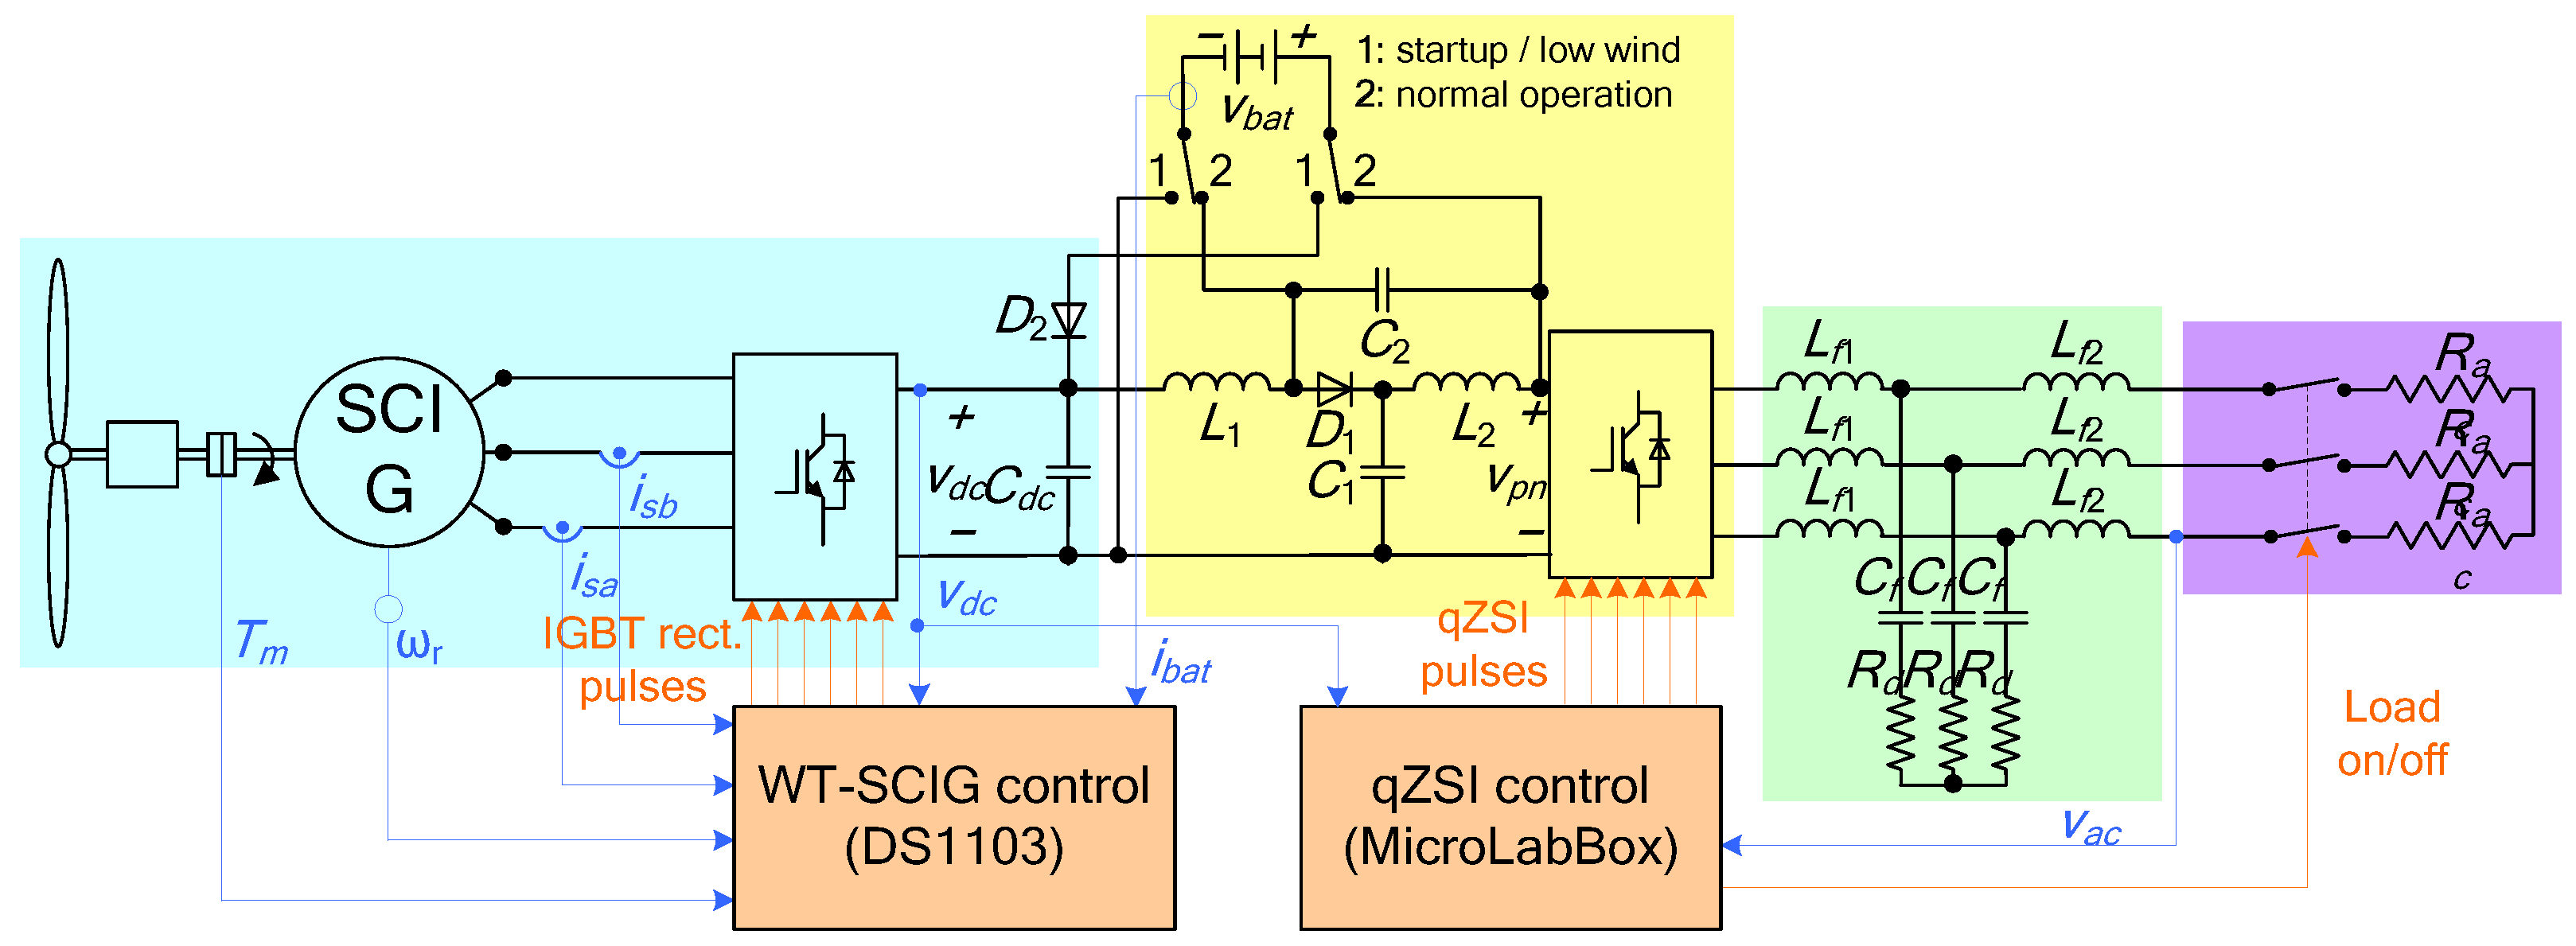
2. Configuration of the Proposed Power Generation System
The configuration of the considered WECS with a battery-assisted qZSI is shown in
Figure 1, whereas the corresponding control scheme is presented in
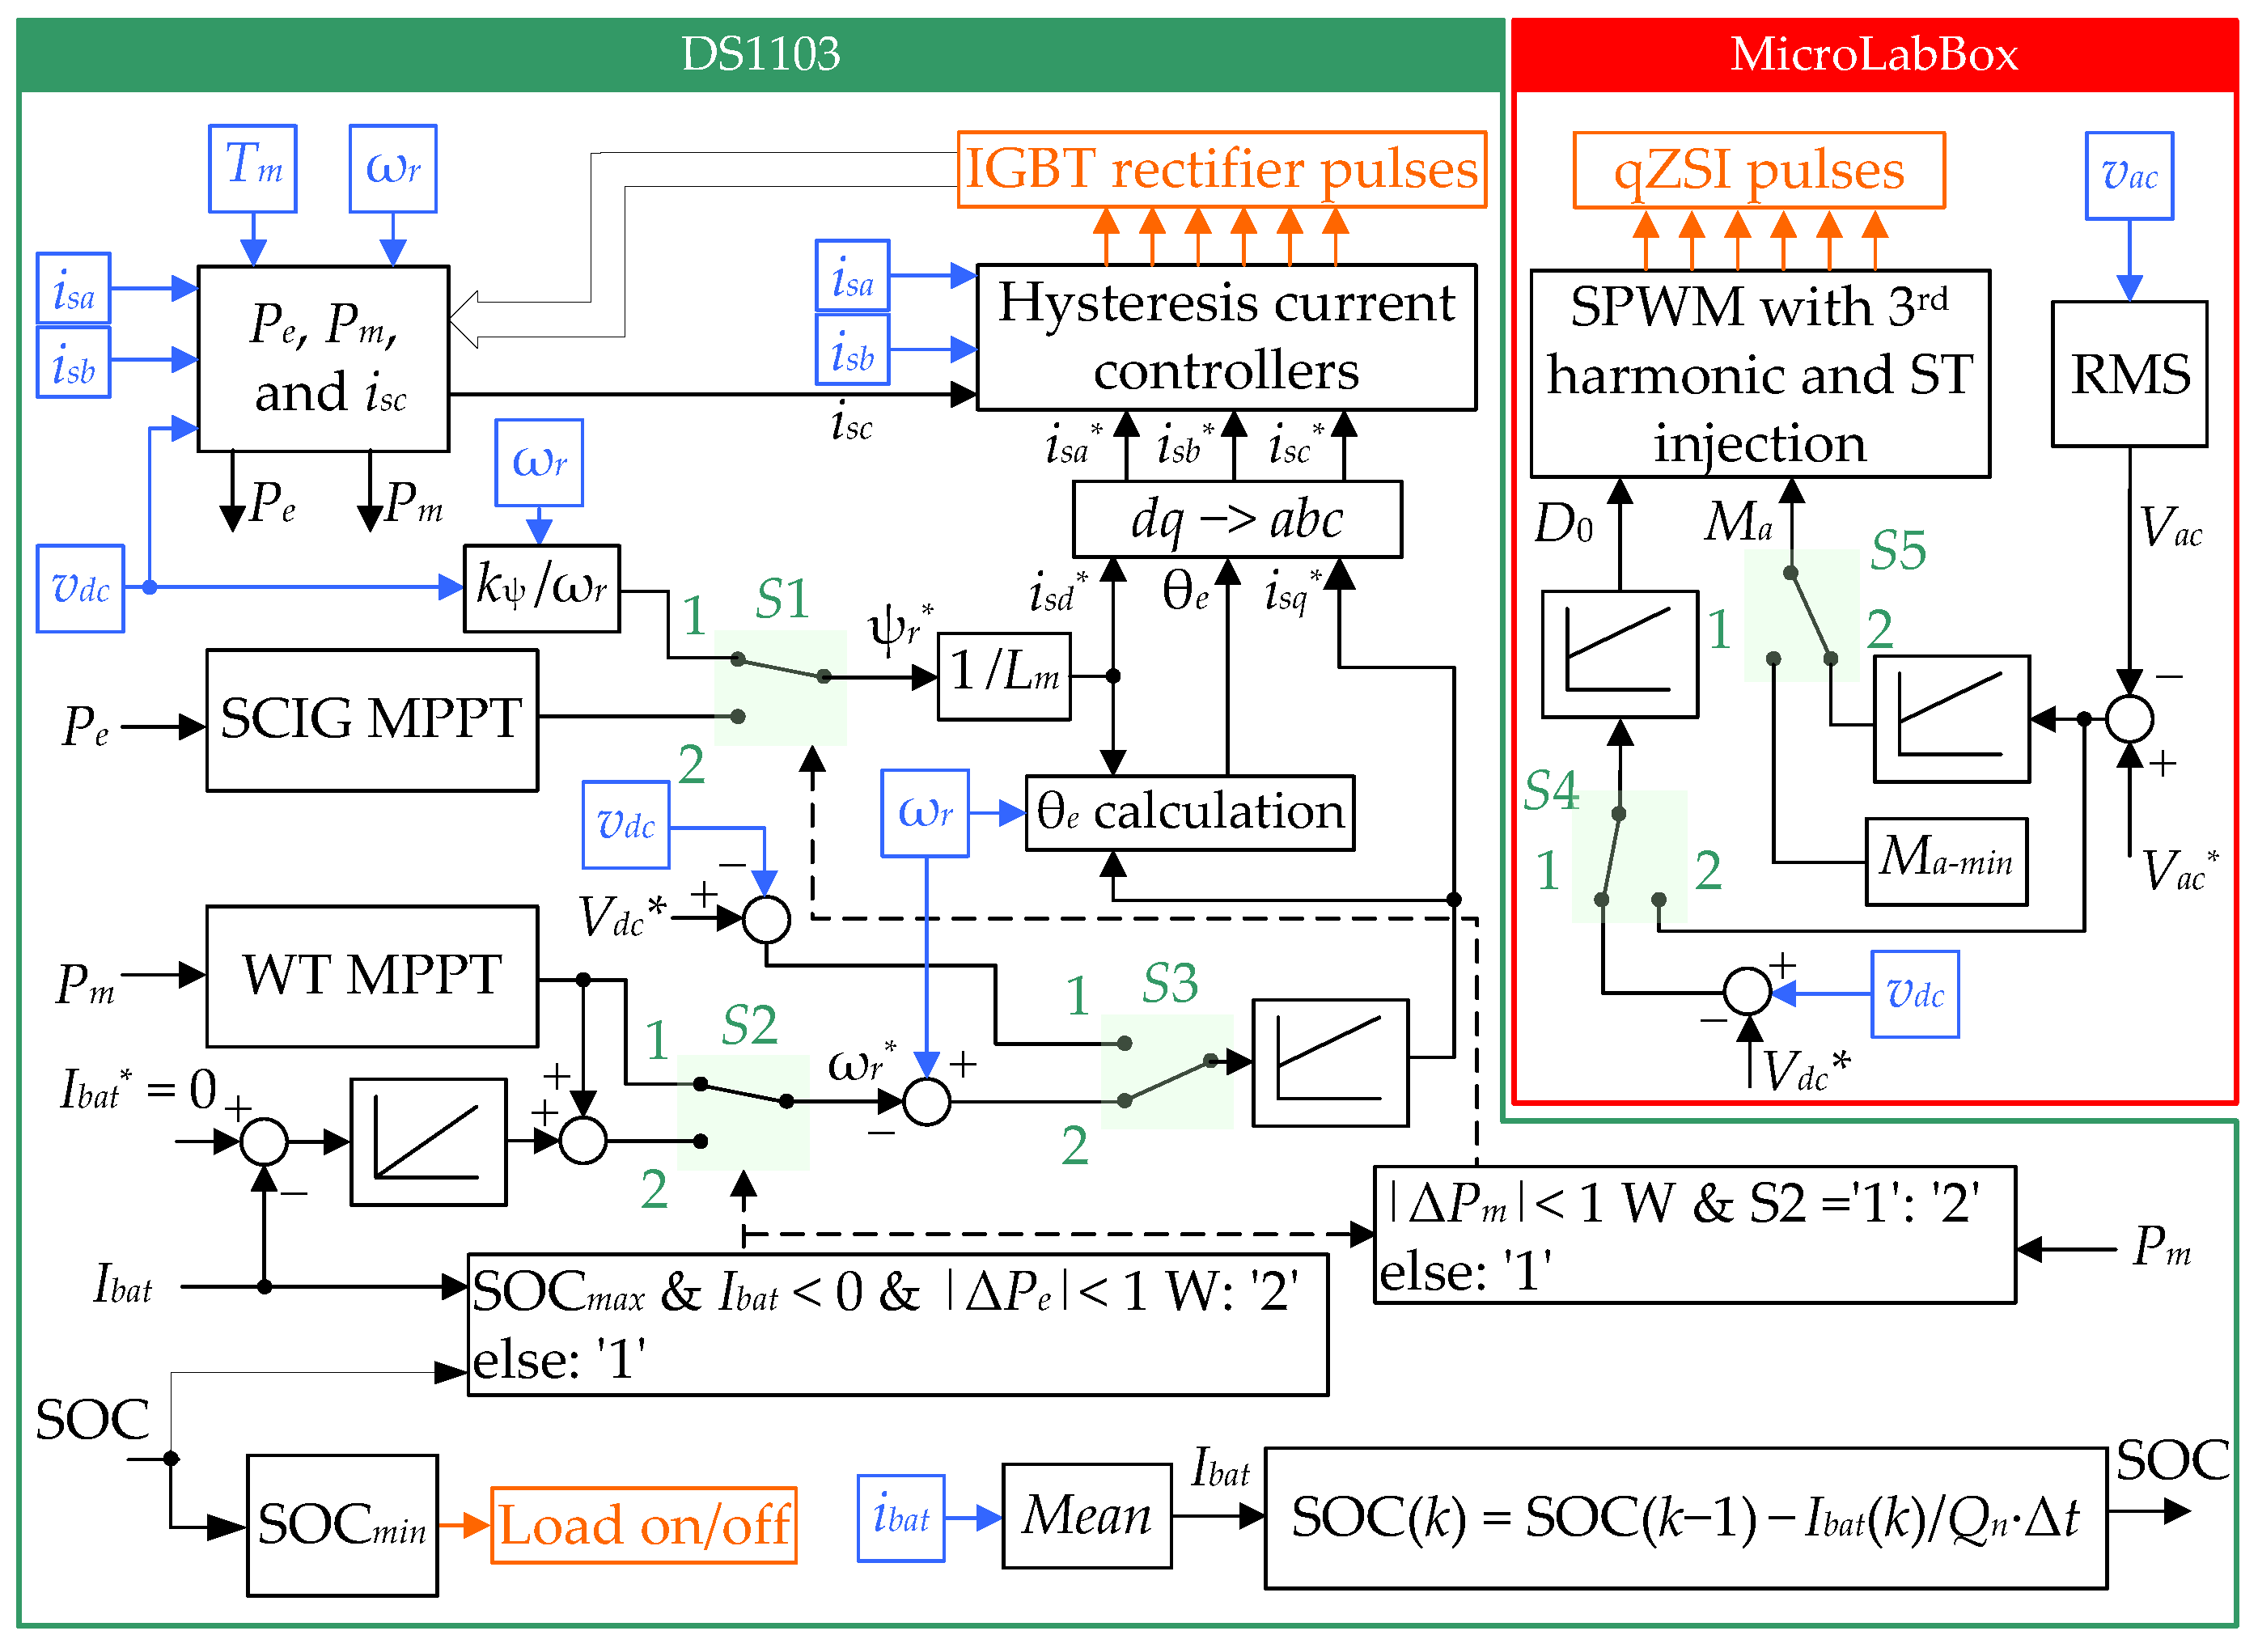
Figure 2. A variable-speed WT is coupled to the SCIG shaft through a step-up gearbox. The SCIG is connected to the DC link via a three-phase insulated-gate bipolar transistor (IGBT) bridge rectifier. The DC link voltage is controlled at a predefined value through adjustment of the qZSI ST duty ratio. A three-phase AC load is supplied via the battery-assisted qZSI and an LCL filter. Sinusoidal pulse-width modulation (SPWM) with injected third harmonic is implemented for the qZSI control. The fundamental root-mean-square (RMS) value of the load phase voltage is controlled at the grid-level value of 230 V through adjustment of the qZSI modulation index.
The modulation index limits were set to
Ma-min = 0.65 (for safety, to restrict the voltage across the qZSI bridge to about 1000 V, that is, to about 1200 V including transient overshoots) and
Ma-max = 1.15 (corresponding to the boundary of the linear operating range). The proposed control scheme requires measurement of the following variables: WT rotor speed (ω
r) and torque (
Tm), two SCIG stator currents (
isa and
isb), battery current (
ibat), DC link voltage (
vdc), and AC load voltage (
vac). The main goal is to ensure reliable and stable electricity supply regardless of the variations in the wind speed or load. The batteries provide compensation for the energy shortage, as well as storage for the excess energy. This allows maximum power extraction from both the WT and the SCIG, which is achieved through application of the respective MPPT algorithms discussed in
Section 2.2 and
Section 2.3. The appropriate control strategy, with regard to the current operating conditions, is implemented by means of the switches
S1–
S5 in
Figure 2, as explained later. The proposed control scheme contains three proportional–integral (PI) controllers and one integral (I) controller, whose gains were optimized by means of the trial-and-error procedure performed as part of the simulation studies reported in [
39].
2.1. SCIG and qZSI Equations
The IRFOC algorithm used for the SCIG control was designed on the basis of the conventional dynamic model of a squirrel-cage induction machine. The corresponding differential equations in the stationary (α–β) reference frame are given below.
where
Rs and
Rr denote the stator and rotor phase resistance, respectively,
vs denotes the stator voltage,
is and
ir denote the stator and rotor current, respectively,
im denotes the magnetizing current,
Lσs and
Lσr denote the stator and rotor leakage inductance, respectively, ψ
s and ψ
r denote the stator and rotor flux linkage, respectively, ω
r denotes the rotor angular speed in electrical rad/s,
Te is the induced electromagnetic torque,
Lm is the main inductance,
Lr = Lm + Lσr is the rotor inductance, and
p is the number of pole pairs.
Given the rotor field orientation of the synchronously rotating (
d–
q) reference frame, the slip angular speed (ω
s) can be calculated from the reference stator currents in
d and
q axis as follows:
whereas the reference frame angle (θ
e) can be obtained by integrating the synchronous angular speed (ω
e), which is, in turn, obtained as
The modulation index and the ST duty ratio of the qZSI can be utilized to achieve the required AC load voltage for any given value of the DC link voltage within the normal operating range of the qZSI. This is evident from the equations provided for the qZSI boost factor (
B) and gain (
G). The boost factor represents the ratio between the peak value of the voltage across the qZSI bridge (
Vpn_peak) and the DC link voltage (
Vdc), and it is given as
where
T0 is the ST state period,
T is the switching period of the inverter, and
D0 is the ST duty ratio.
The qZSI gain is, on the other hand, defined as
where
is the magnitude of the fundamental harmonic of the output phase voltage and
M is the modulation index.
2.2. WT Maximum Power Extraction
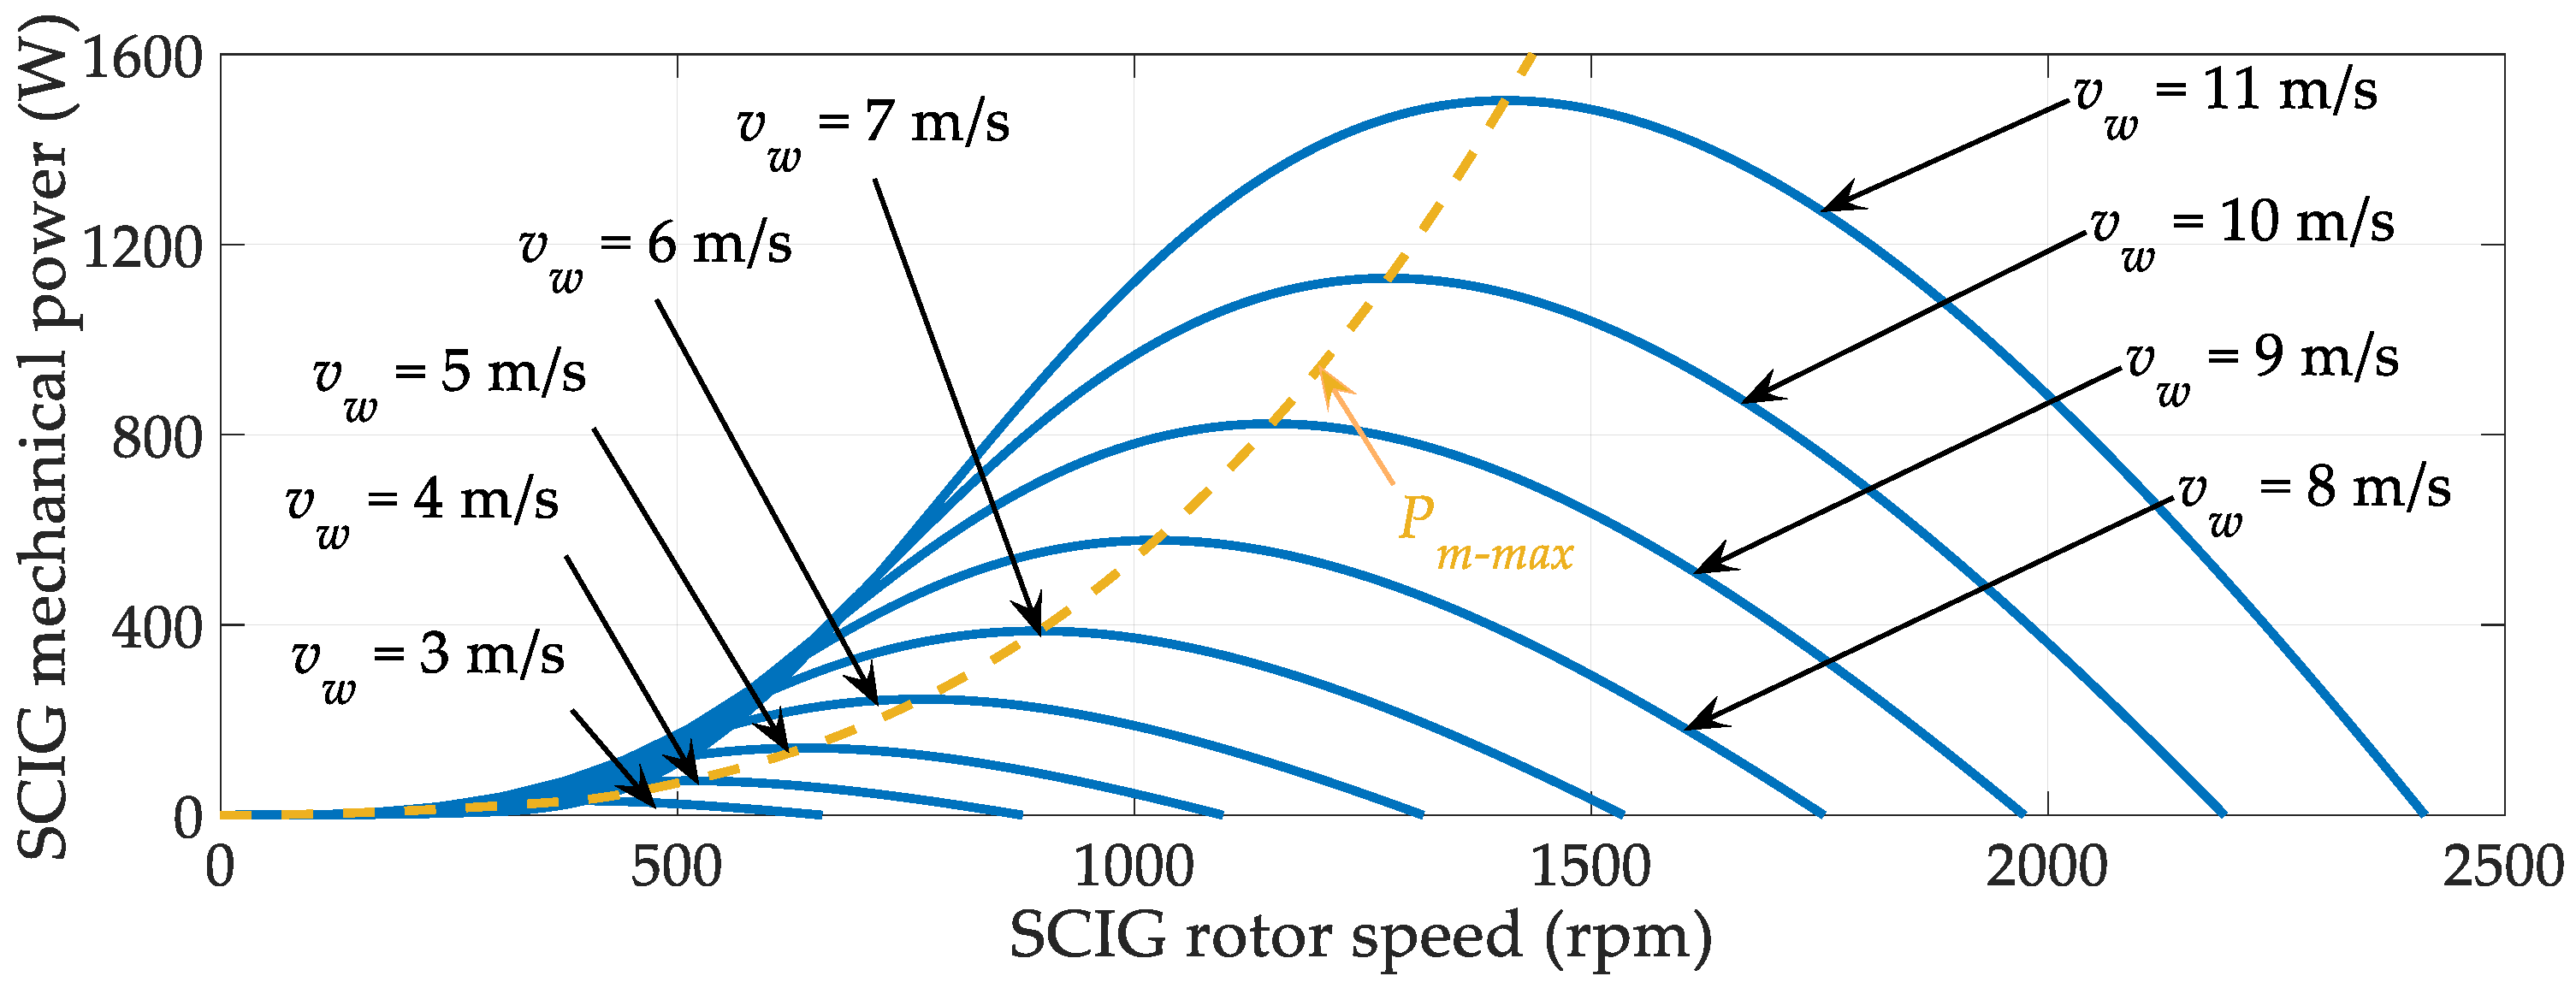
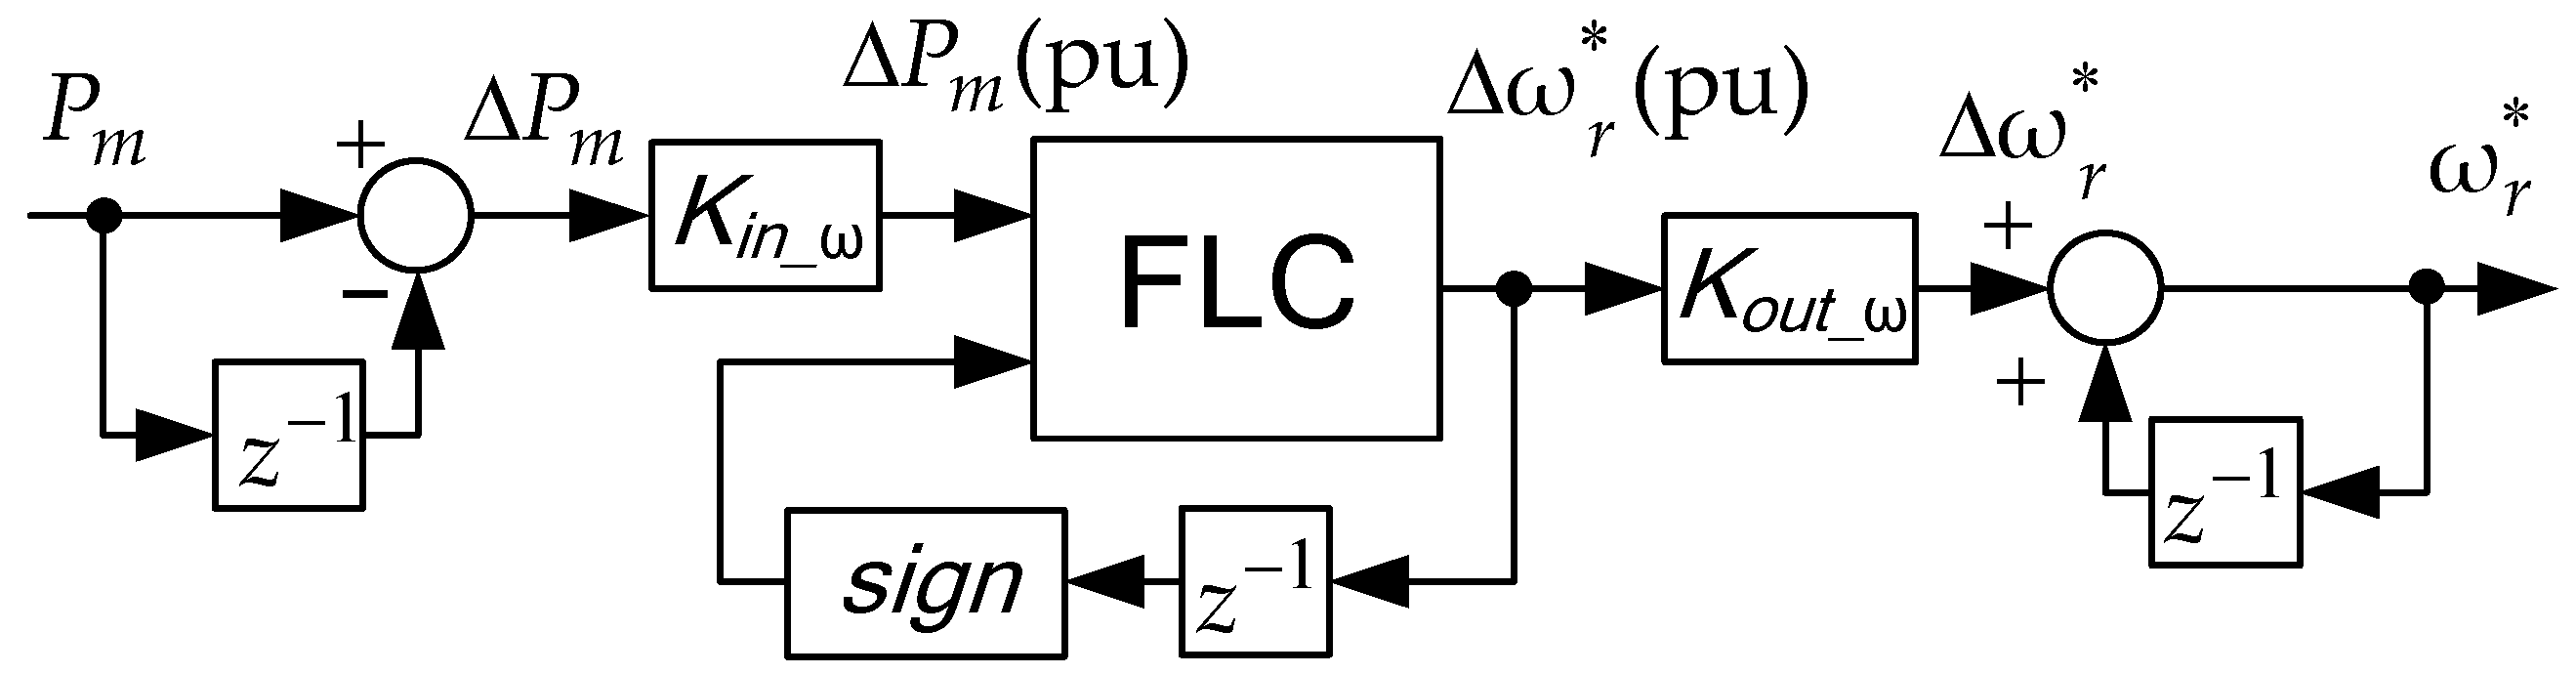
The WT considered in this study is a constant-pitch turbine with a rated power of 1.5 kW and a rated wind speed of 11 m/s. Hence, the respective MPP for a given wind speed can be reached through control of the WT rotational speed (or torque). This is achieved by means of a search-based MPPT algorithm. Since the WT is coupled to the SCIG, the WT speed control translates into SCIG speed control. This is illustrated in
Figure 3, which shows the mechanical power vs. rotor speed characteristics of the WT-driven SCIG, where the dashed line represents the MPPs for different wind speeds. The SCIG is controlled by means of the IRFOC algorithm, which allows for a decoupled control of the electromagnetic torque (i.e., rotor speed) and rotor magnetic flux.
The WT MPPT algorithm utilizes the SCIG mechanical power (
Pm) as the input variable and generates the rotor speed reference (ω
*r) at the output (i.e.,
S2 in
Figure 2 is in position 1). The corresponding block diagram including the FL controller (FLC) is shown in
Figure 4. The reference speed is adjusted by Δω
*r on the basis of the change in the
Pm and Δω
*r sign from the previous step. Due to the relatively large WT inertia, the reference speed is adjusted every 3 s, thus allowing the WT speed to stabilize between successive adjustments in order to correctly interpret the WT power trend.
Once the
Pm change (Δ
Pm) recorded between two successive steps falls within ±1 W, the WT MPPT algorithm is put on hold and the SCIG MPPT algorithm takes over (i.e.,
S1 in
Figure 2 is moved to position 2). The input and output scaling factors,
Kin_ω = 0.014 and
Kout_ω = 20, in
Figure 4 serve to reduce the related variables to the range [−1, 1]. Their values were derived by trial and error from simulation studies.
The rule base for the FLC in
Figure 4 is presented in
Table 1. N, P, and Z stand for negative, positive, and zero, respectively, whereas S, M, and B stand for small, medium, and big, respectively. Note that the total number of rules is 14, which proved to be the minimum number of rules ensuring stable operation and fast convergence of the WT MPPT algorithm.
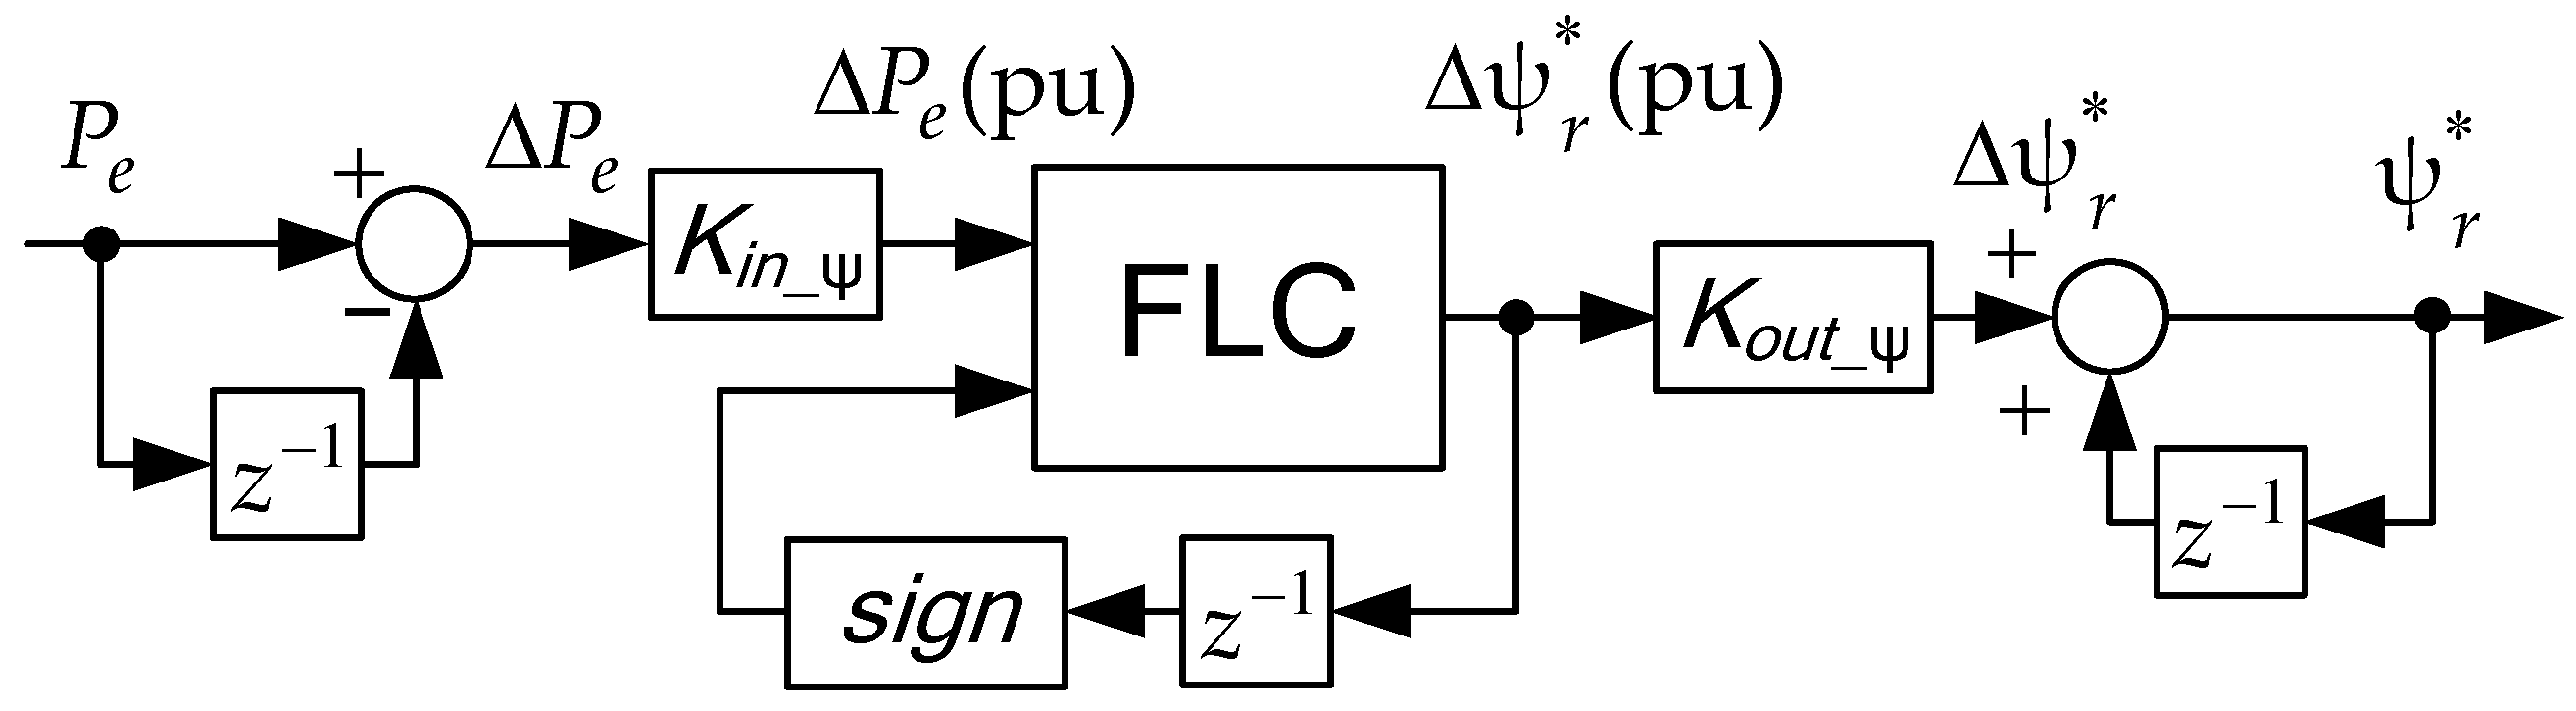
2.3. SCIG Maximum Power Extraction
The SCIG MPPT algorithm utilizes the FL-based structure identical to that shown in
Figure 4, except, in this case, the SCIG electrical power (
Pe) is used as the input variable, whereas the rotor flux reference (ψ
*r) is generated at the output (
Figure 5). The fact that the SCIG internal losses can be minimized through appropriate adjustment of its operating flux forms the basis of this algorithm. The rotor flux reference is adjusted every 2 s to account for the SCIG internal dynamics. When the
Pe change recorded between two successive steps falls within ±1 W, the battery SOC control is allowed to take over if necessary, that is, if the battery SOC is at the minimum or maximum allowed level. Any abrupt change in the wind speed leads to an abrupt change in the mechanical power. Hence, in cases where Δ
Pm > 50 W, the SCIG optimization is aborted and the WT MPPT algorithm is reinitiated. The values of the scaling factors in
Figure 5 (
Kin_ψ = 4.2/ω
r and
Kout_ψ = 1) were derived from the simulation studies in a manner similar to those in
Figure 4.
Note that the rule base of the FLC in
Figure 5 is identical to that presented in
Table 1. The reader is referred to [
18] for the FLC membership functions and other details about the design and implementation of the MPPT algorithms.
2.4. Battery SOC Control
In normal circumstances, the batteries can store excess energy or compensate for the energy shortage. However, if the batteries are fully charged, then they cannot store any more energy and, similarly, they cannot compensate for the energy shortage if they are fully depleted. A comprehensive control algorithm should, hence, take into account the SOC of the batteries. Note that the minimum and maximum SOC values that are allowed under the considered battery control strategy do not necessarily represent the physical battery limits, but may involve certain safety margins, thus allowing charging and discharging beyond the prescribed limits for a limited amount of time.
The battery SOC value can be tracked and estimated online by integrating the measured battery current over time—a method known as the Coulomb counting or ampere-hour integral method [
40]. Factors such as the temperature, battery history, and cycle life affect the accuracy of this method. Nevertheless, it is rather simple to implement and can provide satisfactory performance in applications where there are no strict requirements regarding the SOC assessment accuracy.
In this study, the SOC values of 35% and 100% are set as the minimum and maximum allowed values, respectively. If the minimum SOC value is recognized during operation, the following simple control strategy is applied: the load is automatically disconnected by means of a relay in order to enable charging of the batteries with all the available power. The load remains disconnected until the SOC is increased by at least 5%. On the other hand, if the maximum SOC value is reached and there is a surplus energy available from the WT SCIG (i.e., the battery current is negative), the battery current control is initiated (i.e.,
S2 in
Figure 2 is moved to position 2). The basic operating principle of this algorithm, shown in
Figure 2, can be summarized as follows: the WT rotor speed is gradually increased every 2 s so as to reduce the WT power and, hence, the battery charging current; the input variable of the respective I controller is the difference between the zero reference value and the actual battery current, whereas the output variable is the WT speed correction; this value is added to the reference value generated by the WT MPPT algorithm. The battery current control is aborted in the case of an abrupt change in the wind speed.
2.5. System Startup and Low-Wind Operation
In the considered system,
vw = 6 m/s is the minimum wind speed at which it is considered justified to start the WT SCIG power generation. At lower wind speeds than this, the generated power may be too low to cover the system losses, even in no-load conditions; thus, the batteries would discharge. A soon as the required minimum wind speed is reached, the WT SCIG power generation is initiated by activating the IRFOC algorithm and turning on the switching pulses for the IGBT bridge rectifier. However, prior to this, the batteries need to be connected to the DC link (i.e., position 1 of the switch in
Figure 1) in order to provide the initial voltage across the DC link capacitor, which is, in turn, required for the initial magnetization of the SCIG. During the SCIG magnetization process, the reference
q-axis stator current of the SCIG is generated at the output of the DC voltage PI controller (i.e.,
S3 in
Figure 2 is in position 1). The reference DC voltage is gradually increased to 300 V (note that
Vbat ≈ 250 V; thus, the diode
D2 is inserted between the batteries and the DC link to prevent battery charging in this configuration), thus allowing the batteries to be switched back in parallel with the upper capacitor in the qZSI impedance network (i.e., position 2 of the switch in
Figure 1). The WT optimization is then initiated with the
q-axis stator current now assigned to the WT speed control loop (i.e.,
S3 in
Figure 2 is in now position 2). The increase in WT power leads to an increase in DC link voltage, with
Cdc being charged. The switching pulses for the qZSI are turned on, with fixed initial values of
Ma and
D0, as soon as the DC link voltage reaches the preassigned value of 350 V to avoid possible demagnetization of the SCIG due to a too low DC link voltage. The WT optimization is followed by the activation of the SCIG loss optimization. In the final stage, the DC link and AC load voltage control loops are activated, with the reference values set equal to the respective actual values recorded in the previous time step in order to avoid undesirable transients. Lastly, the load voltage RMS value is gradually increased to 230 V, whereas the DC link voltage is increased to the target value of 400 V.
In low-wind operating conditions, when the WT SCIG power generation would be insufficient to cover the no-load system losses, continuous operation may be ensured by switching the batteries to the DC link, as during the startup (i.e., position 1 of the switch in
Figure 1). Since the switching pulses for the IGBT rectifier are, in this case, turned off, the batteries represent the only power source. The modulation index is fixed at the minimum value of 0.65 so as to allow the maximum achievable boost with regard to the relatively low value of
Vbat =
Vdc ≈ 250 V, whereas the AC voltage RMS value is controlled at 230 V by means of the ST duty ratio (i.e.,
S4 and
S5 in
Figure 2 are moved to positions 2 and 1, respectively). The system is allowed to operate in this regime as long as the battery SOC is not close to the minimum allowed level. A soon as the wind speed surpasses 6 m/s, the WT SCIG power generation may be initiated to allow for battery charging. The transition from low-wind operation to battery charging can be easily accomplished since the placement of the batteries in the qZSI impedance network during the low-wind operation corresponds to that required for the previously discussed system startup, which ultimately results in battery charging; only the qZSI pulses would have to be temporarily turned off, the load disconnected, and
Ma and
D0 set to fixed values to comply with the initial conditions of the system startup.
4. Results and Discussion
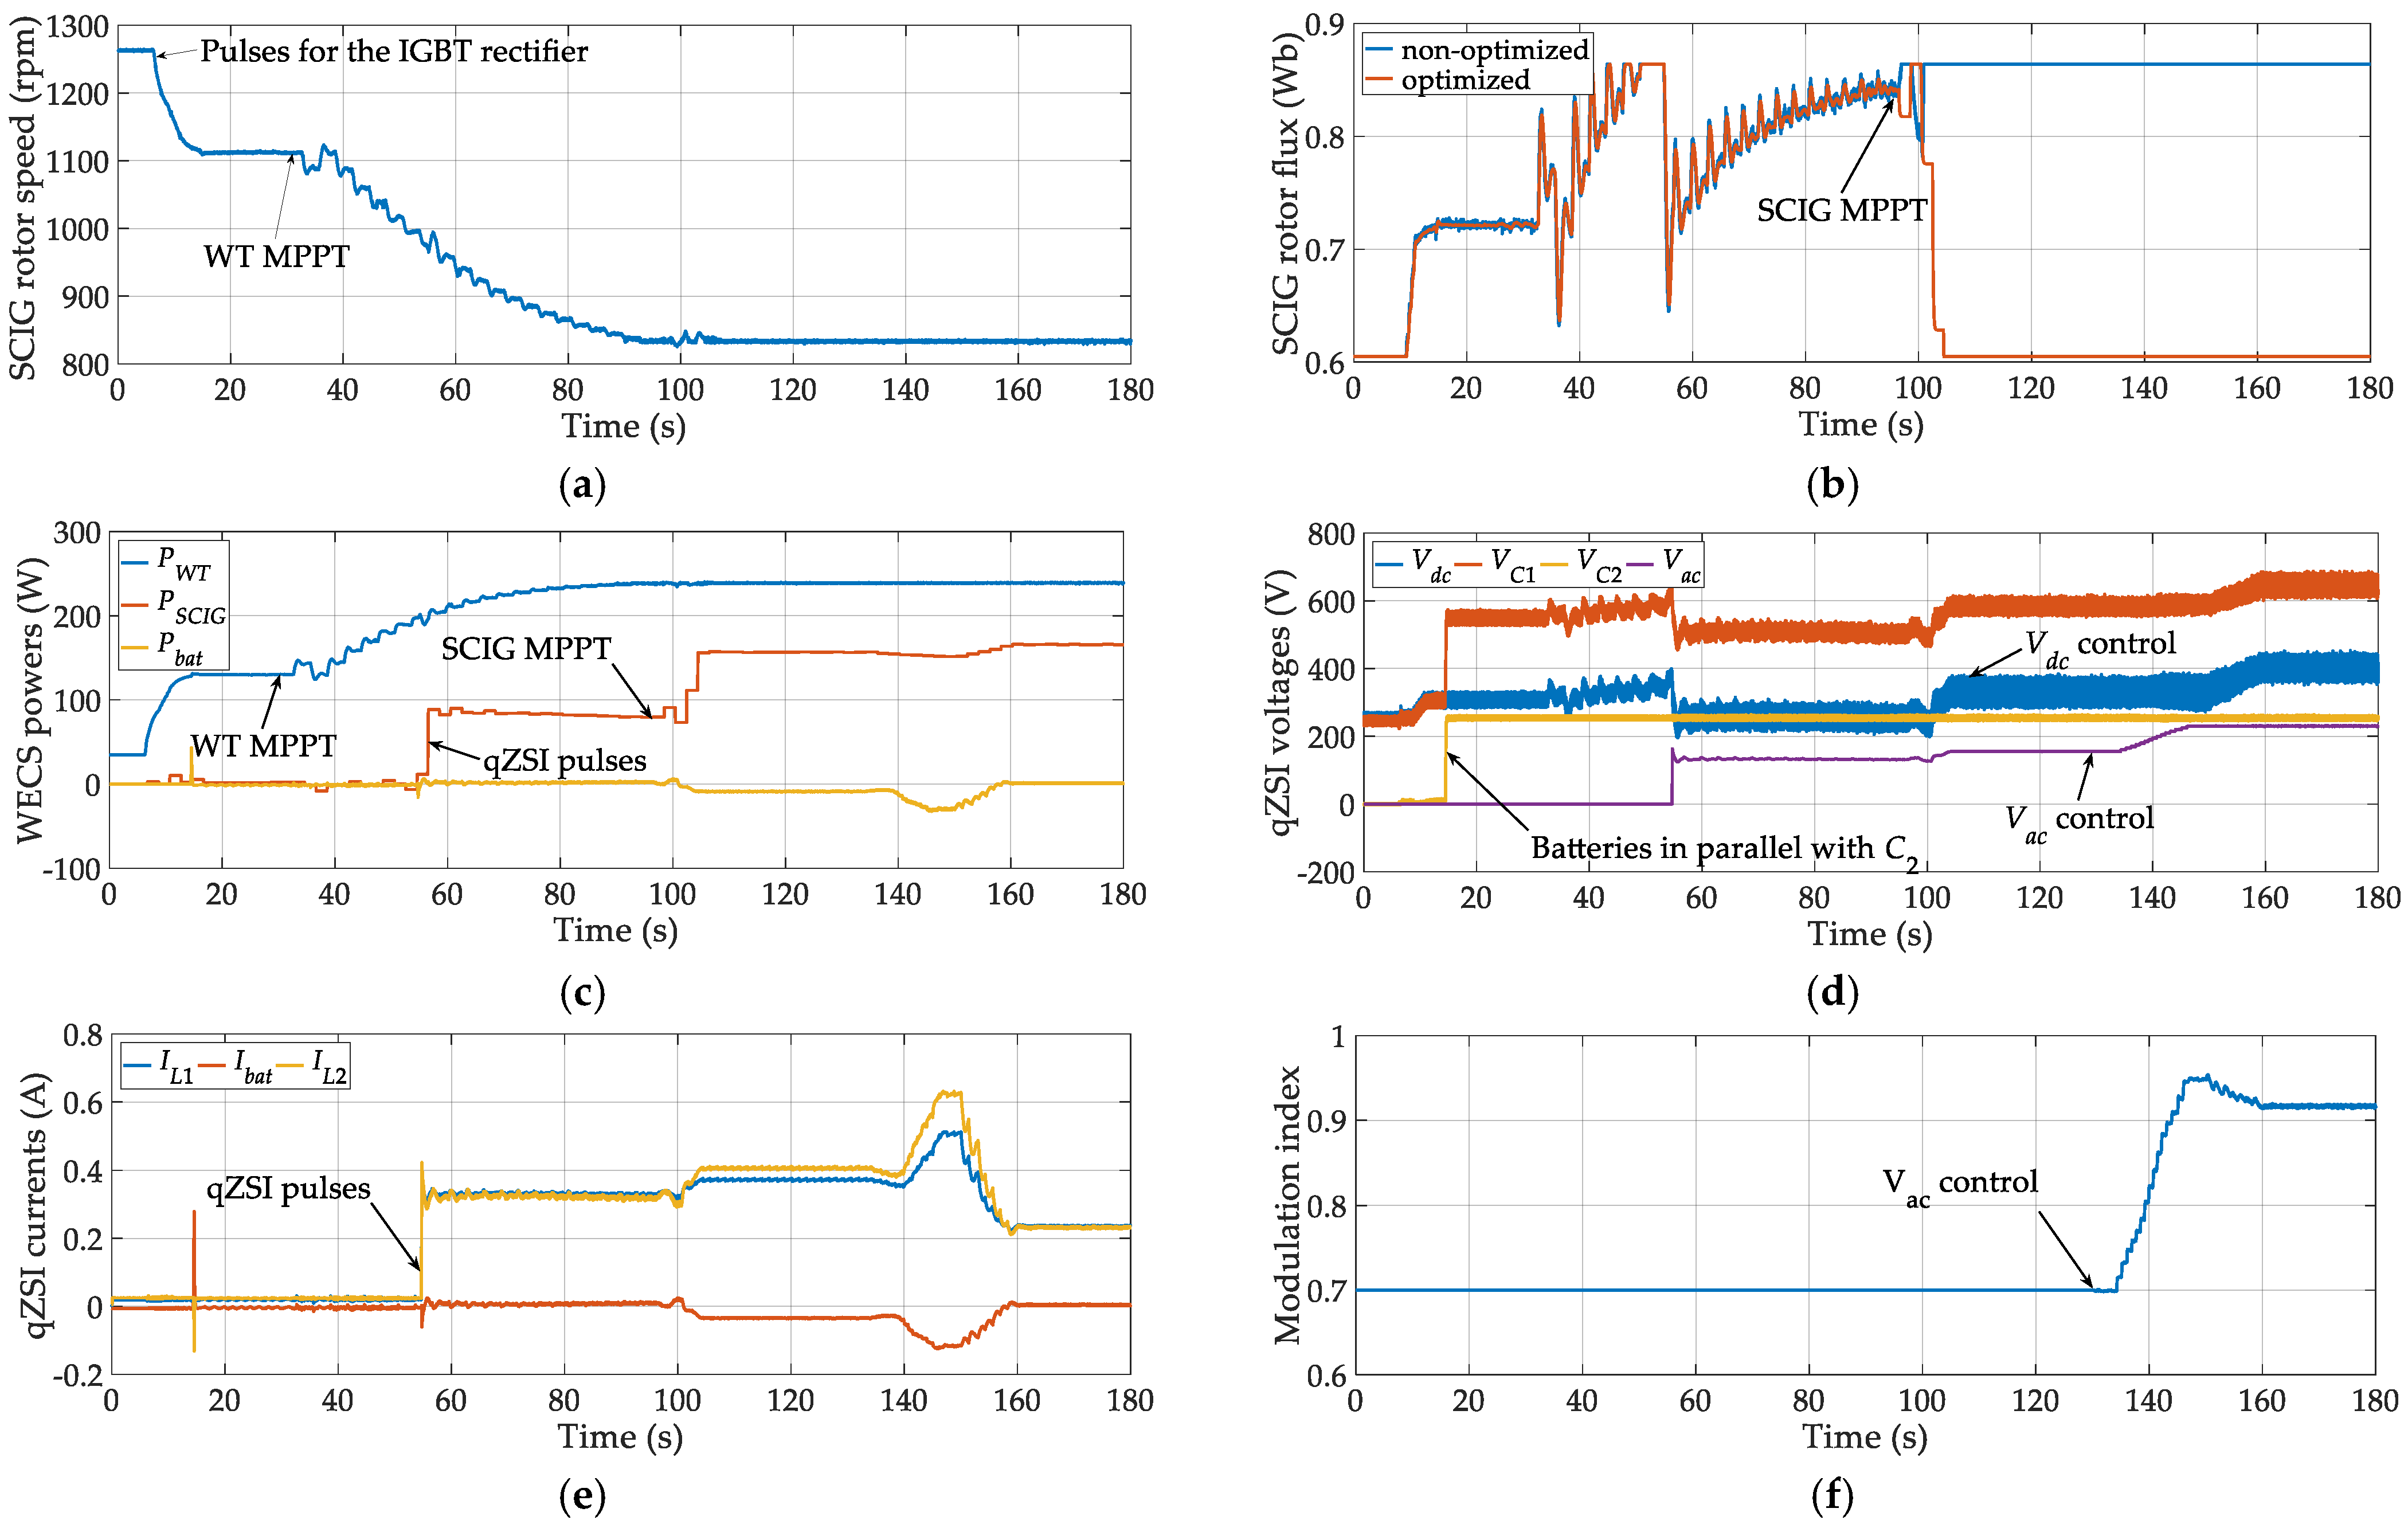
4.1. System Startup Performance Analysis
The main system variables recorded during the startup of the WT SCIG power generation are shown in
Figure 7. The WT-driven SCIG rotated at the no-load speed of
n ≈ 1265 rpm (measured by the encoder), which can be related to the wind speed of 6 m/s according to the WT characteristics from
Figure 3. At first, the switching pulses for both the IGBT bridge rectifier and the qZSI were turned off, whereas the batteries were connected to the DC link, as previously discussed. In this configuration, the following holds:
Vdc =
VC1 =
Vbat ≈ 250 V. Then, at
t ≈ 5 s, the IRFOC algorithm was activated in the DC voltage control mode, with the voltage reference value set to 250 V, followed by the activation of the IGBT rectifier switching pulses. The increase in WT torque caused the WT speed to decrease; hence, the SCIG speed also dropped to
n ≈ 1110 rpm.
The reference voltage was then gradually increased to 300 V, whereas the batteries were switched back in parallel with the capacitor C2 at t ≈ 15 s, resulting in VC1 ≈ Vdc + Vbat ≈ 550 V. Once the steady state with Vdc = 300 V was achieved at t ≈ 30 s, the WT optimization was initiated. Due to the WT power increase, the DC link voltage increased and reached 350 V at t ≈ 55 s; therefore, the switching pulses for the qZSI were turned on with Ma and D0 fixed to 0.7 and 0.15, respectively. Due to the now increased system losses, the DC link voltage dropped to Vdc ≈ 250 V. At the end of the WT optimization (i.e., at t ≈ 95 s), about 240 W was available at the WT output, but only about 80 W was available at the SCIG output. However, upon completion of the SCIG optimization at t ≈ 105 s, the corresponding output power was almost doubled and amounted to about 155 W. In the final stage, the DC link and AC load voltage control loops were activated at t ≈ 115 s and t ≈ 130 s, respectively. Prior to activation of the DC link voltage control, the corresponding reference value was set equal to the actual DC link voltage recorded in the previous time step Vdc ≈ 330 V. Similarly, the AC load voltage control was activated after setting the corresponding reference value equal to the actual RMS value recorded at the previous time step Vac ≈ 155 V. Then, the load voltage RMS value was increased to 230 V and, lastly, the DC link voltage was increased to 400 V. At the end of the system startup procedure, the WT power amounted to about 240 W, whereas the SCIG output power amounted to about 165 W. As it can be seen, this was barely sufficient to cover the system losses, with the batteries being on the verge of discharging (i.e., Ibat ≈ 0 A and Pbat ≈ 0 W). From this, it follows that the wind speed should be higher than 6 m/s to apply any kind of load.
4.2. Steady-State Performance Analysis
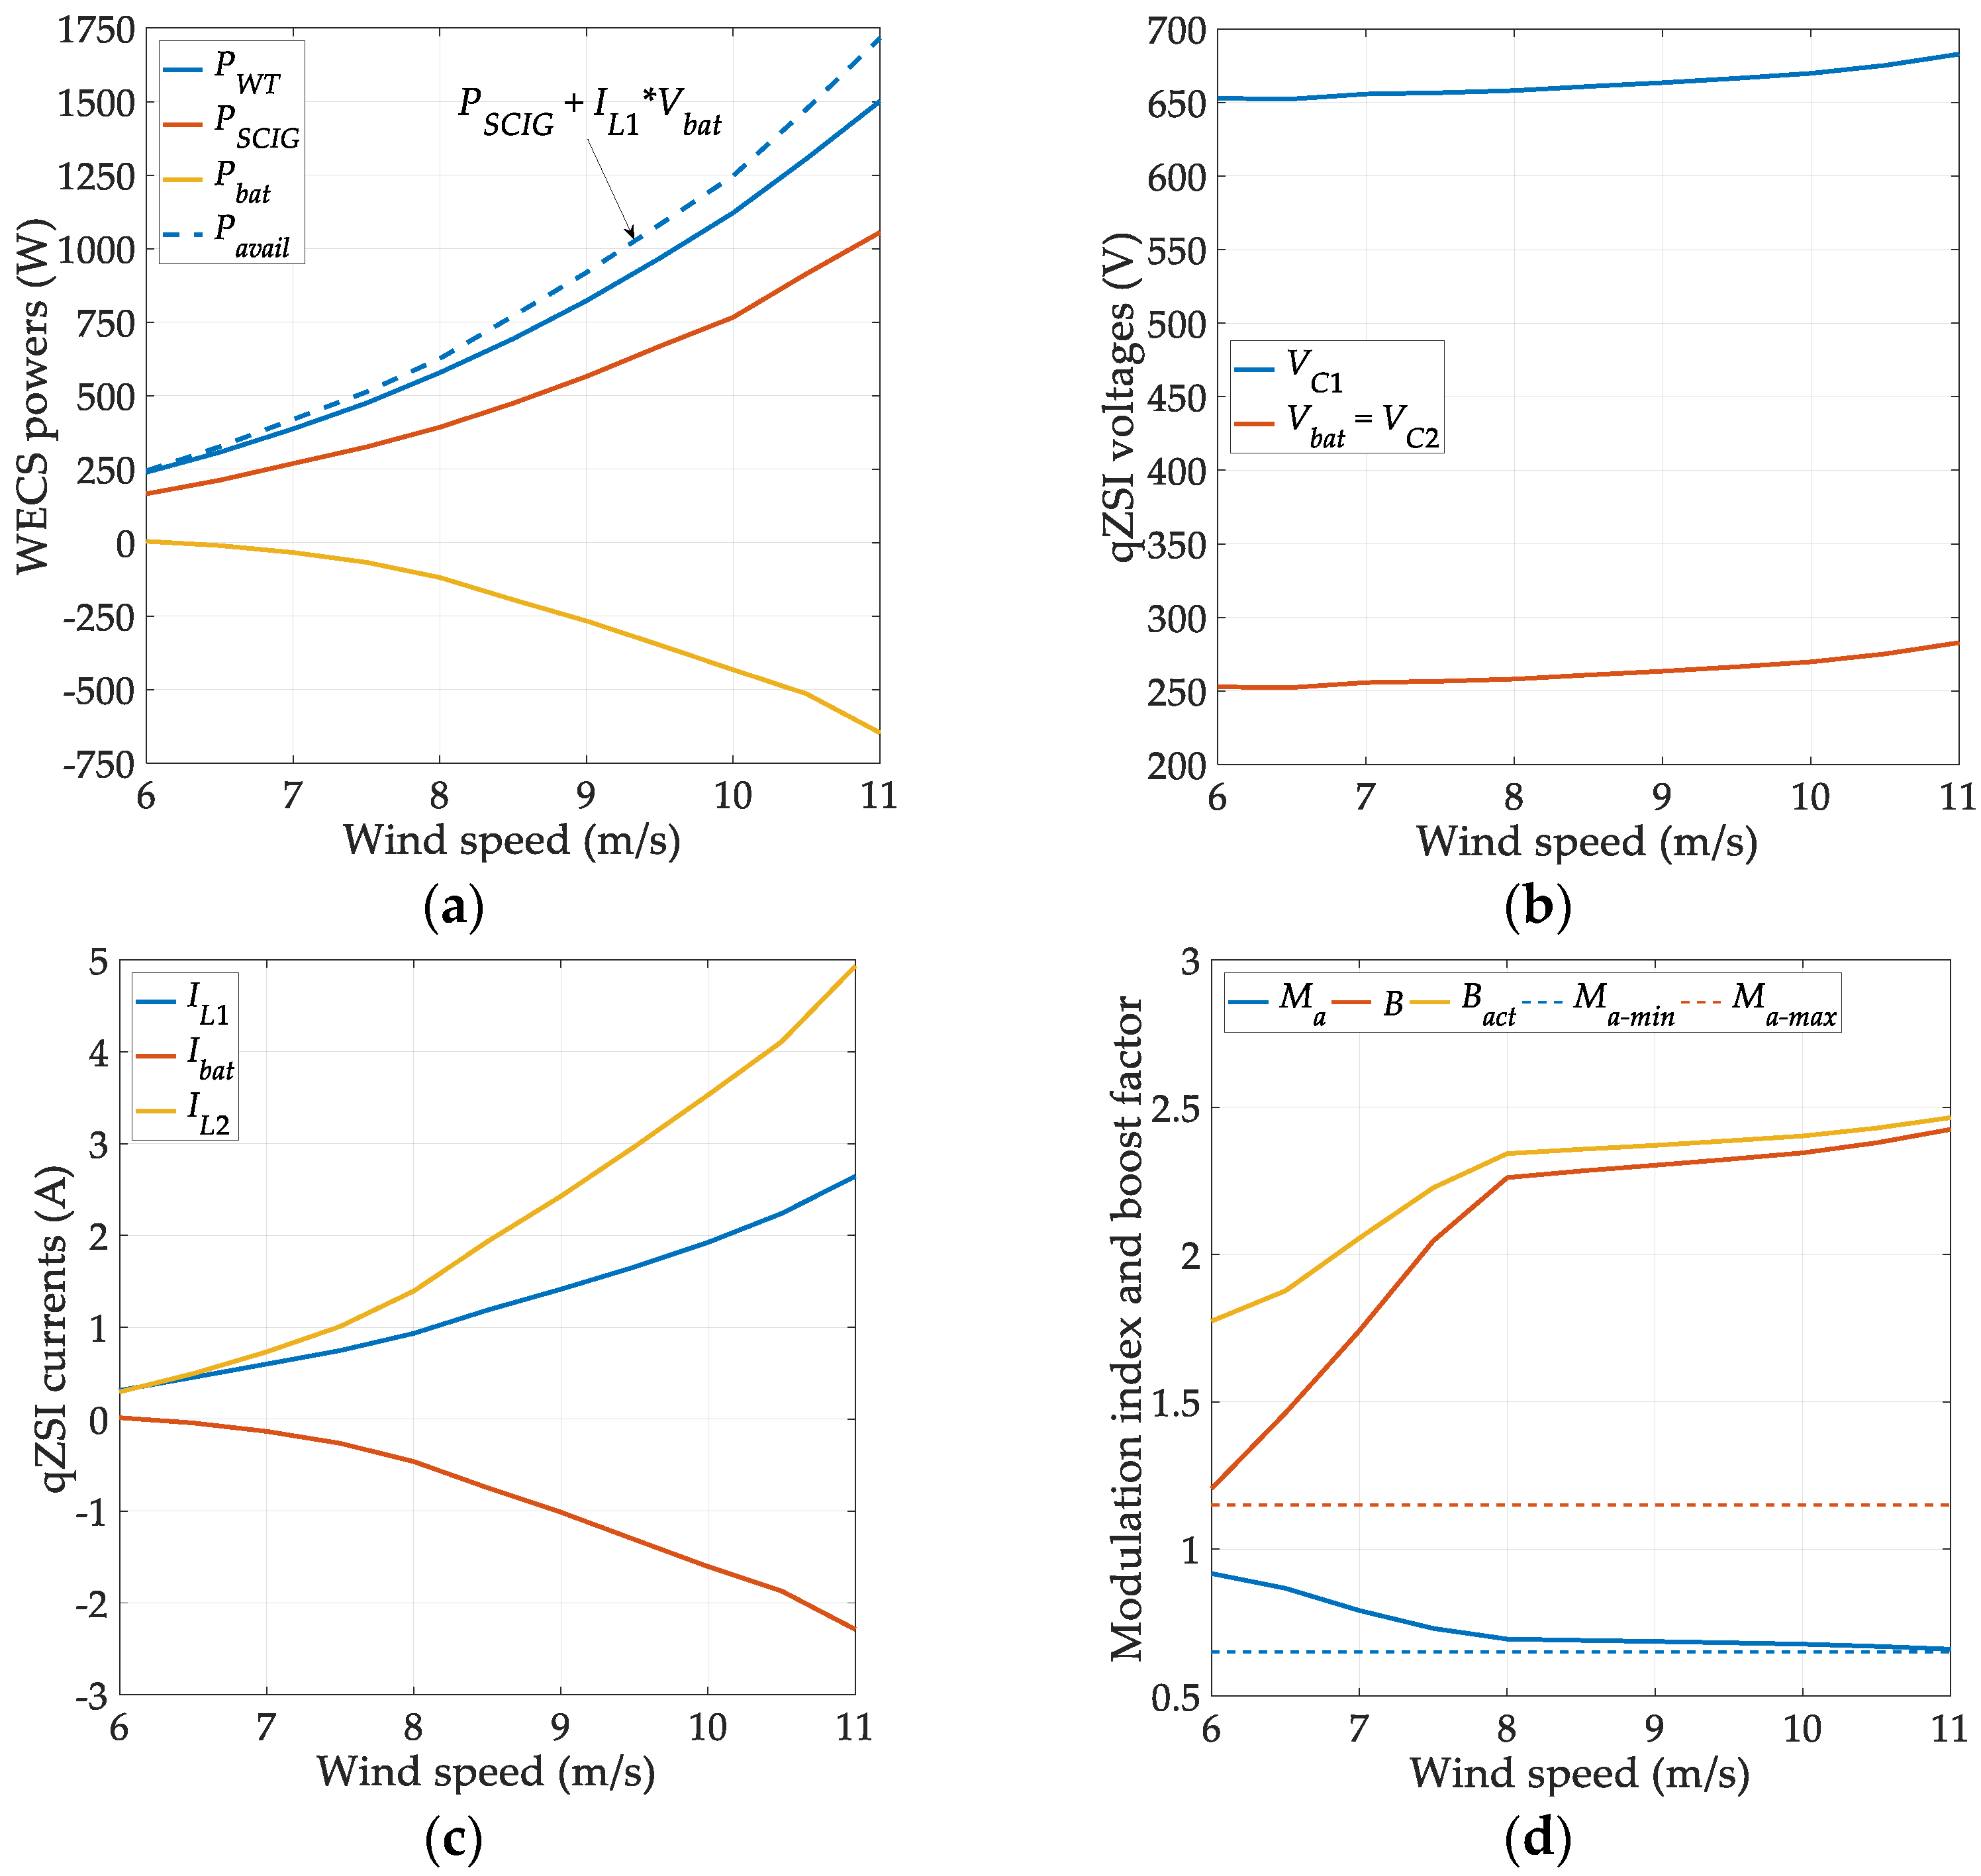
In this section, the steady-state performance of the considered WECS is analyzed. The selected system variables were recorded in no-load conditions, and the corresponding steady-state characteristics were plotted with respect to the wind speed, DC link voltage, and AC load voltage, as shown in
Figure 8,
Figure 9 and
Figure 10.
4.2.1. Wind Speed Range
The characteristics in
Figure 8 were obtained with
Vdc and
Vac set to 400 V and 230 V, respectively. The covered wind speed range was from 6 m/s up to the rated speed of 11 m/s. It is clear that, if the wind speed dropped below 6 m/s, the batteries would start discharging (i.e.,
Ibat in
Figure 8c would become positive), due to the low power available from the WT SCIG and high share of losses. The WT power notably increased with the wind speed, as did the SCIG power and the battery charging power. The battery voltage increased due to the battery charging, as did the voltage across
C1. Therefore, the peak voltage across the qZSI bridge also increased with the wind speed (
Vpn_peak ≈
VC1 +
Vbat during non-ST states), resulting in a decrease in the modulation index (
Ma ≈
Ma-min = 0.65 at
vw = 11 m/s). The dashed line in
Figure 8a represents the total power that is potentially available at the qZSI output. This power was obtained by adding the maximum battery discharging power (
Pbat-max =
IL1 ×
Vbat) to the SCIG power.
Note that the battery discharging current is inherently limited by
IL1 because, if the battery current would surpass this value, the mean value of the current through the inductor
L2 would have to be negative, which cannot occur due to the blocking of the diode
D1. In addition, the actual value of
Pbat-max depends on the
Vbat value, which, in turn, varies with the battery SOC level (in
Figure 8a, it was assumed as
Vbat = 250 V). Lastly, the maximum available qZSI power depends on the power losses occurring between the SCIG and the load, which were neglected in
Pavail in
Figure 8a.
In the considered WECS, the DC link voltage is controlled at a constant value; thus, the qZSI input power is proportional to the mean value of the qZSI input current (
IL1). In the low-wind-speed region, the qZSI input power amounts to only a few hundred watts; hence,
IL1 is rather low as well. In such conditions, the non-ST states are bound to last longer than the inductor discharging time, especially for low inductance or switching frequency values, causing the impedance network diode (
D1 in
Figure 2) to block the current [
42]. During these abnormal non-ST states, the voltage across
L2 is positive rather than being negative; therefore, the voltage across the qZSI bridge,
vpn =
vC1 −
vL2, is somewhat lower compared to the normal non-ST states. To compensate for this, the modulation index increases significantly in the
D1-blocking region (i.e., in the region
vw < 8 m/s). Moreover, the blocking of
D1 results in an additional, unplanned voltage boost, which can be identified in
Figure 8d as a difference between the boost factor (
B) achieved through ST injection, calculated from Equation (9), and the actual boost factor (
Bact), calculated from Equation (10) as a function of the known values of
M,
Vac, and
Vdc. As it can be seen, the difference between the two is particularly pronounced in the region
vw < 8 m/s, where the blocking of
D1 occurs regularly. Note that there is also a slight difference between
B and
Bact in the region
vw > 8 m/s, but this has more to do with voltage drops and parasitic losses of the real circuit components, which are neglected in Equation (10). However, a more detailed analysis of the diode-blocking phenomenon is beyond the scope of this paper.
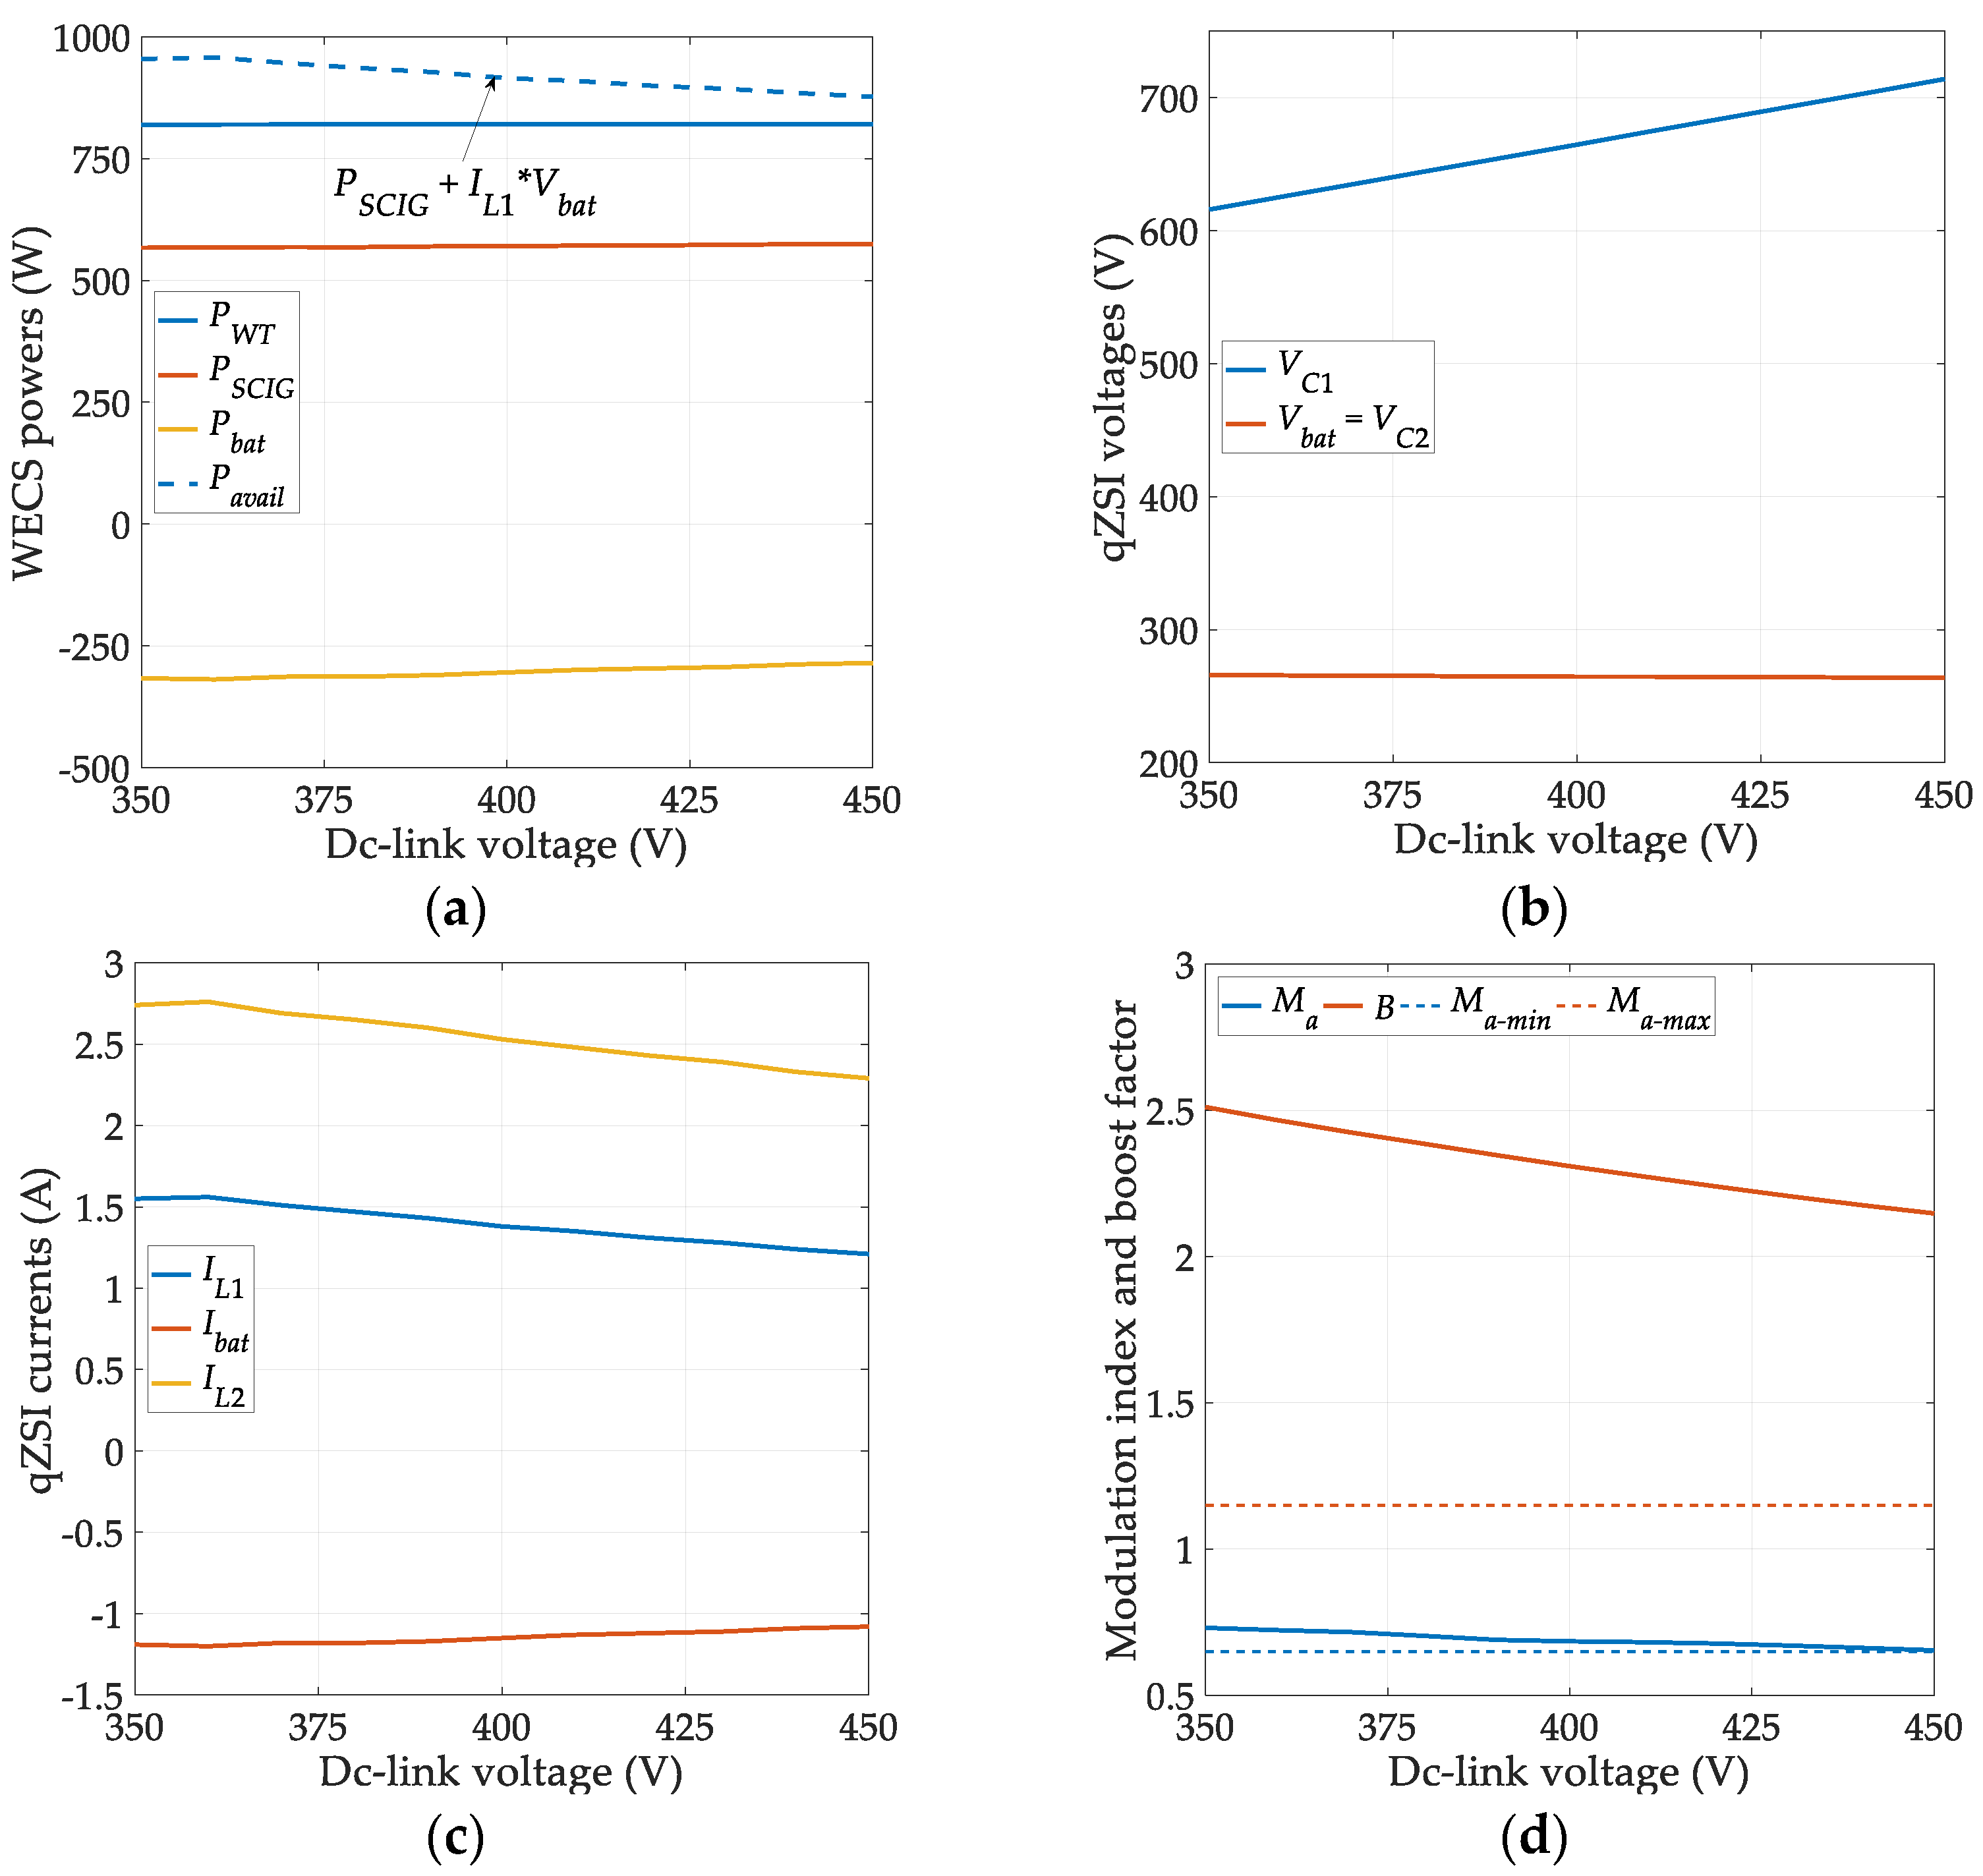
4.2.2. DC Link Voltage Range
In this case, the wind speed and the AC load voltage were fixed to 9 m/s (medium speed at which there is no
D1 blocking during non-ST states) and 230 V, respectively, whereas the DC link voltage was varied as shown in
Figure 9. Both the WT power and the SCIG power were unaffected by the
Vdc variation, whereas slightly higher battery charging power was recorded at lower
Vdc values due to higher battery charging current. Since the qZSI input power was constant in the whole considered
Vdc range, the qZSI input current (
IL1) decreased with increasing DC link voltage. From the point of view of battery charging or
D1 blocking, higher values of the qZSI input current are desirable, but this also implies higher power losses and voltage drops on the parasitic resistances in the impedance network. In addition, too low a
Vdc value may result in SCIG demagnetization, especially at higher loads. By increasing the
Vdc value, both the voltage across
C1 and the voltage across the qZSI bridge also increase. Consequently, the voltage stress and switching losses of the semiconductor switches in the qZSI bridge increase with
Vdc. At the same time, the modulation index decreases and eventually reaches the minimum allowed value.
The results presented in this section show that the proposed system is capable of operating over a reasonably wide range of DC link voltages, which can be very useful in some cases. For example, the DC link voltage could be adjusted to minimize the qZSI losses, to enhance the battery charging, or to increase the total available power. In addition, in a system similar to this, but extended with a photovoltaic (PV) module connected to the DC link, the DC link voltage could be adjusted to track the MPP of a PV module.
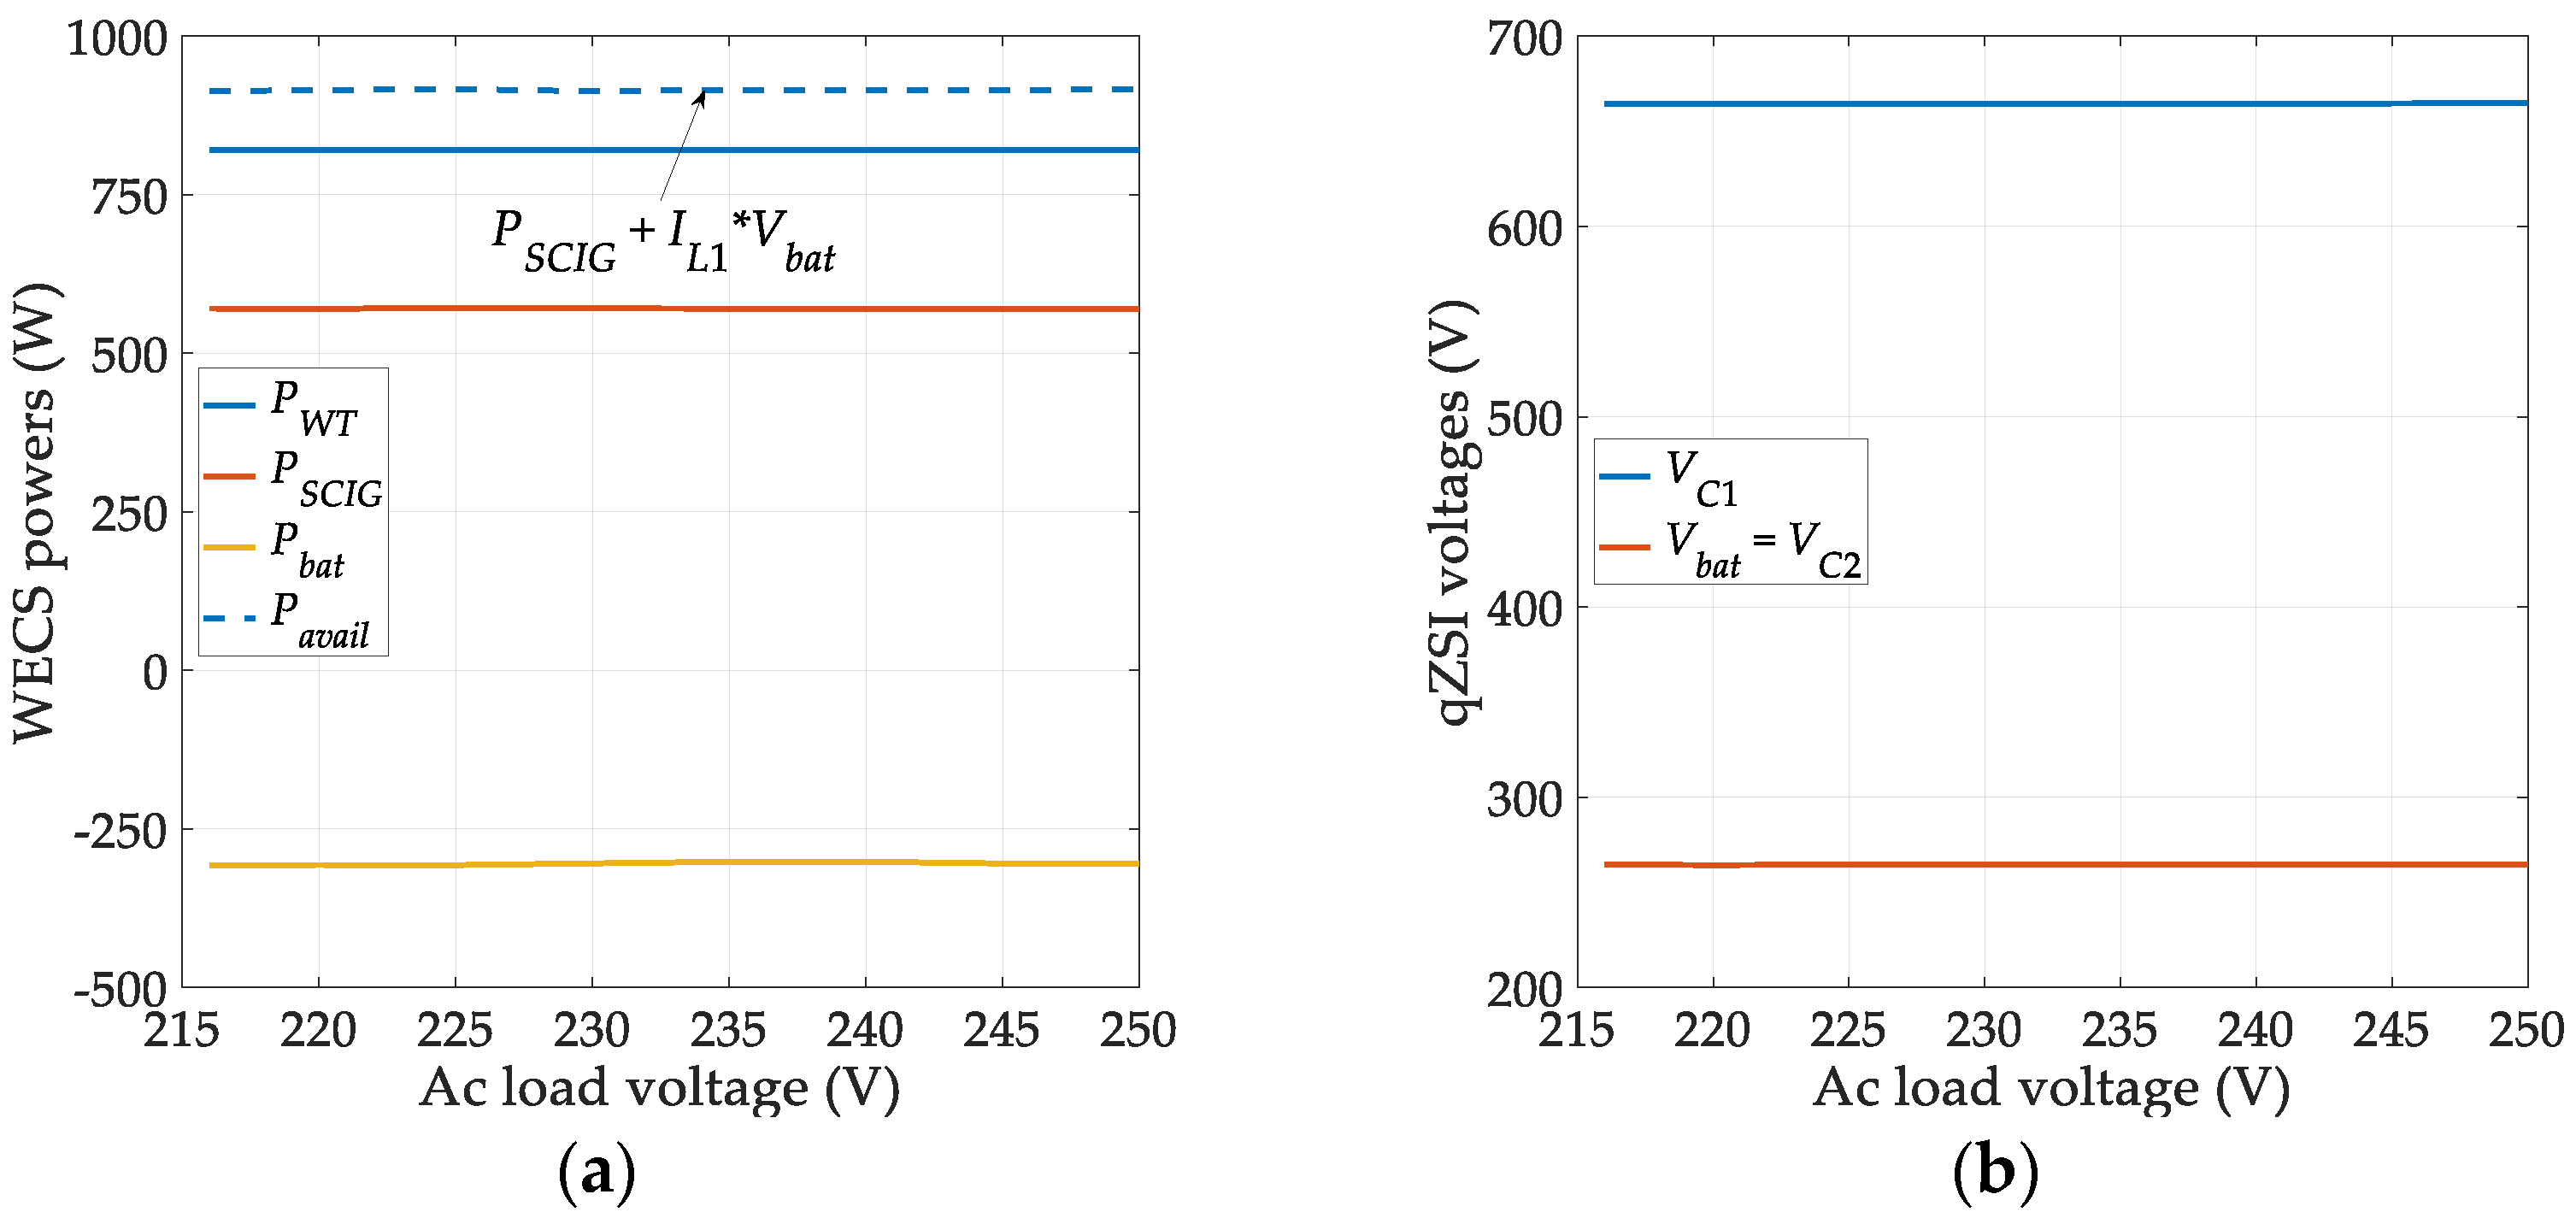
4.2.3. AC Load Voltage Range
The third set of steady-state characteristics was obtained with the wind speed fixed to 9 m/s and the DC link voltage fixed to 400 V, whereas the AC load voltage was varied as shown in
Figure 10. As it can be seen, the only variable really affected by the AC load voltage variation is the modulation index, whose value increases with
Vac. The other variables remain pretty much constant in the whole considered
Vac range. Note also that the lowest considered
Vac value was 216 V because
Ma-min was reached at this point. The highest considered
Vac value, on the other hand, was 250 V, i.e., about 10% above 230 V.
The results presented in this section show that the proposed system is capable of operating over a reasonably wide range of AC voltages as well, which may be, for example, utilized for the adjustment of the modulation index in cases when it would otherwise reach the minimum or maximum allowed value and, thus, possibly adversely affect the system operation.
4.3. Dynamic Performance Analysys
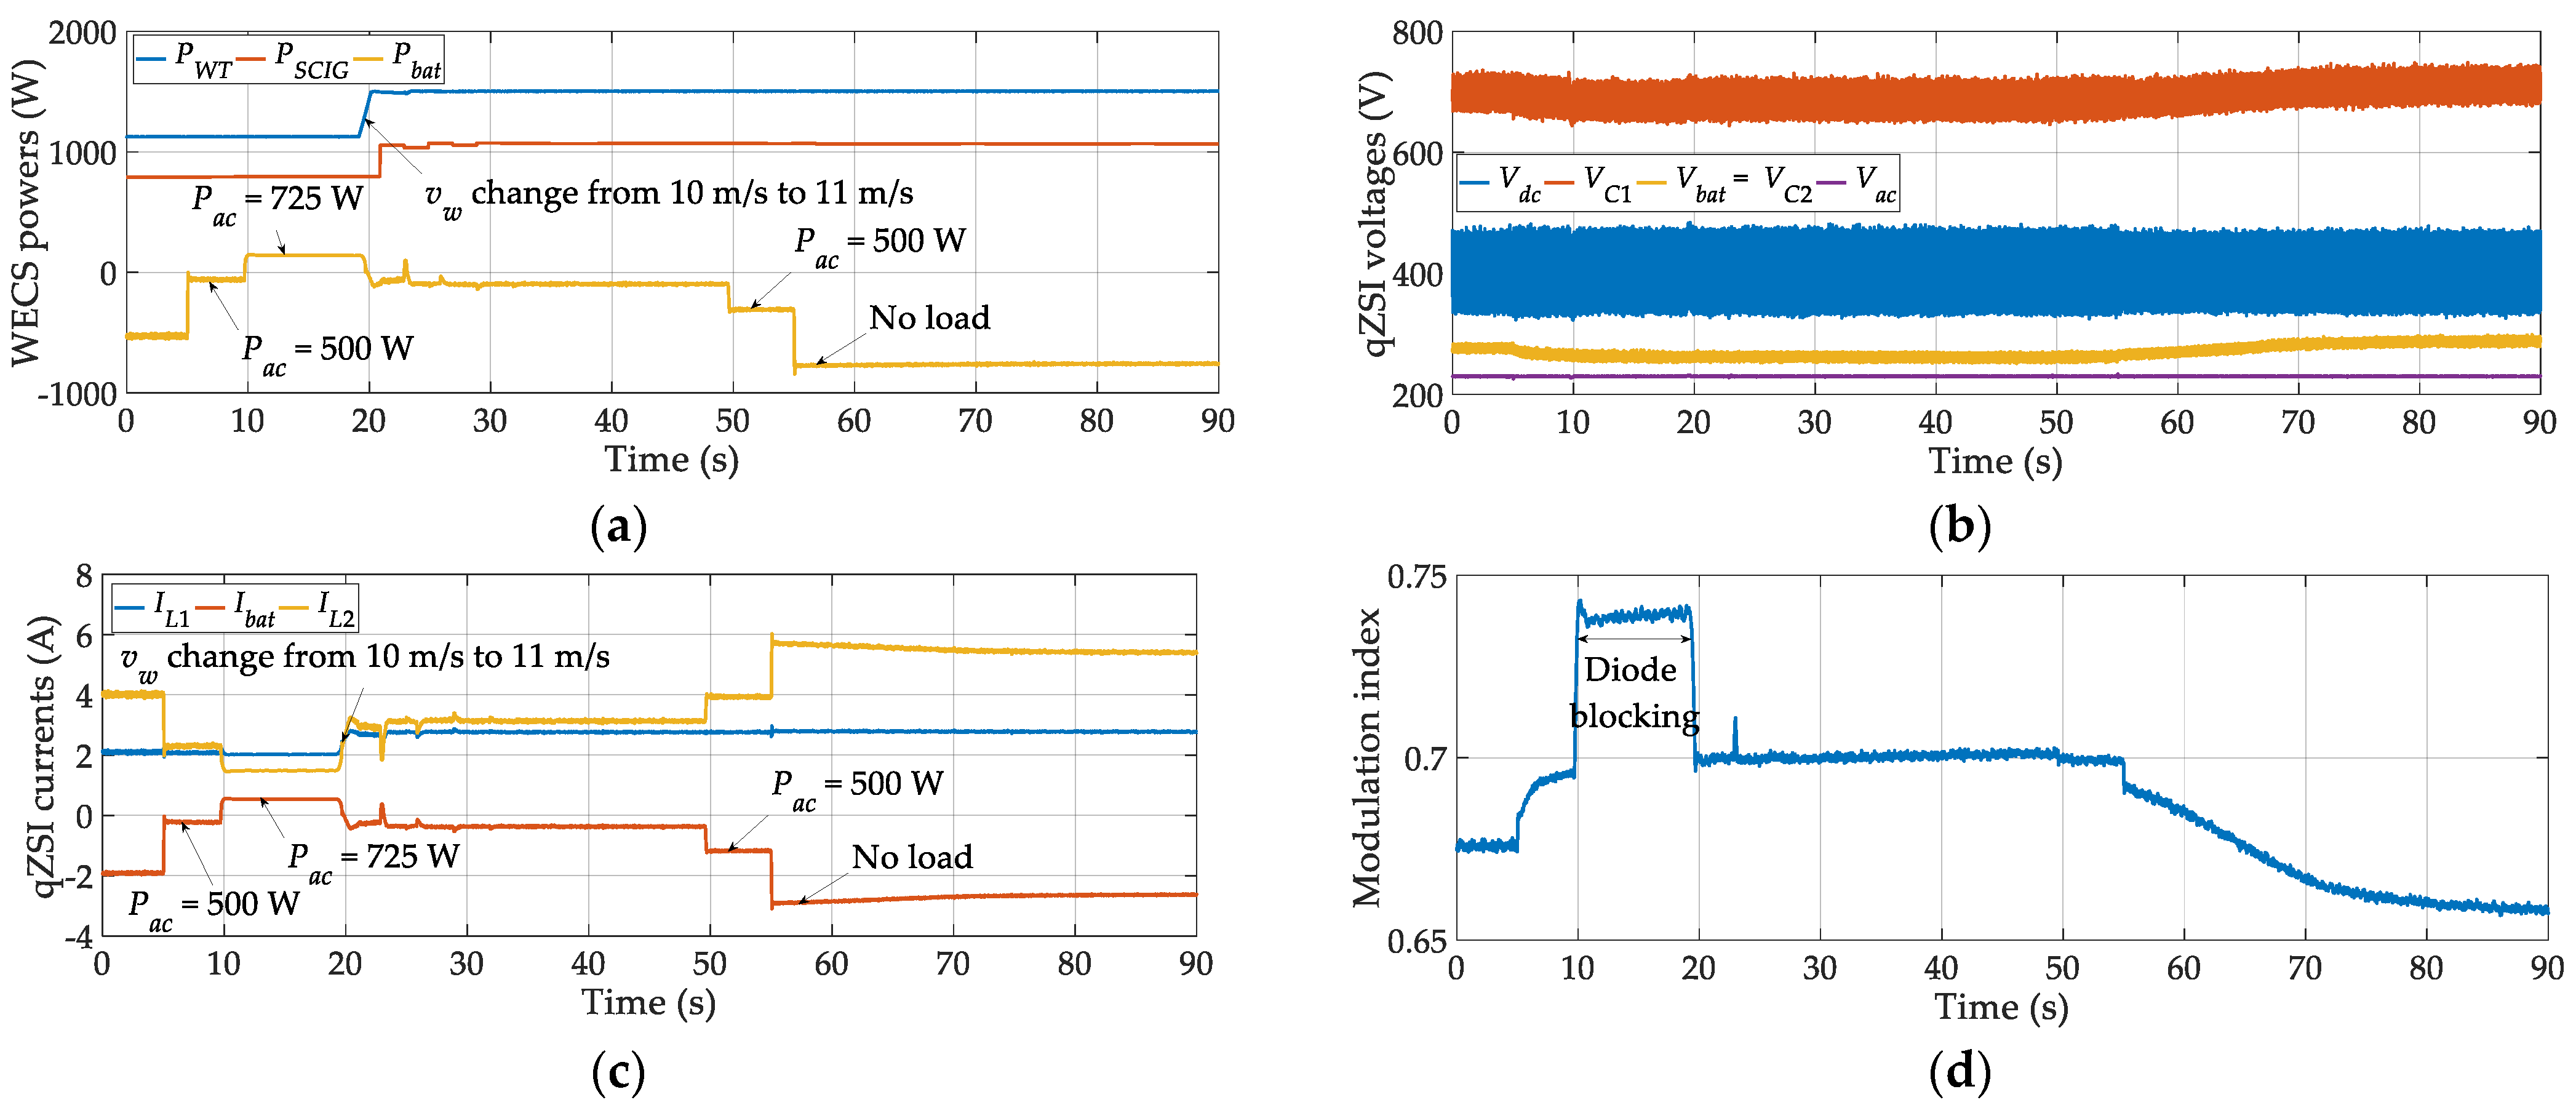
In this section, the system performance is analyzed with regard to load and wind speed perturbations. The recorded system variables are shown in
Figure 11. The observation starts in no-load conditions, with the wind speed of 10 m/s and with both the WT and the SCIG at their respective MPPs. At this point, about 1125 W was extracted from the WT and about 790 W was extracted from the SCIG. This was sufficient to charge the batteries with about −530 W. Then, at
t ≈ 5 s, the load of 500 W was connected, resulting in a reduction in battery charging power to about −60 W (note that the WT and the SCIG were unaffected by this). Next, at
t ≈ 10 s, another load of 225 W was applied; hence, the batteries had to step in to cover the load demand they were now discharging at a rate of about 140 W. At
t ≈ 20 s, the wind speed increased to 11 m/s, resulting in an increase in WT and SCIG powers to about 1500 W and 1070 W, respectively. Consequently, a surplus power of about −100 W was now being stored into the batteries. After the load of 225 W was removed at
t ≈ 50 s, the surplus power increased for approximately the same amount. Lastly, at
t ≈ 55 s, the other load was removed as well, resulting in a battery charging power of about −760 W.
Throughout the whole experiment, the DC link voltage and the AC load voltage were successfully controlled at Vdc = 400 V and Vac = 230 V, respectively, without any notable transients, whereas the battery voltage varied in the range 260–290 V, depending on the charging state. The voltage across the capacitor C1 varied in accordance with VC1 ≈ Vdc + Vbat. The modulation index decreased with increasing Vbat and vice versa due to the fact that the peak value of the voltage across the qZSI bridge can be approximated as VC1 + Vbat. It may be also observed that the modulation index increased with the applied load. However, a sharp rise in the modulation index recorded at t ≈ 10 s was only partly caused by the load increase; it was also partly due to the previously discussed blocking of the diode D1 in the period 10–20 s.
4.4. Battery Control Performance Analysis
In power systems with battery storage, such as the one considered here, an appropriate control strategy needs to be implemented in order to retain the battery SOC level within the acceptable range. In
Section 4.1,
Section 4.2,
Section 4.3, the battery SOC level was kept at about 70%. However, in this section, two experiments are conducted to test the proposed SOC-related control strategies—one for the case of minimum SOC (
Figure 12) and the other for the case of maximum SOC (
Figure 13).
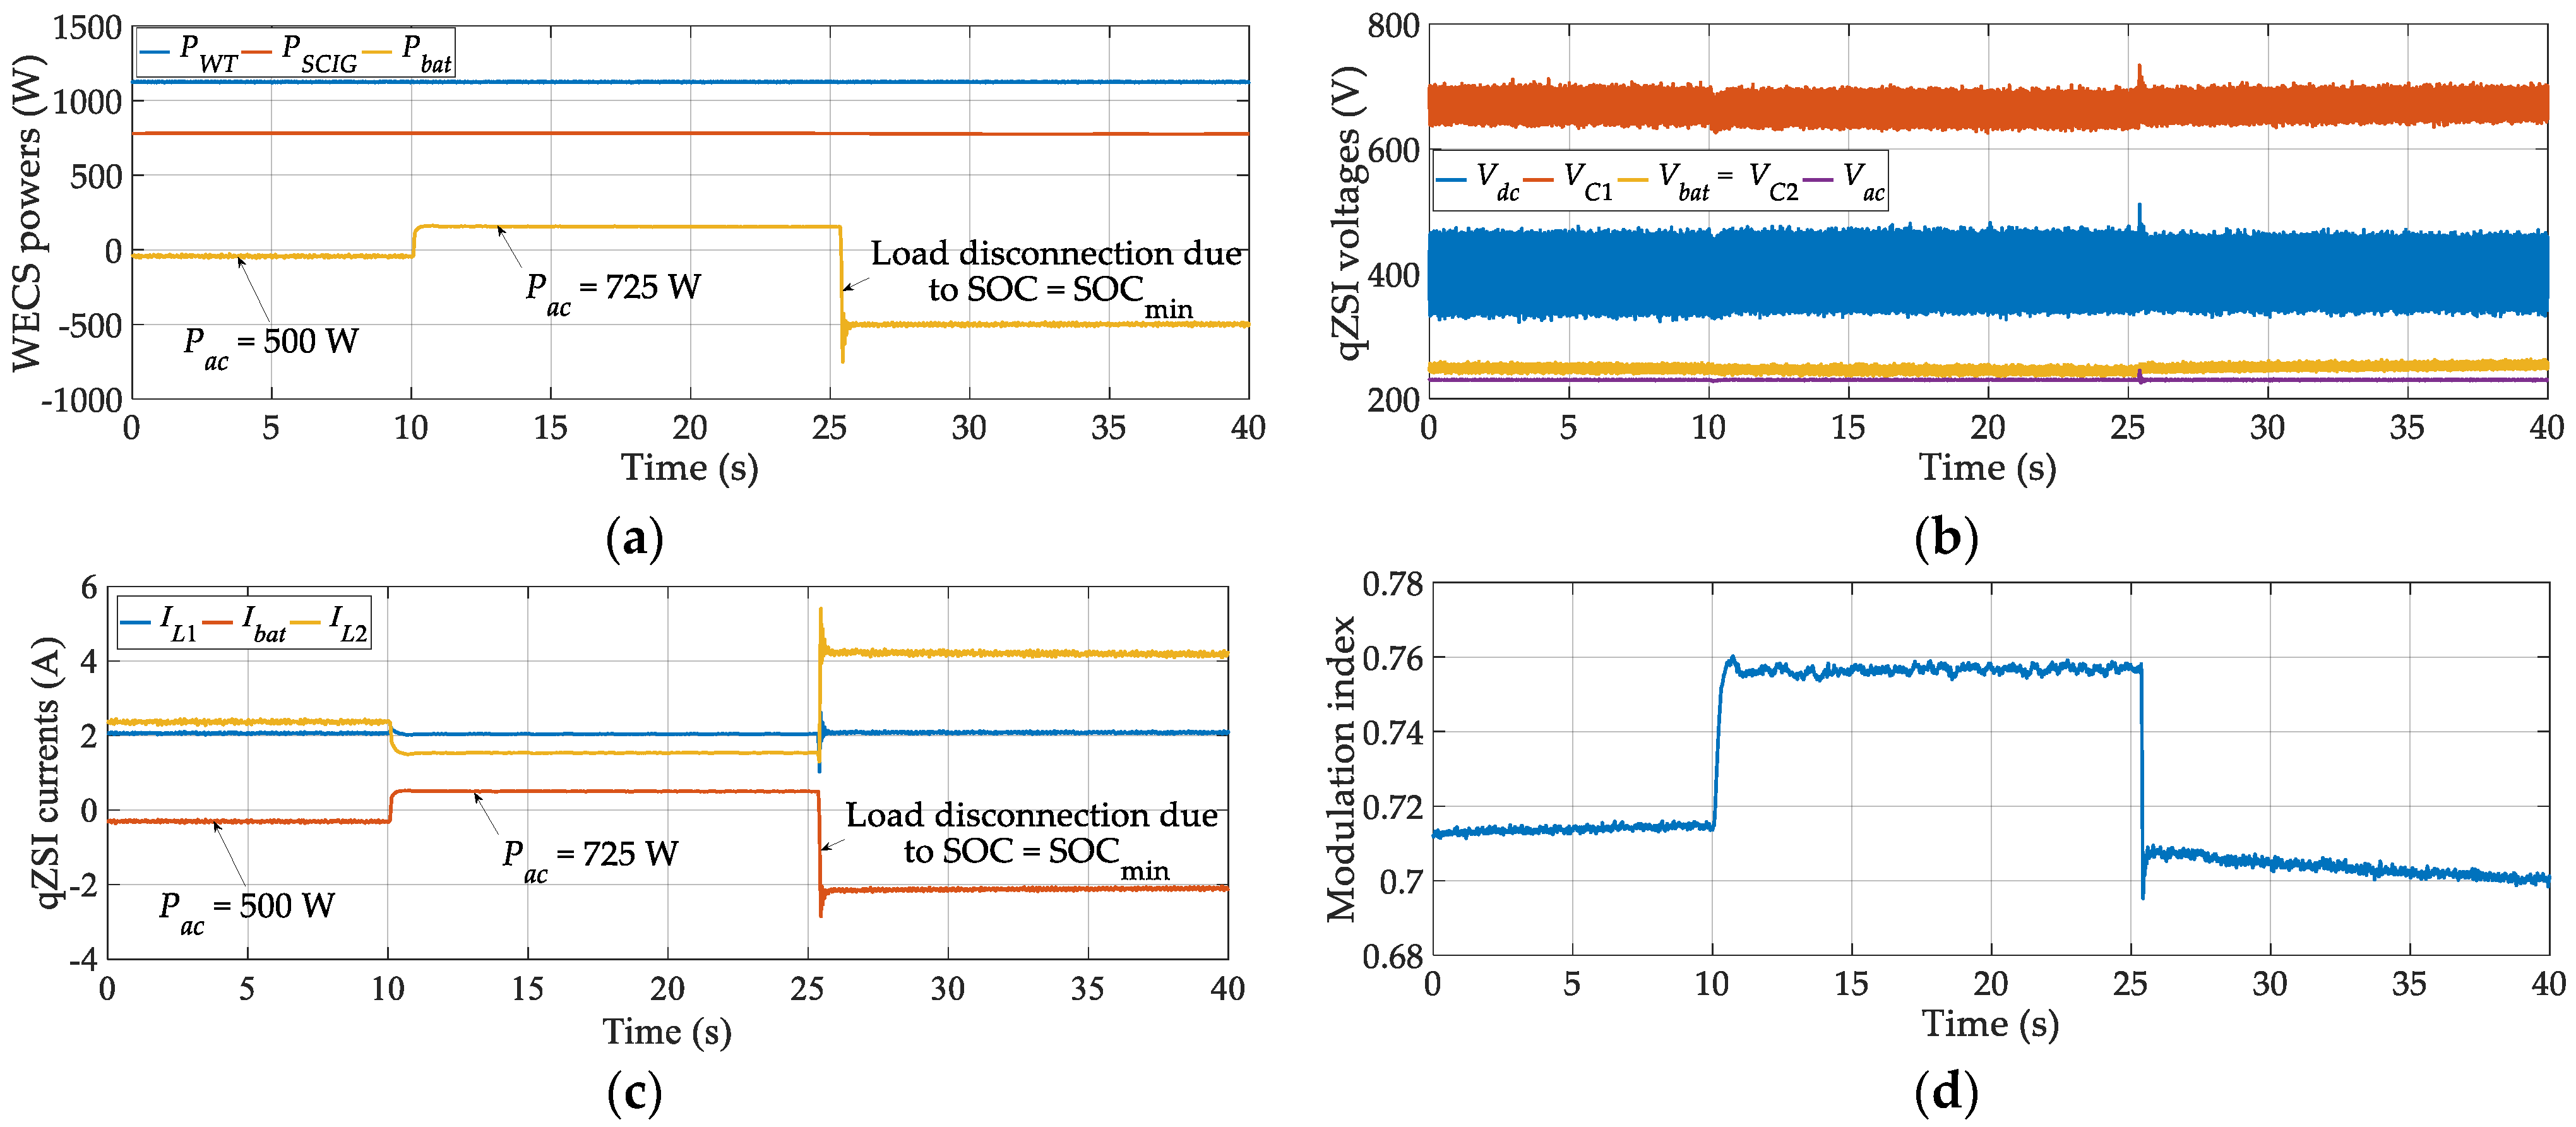
4.4.1. Operation at SOC = SOCmin
The observation starts at the wind speed of 10 m/s, with both the WT and the SCIG at their respective MPPs. At the same time, the SOC of the batteries is near the minimum allowed value of 35%. The selected wind speed provides enough WT power to charge the batteries even with the connected load of 500 W. Hence, at first, the batteries were charging with about −75 W. However, after the load was increased to 725 W at t ≈ 10 s, the batteries started discharging with Pbat ≈ 125 W. Consequently, the minimum allowed SOC was reached at t ≈ 25 s; thus, the load was automatically disconnected by means of a relay. A slight overshoot of about 10% was noted in both the DC link and the AC load voltages as a consequence of this action. After this point, the batteries started charging with all the available power, i.e., Pbat ≈ −530 W.
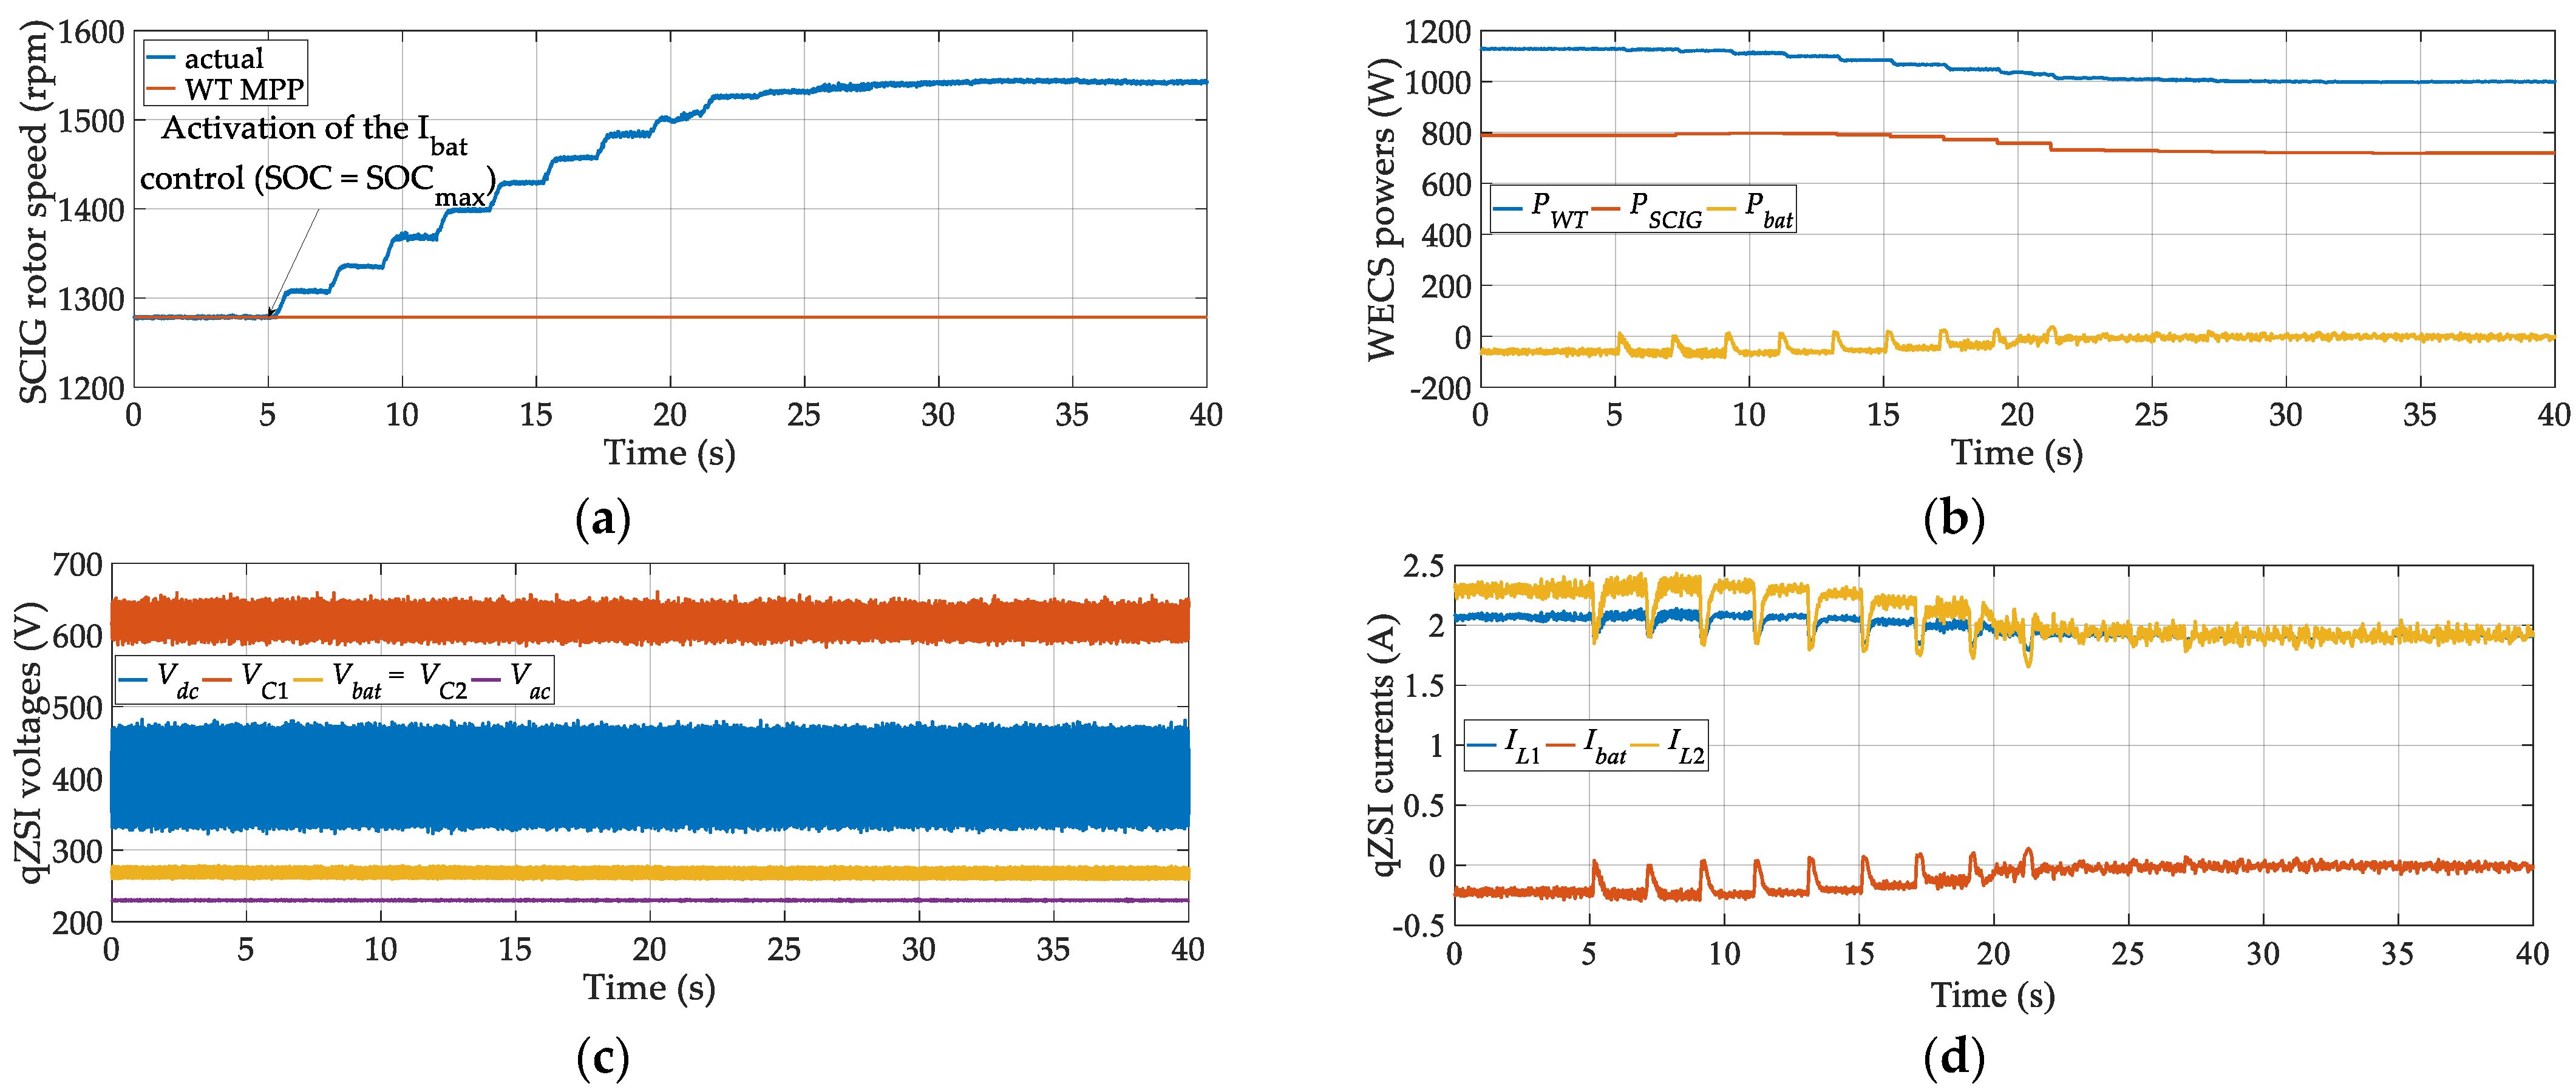
4.4.2. Operation at SOC = SOCmax
In this experiment, the initial conditions were the same as in the experiment described in
Section 4.4.1, except, this time, the SOC of the batteries was near the maximum allowed value of 100%. With the battery charging underway, the maximum allowed SOC was reached at
t ≈ 5 s; therefore, the battery current control was activated. Consequently, in about 20 s, the WT speed was increased by about 260 rpm to reduce the battery current to zero and, hence, stop further charging. It can be observed that both of the controlled voltages remained practically unaffected by the battery current control (
Ma was practically constant and equal to 0.69).
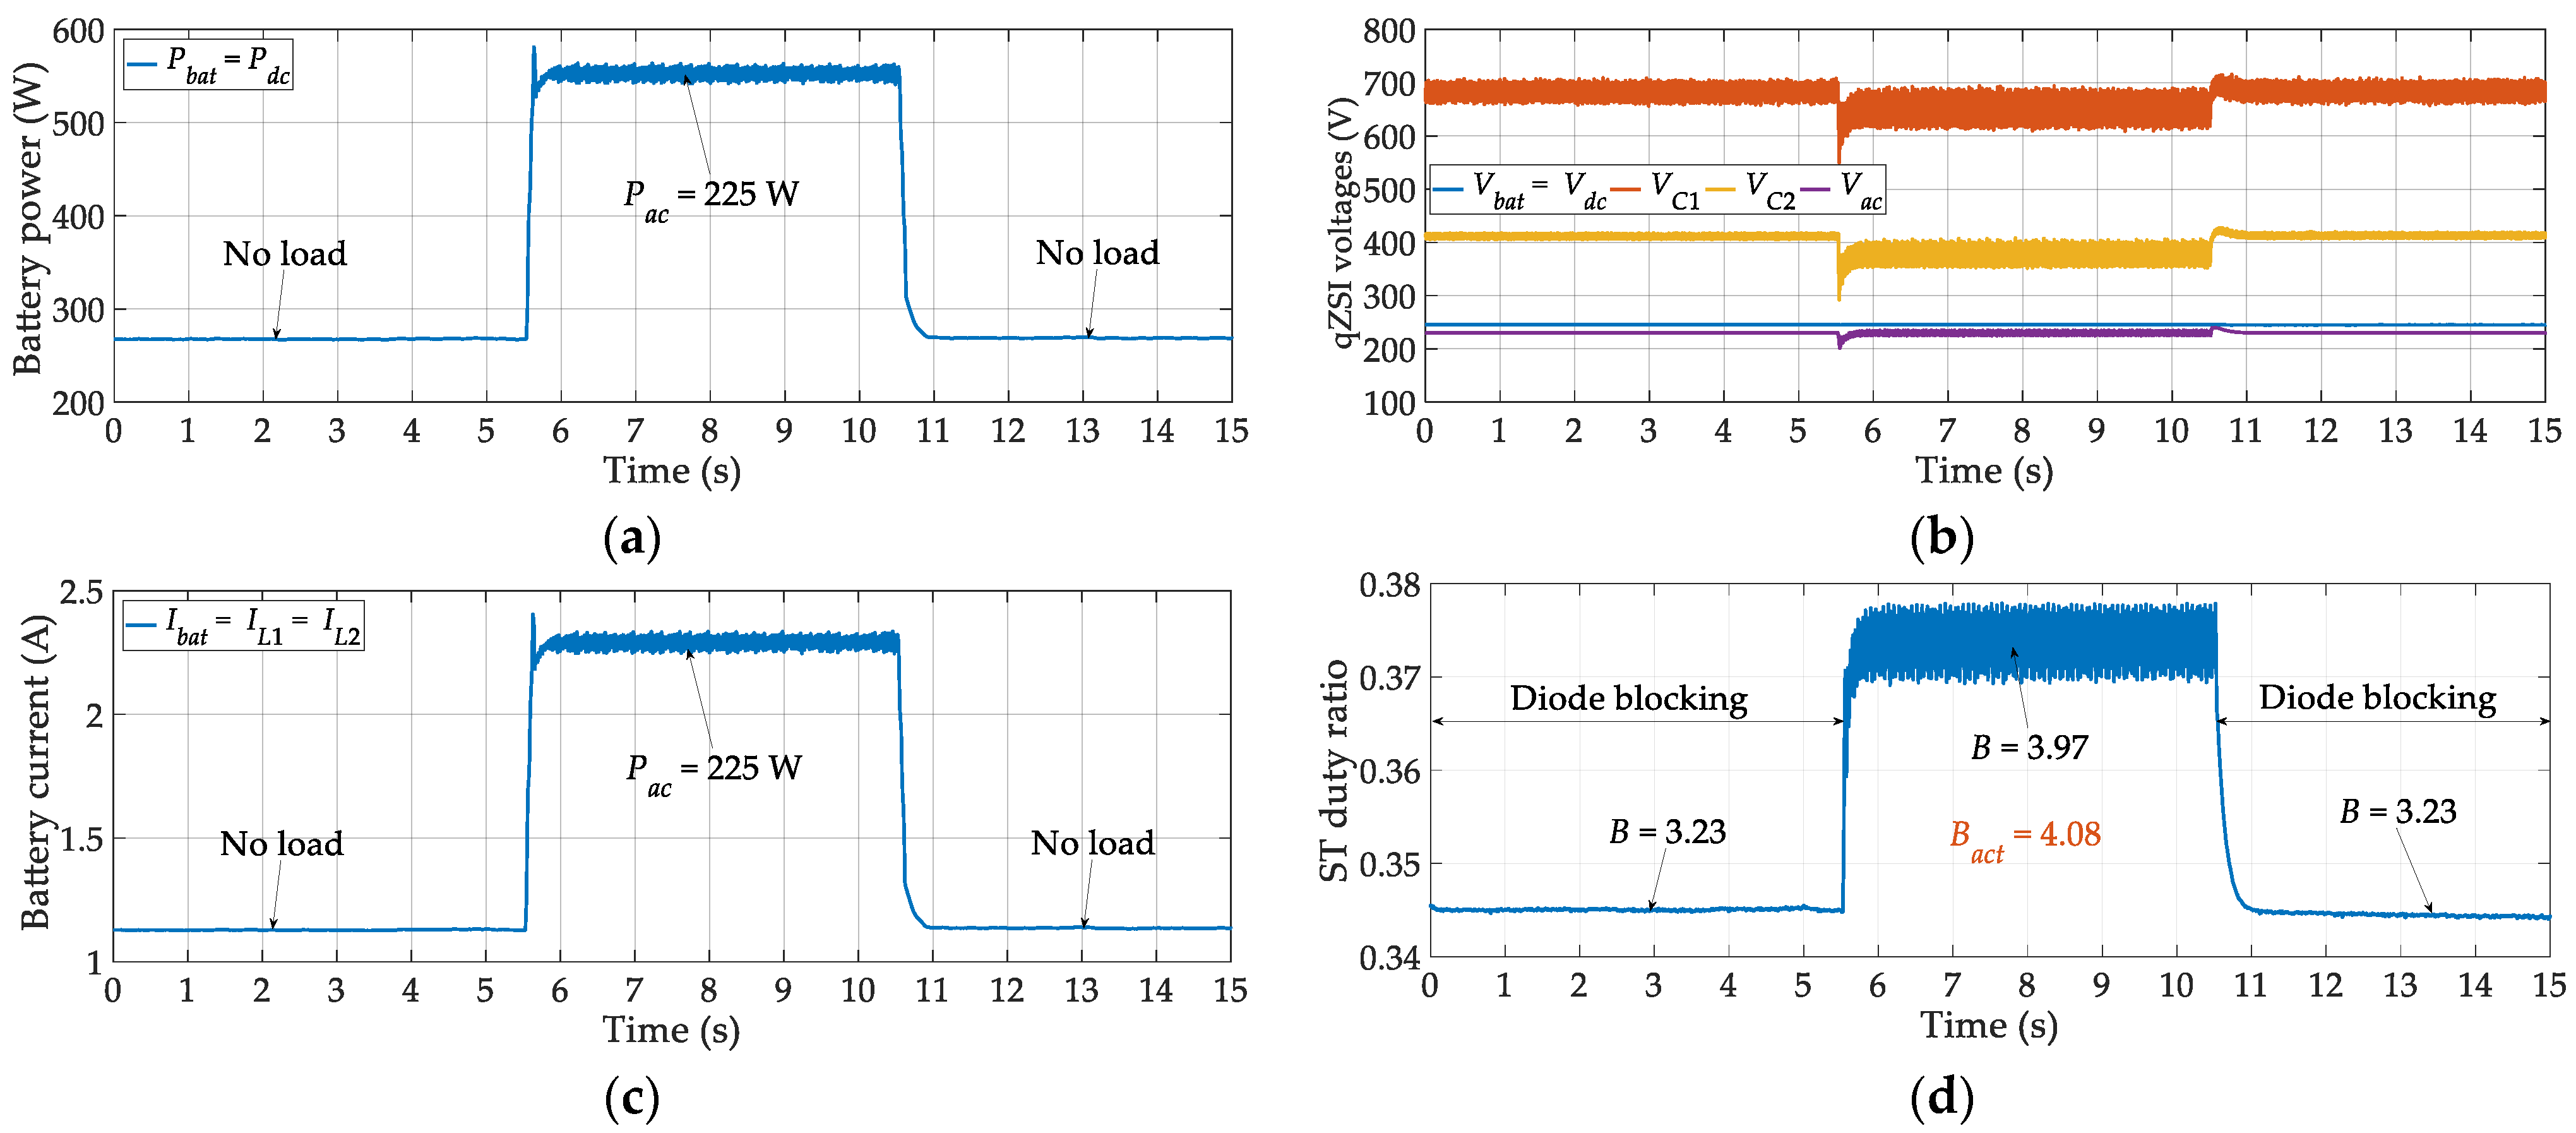
4.5. Low-Wind Performance Analysis
Figure 14 shows the system response to load perturbations for this type of operation. The observation starts in no-load operation, with the batteries only covering the qZSI losses. Due to the relatively low qZSI input current (i.e.,
Idc =
IL1 =
Ibat),
D1 is blocked during non-ST states in this interval, which is evident from the difference between
B and
Bact in
Figure 14d. The load of 225 W was then applied at
t ≈ 5.5 s, causing a small drop in the qZSI voltages and leading to an increase in the qZSI input current. Consequently, the normal non-ST operation with
B ≈
Bact was achieved. At
t ≈ 10.5 s, the load was removed.


