1. Introduction
To achieve the European Union (EU) decarbonization agenda and in conformity with various directives, the UK Government introduced in April 2010 a system of incentives, known as feed-in tariffs (FiT), covering various RE technologies including solar PV, anaerobic digestion, Combined Heat and Power (CHP), hydro power, and wind turbines. For wind and solar, the maximum capacity eligible for incentives under the scheme was 5000 kW. Larger facilities exceeding this size were incentivized under the home-grown Renewable Obligation Certificate (ROC) Scheme since 2002. This program is not considered in this research. The size cut-offs between these schemes are found on the website of the UK Energy Regulator Ofgem. With the Electricity Market Reform Act of 2012, the regime for supporting new, larger renewable energy (RE) was modified and centralized, and purchasing through a government entity under a Contract for Differences (CfD) was introduced [
1]. The Feed-in Tariff (FiT) Support Scheme involved private generators of renewable electricity selling output to private purchasers or Licensees, which were typically integrated utilities and aggregators. Under the scheme, private generators received a tariff price from the licensee according to the scale and type of technology, as shown in
Appendix B [
2].
The use of FiT to support RE attracted controversy from inception. Supporters pointed to the success in new capacity and argued that nascent industries need assistance until they become financially viable [
3,
4]; detractors raised concerns that medium and especially smaller facilities (less than 10 kW for solar or 1.5 kW for wind) were wasteful and inefficient [
5]. (As shown in
Appendix B, the smaller the facilities, the more generous the incentive tariff prices. Grid integration costs must be spread over smaller levels of output). Supporters argued that the high costs were acceptable to achieve greenhouse gas (GHG) reduction. Job creation was a common justification [
6]. Amidst the controversy, from 2010 when first introduced, the tariff prices were steadily reduced, and other changes to eligibility were made [
7]. Although changes to the FiT Scheme were not applied retrospectively, between inception in 2010 and 2016, support levels were steadily reduced, as shown in
Table A1 and
Table A2 in
Appendix B.
For solar PV, by 2016, support levels for the popular 10 kW or less of capacity had been reduced to £ 45 per MWh (although with the possibility of going even lower if investment thresholds were met). This was about 1/10 of the original 2010 level. For wind turbines of the popular 50 kW or less of capacity, tariff prices were cut to around £ 88.90 per MWh or about 30% of the 2010 support levels of £ 307.80 (full details on FiT prices may be found in
Appendix B). In addition to cutting feed-in tariffs, the range of prices available for solar PV for facilities was now tied to the growth in capacity, with applicable tariffs varying greatly [
7]. For example, within the single category of 10 kW or less, depending upon the capacity targets being met, possible FiT prices now had a range of between £ 6.00 and £ 44.60 per MWh. (
Modifications to the Standard Conditions of Electricity Supply Licenses 2015, No. 3. Energy Feed in Tariffs. Presented to Parliament pursuant to Section 42 of the Energy Act 2008.) Although changes to prices were not be applied retrospectively to capacity that had already been built, in 2016, tariff prices paid by licensees to private generators for wind and solar output were sharply reduced [
8]. The UK High Court ruled against the Department of Energy and Climate Change (DECC) and in favor of the solar industry: It was decided that retrospective changes to FiT prices were unlawful. The Government lost on appeal, and the Secretary of State in 2012 refused DECC permission to challenge the ruling. The judge also denied the request for DECC to go to the Supreme Court to challenge the lower court decision (
http://www.renewableenergyfocus.com/view/23458/uk-government-loses-feed-in-tariff-appeal/ (accessed on 15 April 2020)). Altogether, it appears that the authorities were adjusting support levels to slow the pace of RE investment, recognizing the impact as well as limitations of existing market structure. (In addition to reducing tariffs, in 2011, the DECC tightened eligibility criteria, and categories of incentives were consolidated. In 2013, further instructions were issued for units qualifying under the FIT Scheme [
9]. In 2015, tariff guarantees were removed entirely for certain units covered under the Renewable Obligation Order (ROO). In April of 2015, tighter eligibility rules for new RE facilities were imposed, and support levels were further reduced. Six months later, tariff guarantees were removed for community energy installations, and preliminary accreditation of Renewables Obligation Order (ROO) Feed-in Tariffs was imposed. In 2016, comprehensive changes were made to the entire FiT Scheme, including a further reduction in tariffs and the roll-out of deployment caps [
10]. Amendments were also made to energy-efficiency requirements. Automatic extensions to already accredited facilities were ended. Along with cuts in tariffs, accreditation criteria were further tightened.)
Through the many changes, the British Government appears to have moved from a passive stance of setting incentives and allowing liberalized electricity markets to respond to adopting a managed approach to RE investment. In contrast to the official promotion that begun in 2010, the reforms including the Energy Market Reform Act of 2012 for larger plants appeared to represent a departure from a two-decade long reliance on free markets to deliver affordable and secure electricity, including that generated by renewable sources. From concern on how best to encourage RE investment [
1], as capacity targets were achieved, the focus turned to whether reforms were needed [
11]. Could a RE support program such as the FiT scheme be
bolted-on to the existing market structure? In changing the scheme, questions were expressed over waste and compatibility with liberalized electricity markets [
12,
13]. Others wondered if the direct costs in the original design of tariffs had been properly calculated or if the wider impact appreciated. As a means of de-carbonizing electricity generation, was the FiT Scheme efficient?
As a retrospective examination of the FiT Scheme, we examine how it has been supported and consider its compatibility with current market design. In analyzing the merits of the scheme, we consider whether growth in RE capacity led to profligacy in how it was supported. Had investors received an appropriate level of return? Might similar levels of capacity and output have been achieved more cheaply and with smaller impacts upon stakeholders? Were the scheme’s externalities, defined as costs or benefits falling upon third parties but not included as costs by the producer, adequately considered? As a means of reducing greenhouse gas (GHG) emissions, was the FiT Scheme cost effective [
14]? Changes occurring to the support schemes of other EU member countries added to the perception that how RE was supported may be flawed in both design and calibration [
15,
16]. However, was this an argument in favor of centralized planning of renewable investment rather than reliance upon traded markets, or a call for re-calibration of support mechanisms under existing market structures [
17]? To examine these issues, we use a key financial performance metric and financial option theory to evaluate the RE support scheme in the UK as discussed below.
In our research, we examine the scheme’s economics and whether reforms to the tariffs, as first set in in 2010, were needed. Were reforms needed from the standpoint of economic efficiency? Were they sufficient to make RE compatible with a traded market in electricity? To examine the direct costs of RE support schemes, we measure the financial performance of renewable investments. From our results, we consider the extent to which supra-normal returns were earned by investors and if externalities may have been created. We use the investment costs and technical characteristics of the most subscribed UK wind and solar facilities covered by the Office of Electricity Market (Ofgem) FiT Scheme. We use half-hourly electricity prices between 2010 and 2016, as found on the UK APX Website. After calculating the direct costs measured in the financial returns earned by investors in RE, we introduce financial option theory to quantify the externalities of the FiT Scheme as arising from intermittent stochastic output having dispatch priority [
18,
19] (According to the US Department of Energy-Energy Information Administration,
dispatch refers to the operating control of an integrated electric system involving operations such as (1) the assignment of load to specific generating stations; (2) the control of operations and maintenance of high-voltage lines, substations, and equipment; (3) the operation of principal tie lines and switching; and (4) the scheduling of energy transactions with connecting electric utilities. Through giving RE generators dispatch priority, it means output from dispatchable plants (coal and gas-fired generators) are curtailed). In line with welfare economics and public finance literature, we define externalities as the social costs or benefits that their producer or consumer does not consider in his or her decision making [
20]. (Costs and benefits may be direct or indirect, tangible or intangible, and difficult to quantify.) The incidence of costs and benefits may vary by location [
21]. As terminology, although the term “options” is often used in the policy literature referring to
public choices, we use option theory for the valuation of state-contingent assets or liabilities, as treated in the finance literature [
22] and as applied to the optimization of energy assets such as power stations [
23].
The paper is organized as follows: in
Section 2, Background and Literature Review, we begin with the economics of why and how renewable energy has been supported and discuss the issue of economic efficiency. In
Section 3, RE Cost Measurement and Data, we address the issues raised in the literature review regarding the efficiency of incentive mechanisms using a key financial metric and option theory to capture the costs associated with renewable energy in liberalized traded markets for electricity. In
Section 4, Results and Analysis, we calculate the direct cost of subsidizing solar and wind renewable generators, along with social costs under current liberalized, traded electricity markets. In
Section 5, Conclusion, we reflect upon the changes to the UK Scheme and whether they are sufficient to make RE compatible with current market design, promote allocation efficiency, and reduce GHG in a cost-effective manner.
2. Background and Literature Review
When the liberalization of electricity markets began over two decades ago in the UK, Scandinavia, parts of Europe and North America, the RE policy agenda had yet to emerge. However, privatization of the electric utility industry and the introduction of traded markets in power meant that the [
24] criteria for optimizing investment in public goods (as RE) could not be applied [
25,
26,
27]. The “natural monopoly” argument for either state-ownership or operation as regulated utility had been dropped. Under liberalized markets, UK policy makers, similar to their counterparts elsewhere, now had to rely upon private investors and market forces to deliver RE. Was a RE policy agenda compatible with the existing market design [
28]?
In the UK, similar to other EU markets, it was recognized that making RE compatible with deregulated/privatized electricity markets would require special mechanisms to address its key features: high fixed costs, negligible variable costs, low-capacity utilization, and stochastic output [
29]. With liberalized electricity markets, the marginal price of electricity is set typically by the most thermally efficient plants, the Combined Cycle Gas Turbines (CCGT). Although the National Grid Company owns and operates the UK high-voltage transmission and sub-station systems, it is through the interaction of supply and demand, making half-hourly prices, rather than centralized dispatch that markets are balanced and reliability achieved. Market liberalization had succeeded in promoting investment with an array of dispatchable flexible plants such as CCGT underpinned by less flexible coal and nuclear generation. Capacity reserves were adequate to cover demand prediction errors, unexpected weather, or unplanned outages. National Grid entered into long-term contracts with suppliers to avoid supply disruptions and secure adequate reserve margins. The lucky coincidence of cheap and plentiful natural gas and the relaxation of EU directives on using it for power stations underpinned investment in gas-fired generation, the
dash-for-gas, by the newly privatized electricity companies in the 1990s into the new millennium. Moreover, investment in CCGT handsomely served the policy goals of affordable and secure electricity supply; gas was no longer a premium fuel [
30].
2.1. The Technology of RE
Given the aforementioned key features of RE noted above, modifications to the liberalized market structure were needed for its growth. As RE cannot be dispatched on demand but generates when the wind blows or the sun shines, it was given “dispatch priority” under the FiT Scheme in accordance with the EU 2009 directive: when RE plants are generating, others, with flexible and controllable output, such as gas turbines, must reduce their output (Directive 2009/28/EC of the European Parliament and of the Council of 23 April 2009 on the promotion of the use of energy from renewable sources and amending and subsequently repealing Directives 2001/77/EC and 2003/30/EC [
31]. However, the growth of RE capacity and output under dispatch priority arrangements has externalities: For licensees, it means reduced load factors for dispatchable plants and reduced thermal efficiency [
32]. There may be balancing problems for the grid operator and require additional connections [
33,
34,
35]. Lastly, it may impact the long-term security of supply through falling dispatchable reserve margins as plants are moth-balled and fresh investment is discouraged [
36,
37,
38,
39]. Recognizing the risks to supply security and the system reliability of growing RE capacity under prevailing market design, the Energy Act of 2013 introduced capacity payments for dispatchable plants to secure their availability as back-up [
39,
40]. Making such payments has now been approved by the European Commission [
23,
41].
In addition to the dispatch issue, RE also presents challenges from a private investment standpoint. Even with a guaranteed market under dispatch priority, unlike conventional methods of generating electricity, its expected annual utilization as a percent of rated capacity,
load factor, is likely to be sharply lower than that of conventional technologies. According to the latest data from the UK Office of National Statistics, the load factor in 2017 was 11.1% for solar PV, 23.7% for on-shore wind, and 36% for off-shore wind [
42,
43]. In liberalized electricity markets of the UK and elsewhere, given the low load factors, rewarding RE according to its output is problematic: at market prices, there would be insufficient return to investors [
44,
45]. Moreover, unlike a CCGT plant that may elect to dispatch electricity at the best half-hourly prices over the daily profile, when “Spark-Spreads” are positive, RE may be generating when prices are very low, such as wind turbines at night [
46,
47]. Together, low load factors and potentially low prices as set by market forces mean incentives are required to induce private investment [
48]. (The observations also imply that setting prices for RE according to cost-plus regulation of output would be challenging given its greater Levelized Cost of Electricity Output (LCOE), which is defined as the per-megawatt hour cost (in discounted real dollars) of building and operating a generating plant over an assumed financial life and duty cycle [
49,
50].The alternative of making fossil fuel plants less competitive by pricing or taxing CO
2 through initiatives such as the EU Emissions Trading Scheme has been ineffective given the inelasticity of electricity consumption [
30,
51,
52].)
In light of the challenges RE faces in liberalized markets dominated by conventional dispatchable plants, various policy instruments have been used to enhance its return and reduce its risks, including guaranteed prices above a floating price or using a fixed premium to a floating electricity prices to encourage the building of new capacity [
53,
54]. In some US states, output quotas have been used to promote renewable energy generation [
55] in others, rebates to consumers of solar PV were introduced [
56,
57]. The UK approach mirrored that of other EU countries, in offering incentive prices for RE through a feed-in tariff [
58]. Through selling non-self-consumed output to a licensee such as a utility or aggregator at tariff prices, an investor in RE earned a financial return from installed renewable electricity-generating capacity [
8,
59]. From inception, there were concerns that tariffs were too generous [
60]. As shown in
Table A1 and
Table A2 in
Appendix B, every year, fresh reductions were made, leading to the sharp cuts by Ofgem in 2015 (Concerns over the FiT approach of relying upon private investors and private licensees also led to the 2012 program of centralized purchasing under a Contract for Differences (CfD) structure for RE output [
56,
59]. In addition to reducing tariff prices available under private commercial arrangements for smaller and medium facilities, with the Market Reform Act of 2012, the UK Government introduced a central purchasing Scheme for new RE to oversee investment in the technology [
61]. Under the 2012 arrangements, a CfD entity was created by Government to contract electricity purchases with private low-carbon generators according to incentive feed-in tariffs. As stated in the Annex of the 2012 Act, projects that are able to receive support under the small-scale Feed-In Tariffs (FITs) were not eligible for CfDs. Projects covered under the old Renewable Obligation could also not switch to the new CfD program.
Given the sharp growth in UK renewable capacity in response to incentive prices, we ask whether the original incentives for private generation and purchasing were properly calibrated and whether any externalities were adequately reckoned [
62,
63]. Were the returns to private RE investors through the original FiT fair, given the limited risks, or were they too generous [
64]? Was the subsequent reduction to the FiT Scheme justified? For licensees, and ultimately, all stakeholders, had the potential externalities been addressed? In sum, were the various reforms sufficient to
square the circle of how to integrate RE into the current market structure and design, or would alternatives be needed [
65]? Could the supply responsiveness of RE investment to changes in incentive tariffs be correctly anticipated? Overall, was the promotion of RE compatible with the liberalized electricity markets?
2.2. The Economics of RE
Given the requirement for financial incentives to induce RE private investment in liberalized traded markets for electricity, two questions arise. First, the level of support needed to achieve a desired level of investment and second, whether such investment is compatible with liberalized electricity markets. When it was found that wind-park owners in Portugal had been over-compensated under the country’s feed-in tariff scheme, hasty reforms were introduced [
60,
66]. The jump in RE investment in Italy and Spain also prompted cuts in support levels [
67,
68]. From inception, in the United Kingdom, similar concerns arose over RE support levels. There appears to have been differences in how policy makers viewed feed-in tariffs and how markets and investors looked upon them [
69]. With its unique cost characteristics described above and stochastic output, inducing RE investment would require incentives, but the generosity of such support appears to have been inadequately addressed.
On the second question of whether the targeted growth in RE investment would be compatible with the design of liberalized power markets, minimal analysis appears to have been undertaken in advance of policies being implemented [
70]. Although benefits of RE have been widely heralded such as reducing CO
2 or promoting job growth, evidence to the contrary notwithstanding [
34,
71], the social costs appear to have not been weighed [
72]. However, with the introduction of capacity payments in the Energy Act of 2013, there appears to be recognition that RE was affecting the reliability of the system through the impact upon incumbent dispatchable operators [
73,
74]. Externalities appear to have not been considered when on the back of the 2009 EU directives, the UK, similar to other members, introduced incentive prices for RE (Directive 2009/28/EC of the European Parliament and of the Council of 23 April 2009 on the promotion of the use of energy from renewable sources and amending and subsequently repealing Directives 2001/77/EC and 2003/30/EC. Other externalities such as the reduction in thermal efficiency of incumbent plants through running at reduced capacity or reduced reliability through frequent load changes were also not addressed in the aforementioned directive nor codified in the Energy Act of 2013. Officially at least, the benefits to RE investors of not paying for the common resource of dispatchable back-up generation and grid management under current market design was not articulated. In this regard, in the United States research has been undertaken on the impact of RE penetration on grid reliability [
33,
75,
76].
Understanding the externalities associated with RE requires examining the operation of liberalized electricity markets. Externalities arise because electricity is not a homogenous good: power supply from different fuels and technologies are not commoditized substitutes; when and where electricity is generated determines both its value and system impact [
77]. Under the current market design, any externalities associated with the FiT program fall initially upon dispatchable licensees, which are typically integrated utilities or aggregators, but its ultimate incidence is borne by shareholders, employees, and customers Quoting from the Ofgem document of 2010: “Licensed electricity Licensees who have a minimum of 50,000 domestic customers (as defined in the standard conditions of electricity supply licensees, or “SLCs”) will be obliged through their electricity supply license to offer and pay FITs. These Licensees are classed as Mandatory FIT Licensees.” [
78]. Since the commercial storage of electricity is presently not commercial, the time of day when it is supplied or dispatched determines its value [
79] and the degree of market penetration affects its impact [
80]. The stochastic nature of RE generation under dispatch priority imposes costs on the owners/operators of dispatchable fossil fuel plants in accommodating such output. Meanwhile, RE investors enjoy the benefits of liberal market design through dispatch priority and a generous FiT from a licensee. However, as RE output may lead to externalities, it implies that returns are understated, as they are free-riding upon the costs of ensuring grid stability and curtailing the output of the dispatchable plant operated by integrated utilities. Overall, the potential for externalities under current market design has not been widely appreciated [
81]. Hence, to analyze the economic efficiency and compatibility with liberalized market design of the FiT support scheme, one must examine not only the direct costs of support incentives but also any externalities [
82]. Only by weighing both direct costs in subsidies along with externalities can we address whether the FiT scheme was a cost-effective means of decarbonizing electricity generation.
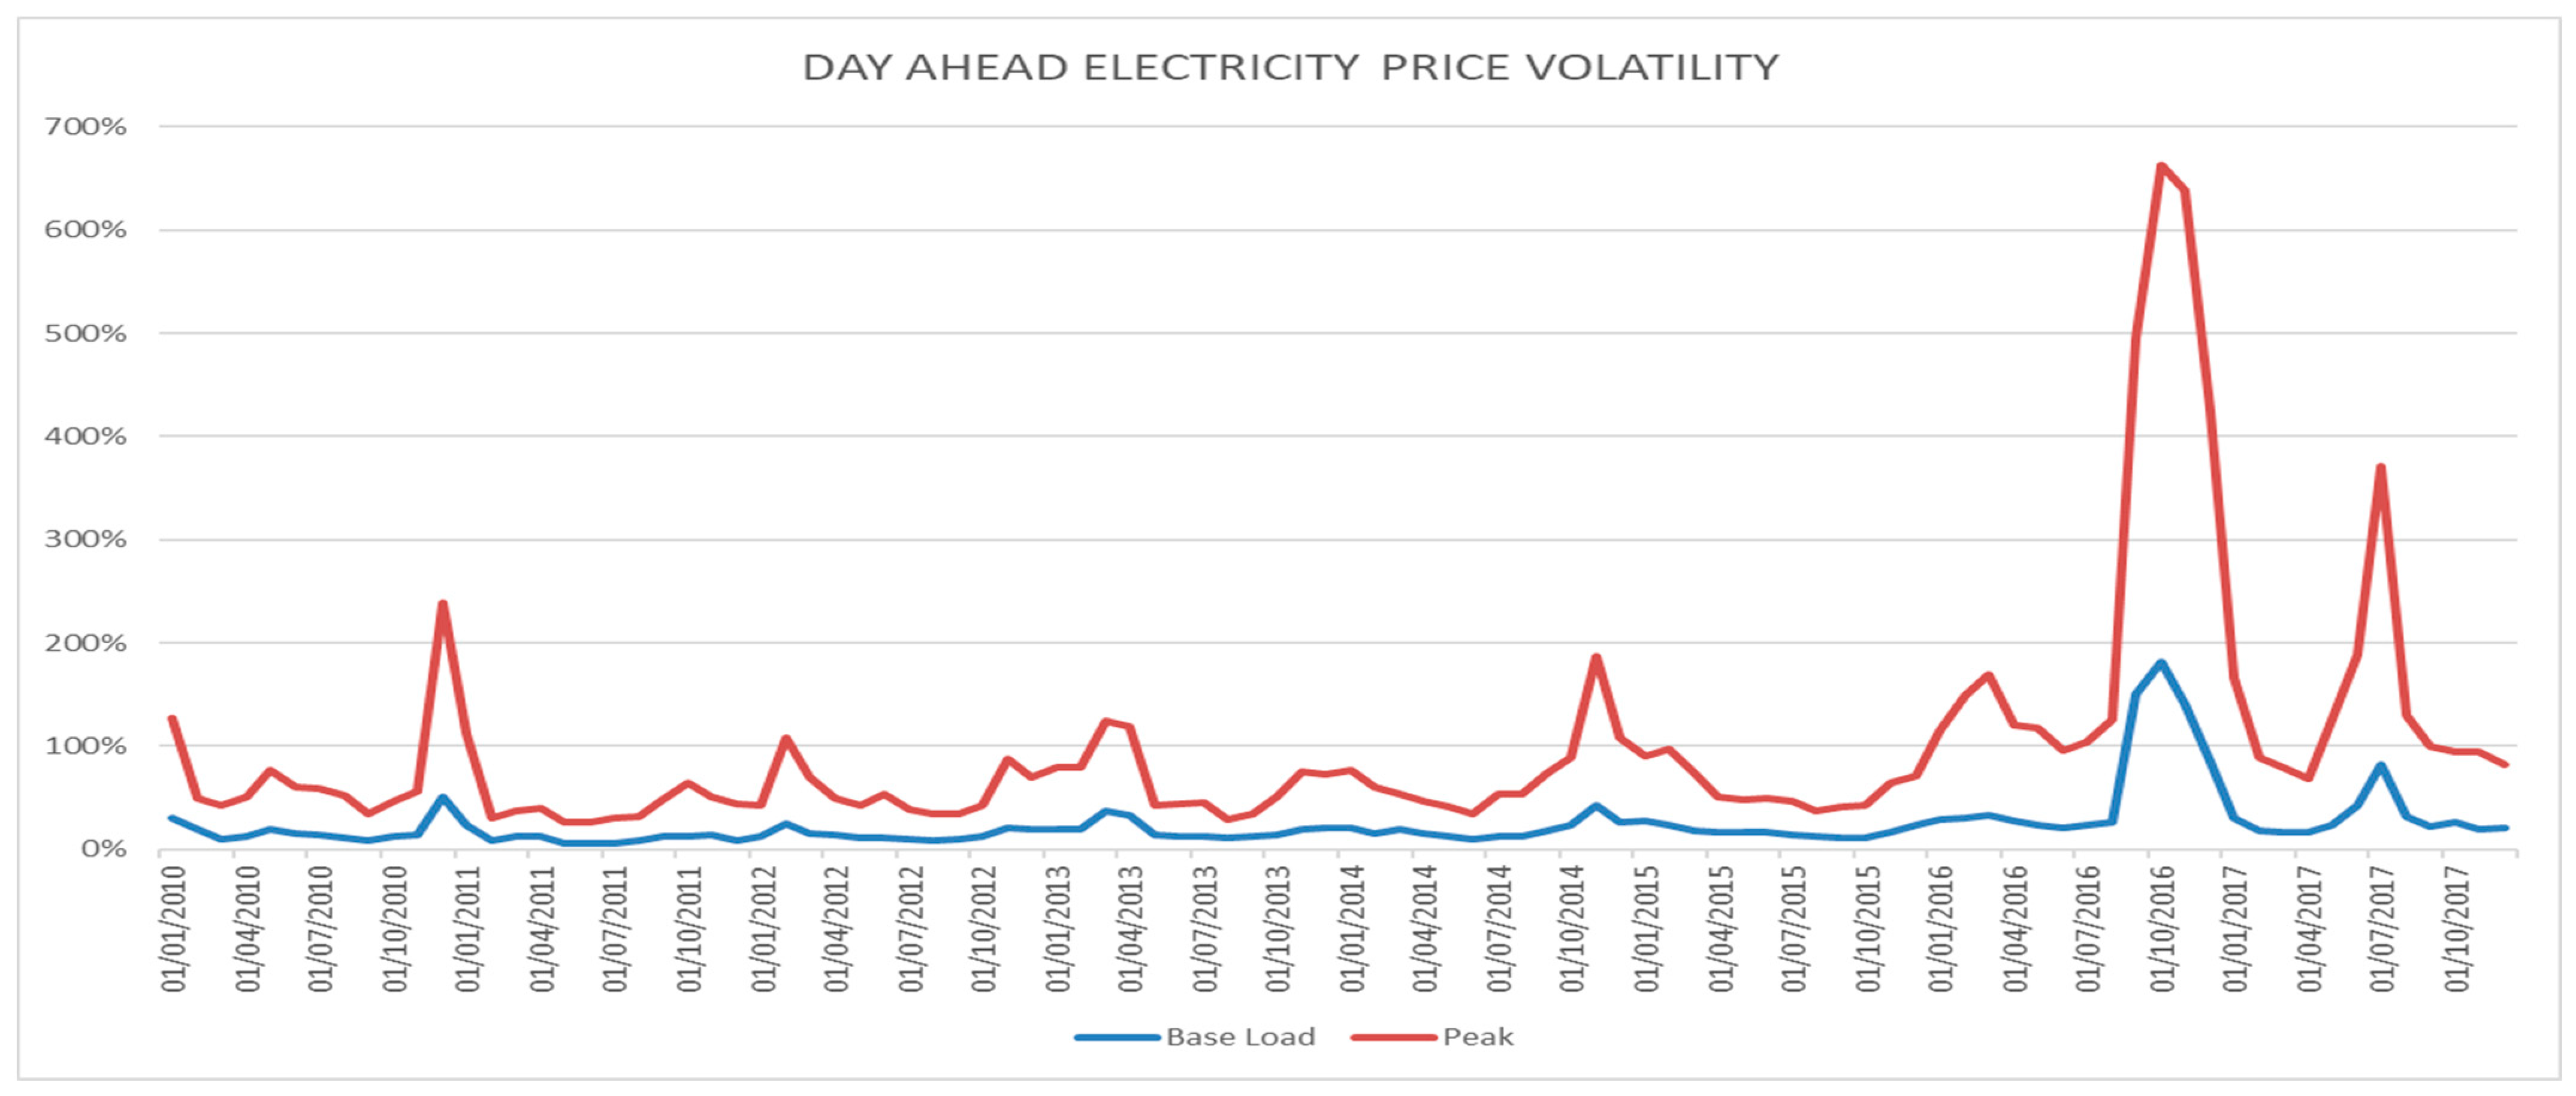
Although not presented as an official motivation for changes to the original 2010 UK incentive scheme, concerns had been expressed over the broader impact upon UK incumbent operators through general market conditions [
83]. In addition to the owner/operator costs of providing back-up according to wind speed and solar irradiation, RE output affects general market conditions. The correlation between electricity output and electricity prices means that the stochastic nature of RE output may increase price volatility and, as a consequence, the cost of managing market risk [
51,
84]. Secondly, as generating RE has virtually no variable costs, its output may put downward pressure on electricity prices, reducing the income of conventional plant owners and operators, creating a pecuniary externality. RE output may alter the merit order of dispatchable plants, producing a system-wide impact as noted in other countries [
51]. As electricity prices fall through the expansion of zero variable cost RE production, the market-to-market value of tariffs offered as incentives to RE developers increases, the opportunity costs for incumbent generators and aggregators of managing exposure under FiT arrangements grows [
85]. Such observations have led to yet further questions over market design of whether liberalized traded power markets can handle large volumes of RE output [
16,
86]. Lastly, RE as a form of
distributed generation raises costs through requiring additional high-voltage connections to the grid [
66].
Altogether, the above observations raise concerns over the UK incentive scheme, prompting the following questions: was there only a problem in the calibration of the support scheme or, more fundamentally, were increasingly large volumes of intermittent electricity output through imposing costs upon the system and stakeholders such as licensees compatible with liberalized market design? From several hundred pounds per MWh in 2010, prices by 2015 had been reduced to levels resembling the wholesale electricity market [
87], but were such reforms to the FiT Scheme an adequate remedy? As capacity targets were achieved, had attention turned to the broader impact of unfettered growth in RE? Analyzing the evolution of the FiT Scheme requires understanding its direct costs in compensation to investors, any externalities, and the overall effectiveness in reducing CO
2.
3. RE Cost Measurement and Data
To address whether the UK scheme was economically efficient and whether changes were justified, we use a financial performance metric to quantify the direct costs of RE in returns paid to investors to see whether such returns were fair or whether RE investors were over-compensated (We define a “fair” return as that generally earned by other investments of equal systematic risk, according to Capital Asset Pricing Theory as first developed by Professor William F. Sharpe). To capture the externalities of the RE under the current market design, we use option theory to quantify the theoretical costs of hedging against the intermittent output under dispatch priority imposed upon incumbent operators, other stakeholders, and the system as a whole. (We assume neither a constant nor predictable supply of RE output. Rather, we quantify the costs using option theory, of hedging against
all potential exposure. Subject to risk appetite, a licensee may hedge a proportion of the potential exposure, although such possibilities are not analyzed.) In addition to quantifying the externalities, option theory provides insights into the aforementioned effects associated with RE of lower prices and greater price volatility. Considering both sets of costs allow us to examine the efficiency of decarbonizing UK electricity generation under the FiT scheme [
88]. From the above, we can gain insight into changes made to the original support schemes and whether they were sufficient to make RE compatible with liberalized traded markets in electricity [
89].
3.1. The Direct Costs of RE
To address the question of whether changes to the UK support scheme were needed on the grounds of economic efficiency, we examine its direct and indirect cost. For direct costs, we examine returns received by investors using the Return on Capital Employed (ROCE) metric, which is computed as:
“Earnings before Interest and Tax” captures what was paid through incentive tariffs to RE generators according to output, and “Capital Employed” is the investment required to purchase renewable generation capacity and excluding funding liabilities (Many licensees as purchasers paid for the initial investment in, for example, solar installations with the costs recovered through a reduction in tariffs received). As the operating costs of a renewable plant are low for wind turbines, especially during the first ten years of operation, and even lower for photovoltaic (estimated at just 1%), such costs were excluded from our analysis. Although there is no evidence that ROCE was used in setting official RE tariffs, arguably, it captures whether returns were fair, given the risks undertaken. (The method(s) actually used to set support levels back in 2010 has not been published.) We note that similar to other EU countries, the UK’s FiT Scheme was designed for smaller facilities, which may have partially self-consumed (“prosumers”) the energy produced and therefore only received incentive prices for volumes exported to the grid. In having the grid available as a back-up if the sun may not be shining or the wind not blowing, RE investors enjoyed the imputed benefit of assured supply or reliability. In effect, RE investors have non-economically exercised put options to sell electricity when produced or take electricity from the grid when not generating, creating exposure for licensees. Notwithstanding such nuances, we argue that ROCE captures the performance of RE from an investor perspective.
3.2. The Externalities of RE
In reforming and modifying the UK incentive scheme of 2010, several arguments were advanced. Most notably, it was said the scheme had been too generous or was even no longer needed, but one of the strongest arguments might have been that the externalities were not appreciated, although some concerns were expressed over the costs of integrating RE into the existing market [
83]. In the literature, there are various approaches to analyzing such costs, although generally, the focus is not upon
utilization costs [
4]. One can use commercial full-scale stochastic dynamic programming models for system-wide simulation of the effects of stochastic RE output [
20,
81]. Otherwise, one must revert to heuristic methods to examine such costs such as the actuarial model used by one researcher to examine the Nordic Pool market [
90]. In recent work, the externalities of integrating RE have been placed into three categories, having a linear relationship [
80]:
Balancing and intra-day trading costs arising from random deviations to planned generation schedules;
Grid-related costs through changes to the market value of location of generation on the power grid and opportunity costs from displacement through the transmission of RE output.
Profile costs arising from differences between the load-weighted profile of market prices versus that of the RE-weighted profile over time.
Although the above categories are helpful, apportioning such costs is challenging. Moreover, their relationship may be non-linear but interact with one another. Instead, we offer a fresh approach to measuring externalities comprehensively by quantifying the cost of hedging exposure. We introduce financial option theory to analyze the externalities of RE output upon incumbent utilities or aggregators through quantifying the cost of neutralizing exposure to intermittent output at an incentive tariff, as introduced in our related research [
30]. Under risk neutral pricing, as the hedging costs must be equal and opposite to neutralize an exposure, it represents the externalities imposed upon incumbent utilities from intermittent stochastic RE output.
3.3. Measurement of Externalities
To measure the indirect social cost of RE under the UK incentive scheme, we begin by noting that a utility or aggregator, as a licensee, must pay the difference between the market price and the FiT under a bi-lateral agreement. Even though, as mentioned above, some RE output may be for self-consumption and not supplied into the grid, an integrated utility or aggregator faces ex ante several potential costs: first, of adjusting output downward for reduced demand, second, of purchasing electricity at the incentive tariff prices as provided to wind or solar-generated electricity exported into the market, and thirdly, through exposure to the intra-day trading and balancing market. Ex ante, the aggregator or integrated utility neither knows how much may be produced nor how much of the produced volume will be self-consumed, i.e., not exported into the market and purchased at the incentive price. Therefore, he does not know what exposure to the balancing market may arise. The costs of satisfying within the day shape load profile may also be incurred by the licensee. Hence, to the extent that the potential costs of such risk are not recovered in the relationship with the private generator, they are borne by the licensee, an aggregator, a utility, and ultimately, various stakeholders under the rules set by Ofgem, if half-hourly prices exceed the tariff, the renewable operator must return the excess. Given the high FiT levels when the scheme commenced and prevailing wholesale prices, this an infrequent event. Some Renewable Energy aggregators in the UK offers packages to private generators, reducing prices in return for risk sharing. At a system level, through the arrangement between private generator and licensee, an exposure equal to the difference between the tariff and the market price is created and imposed initially upon the latter and, to the extent not absorbed, all stakeholders. (Capacity payments to integrated utilities and generators introduced with the 2013 Energy Act and now approved by the EU Commission may have offset some of the above costs but are not examined in the present research. Moreover, such payments have a cost that ultimately must impact consumers.)
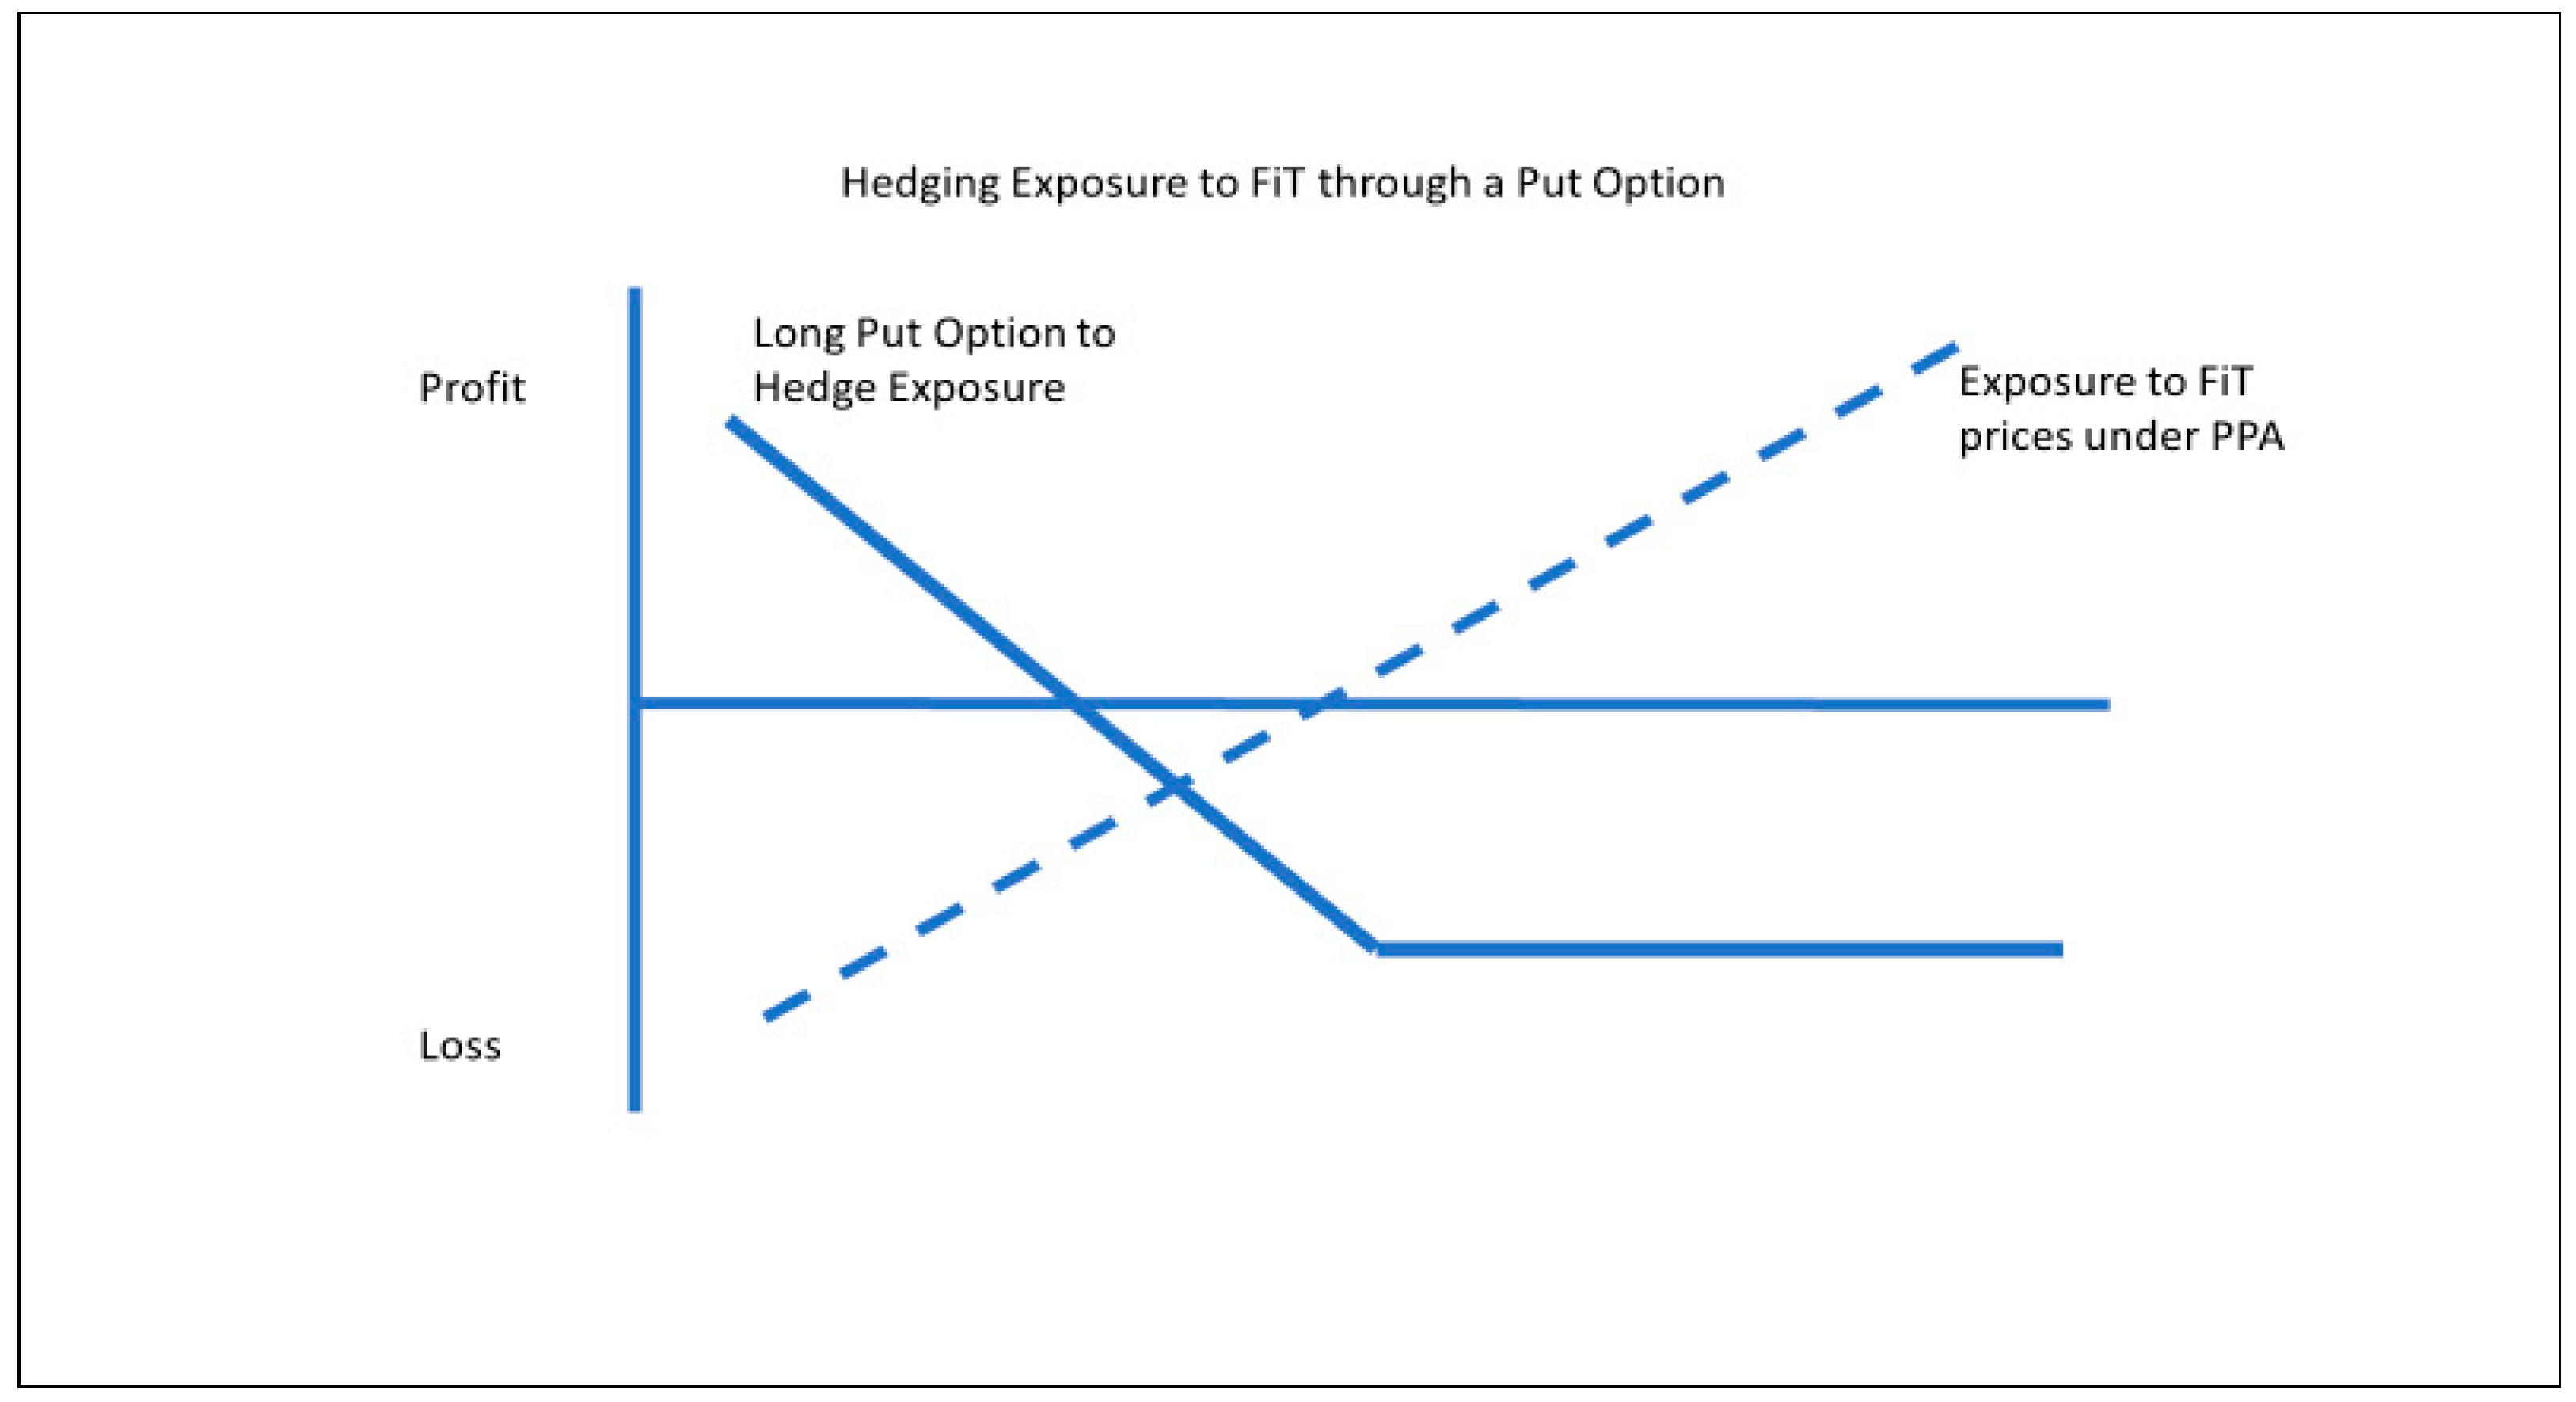
To measure these externalities, we turn to option theory. In theory, exposure under an arrangement to purchase RE output at FiT prices under a Power Purchase Agreement (PPA) could be hedged by purchasing put options (the right to sell) with strike prices equal to the tariff price (see
Figure 1). Through hedging, what is lost through the difference between the incentive price and wholesale price would be compensated by what one gains through exercising the put options. According to received theory, the price of an option at maturity equals the present value of the expected terminal payoff, assuming no arbitrage and risk neutrality. Although actual options
cannot be purchased at half-hourly frequency to hedge the exposure from feed-in tariffs, under risk neutrality, the theoretical price of the put options represents the expected cost of having to accept unexpected electricity at the feed-in tariff price and sell it at the market price (On the InterContinental Exchange, options and futures on electricity are traded at less granular frequency, such as day-ahead, months, and seasons. Although full replication for hedging is not possible at half-hourly granularity, a statistical hedging program might be conducted using the contracts available).
To measure the expected costs arising from the difference between market price and the tariff created through the arrangement between the private generator and licensee, we use the well-known Black and Scholes (BS) analytic formula for pricing a European style put options with strike prices equal to the feed-in tariff (A “European” style option can only be exercised at expiration, unlike an “American” style option, which may be used anytime during the life of a contract [
91]. Although more complex option theory models have been developed allowing the relaxation of such assumptions as prices following geometric Brownian motion [
69], use of the Black–Scholes option theory to price risk in electricity markets is accepted practice in the utility and financial sector [
92,
93]. As having insurance compensates for a loss, owning put options conferring the right to sell electricity at the incentive price would neutralize the cost of accepting RE under the FiT Scheme. In financial theory, options are priced according to the five parameters shown in
Table 1 (The differential equation for pricing of options appears in
Appendix A).
We note that according to option theory, the degree of risk aversion conveniently drops-out of the differential equation solution. Regardless of the degree of risk aversion, one is indifferent between accepting the risk and paying to neutralize exposure to the agreement. In using option theory to compute the theoretical cost of hedging all exposure to RE, we assume no strategy according to risk tolerance or commercial objectives; instead, all potential exposure from purchasing RE at the feed-in tariff price would be neutralized via options. However, if utilities or aggregators (or indeed other stakeholders) were risk adverse, they would be willing to pay more to neutralize the risk (We do not consider the heterogeneity of risk aversion of various stakeholders, i.e., that utilities may be less risk adverse than for example consumers to whom costs may be passed forward. We are also assuming that the exposure is
gamma neutral, i.e., the second derivative of
= zero. The absence of second-order price sensitivity means that the exposure does not need to be hedged at an increasing rate [
88]. This is a strong assumption, as the integration of RE may lower prices, increasing the negative mark-to-market exposure of licensees [
94,
95]). Thus, if the risk faced in the first instance by the licensee can neither be recovered in the pricing arrangement nor hedged, it is borne by stakeholders: the generators, customers, employees, and shareholders. Lastly, even if a utility or aggregator does not choose to completely hedge his exposure according to risk appetite, the non-hedged risk is still reflected in the cost of capital and borne by stakeholders.
Applying option theory also affords insights into the systemic impact of RE under a liberalized market structure. According to option theory, as shown in the table above, conditions of falling market prices or greater volatility in market prices would increase what one should charge for accepting the aforementioned risk. Falling prices and greater volatility have been observed in markets where RE plays an increasing role [
96]. By implication, if incumbent generators cannot charge for accepting the risk of intermittent electricity output at incentive prices, then they, along with stakeholders, bear the cost.
As explained above, the combination of self-dispatch and the feed-in tariff pricing enjoyed by renewable owners creates an exposure for the licensee purchaser and, ultimately, the system, which may be quantified using put options. Although some of the RE output may be for self-consumption, ex ante, the licensee faces the risk of having to accept such RE electricity at an incentive price and adjusting his own output downward accordingly. In using option theory, we assume that electricity prices and their volatility reflect relevant information including such factors as the risk of renewable generators exporting electricity and the correlation between wind and solar output and market prices. Given that the trading of electricity on exchanges and over-the-counter involves merchant generators, integrated utilities, banks, and trading houses, we believe that this assumption is reasonable.
3.4. Data and Technical Parameters
To examine the UK’s FiT Scheme, including the adjustments that were made, we analyze the direct costs of the FiT Scheme by computing a ROCE metric and its externalities using option theory as explained above in
Section 3.3. In order to incentivize smaller scale RE investments operating at lower efficiency and load factors, FiTs were set in an inverse manner to size. As shown in
Appendix B, from 2010 onward, tariffs paid by each licensee for various technologies and capacity were reduced annually as well as categories narrowed and restrictions introduced [
7]. Although gross payments under the scheme made by individual licensees to investors may be found in the Ofgem FiT Annual Reports, expenditure according to applicable annual tariffs by volume is not. For the many possible arrangements between licensees and private generators, there are many possible combinations of volumes and applicable tariffs that may yield the same level of expenditure. Therefore, we take a “top–down” approach: Looking below to
Table 2 showing the Return on Capital Employed for Renewable Generation, we divide FiT Scheme Payment, column 3, by Electricity Received, column 4, to obtain an implied price per MWh annually. Dividing income by the installed cost of RE per annum weighted according to the proportions that were generated by solar PV versus wind turbines gives us annual returns on capital employed metric as shown below in the right most column of
Table 2.
For technical costs per installed MW of solar and wind facilities, which are shown below in
Table 3, several sources were consulted, including academic research.
As we can see from
Table 2, the ROCE for private investors in wind generation and solar PV under the FiT Scheme was quite attractive; with minimal risk, investors earned an average return of 18% over the six years. We observe that from 2013, the FiT payment jumped with the increase in both wind and solar capacity, sharply improving the returns to investors. Importantly, although the applicable tariffs for new build as shown in
Table A1 and
Table A2 in
Appendix B were reduced annually, the implied price per MWh changed minimally from £ 210.55 to £ 192.52 or 7% less, reflecting the legacy of investment under the more attractive, early incentives. Compared to the prevailing half-hourly electricity price of column three of
Table 2, we see that the implied price under the scheme was generous. Explaining the stability of returns, it may also be attributable to greater volumes from generation under the older tariffs. Changes to FiT tariffs as noted above were not applied retrospectively (see Footnote 2 above). Moreover, as we see from
Table 2, investment in solar PV capacity over the six years was 6.5 times greater than investment in wind turbines covered by the FiT Scheme, and incentives for solar PV were greater. As shown in
Table A2 in
Appendix B, the tariff prices for the most popular solar PV investments between 4 and 10 kW were reduced from £ 378 to £ 240 during the six-year period, which is still greater than the tariffs applicable to the most popular wind turbines, the 15 to 100 kW models for which the prices were reduced from £ 253 to £ 201.
Although a licensee depending upon the vintage and scale of its obligations to purchase RE output may vary, for our analysis of externalities, we use as the put option strike price the effective prices, explained above, for RE output under the scheme of
Table 2. In addition to the strike price, we require the option input parameters found in
Table 1 above. For market price, we use half-hourly wholesale price electricity data for the UK between 2010 and 2016, which were found on the APX Group Power Exchange website. To these prices, we add the Use of System charges (transmission, balancing, and distribution costs) as found on the National Grid Website [
100]. Volatility is computed from the standard deviation of daily returns in the aforementioned half-hourly prices, using the well-known procedure [
91]. As a required input to the option valuation formula, we assume a risk-free rate of interest of 1%. The calculation model is written in Excel with the VBA add-in functions from DerivaGem© Software and computes the prices of 48 European-style put options per day between 2010 through 2016. We use the diurnal/nocturnal profile relevant to solar photovoltaic generation in the United Kingdom and the aforementioned technical load factors of 11.1% and 23.7% for solar PV and wind turbines, respectively. Using fixed load factors is a simplification, but we believe a more complicated approach would have offered few additional insights. As a hedge to the exposure, the option valuation captures the externalities arising from the three cost categories described above in
Section 3.1 as faced by licensees in purchasing RE output. In closing, option valuation is used to quantify the risk exposure; the possibility that the licensee may have an appetite for risk and would have hedged less, assuming precise replication were possible, is not considered.
5. Conclusions
In our research, using a financial performance metrics and option theory, we have examined the popular FiT Scheme for small and medium-scale facilities. We calculated the returns earned by investors and the indirect cost or externalities imposed upon stakeholders from this form of electricity generation. For the UK market, our research is the first to both quantify the financial returns to investors in RE generation and to analyze its externalities arising from stochastic output. We found that the financial returns earned by investors under the Ofgem-administered scheme were generous, especially for assets enjoying guaranteed markets and prices. We have shown that even cutting incentive tariffs under the scheme by half would still have conferred 9% returns to a largely risk-free investment. In addition to the case for reducing incentives because of generous returns to investors, we have measured the scheme’s externalities under the FiT scheme use, and the theoretical costs of hedging against stochastic RE output under dispatch priority were large. As options were not available to hedge the exposure, substantial costs were borne by licensees in the first instance, in accepting the random output of RE at large incentive prices under dispatch priority, but ultimately, all stakeholders were affected [
107].
While the high fixed capital costs and low load factors of RE mean that incentives are needed to incentivize investment in liberalized electricity markets, arguably, the level of support should be calibrated to the nature of the investment and not ignore wider impacts. Our analysis shows why changes to the UK FiT Support Scheme were needed. Investors were earning excessive rewards for taking little risk. Given the rewards, the level of scheme subscription was not surprising. However, in addition to redressing the generous incentives and tightening of eligibility criteria, a further argument for reform was that the externalities arising through RE generation were at odds with a well-functioning, allocation-efficient electricity market [
108]. Externalities arise whenever a good or service is over-supplied and certain costs are not internalized and hence disregarded by the consumer or producer. Although RE is promoted to redress the externalities of generating electricity through fossil fuels, managing its random output creates externalities for stakeholders. Arguably, large and persistent externalities are not compatible with electricity market objectives: affordability, reliability, and environmental protection. However, notwithstanding their magnitude, the externalities arising from random RE output appear not to have figured in reforms to the FiT incentive program. Although the introduction of capacity payments to utilities in the Act of 2012 may have offset some of these externalities to utilities, such costs must be recovered from consumers and ultimately taxpayers [
109].
Looking back upon the history of the FiT Scheme, we see that its various reforms represented a departure from how smaller-scale facilities had been favored and supported. In the UK, RE generation had grown at an average rate of nearly 25% year-on-year between 2009 and 2015, or 69 GWh in 2010 to over 2.7 TWh by April 2014, which is a thirty-nine-fold increase. By 2015, the UK had achieved a milestone by exceeding 3 GW of renewable capacity and 568,612 FiT installations across Britain, with over 2500 new sites being registered weekly [
89]. However, from setting incentives for RE and leaving markets to carry on, the tariff reductions connote a departure from the liberalized model of electricity markets with largely unqualified support for RE. In implementing a range of applicable prices linked to RE capacity and output, it suggests a growing perception by the authorities that investment in RE needs oversight under current market design [
5]. Although subsequent reforms succeeded in reducing the direct costs in subsidies to RE investors, they did not address the externalities imposed upon incumbent utilities, aggregators, and ultimately society. Given the technological requirements of RE, making it compatible with liberalized electricity markets will remain a challenge.


