1. Introduction
Pollution, fog, icing, and rainfall are the main causes of flashover of outdoor insulation equipment in power grids [
1,
2,
3,
4]. According to the traditional cognition, the flashover voltage of polluted insulators in fog is lower than that in rain [
5,
6]. Consequently, in order to provide the most stringent data for design and application, the pollution flashover performance of insulators needs to be carried out under the most severe conditions. Based on this consideration, fog becomes one of the main ways to wet the insulator in the artificial pollution test. Many data obtained from artificial pollution tests are applied to the design of outdoor insulation and the selection of insulators [
7,
8,
9].
The aforementioned observation seems to be correct for suspension insulators used in transmission lines. However, it is a different story for post insulators used in power stations. Flashover accidents of post insulators in power stations are rare on foggy days, but still occur on rainy days [
10,
11,
12]. Even in a ±800 kV Ultra-High Voltage Direct Current (UHV DC) converter station, there are reports of surface discharge of post insulators on rainy days. This means that rainfall may be the biggest threat to outdoor insulation performance of post insulators in power stations.
In this paper, the flashover of polluted post insulators in rainy weather is referred to as “contamination rain flashover”. There are two necessary preconditions for this phenomenon to happen: one is the accumulation of contamination on the insulator surface and the other is the wetting of the contamination layer caused by rainfall. However, it should be noted that the flashover mechanism of contamination rain flashover may be different from the traditional pollution flashover of insulators.
Previous studies [
13,
14] show that, compared with the pollution flashover of suspended insulators in fog, flashover of power station post insulators on rainy days have the following characteristics. First, most of the discharge occurs in the air between the sheds, rather than along the insulation surface, resulting in the leakage distance along the insulator surface, which is not the decisive factor of flashover voltage. Secondly, there are many suspended water-drops discharging on the edge of sheds instead of large partial arcs on the insulator surface before flashover. It is observed that the occurrence of flashover is the series connection of bridge discharge between multiple sheds. Concurrently, leakage current along the insulator surface is too small to precisely measure before flashover. Thirdly, the existence of suspended water-droplets on the shed edge disturbs the distribution of the electric field along the surface; thus, the traditional calculation model of insulator pollution flashover voltage based on the circuit model is not suitable for the contaminating rain flashover of the post insulator. Furthermore, shed configuration has a great influence on flashover voltage [
13,
14]. The decrease of insulation performance of polluted post insulators in rain is mainly due to the shed bridging by water-flows; therefore, the optimization of shed configuration plays a significant role in preventing flashovers.
In this work, artificial contamination rain flashover tests were carried out on a real large-diameter post insulator under DC high voltage. Special focus was given to the discharge behavior of suspended water-drops on shed edges during artificial rain and its influence on the flashover process. A simulation model was then established by COMSOL Multiphysics® (Version 5.5, COMSOL Inc., Stockholm, Sweden) to simulate the movement process and shape change of raindrops on the surface of the insulator shed. Finally, the influence of different factors on the dynamic characteristics of suspended water-drops were analyzed. The purpose of this paper is to reveal the mechanism of contaminating rain flashovers of a large-diameter post insulator and to provide a new idea for preventing flashover accidents of outdoor insulation equipment in power stations on rainy days.
2. Experimental and Simulation Methods
2.1. Artificial Contamination Rain Flashover Test
This work used the same type of large-diameter composite post insulator as the actual project (±800 kV UHV DC project from Yunnan to Guangdong), which was from the same manufacturer. The parameters of the specimen are shown in
Table 1. In real applications, the whole post insulator is composed of several sections. It has been found that when the insulation height is less than 10m, the pollution flashover voltage of the post insulator increases linearly with the increase of insulation height [
5,
6,
7,
8,
9,
10,
11,
12,
13,
14,
15]. Therefore, only one section of the entire insulator was used in this test to reduce the test voltage.
The specimens were treated by the solid contamination layer method before the flashover test [
16,
17]. Salt deposit density (SDD) and non-soluble deposit density (NSDD) were parameters that characterized the surface contamination severity on the insulators. In this study, the values of SDD and NSDD were 0.03 mg/cm
2 and 0.18 mg/cm
2, respectively. The converter station played an important role in the whole EHV (Extra-High Voltage)/UHV DC project, the site selection of which needs a strict geological, hydrological, meteorological, and natural environmental survey and investigation. Therefore, the pollution severity of the station usually belongs to the light level [
18]. The selection of the test values of SDD and NSDD mainly considered the actual operation experience. According to previous measurement, the average value of SDD was about 0.03 mg/cm
2 and the ratio of SDD to NSDD for ultra-high voltage (UHV) post insulators in South China was 1/6.
The experiment was carried out at the National Engineering Laboratory (Kunming) for UHV Engineering Technology. The test hall was located 2100 m above the sea level, which had an average air pressure of 794.5 hPa. The DC generator could provide a DC voltage of ±1000 kV, with a ripple factor of less than 3% and a rated current of 2 A. The DC test voltage polarity was negative, which usually assures lower flashover voltages compared to positive polarity [
5]. All the test facilities met the requirements of International Electrical Commission (IEC) standards of artificial pollution tests on high-voltage insulators [
16,
17]. The test setup and procedure were the same as that used in our previous study [
13,
14], as illustrated in
Figure 1 and
Figure 2.
The artificial rainfall system included the adjustable motor, water pump, water storage tank, filter, valve, rain shelf, control, and protection device, etc. There were 13 horizontal rain rods on the rain shelf from top to bottom. Each horizontal rain rod had 5 detachable nozzles with unified models, which could be adjusted according to the required intensity of rainfall. The water pressure could be adjusted by the valve to realize the adjustment of the nozzle output. Nozzles with diameters of 0.7 mm and 2.0 mm were selected, respectively, to achieve the intensity of rainfall of 2 mm/min and 10 mm/min.
Table 2 includes the parameters of the artificial rain used in this work. During the tests, the ambient temperature of the laboratory was maintained between 17 and 23 ℃, and the relative humidity was between 65 and 72%. The discharge was recorded by three Canon D700 cameras (Canon Co., Ltd., Oita Prefecture, Japan) arranged in an equilateral triangle next to the test specimen.
2.2. Simulation Method
In the laboratory, it was very difficult to accurately measure the electric field along the surface of the large-diameter post insulator. Fortunately, finite element simulation is an effective means to analyze the electric field and potential distribution around insulators. In this work, COMSOL Multiphysics
® was used to build models of the post insulator with water-drops on its surface. Firstly, the electric field around sheds and water-drops was calculated to analyze the starting position of discharge, as well as the distortion of the electric field along the insulator surface caused by the suspended water drop. Secondly, the movement and deformation process of the water-droplet on the shed surface were analyzed by solid–fluid coupling simulation to verify the relationship between the shape of the water-droplet and the discharge.
Figure 3 shows the two-dimensional simulation models of the electric field and solid–fluid coupling, respectively.
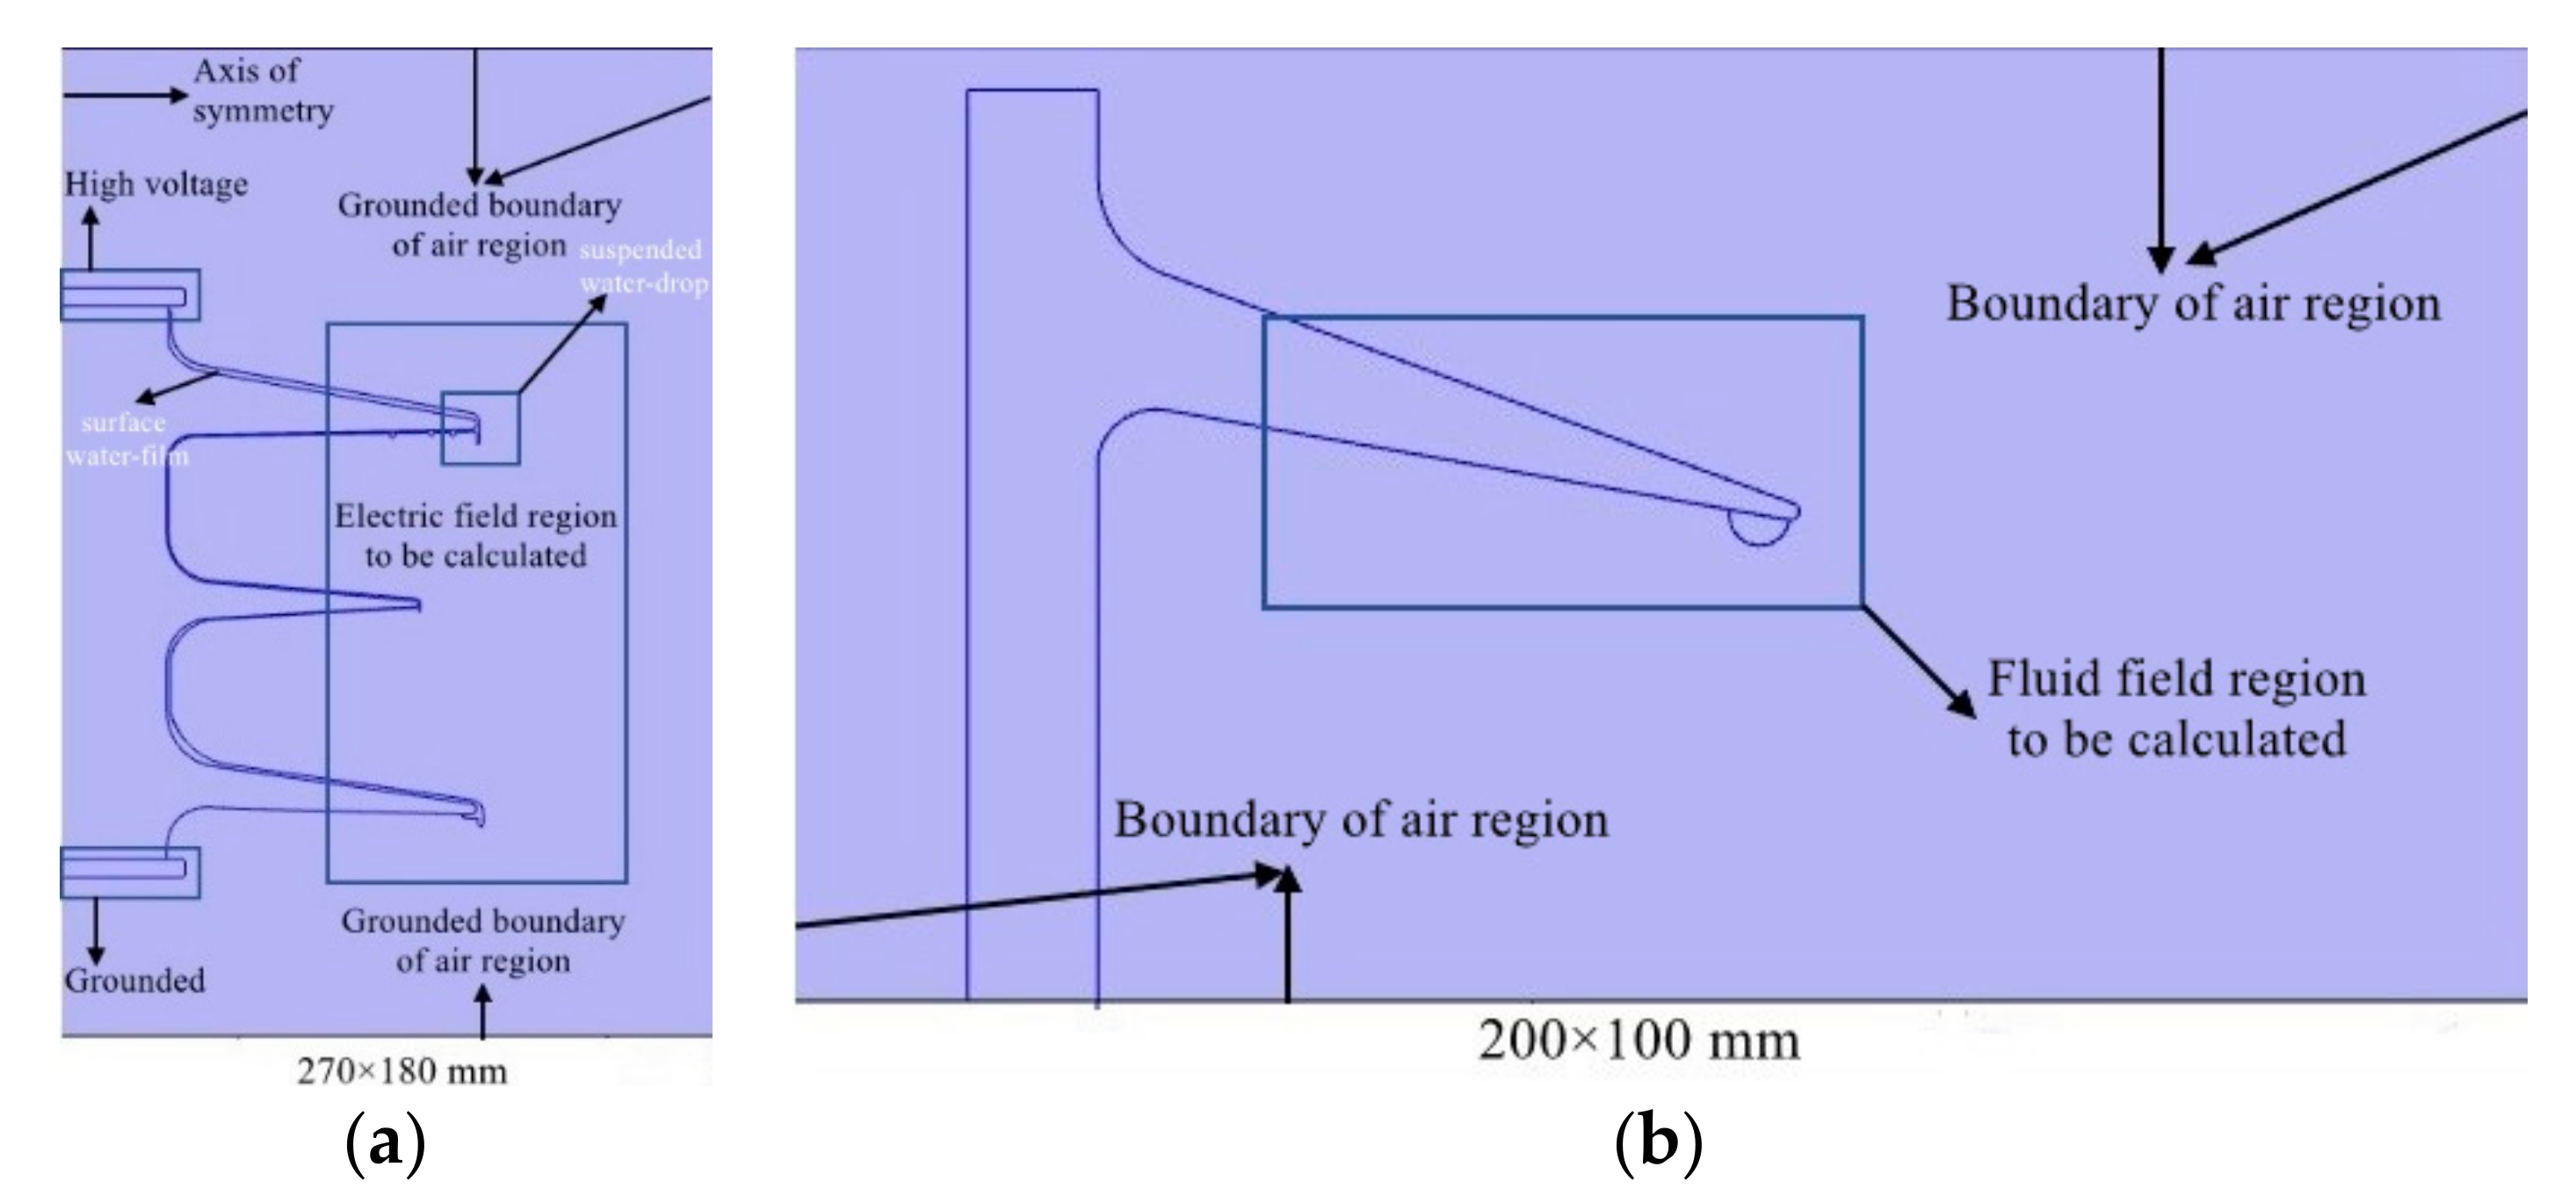
In the electric field simulation, properties of materials and boundary conditions is illustrated in
Table 3 and
Figure 3. In order to improve the computational efficiency of the computer’s random-access memory (RAM), the dimension of the established model was reduced proportionally according to the actual size of the test sample. The value of the voltage set at the high voltage end of the model was 100 kV DC.
In the solid–fluid coupling simulation, two interfaces of “two-phase and level set laminar flow” and “fluid–solid coupling with fixed geometry” were coupled and solved at the same time by the transient solver with phase initialization. The shape change and motion trajectory of water-droplets could then be obtained. Properties of materials and boundary conditions are also illustrated in
Table 3 and
Figure 3.
In previous studies, parameters of shed configuration of insulators mainly refer to the distance between sheds, the extension length, and the combination of sheds [
13]. However, the above-mentioned parameters do not directly affect the shape of water-droplets on the insulator surface, let alone the discharge of water-droplets at the shed edge. In fact, the shape of water-droplets on the surface is significantly affected by the angle and edge curvature of the shed. Consequently, the influence of these two factors on the morphology of surface water-droplets was specifically studied in the simulation.
3. Results and Discussion
The outdoor characteristics of the polluted post insulator under rain conditions are determined by factors including conductivity of rainwater, intensity of rainfall, angle of rainfall, and surface contamination, which has been studied in earlier work [
13,
14,
15,
16,
17,
18,
19]. In addition, the configuration parameters of insulators, such as the distance between sheds, the length of shed overhang, the shed diameter, and the combination of sheds, also affect the rain flashover voltage, as mentioned previously [
13]. This paper mainly studies the induced mechanism and development process of discharge that occurs on polluted large-diameter composite post insulators. This work also investigates the behavior and morphological characteristics of rainwater on the insulator surface and their effect on the discharge. Based on the experimental arrangement of this paper, the whole process of discharge and flashover of the polluted large-diameter post insulator was recorded by the camera in 2 mm/min rainfall. A flashover test was carried out at least 10 times under the same conditions.
3.1. Induced Mechanism and Behavior of Surface Discharge
3.1.1. Surface State of Polluted Post Insulators in Rain
When the polluted post insulator encounters rainfall, rain drops collide with the insulator sheds, causing severe deformation while wetting the surface contamination layer. Concurrently, due to the excellent hydrophobicity of composite material [
20], rainwater usually exists on the surface in the form of dispersed water-droplets in the beginning. With the continuous supplement of rainwater, continuous water-flow forms on the shed gradually, as well as many suspended water-droplets on the edge of shed because of inclination and gravity. These suspended water-droplets, which modify the electric field distribution along the insulator surface, are usually distributed in the periphery of the sheds. According to the electric field simulation model established in
Figure 3, the electric field intensity and potential distribution around the sheds and water-drops were simulated.
Figure 4 illustrates the results of a typical electric field distribution of the model.
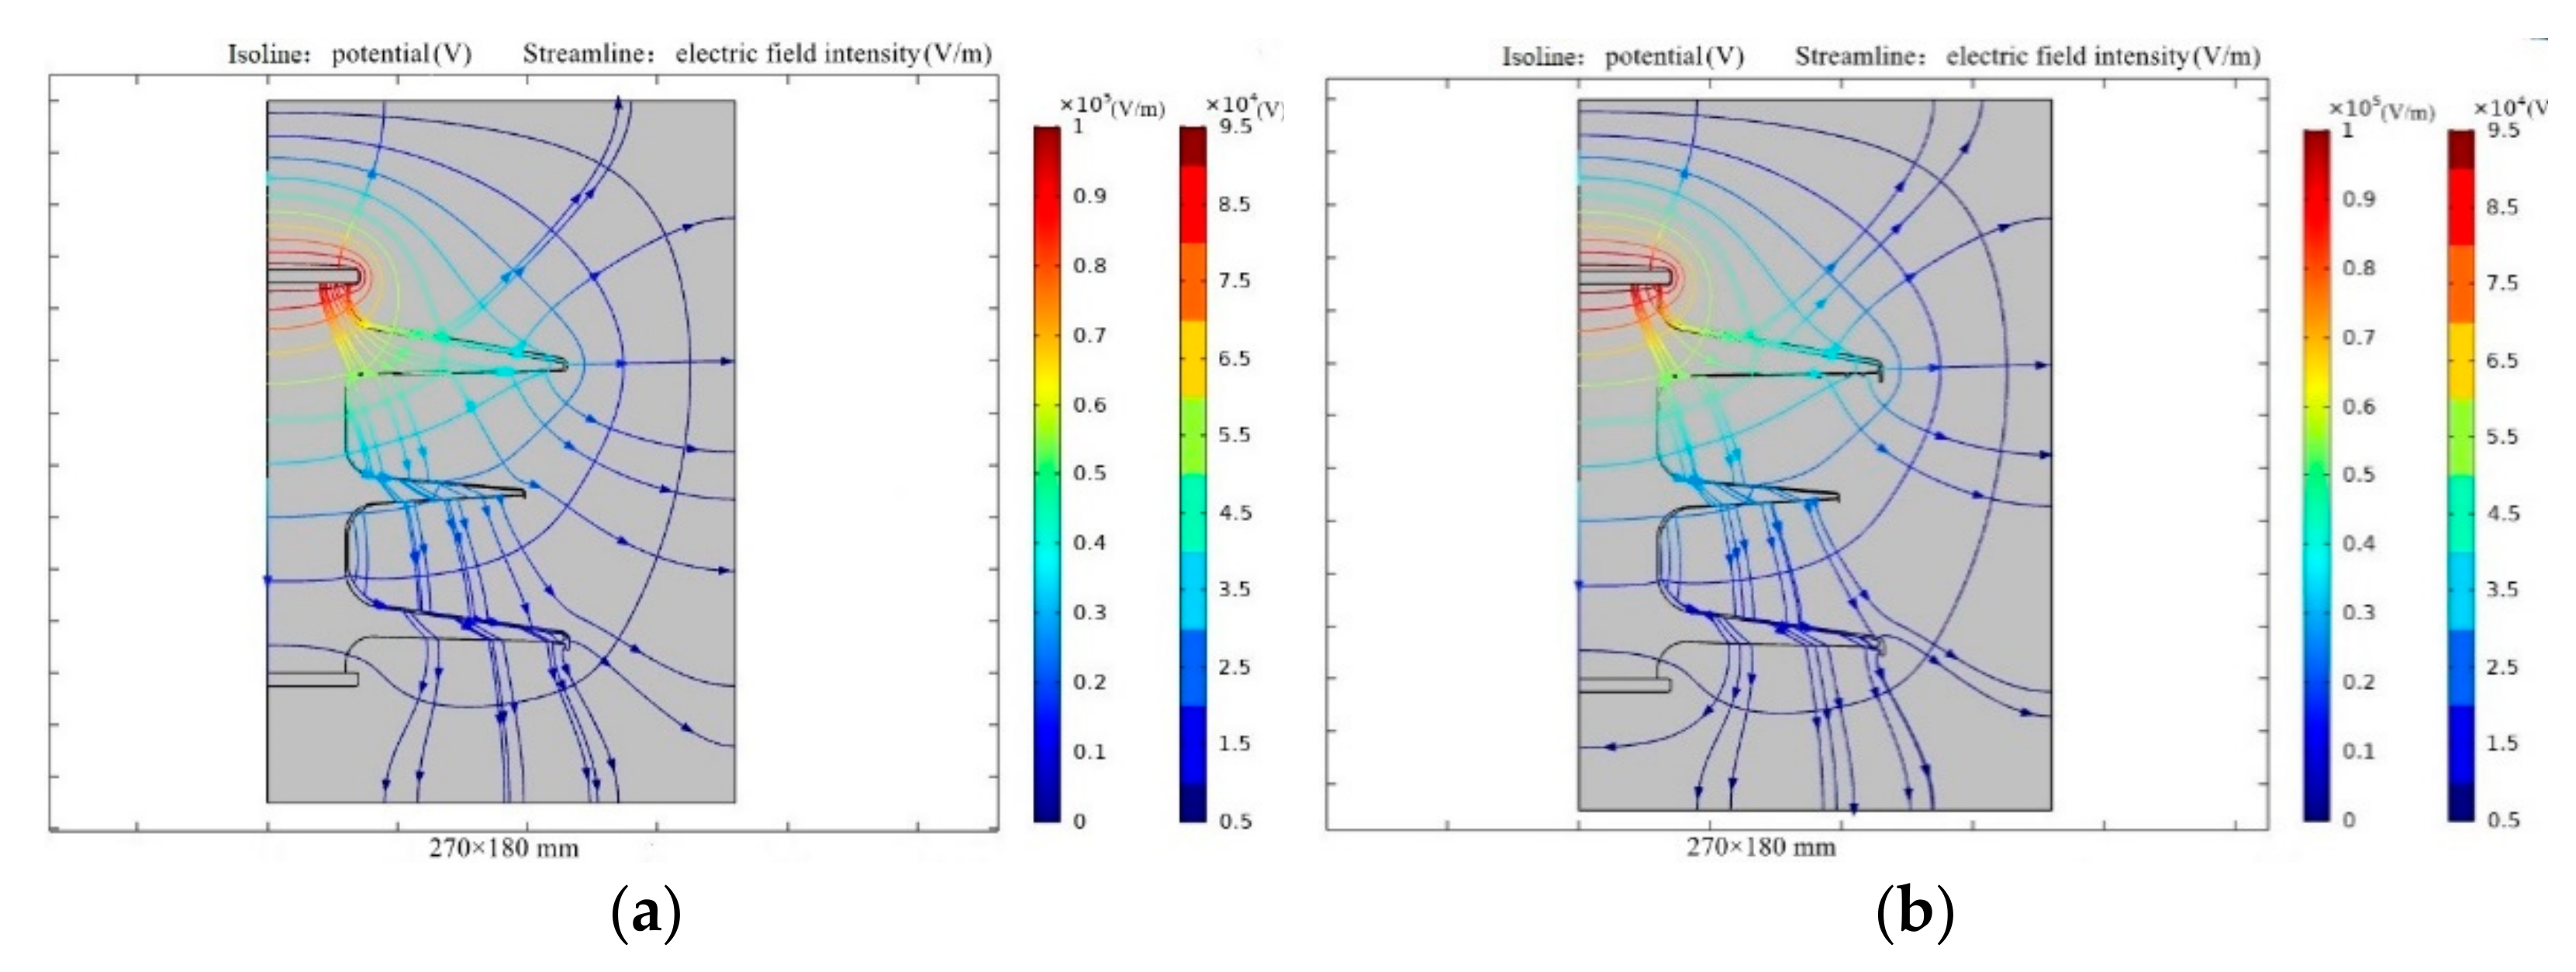
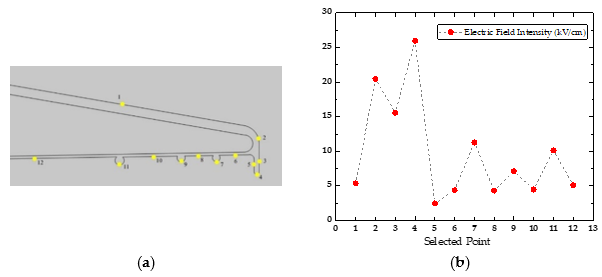
The working electric field of the UHV post insulator belonged to a non-uniform electric field, for which the electrical strength of air was lower than 30 kV/cm. In the simulation model of the electric field, 12 points on shed surface were selected and the values of electric field intensity of these points were compared, as shown in
Figure 5. It was found that the most concentrated position of the electric field was at the apex of the suspended water-drop and the maximum value of electric field intensity was about 26 kV/m, where the air was easy to be ionized and discharge occurred first.
On the contrary, the lower surface of the shed and rod are unlikely to be wetted directly by rainwater, so they usually stay dry in rainy weather. Therefore, the wetted state of the insulator surface was inhomogeneous, which further modified the electric field distribution along the surface.
As the surface pollution layer of the insulator is wetted by rainwater, it was also taken away by the water-flow. The removal of the pollution layer lead to the gradual reduction of the surface pollution severity and the increase of the conductivity of rain drops on the shed surface. The rainwater on the surface was affected by the viscous stress between liquid and air, the pulling force produced by the capillary effect on the surface of the material, the surface tension of the fluid, and the gravity. When the rainwater moved from the upper surface to the edge of shed, the speed was reduced to zero and the above forces reached a balanced state. Therefore, there were many water-drops hanging on the edge of the shed. The conductivity of such suspended water-drops was higher than that of rainwater. Considering the variation of the electric field, surface discharge generally started from these suspended water-drops.
3.1.2. Discharge Characteristics and Flashover Process
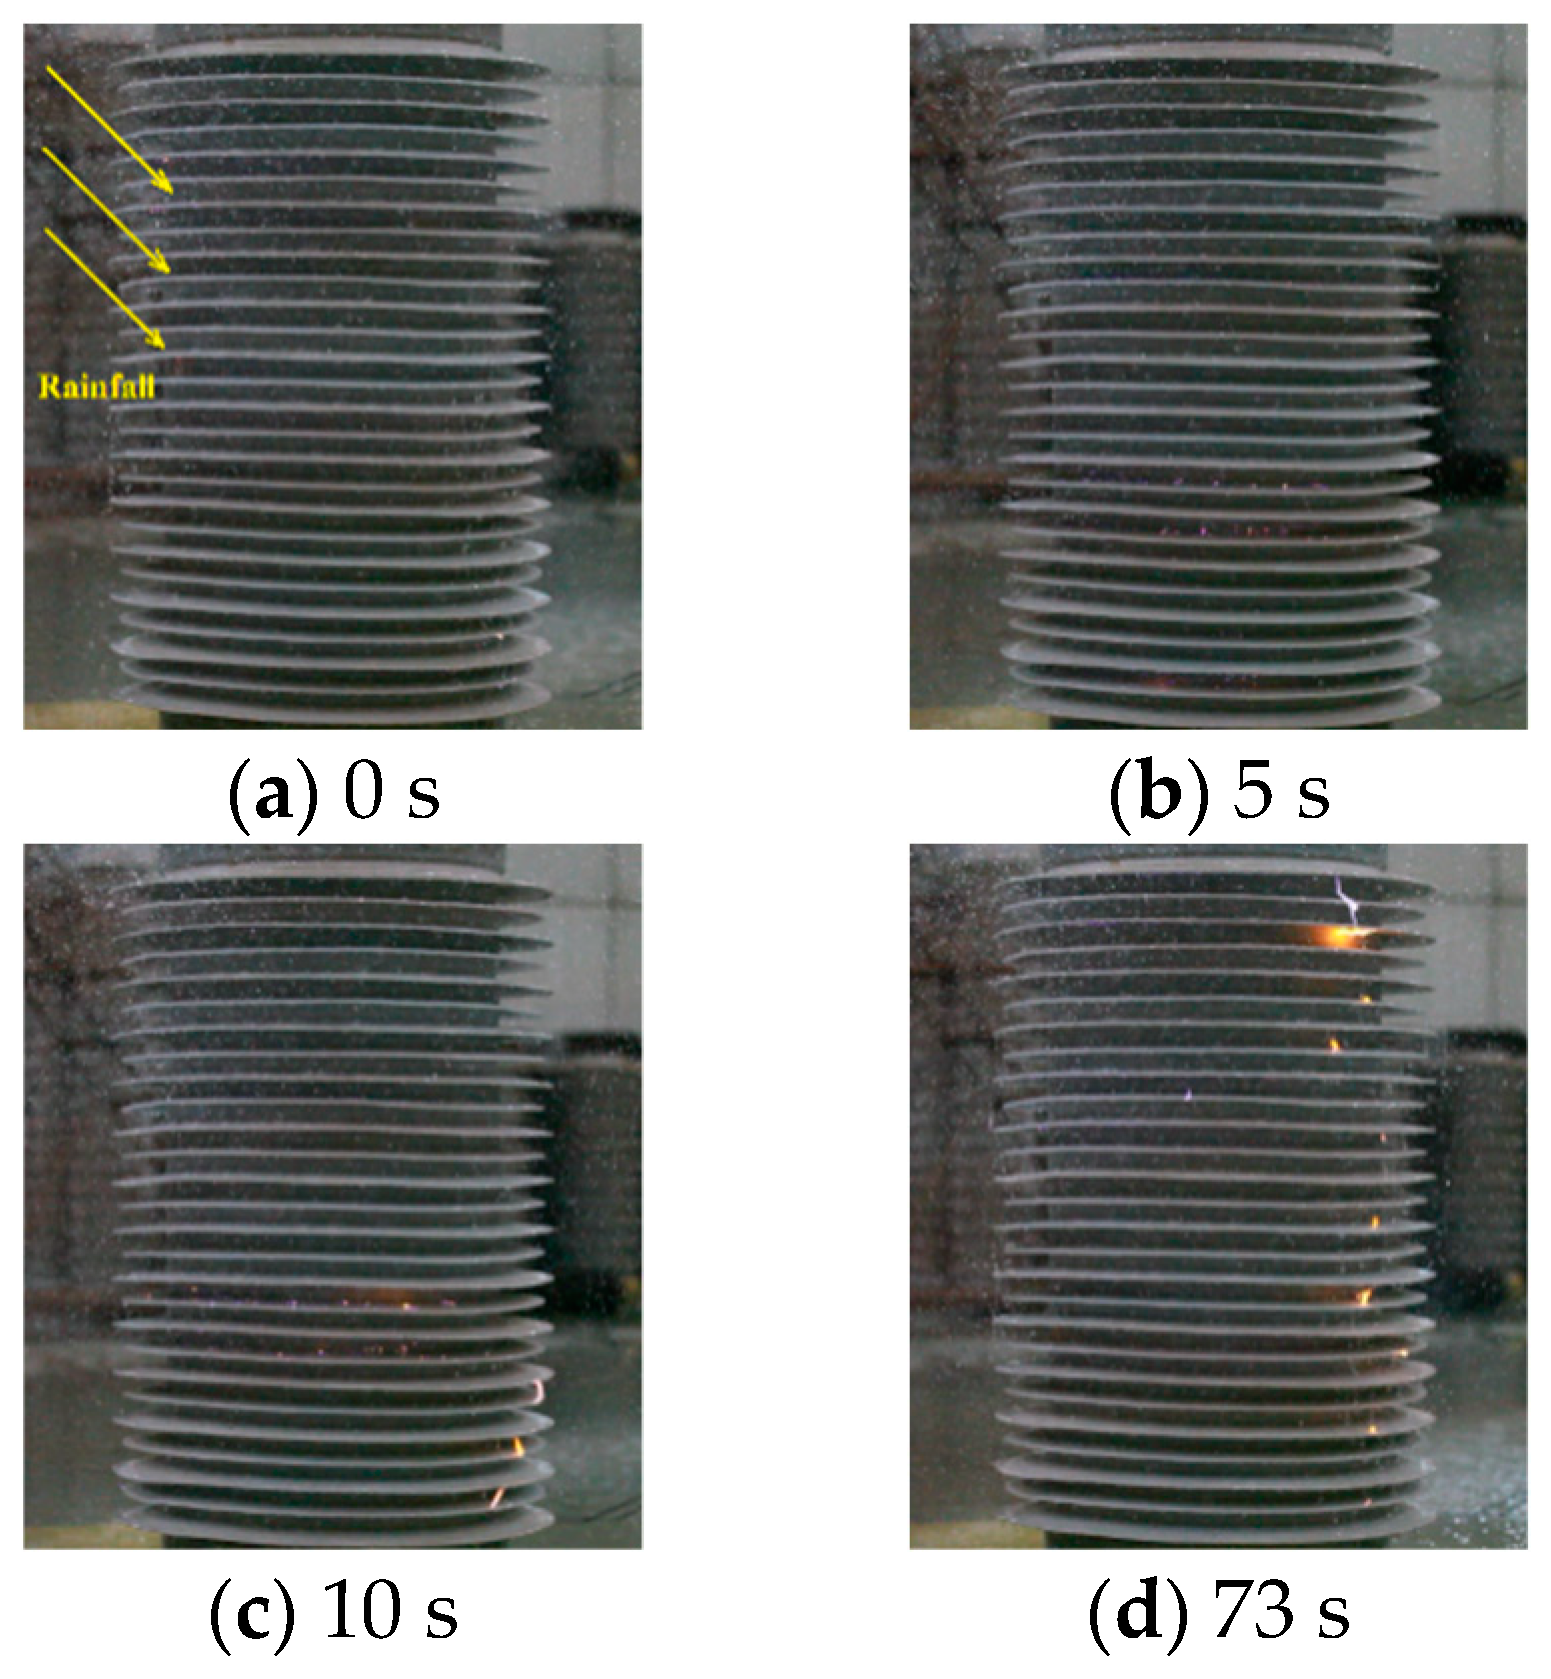
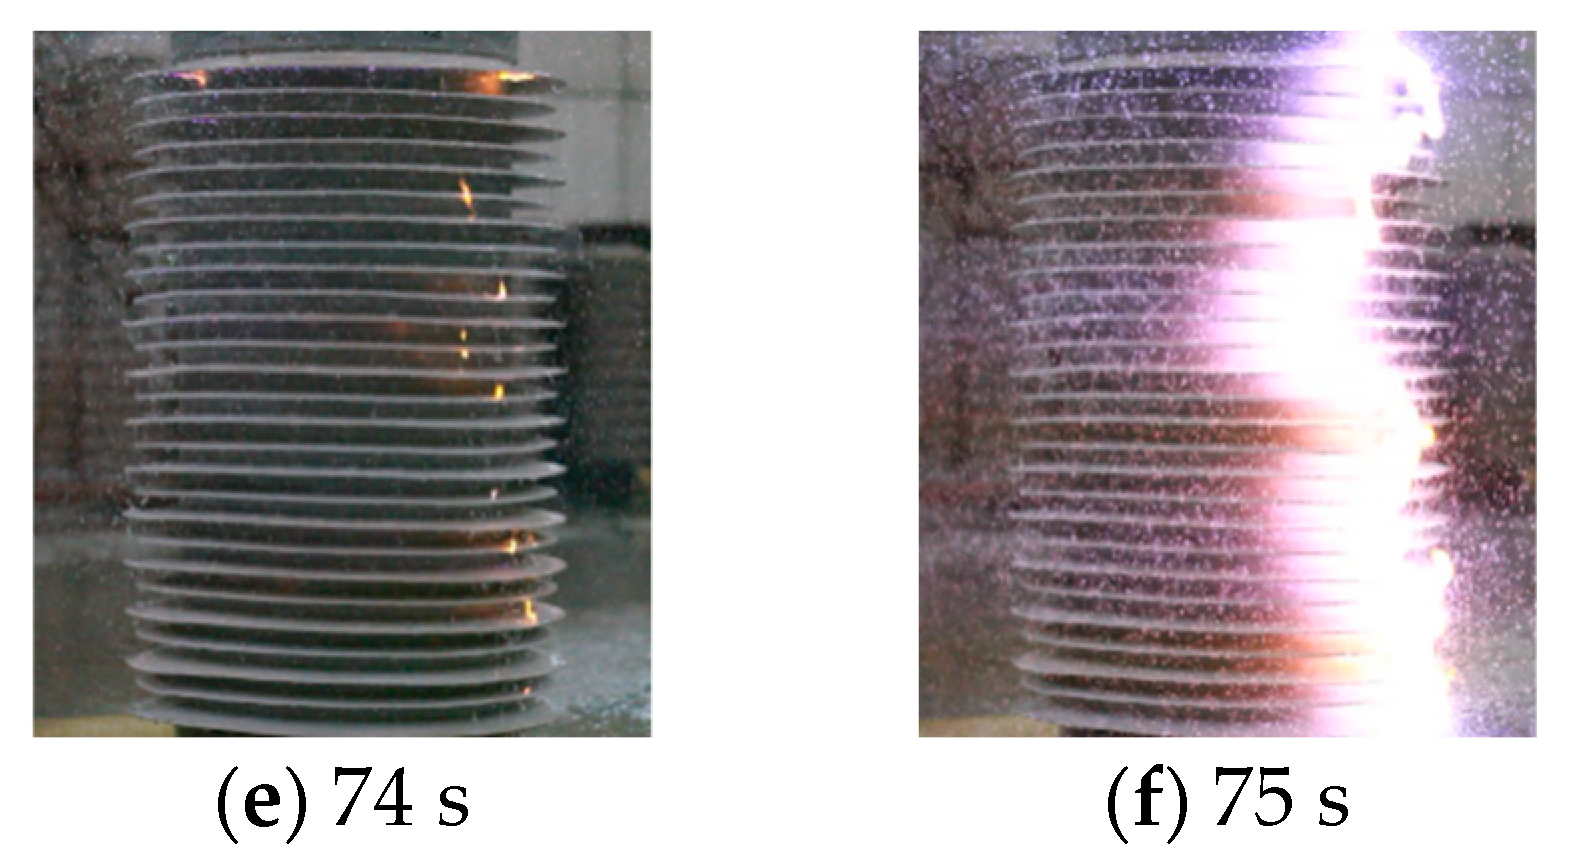
Figure 6 shows the whole process of discharge of the polluted specimen in artificial rain with a rainfall intensity of 2 mm/min and an applied voltage of 230 kV. In more than 10 flashover tests, flashover occurred just within 3 min after the artificial rainfall system was turned on.
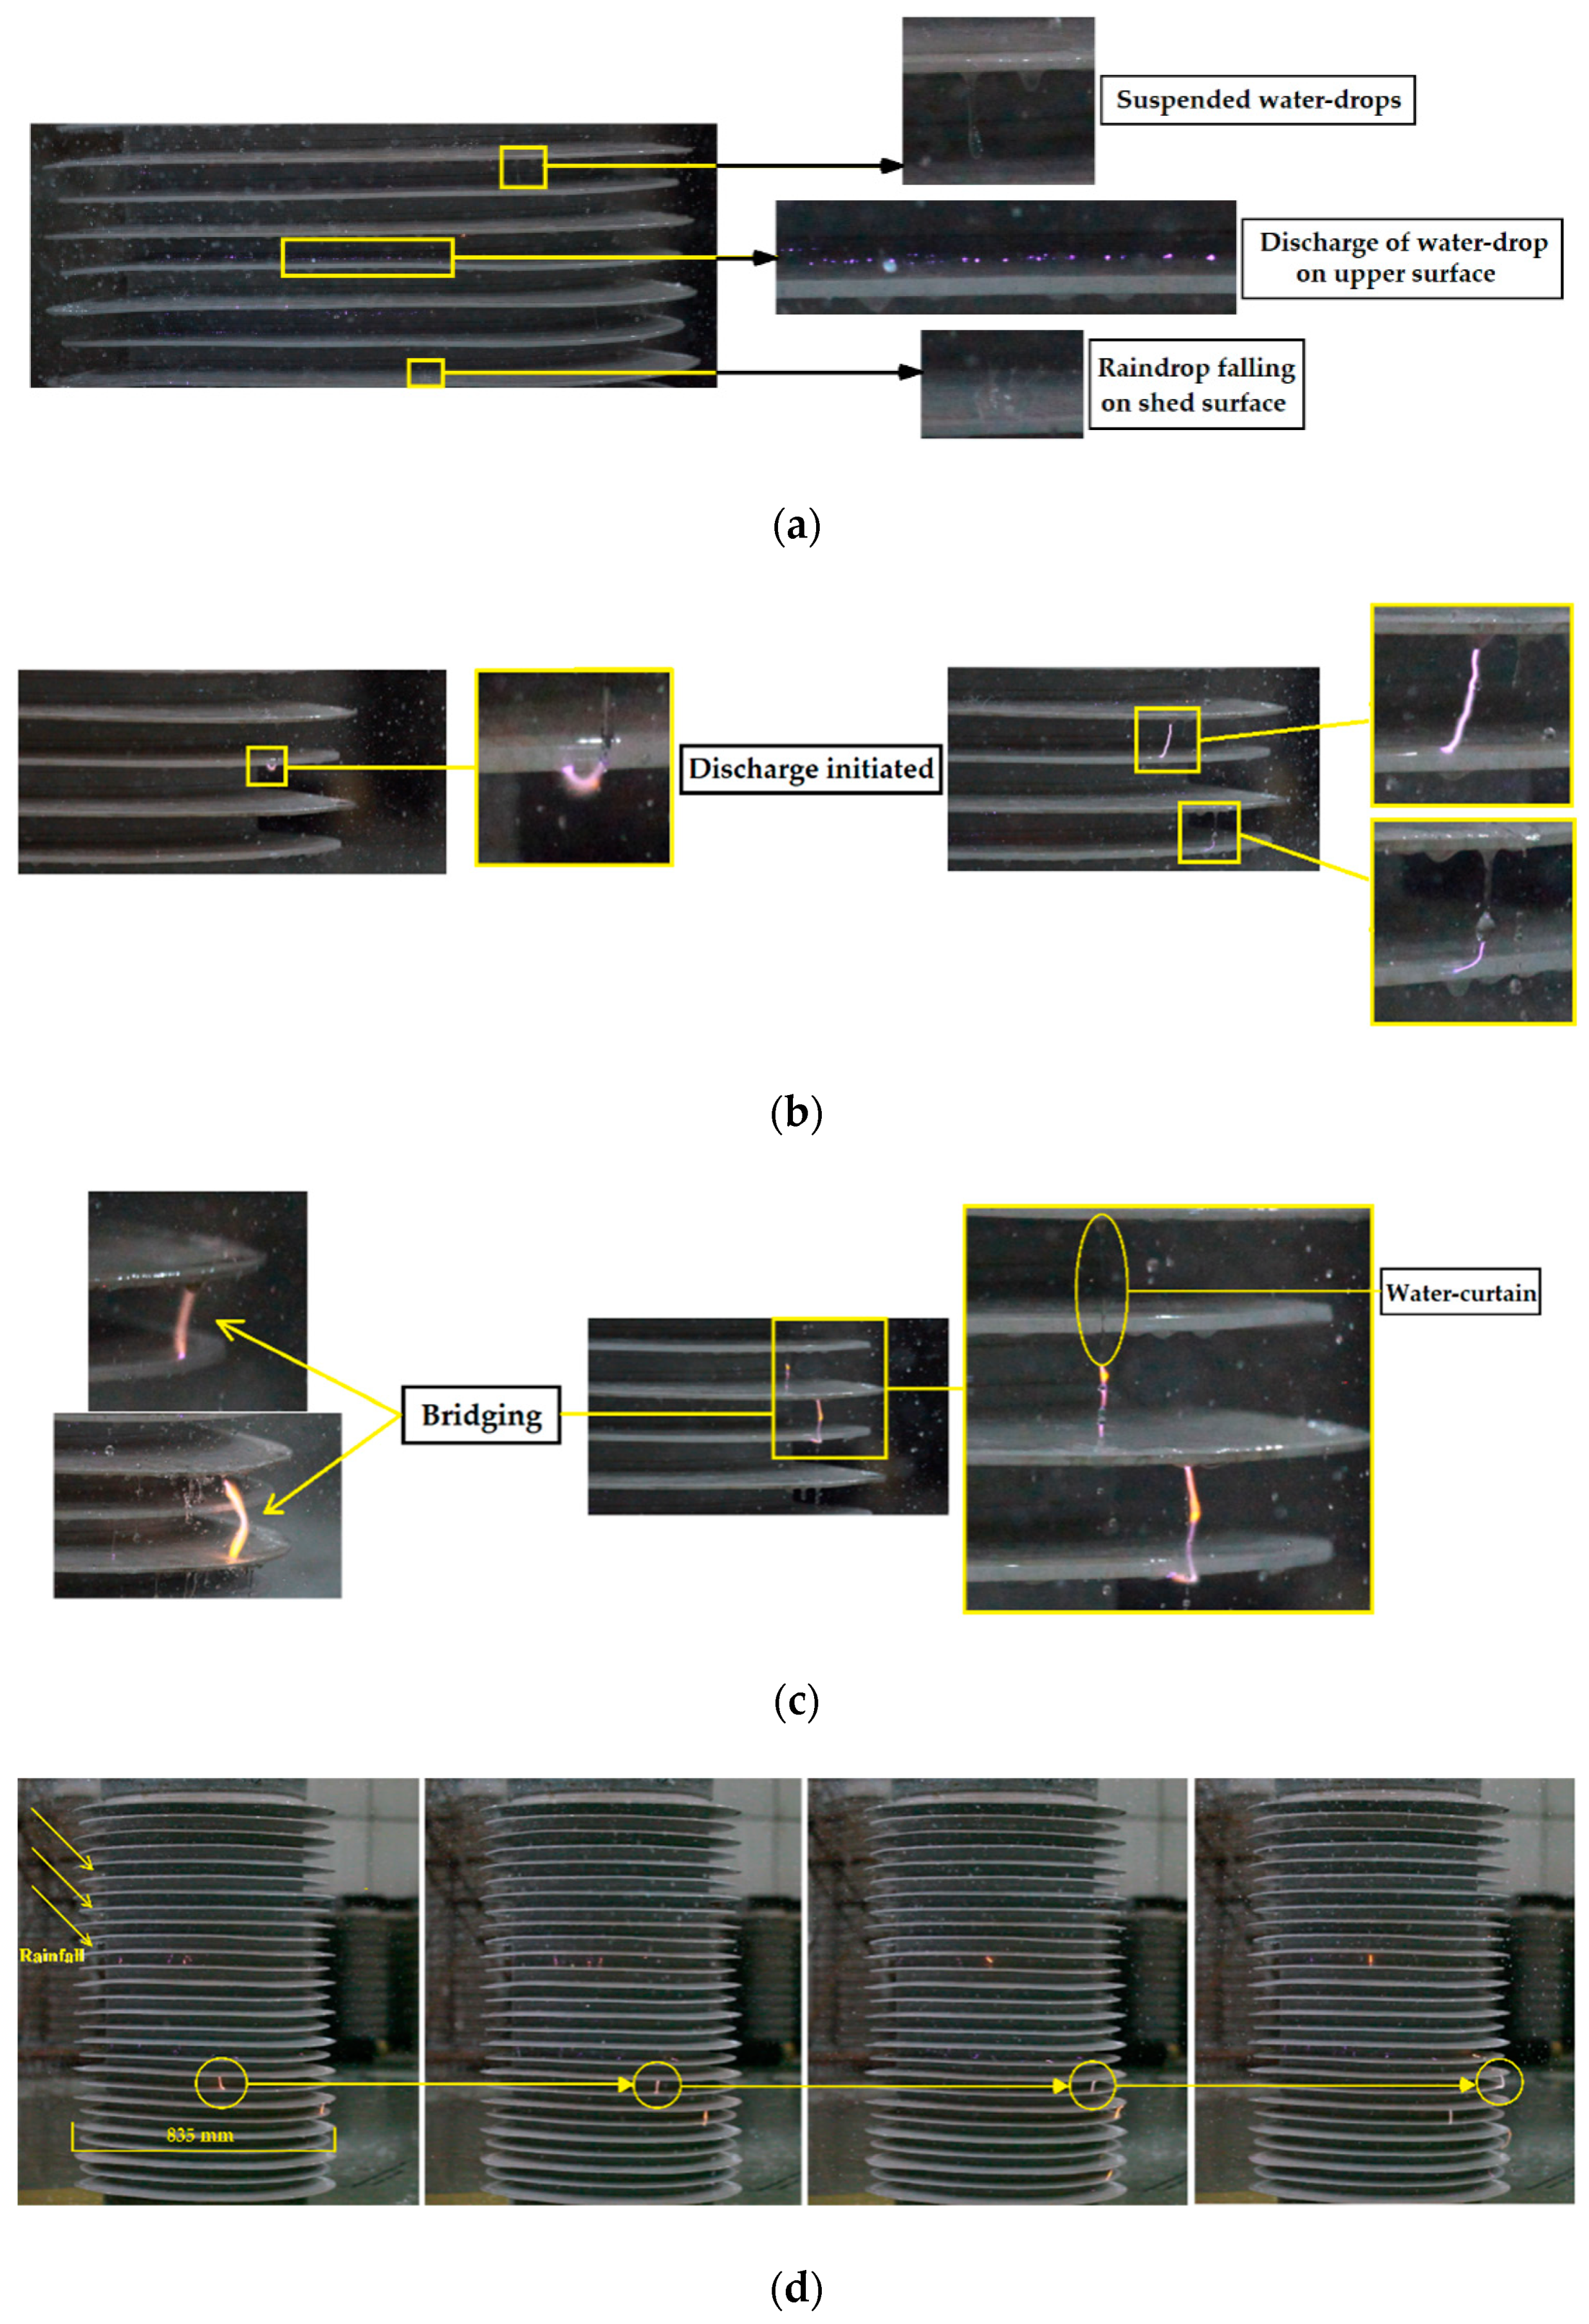
Figure 7 shows more details of the discharge of a suspended water-drop.
Under continuous rainfall, the development of discharge and the arcing process can be described as follows:
Discharges first take place in the form of corona around the discrete water-droplets on the upper sheds. As mentioned above, the existence of these water-droplets is due to the good hydrophobicity of the materials. Previous studies have shown that the maximum electric field strength of the water-droplets on the upper shed appears at the interface between the liquid and the shed surface, where air is ionized [
3,
4,
5,
6,
7,
8,
9,
10,
11,
12,
13,
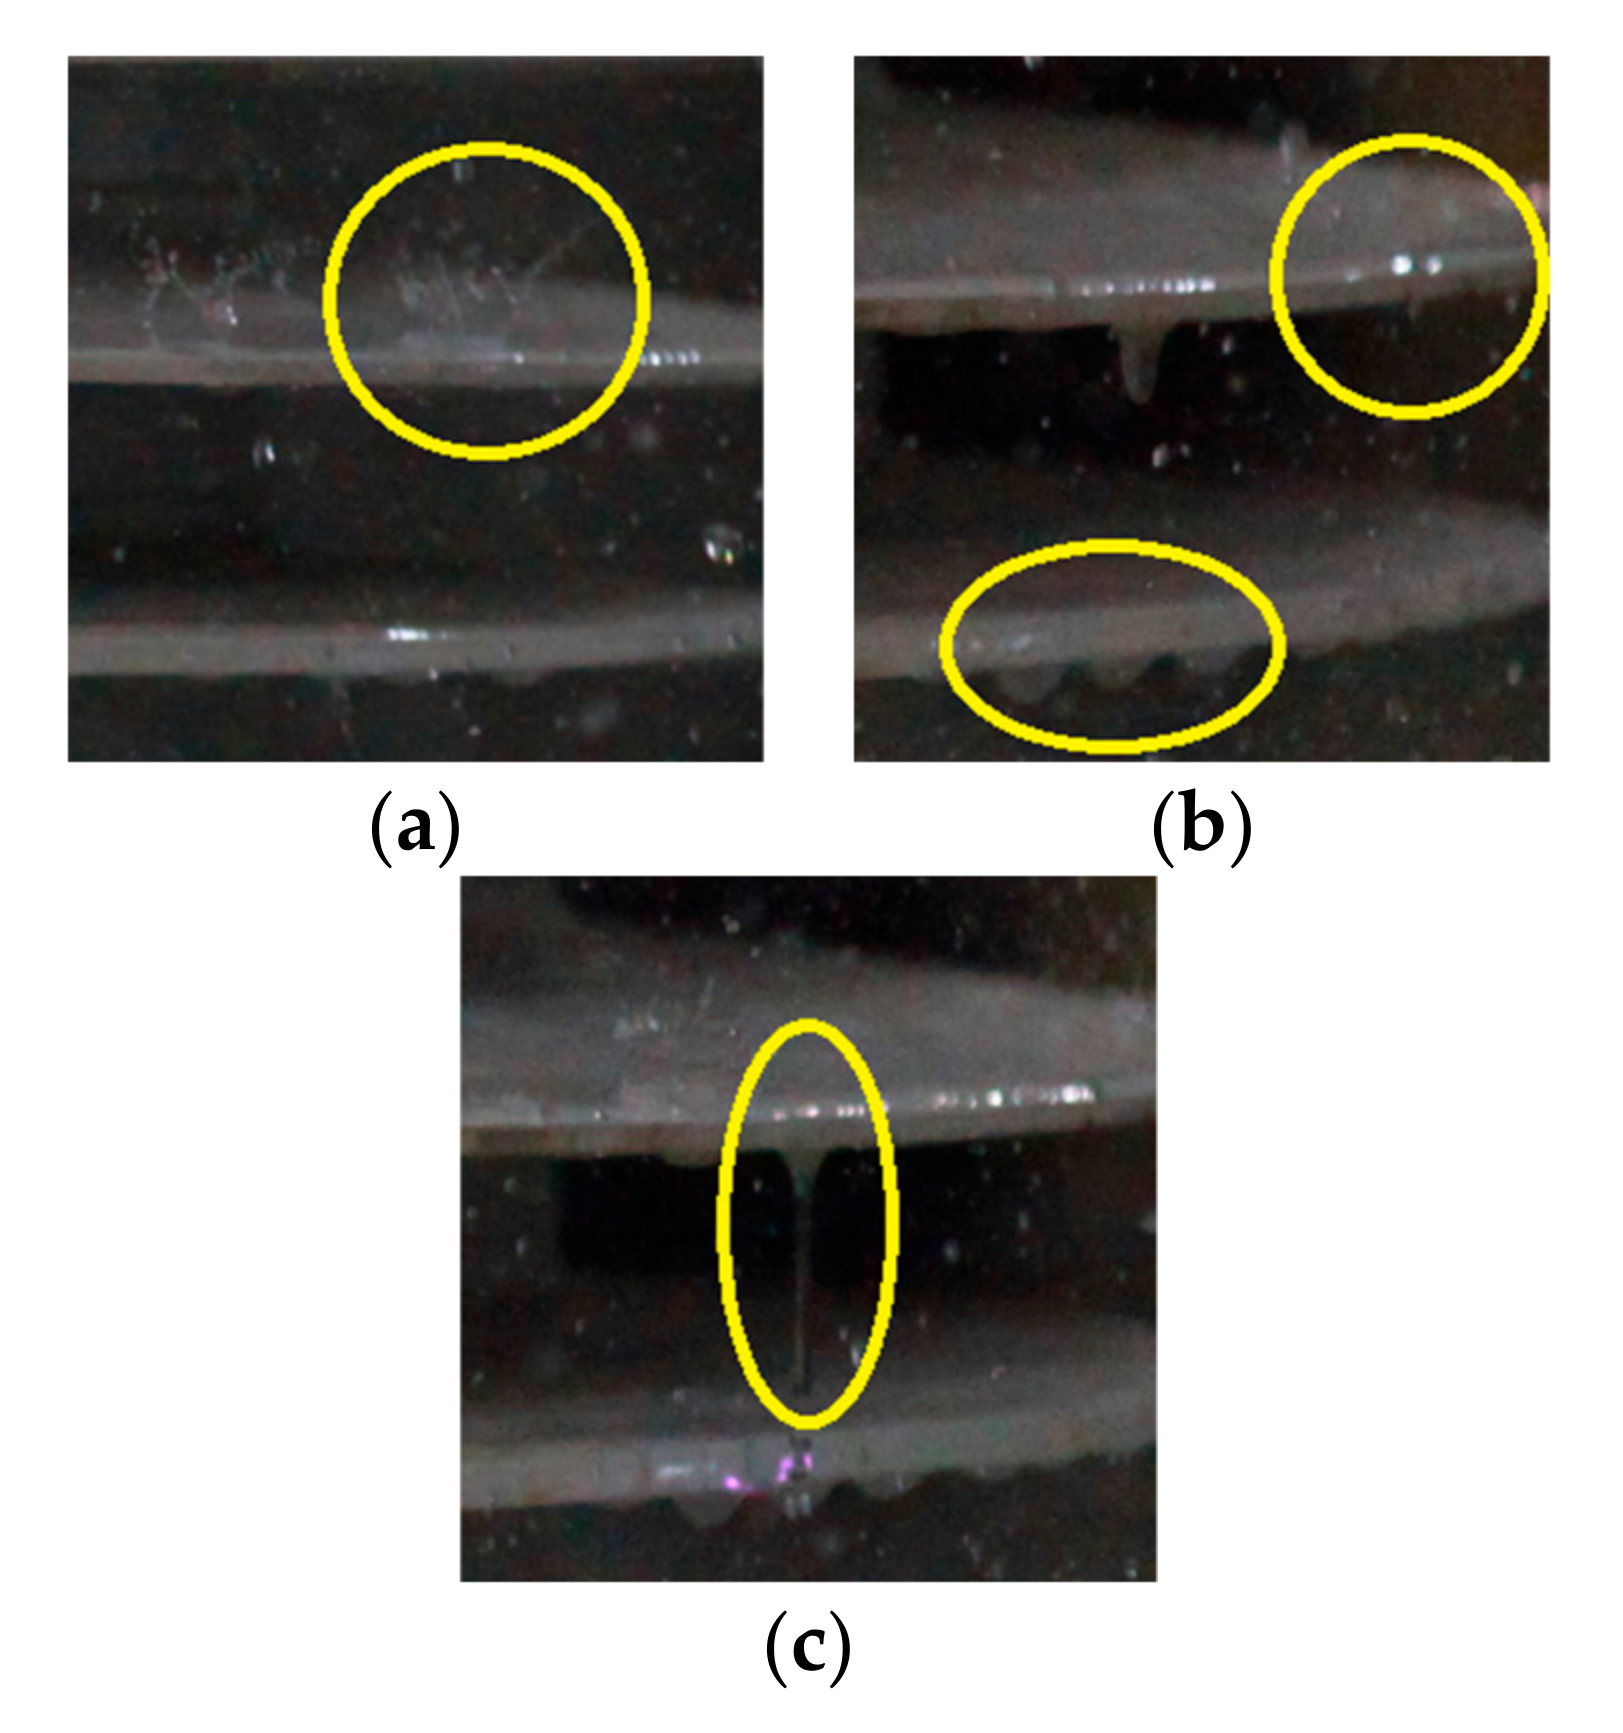
14]. These corona discharges did not further develop into an arc, because the shape of the water-droplets on the upper shed did not change significantly, resulting in no further distortion of the electric field intensity around the water-droplets. Most of these corona discharges looked blue or purple, as shown in
Figure 7a.
When water-flow forms on the upper shed, many suspended water-droplets will appear along the circumference of the shed edge. During the test, the intensity of water-flow on the surface of the insulator shed was small, and the velocity was slow at the beginning of rainfall. Therefore, the volume of suspended water-drops on the shed edge increased slowly and a stable shape could be maintained for a relatively long time under the combined action of several forces. The discharge initiated at the apex of the suspended water-drop developed into the form of a streamer propagated along the air gap between sheds, as shown in
Figure 7b. The development path of discharge may also be along the insulation surface; however, the air gap will be the main development path of this kind of discharge, which has been explained in our previous research [
13,
14].
With the increase of the time or intensity of rainfall, the water-flow on the surface was accelerated and enhanced, which lead to a rapid increase of volume and gravity of the suspended water-drop. Consequently, a stable shape was difficult to maintain. When the suspended water-droplet was elongated, discharge at the apex developed from streamer to an obvious arc, which was mostly yellow or orange, as shown in
Figure 7c. If the distance between insulator sheds was not large enough, a water-curtain bridged the adjacent sheds, which made the creepage distance invalided so as to reduce the flashover voltage of the whole insulator.
It was found that the arc discharge of the suspended water-drop was unstable. It tended to drift away from the insulation surface and some arcs then move laterally along the outer edge of the shed.
Figure 7d shows a bridging arc with a duration of about 1.5 s, and an obvious transverse movement can be seen. This is because the temperature of the discharge plasma was high enough to quickly evaporate the water and the vapor pressure pushed the arc to drift away. Concurrently, many suspended water-droplets were closely distributed along the circumference of the sheds in the artificial rain, which made it possible for discharge to develop at various positions along the edge of the shed. Consequently, the discharge plasma with very little mass moved laterally under the combined action of vapor pressure, thermal buoyancy, and wind generated by air flow. This phenomenon is not common in suspension or small-diameter insulators, because once the arc drifts laterally, the air ionization conditions of adjacent positions will no longer exist due to the smaller transverse size of insulators, thus the arc will be difficult to maintain.
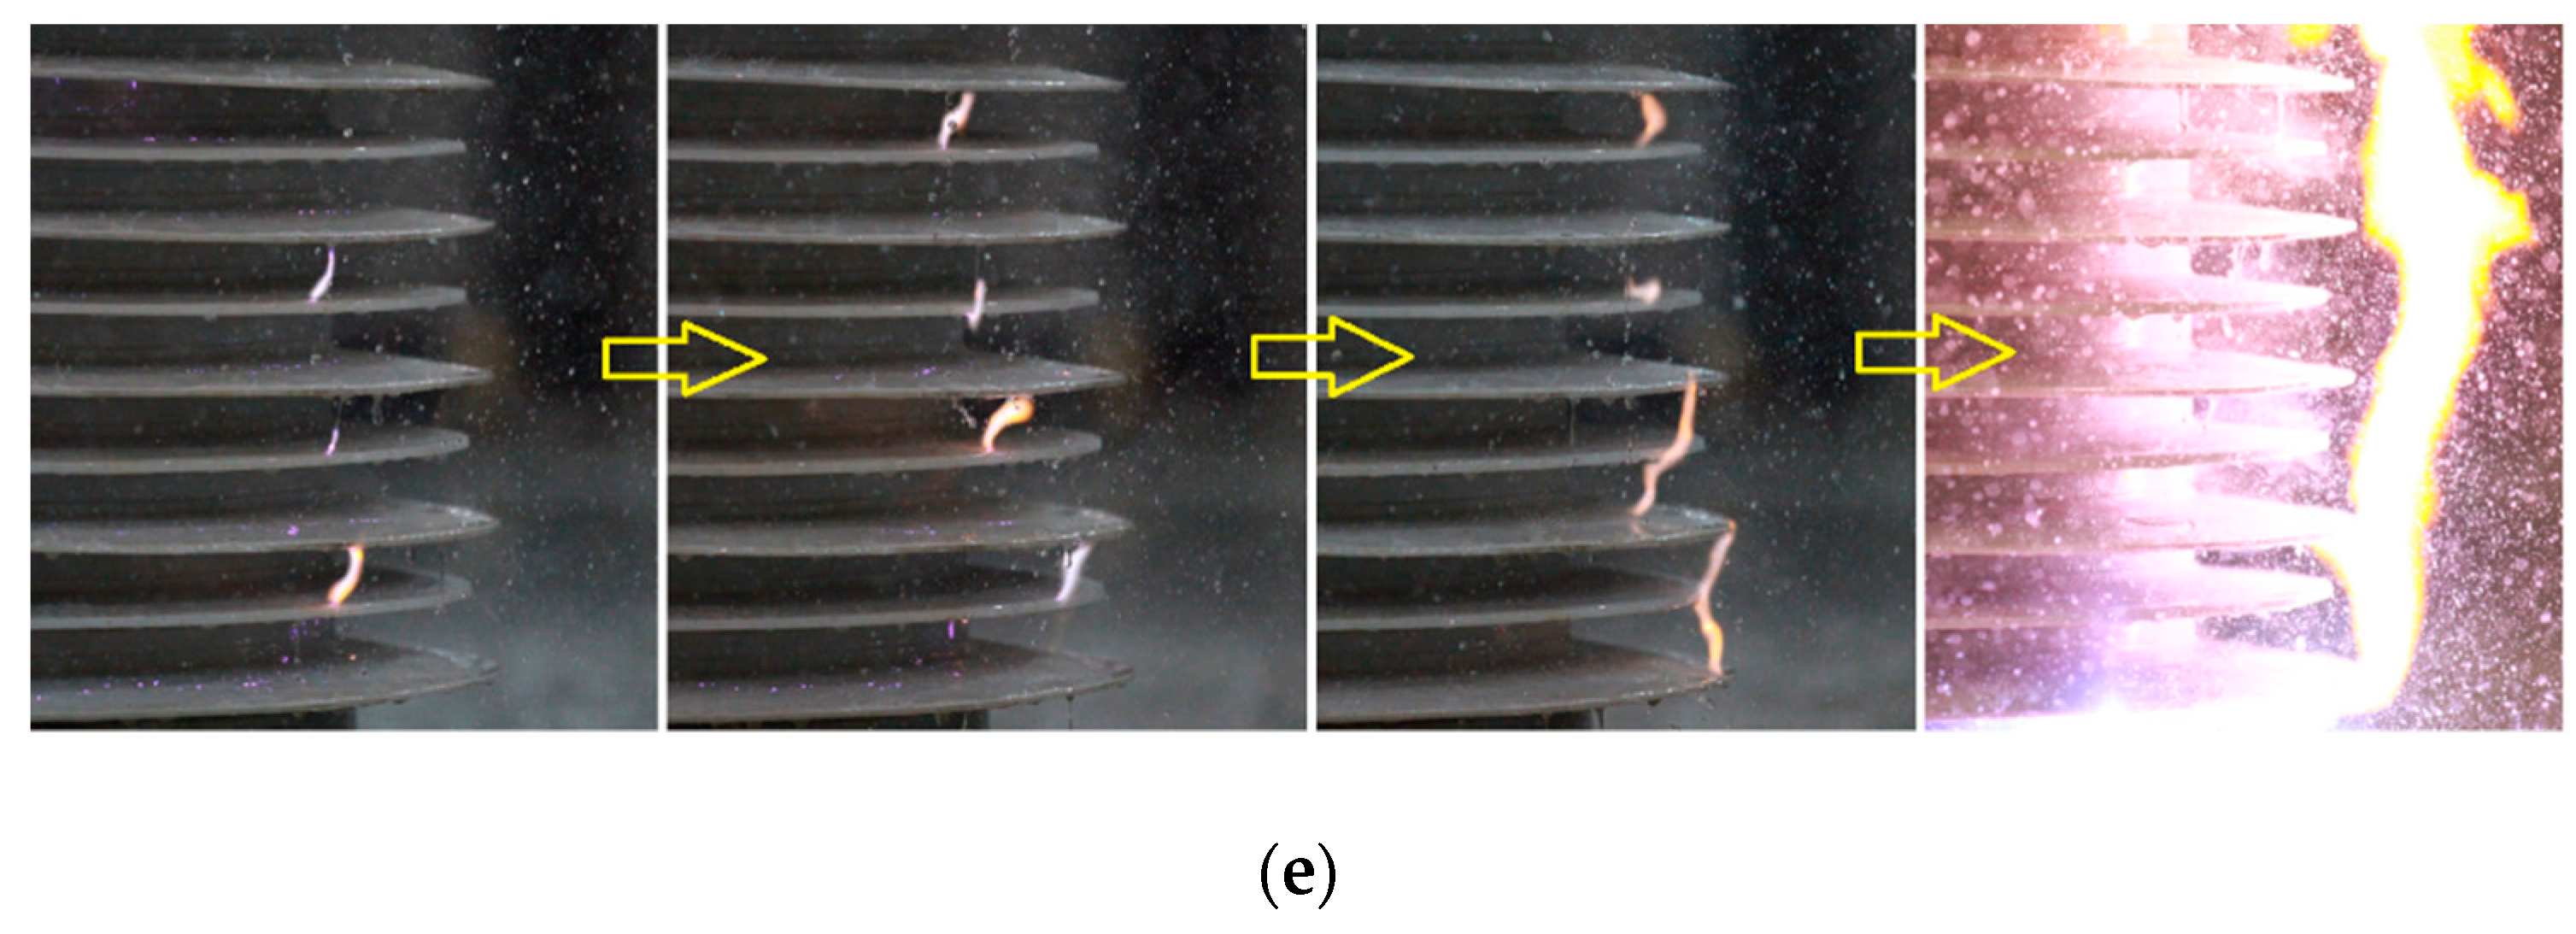
In the vertical direction, the drifting arc discharges initiated from suspended water-drops on one side, which connected together to form a larger arc bridging multiple groups of sheds, as shown in
Figure 7e. This greatly reduced the insulation performance of the whole insulator, and flashover occurred suddenly. In the rain flashover of the polluted large-diameter post insulator, there was no obvious creepage process of the arc along the insulation surface, which was different from the traditional pollution flashover of suspended insulators. The flashover was caused by the sudden connection of series of small arcs between multiple sheds.
3.2. Morphological Characteristics of Suspended Water-Drop on Shed Edge
Simulation and analysis illustrated the mechanical characteristics, movements, and deformations of the suspended water-drop on the shed edge.
3.2.1. Motion Trajectory and Mechanical Analysis of Suspended Water-Drop
The shape of the water-droplet changed continuously under the combined action of gravity, viscous stress, surface tension, and capillary tension, which made the force characteristics of the water-drop in the process of motion very complex. In order to better understand the relationship between the shape of water-drop and the surrounding electric field, as well as the discharge, the movement process of the suspended water-drop was described qualitatively and was verified by simulation.
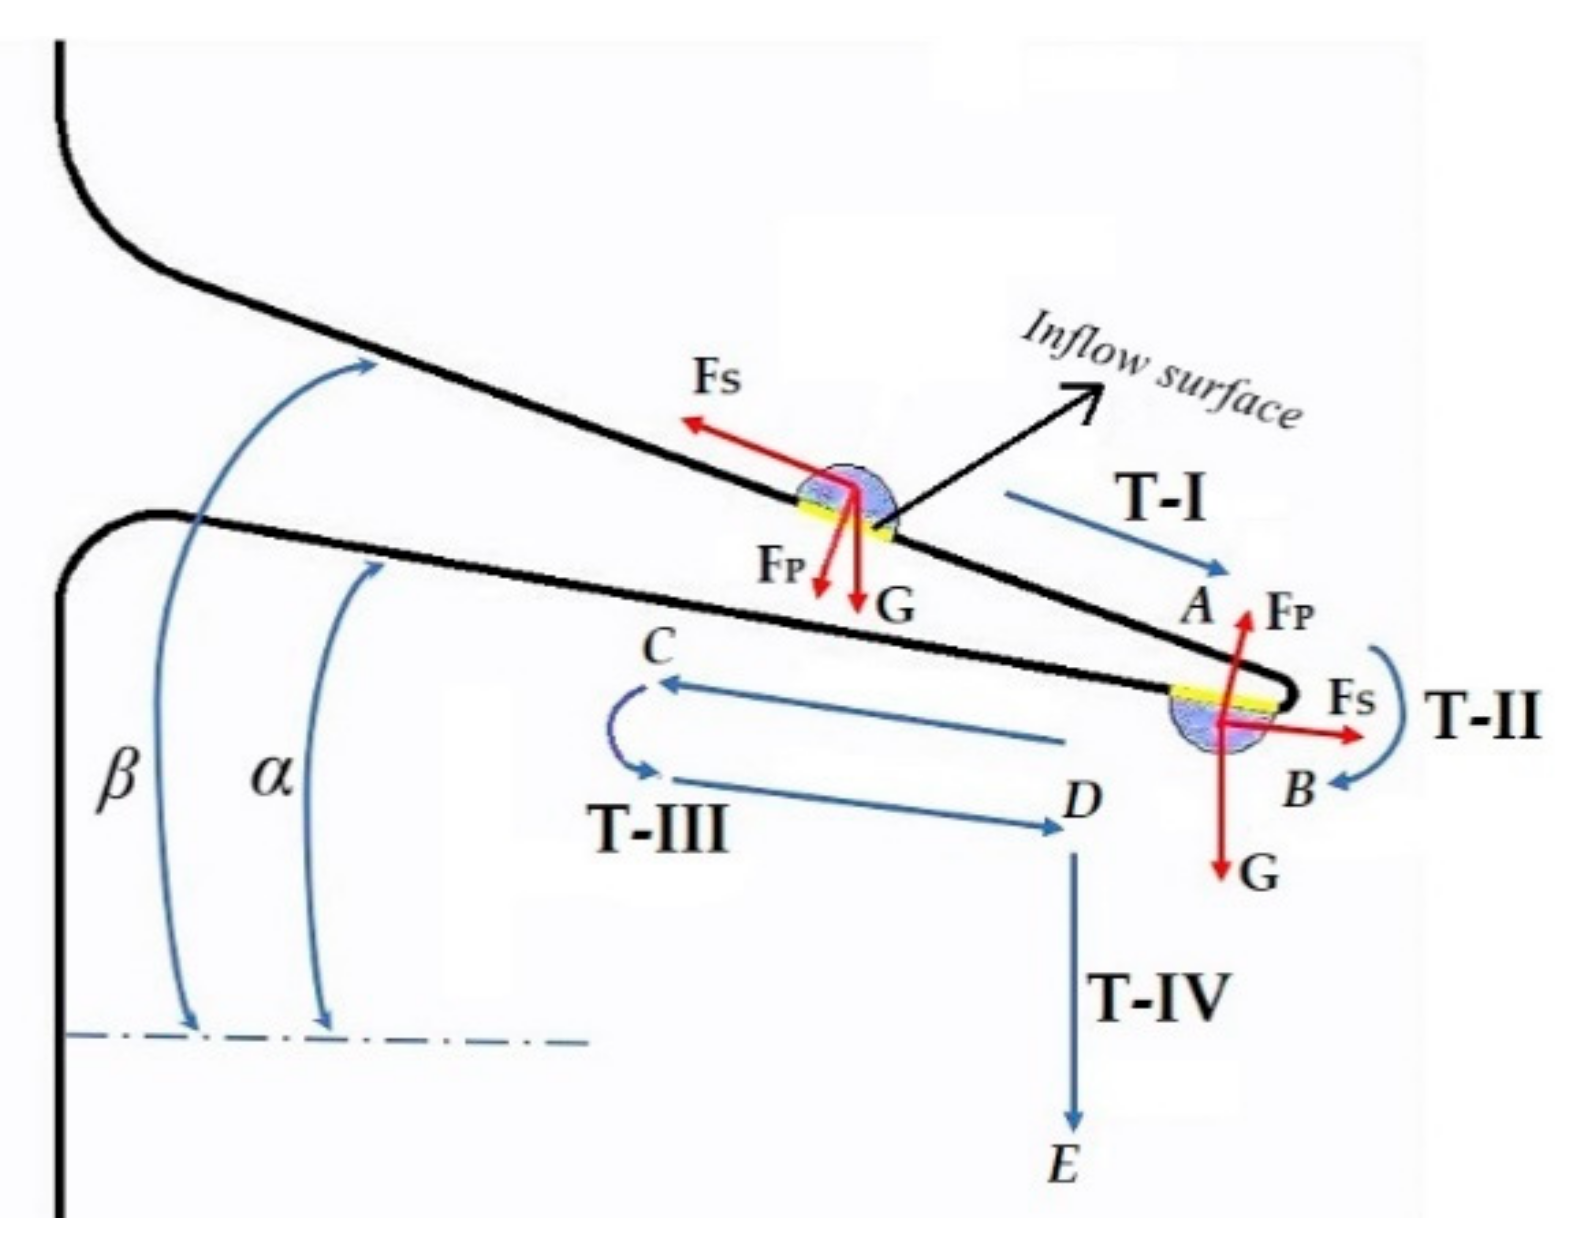
Figure 8 illustrates a possible typical track of a raindrop on the surface of the insulator shed. This paper divides the whole process into four stages: T-I, T-II, T-III, and T-IV, as shown in
Figure 8.
It is noteworthy that not all surface water-drops had traces of these four stages. The movement characteristics of water-drops varied depending on the intensity of surface water-flow, the inclination angle of the shed, the surface hydrophobic state, the initial diameter of water-drops, and the purity of liquid, etc. Some water-drops may have dropped directly from the shed edge before reaching the lower surface of the insulator shed.
T-I: When a water-droplet was located on the upper surface of the insulator shed, the slope angle of shed (
α,
β in
Figure 8) made it move towards the edge under the action of gravity, G. The movement direction of the water-droplet was direction
A, as shown in
Figure 8. Meanwhile, it was also affected by fluid viscous stress (F
S in
Figure 8) between the water-droplet and other media, such as the air. The direction of these forces was opposite to the movement direction of the water droplet, which gradually reduced the movement speed.
T-II: When a water-droplet or water-flow reached the shed edge, the liquid moved close to the chamfering of the shed edge (direction
B) due to the Coanda Effect [
21]. Furthermore, suspended water-drops formed on the lower surface close to the edge, as shown schematically in
Figure 9. However, with the increase of the curvature of the shed edge or the intensity of water-flow on the upper surface, suspended water-drops on shed edge could not maintain a relatively stable shape and dropped quickly, despite the Coanda Effect.
T-III: The material of the composite post insulator shed was silicone rubber, which has excellent water absorption properties [
22,
23]. Therefore, under the action of the siphonic effect, suspended water droplets were subject to a capillary pull (F
P in
Figure 8) from the lower surface, which maintained the shape of the water droplets and kept them from dropping. It was found that the suspended water-drops had a movement along the lower surface to the rod (direction
C in
Figure 8), whereas the lower surface of the insulator shed also had a slope angle, as shown in
Figure 10. Moreover, with the continuous supplement of rainfall, the volume, length of water-drop, and various forces on the insulator shed were constantly changing, which eventually made a movement of “reciprocating” (direction
D in
Figure 8).
T-IV: Before the fall of the suspended water-drop, the electric field intensity of the apex could always reach the condition of air ionization with the continuous increase of its length. Consequently, the streamer or corona discharge at the apex of the water-drop could develop into an obvious arc. Even when the water-drop was elongated to form a water curtain or detached from the surface, discharge could still develop along the path of dropping (direction
E in
Figure 8), as shown in
Figure 7b,c. Accordingly, the discharges of water-drops on the shed edge are were main inducing factors for the flashover of the whole insulator.
3.2.2. Factors Affecting the Morphological Characteristics of the Suspended Water-Drop
The factors that affect the morphological characteristics of suspended water-drop mainly include the purity of liquid, the initial diameter of water-drop, and the slope angle of shed, which are analyzed, respectively, as follows:
With the interaction between liquid and surface pollution layer, the conductivity of water-drop increased, and the purity decreased. Impurities in the contamination increased the viscosity and surface tension of the water-drops, which made the water-drop easier to maintain its own shape and not easy to detach from the surface while it was elongated. Therefore, with the increase of surface pollution severity, the rain flashover voltage decreased. This was partly due to the stable elongated water-drop and even the water-column between sheds. These findings are consistent with the previous experimental results [
13,
14].
The initial diameter of the suspended water-drop was the diameter of the contact surface between the water-drop and the lower surface, as shown in
Figure 11. It can be seen from the test photos that the initial diameter was in the range of 6 mm to 9 mm and the average value was 7 mm. The diameter of the suspended droplet changed with the intensity of rainfall and surface state; however, it did not affect the discharge significantly.
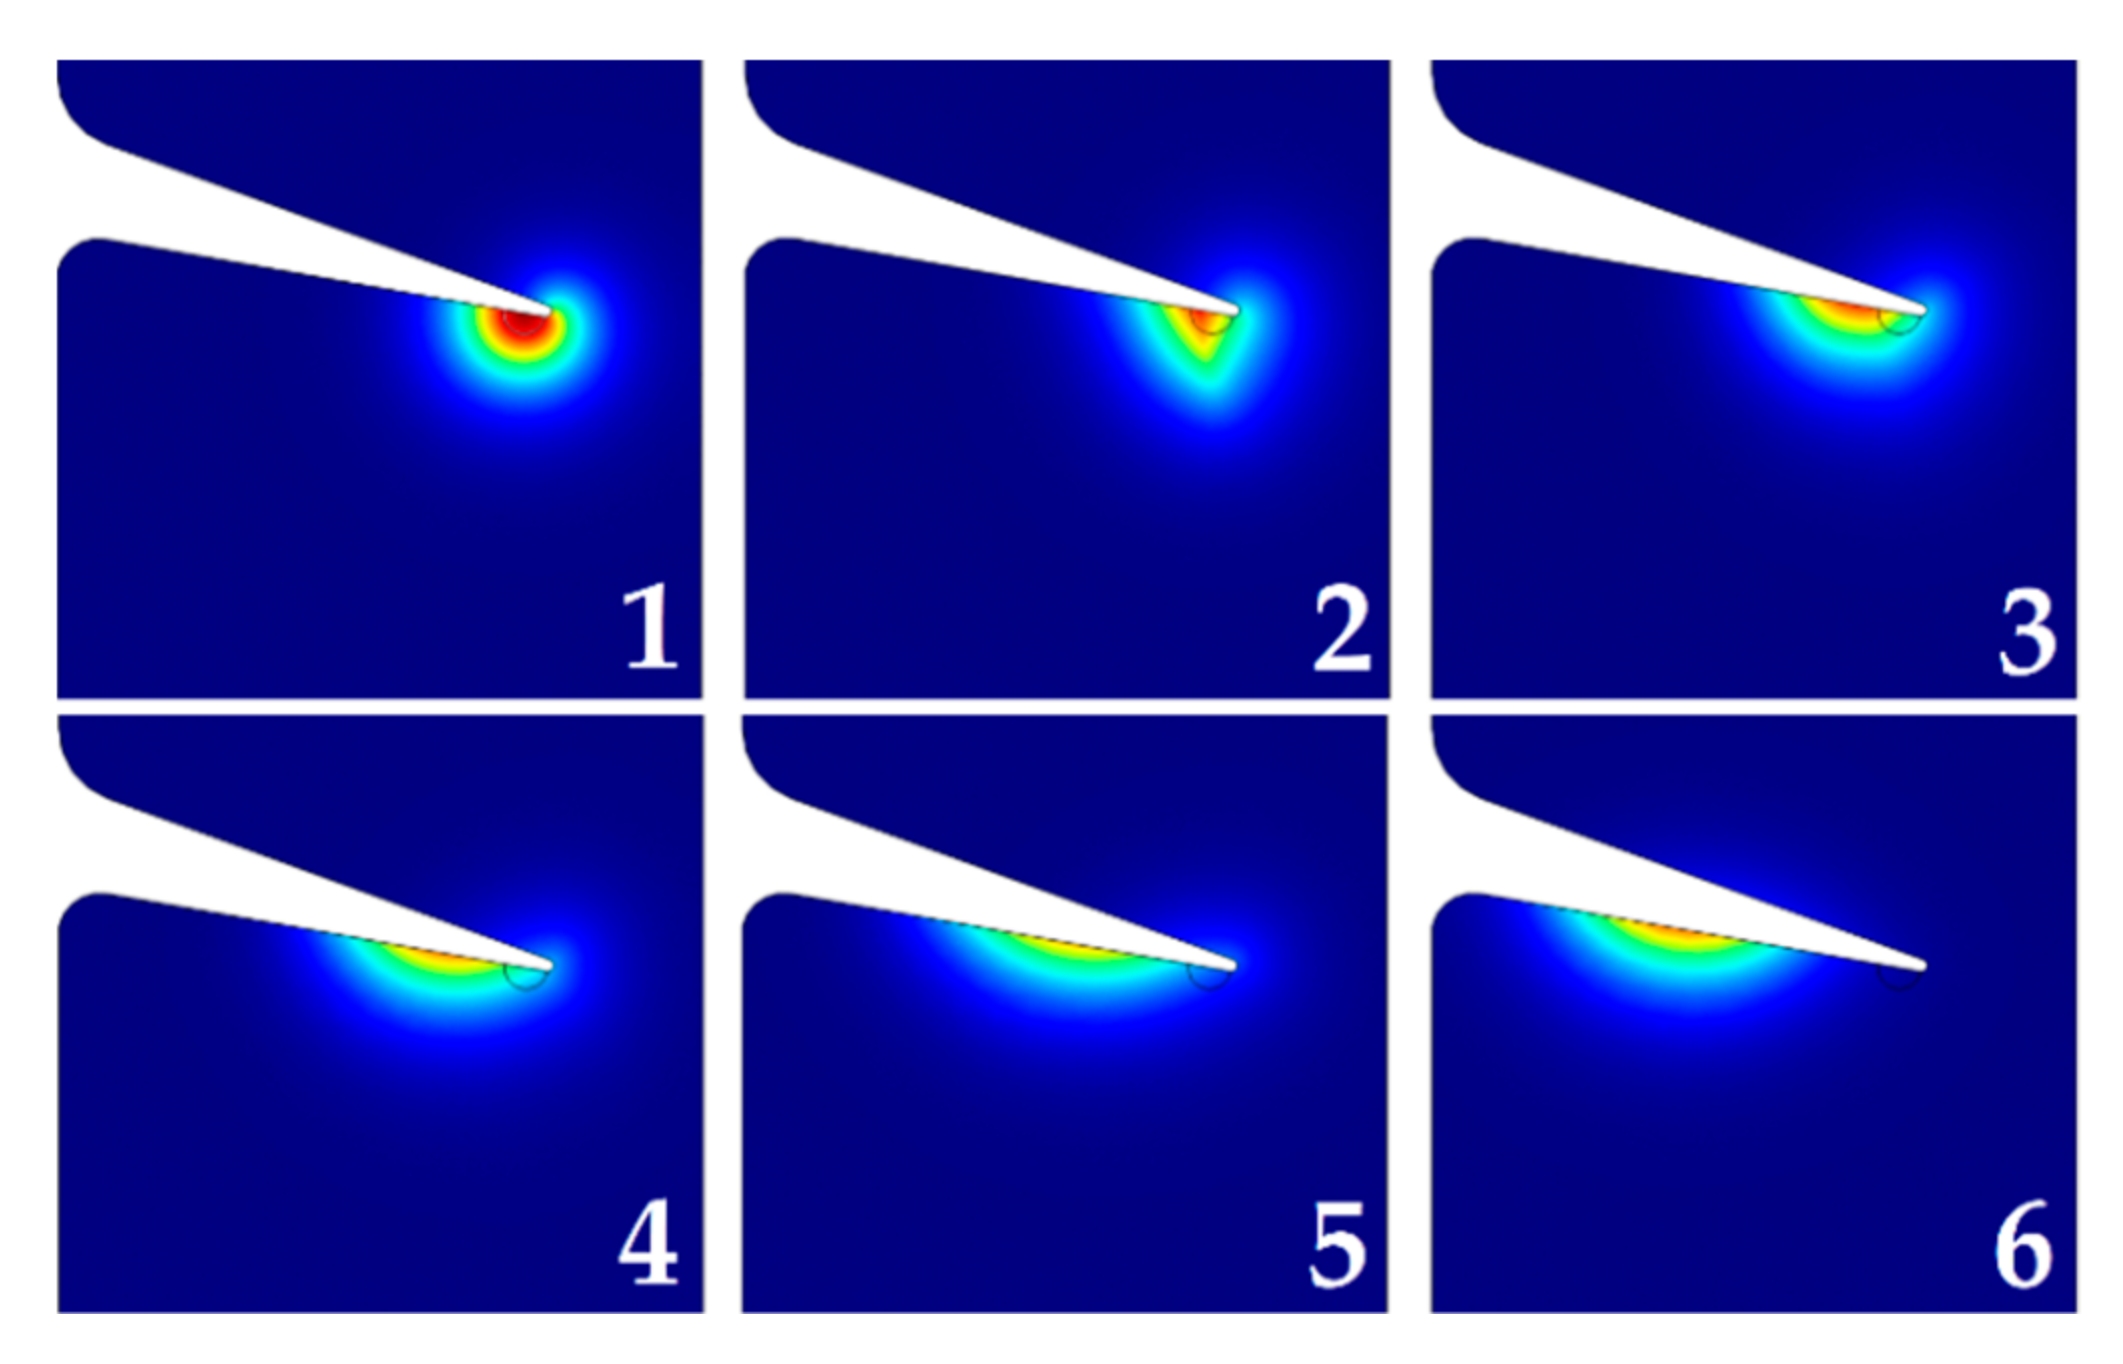
The slope angle of the shed had a significant influence on the shape, as well as the motion of suspended water-drops.
Figure 12 shows the drop shape of the suspended water-drop at four different slope angles (i.e., 5.5°, 6.5°, 11.5°, and 15°, respectively). A conclusion can be drawn that the deformation (i.e., the elongated length) and the maintained time (from formation to dropping) of the droplet would increase with the decrease of the slope angle.
Briefly,
Figure 13 shows typical parameters selected by the simulation model, which were consistent with parameters of the actual test specimen in this work.
4. Conclusions
In summary, the artificial contamination rain flashover test and simulation analysis were carried out with the same type of large-diameter composite post insulators used in the UHV converter station. The purpose was to study the characteristics of surface discharge of a large diameter post insulator in rainy weather, the difference between rain flashover and traditional pollution flashover of suspended insulators, and to further investigate the discharge mechanism.
Contamination rain flashover is a phenomenon different from the traditional pollution flashover of insulators. In rainy weather, polluted surface of insulators will partially get wet by rain. Concurrently, suspended water-drops and water curtains will be concentrated on the edge of the insulator shed, which will distort the surface electric field. Discharge, which mostly propagates in the air gap between sheds, first occurs at the apex of these suspended water-drops. This kind of discharge bridges the sheds and shorten the leakage distance along the surface. Accordingly, the shape and motion of the suspended water-drop, which is the essence of inducing the discharge, determines the development of discharge. Insulation performance of the whole insulator decreases greatly when several groups of sheds are bridged, and the flashover is caused by the connection of a series of floating arcs. Therefore, improving the shed configuration of the post insulator is a feasible and effective measure to avoid contamination rain flashover.
Author Contributions
Experiment and investigation, Y.L.; simulation and data analysis, Q.W.; methodology and data curation, L.Y.; test observation and recording, Z.K.; writing—review, Y.H.; conceptualization and writing—original draft preparation and editing, C.Z. In particular, Y.L. and Q.W. have contributed equally to this work. All authors have read and agreed to the published version of the manuscript.
Funding
This research was funded by the National Natural Science Foundation of China, grant number 51907178.
Institutional Review Board Statement
Not applicable. This study did not involve humans or animals.
Informed Consent Statement
Not applicable.
Data Availability Statement
This study did not report any data.
Acknowledgments
The authors gratefully acknowledge the contributions of all members of the National Engineering Laboratory (Kunming) for UHV Engineering Technology for their work on this paper. Acknowledgments are also extended to the Electric Power Research Institute of China Southern Power Grid Company for providing test specimen.
Conflicts of Interest
The authors declare no conflict of interest.
References
- Qiao, X.H.; Zhang, Z.J.; Sundararajan, R.; Jiang, X.L.; Hu, J.P.; Fang, Z. The failure arc paths of the novel device combining an arrester and an insulator under different pollution levels. Int. J. Electr. Power 2021, 125, 106549. [Google Scholar] [CrossRef]
- Fan, C.J.; Jiang, X.L.; Xie, Y.B.; Hu, J.L.; Zhang, Z.J.; Hu, Q.; Bi, M.Q. Novel dc flashover model for predicting flashover voltage of the iced insulators. High Volt. 2020, 1776. [Google Scholar] [CrossRef]
- Cao, B.; Shao, S.C.; Wu, X.H.; Yin, F.H.; Wang, L.M.; Farzaneh, M. Flashover characteristics of a hydrophobic surface covered by water. J. Phys. D Appl. Phys. 2020, 54, 075501. [Google Scholar] [CrossRef]
- Hussain, M.M.; Chaudhary, M.A.; Razaq, A. Mechanism of Saline Deposition and Surface Flashover on High-Voltage Insulators near Shoreline: Mathematical Models and Experimental Validations. Energies 2019, 12, 3685. [Google Scholar] [CrossRef]
- Zhang, C.Y.; Zhang, F.Z.; Wang, L.M.; Guan, Z.C. Pollution Flashover Performance of Full-scale ±800kV Converter Station Post Insulators at High Altitude Area. IEEE Trans. Dielectr. Electr. Insul. 2013, 20, 717–726. [Google Scholar] [CrossRef]
- Yang, L.; Sun, Y.J.; Liao, Y.F.; Kuang, Z.Q.; Hao, Y.P.; Li, L.C.; Zhang, F.Z. Dynamic Deformation of Pendant Drops on the Edge of High-Voltage Bushing Sheds Under Extreme Rainfall. IEEE Access 2020, 8, 118101–118113. [Google Scholar] [CrossRef]
- Hussain, M.M.; Farokhi, S.; McMeekin, S.G.; Farzaneh, M. Prediction of Surface Degradation of Composite Insulators using PD Measurement in Cold Fog. In Proceedings of the 2016 IEEE International Conference on Dielectrics (ICD), Montpellier, France, 3–7 July 2016; pp. 697–700. [Google Scholar]
- Hussain, M.M.; Farokhi, S.; McMeekin, S.G.; Farzaneh, M. Mechanism of Saline Deposition and Surface Flashover on Outdoor Insulators near Coastal Areas Part II: Impact of Various Environment Stresses. IEEE Trans. Dielectr. Electr. Insul. 2017, 24, 1068–1076. [Google Scholar] [CrossRef]
- Jiang, X.L.; Ren, X.D.; Wang, H.; Han, X.D.; Bi, C.L.; Li, Z.Y.; Hou, L.D. Effect of inverted T arrangement on AC pollution flashover characteristics of insulator strings. High Volt. 2019, 4, 97–104. [Google Scholar] [CrossRef]
- Yang, L.; Kuang, Z.Q.; Sun, Y.J.; Liao, Y.F.; Hao, Y.P.; Li, L.C.; Zhang, F.Z. Study on Surface Rainwater and Arc Characteristics of High-Voltage Bushing with Booster Sheds Under Heavy Rainfall. IEEE Access 2020, 8, 146865–146875. [Google Scholar] [CrossRef]
- Hussain, M.M.; Farokhi, S.; McMeekin, S.G.; Farzaneh, M. Effect of Cold Fog on Leakage Current Characteristics of Polluted Insulators. In Proceedings of the 2015 IEEE International Conference on Condition Assessment Techniques in Electrical Systems (CATCON), Bengaluru, India, 10–12 December 2015; pp. 163–167. [Google Scholar]
- Jiang, Z.D.; Jiang, X.L.; Guo, Y.J.; Hu, Y.Y.; Meng, Z.G. Pollution accumulation characteristics of insulators under natural rainfall. IET Gener. Transm. Dis. 2017, 11, 1479–1485. [Google Scholar] [CrossRef]
- Hao, Y.P.; Liao, Y.F.; Kuang, Z.Q.; Sun, Y.J.; Shang, G.F.; Zhang, W.X.; Mao, G.Y.; Yang, L.; Zhang, F.Z.; Li, L.C. Experimental Investigation on Influence of Shed Parameters on Surface Rainwater Characteristics of Large-Diameter Composite Post Insulators under Rain Conditions. Energies 2020, 13, 5011. [Google Scholar] [CrossRef]
- Zhang, C.Y.; Wang, L.M.; Guan, Z.C. Investigation of DC discharge behavior of polluted porcelain post insulator in artificial rain. IEEE Trans. Dielectr. Electr. Insul. 2016, 23, 331–338. [Google Scholar] [CrossRef]
- Kumara, S.; Fernando, M. Performance of Outdoor Insulators in Tropical Conditions of Sri Lanka. IEEE Electr. Insul. M. 2020, 36, 26–35. [Google Scholar] [CrossRef]
- IEC. Artificial Pollution Tests on High-Voltage Ceramic and Glass Insulators to be Used on D.C. Systems; IEC TS 61245; International Electrotechnical Commission: Geneva, Switzerland, 2015. [Google Scholar]
- IEC. Artificial Pollution Tests on High-Voltage Ceramic and Glass Insulators to be Used on A.C. Systems; IEC 60507; International Electrotechnical Commission: Geneva, Switzerland, 2013. [Google Scholar]
- IEC. Selection and Dimensioning of High-Voltage Insulators Intended for Use in Polluted Conditions; IEC TS 60815-1; International Electrotechnical Commission: Geneva, Switzerland, 2008. [Google Scholar]
- Lu, J.Z.; Xie, P.K.; Hu, J.P.; Jiang, Z.L.; Fang, Z. AC Flashover Performance of 10 kV Rod-Plane Air-Gapped Arresters under Rain Conditions. Energies 2018, 11, 1563. [Google Scholar] [CrossRef]
- Gutman, I.; Dernfalk, A. Pollution Tests for Polymeric Insulators made of Hydrophobicity Transfer Materials. IEEE Trans. Dielectr. Electr. Insul. 2010, 17, 384–393. [Google Scholar] [CrossRef]
- Wu, F.L.; Li, Z.S. Optimization Analysis of Structural Parameters of an Annular Slot Ejector Based on the Coanda Effect. Math. Probl. Eng. 2020, 11, 8951353. [Google Scholar] [CrossRef]
- Akbar, M.; Ullah, R.; Alam, S. Aging of Silicone Rubber-based Composite Insulators under Multi-stressed Conditions: An Overview. Mater. Res. Express 2019, 6, 102003. [Google Scholar] [CrossRef]
- Lutz, B.; Cheng, L.; Guan, Z.C.; Wang, L.M.; Zhang, F.Z. Analysis of a Fractured 500 kV Composite Insulator—Identification of Aging Mechanisms and their Causes. IEEE Trans. Dielectr. Electr. Insul. 2012, 19, 1723–1731. [Google Scholar] [CrossRef]
Figure 1.
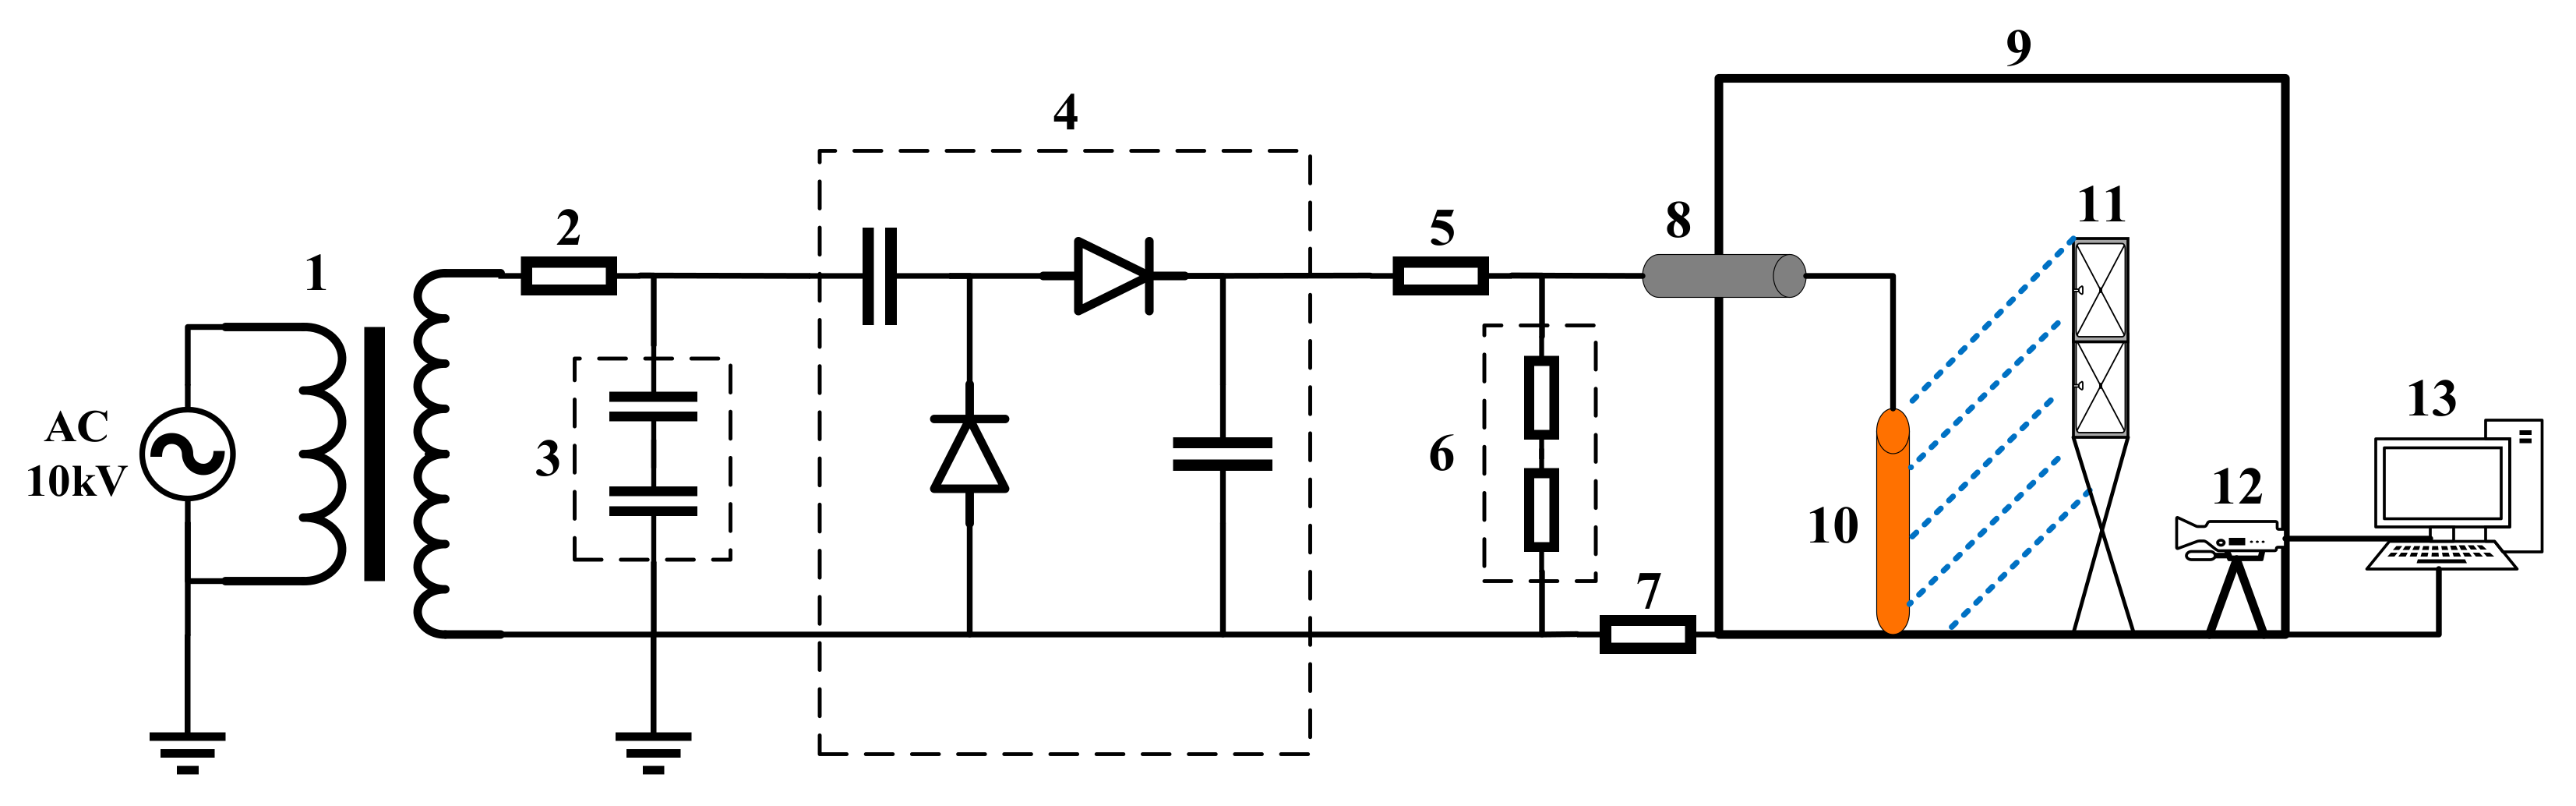
Test setup of the artificial contamination rain flashover test. (1) Test transformer; (2) protective resistor; (3) alternating current voltage divider; (4) direct current supply; (5) protective resistor; (6) direct current voltage divider; (7) leakage current measuring sensor; (8) high voltage bushing; (9) test chamber; (10) specimen; (11) artificial rainfall system; (12) camera; (13) control system.
Figure 1.
Test setup of the artificial contamination rain flashover test. (1) Test transformer; (2) protective resistor; (3) alternating current voltage divider; (4) direct current supply; (5) protective resistor; (6) direct current voltage divider; (7) leakage current measuring sensor; (8) high voltage bushing; (9) test chamber; (10) specimen; (11) artificial rainfall system; (12) camera; (13) control system.
Figure 2.
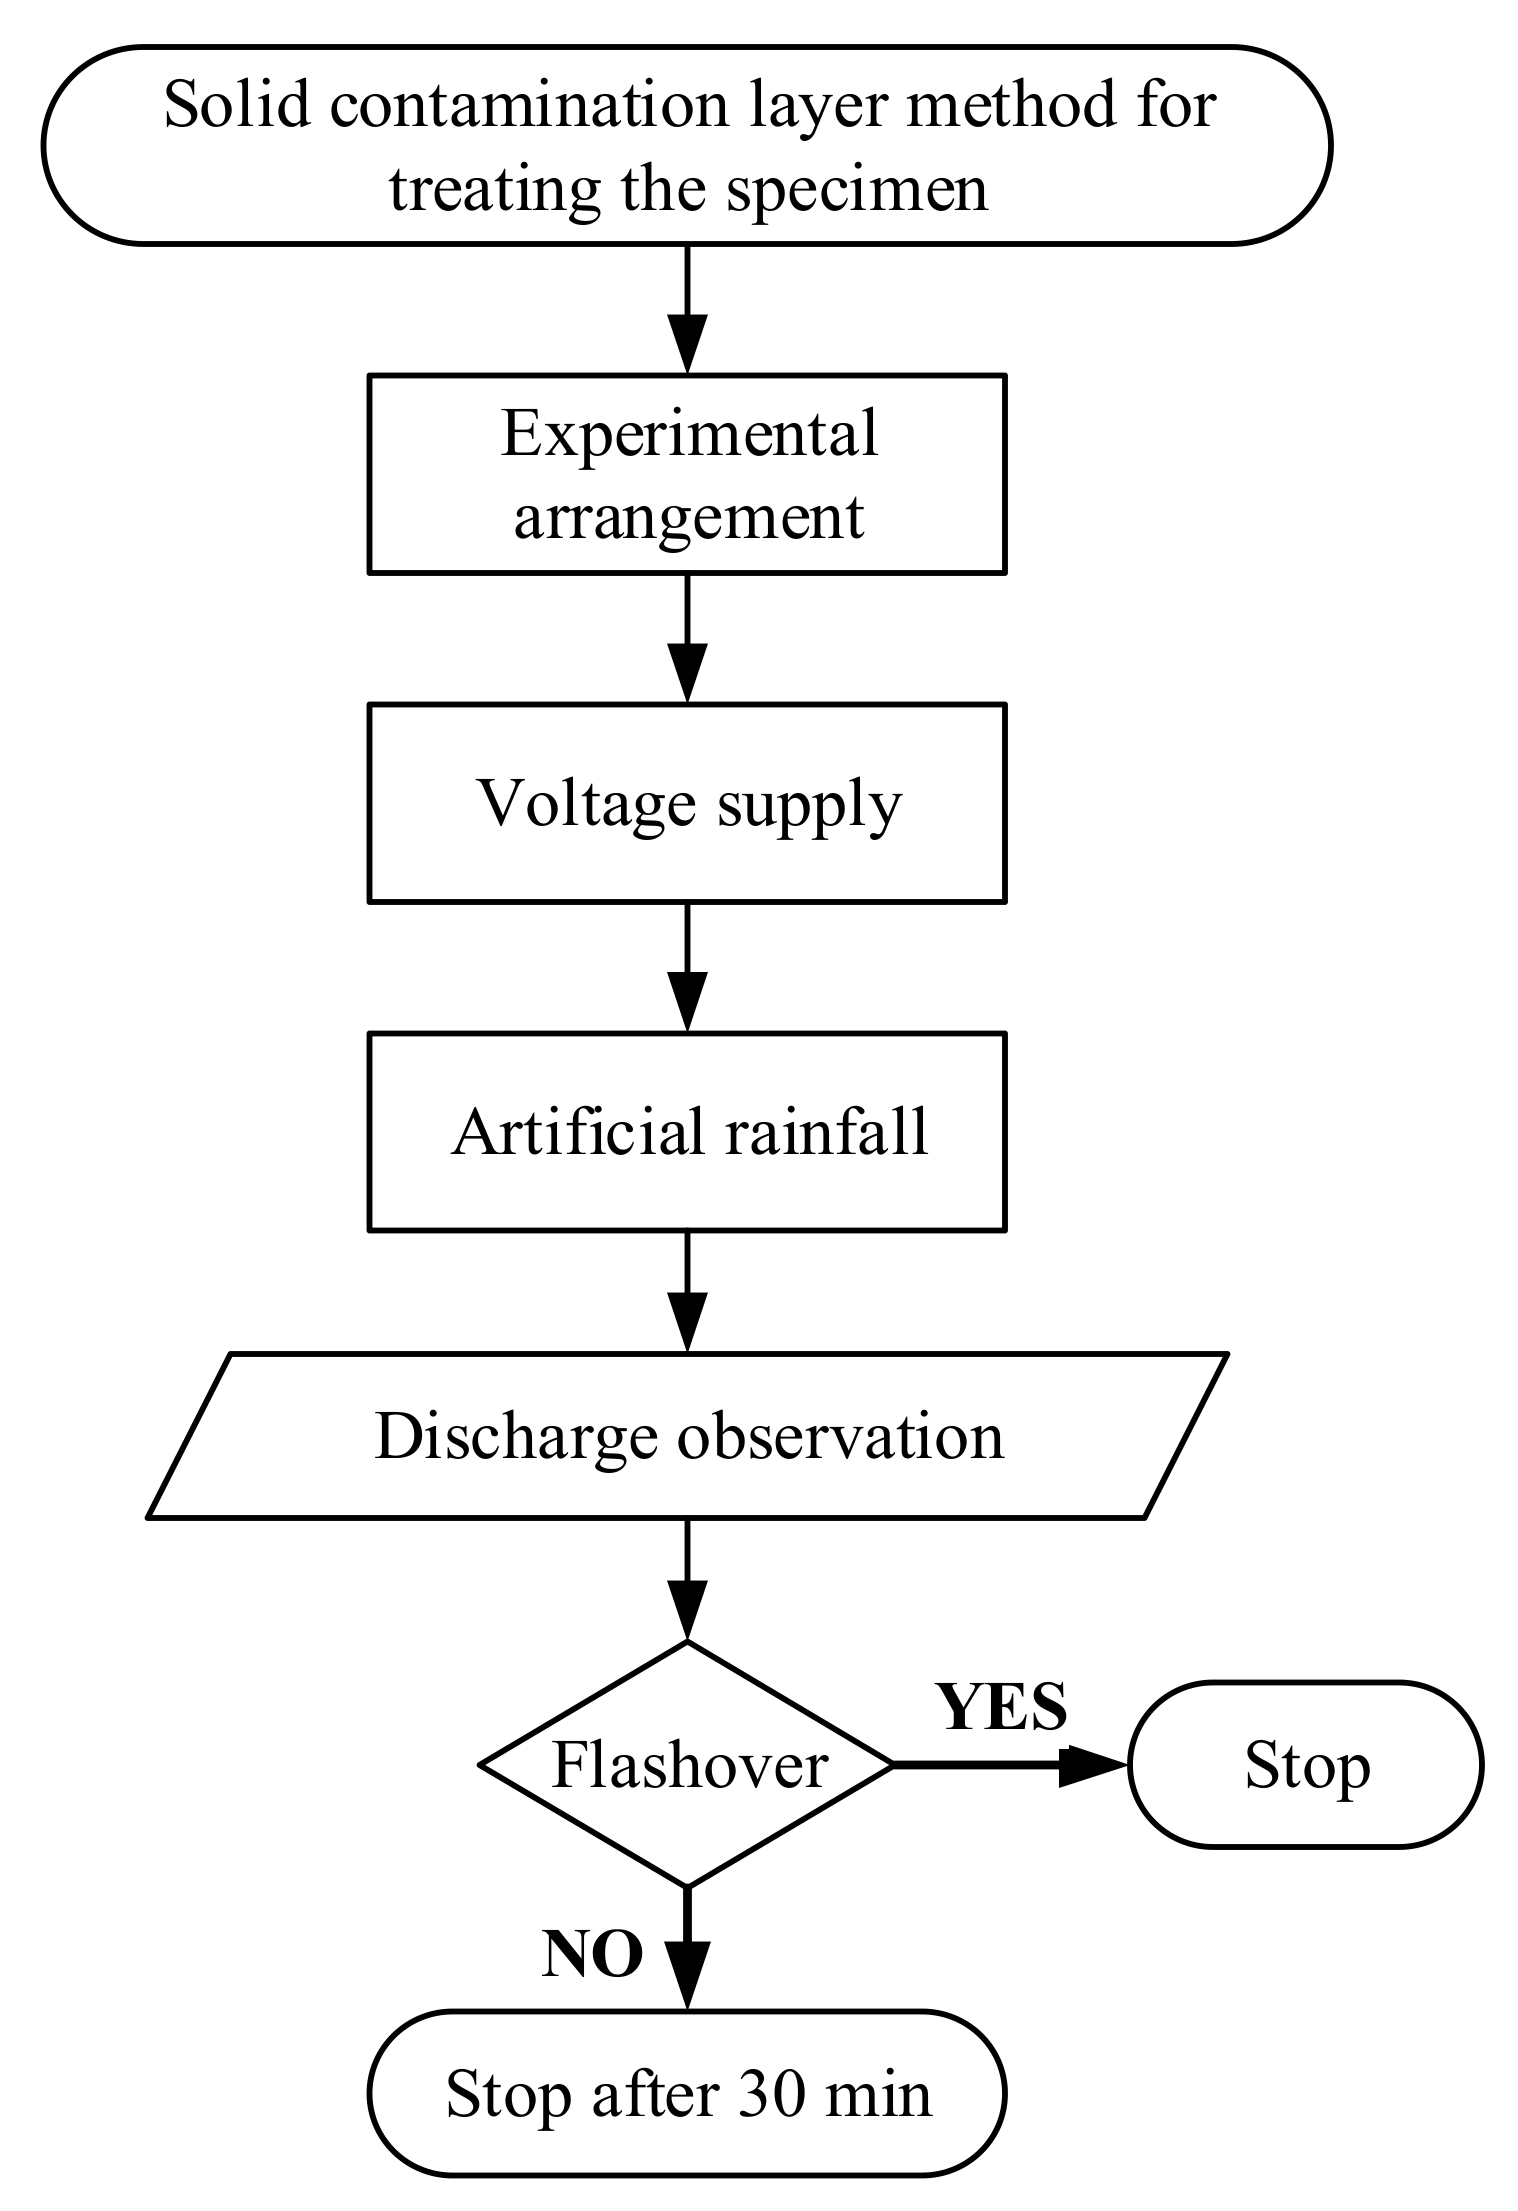
Test flow chart of the artificial contamination rain flashover test.
Figure 2.
Test flow chart of the artificial contamination rain flashover test.
Figure 3.
Simulation model of the insulator with the suspended water-drop. (a) 2D electric field simulation model: overall view; (b) solid–fluid coupling simulation model: partial view.
Figure 3.
Simulation model of the insulator with the suspended water-drop. (a) 2D electric field simulation model: overall view; (b) solid–fluid coupling simulation model: partial view.
Figure 4.
Simulation results of electric field distribution. (a) simulation results without water-film and water-drops on shed surface; (b) simulation results with water-film and water-drops on shed surface.
Figure 4.
Simulation results of electric field distribution. (a) simulation results without water-film and water-drops on shed surface; (b) simulation results with water-film and water-drops on shed surface.
Figure 5.
Values of electric field intensity of some selected points on the shed surface in the model with water-film and water-drops. (a) selected points on shed surface; (b) values of electric field intensity of the selected points.
Figure 5.
Values of electric field intensity of some selected points on the shed surface in the model with water-film and water-drops. (a) selected points on shed surface; (b) values of electric field intensity of the selected points.
Figure 6.
Process of contaminating rain flashover of the large-diameter composite post insulator. (a) start the artificial rain; (b) 5 s after; (c) 10 s after; (d) 73 s after; (e) 74 s after; (f) 75 s after.
Figure 6.
Process of contaminating rain flashover of the large-diameter composite post insulator. (a) start the artificial rain; (b) 5 s after; (c) 10 s after; (d) 73 s after; (e) 74 s after; (f) 75 s after.
Figure 7.
Discharge behavior between sheds of large-diameter post insulators. (a) Suspended water-drop and discharge of water-drop on the upper surface; (b) discharge initiated; (c) bridging phenomenon; (d) lateral movement of discharge between sheds of large-diameter post insulators; (e) development process of flashover.
Figure 8.
Typical motion trajectory of the surface water-drop during the rain test.
Figure 8.
Typical motion trajectory of the surface water-drop during the rain test.
Figure 9.
The moment of water-drop: (a) on the upper Surface; (b) at the edge; (c) hanging on the lower surface and elongated.
Figure 9.
The moment of water-drop: (a) on the upper Surface; (b) at the edge; (c) hanging on the lower surface and elongated.
Figure 10.
Simulation of a movement of “reciprocating” of a suspended water-drop.
Figure 10.
Simulation of a movement of “reciprocating” of a suspended water-drop.
Figure 11.
The initial diameter of suspended water-drop.
Figure 11.
The initial diameter of suspended water-drop.
Figure 12.
The shape of the suspended water-droplet under different values of slope angle.
Figure 12.
The shape of the suspended water-droplet under different values of slope angle.
Figure 13.
Parameter selection of the simulation model.
Figure 13.
Parameter selection of the simulation model.
Table 1.
Parameters of specimen (mm).
Table 1.
Parameters of specimen (mm).
| Shed Configuration | Shed Parameters | Structure Height, HS | Insulation Height, H | Leakage Distance, L | Rod Diameter, D |
|---|
 | P1 = 105
P2 = 75
S1 = 90
S2 = 45 | 1500 | 1250 | 5780 | 625 |
Table 2.
Parameters of the artificial rain used in the test.
Table 2.
Parameters of the artificial rain used in the test.
| Items | Data |
|---|
Intensity of rainfall
(Both the vertical and horizontal component) | 2 mm/min, 10 mm/min |
| Conductivity of rainwater | 440 μS/cm |
| Angle of rainfall | 45° |
| Temperature of rainwater | 20 ℃ |
Table 3.
Parameters of materials used in the simulation.
Table 3.
Parameters of materials used in the simulation.
| Materials | Air | Rainwater | Shed
(Silicon Rubber) | End Fittings
(Copper) |
|---|
| Relative permittivity | 1 | 80 | 9 | 2000 |
| Conductivity (S/m) | 0 | 1 × 10⁻³ | 1 × 10⁻⁹ | 5.7 × 10⁶ |
| Publisher’s Note: MDPI stays neutral with regard to jurisdictional claims in published maps and institutional affiliations. |
© 2021 by the authors. Licensee MDPI, Basel, Switzerland. This article is an open access article distributed under the terms and conditions of the Creative Commons Attribution (CC BY) license (http://creativecommons.org/licenses/by/4.0/).


