Abstract
The parameter inconsistency of the battery cells and the series-parallel connection mode are closely related to the battery pack capacity. Studying the degree of influence of battery pack capacity by battery cell parameters is of great significance to the series-parallel design of battery packs. This paper establishes battery cell models and battery pack models with different topologies. In the MATLAB/Simulink environment, simulation studies were conducted to study the influence of the battery pack capacity by the monomer parameters as the number of cells in series and parallel in the topology changes. Then, from a statistical point of view, the simulation results were analyzed in principle. Finally, a small-scale battery pack experimental platform was built in the laboratory environment to verify the correctness of the simulation conclusions and theoretical analysis.
1. Introduction
In recent years, carbon dioxide emissions have increased sharply due to energy consumption, and it is imperative to improve energy efficiency [1]. Energy storage, as a device that can realize energy transferring, obviously has advantages for improving energy utilization efficiency. In particular, with the continuous advancement of lithium-ion power battery technology [2,3] and its rising output and lower costs, lithium-ion battery has gradually been widely used in fields such as electric vehicles and grid energy storage [4,5]. Usually, the battery system is made up of many cells, for example, the battery pack of Tesla model S 85 kWh is composed of 74 3.1 Ah battery cells to form a parallel unit, and then 96 such units are connected in series [6]. In the process of connecting cells in series and parallel to form a battery pack, the specific energy of the battery pack will be much smaller than the specific energy of the cells due to the differences in the parameters between the cells and the differences in the connection methods of the cells [7]. Based on this, it is necessary to carry out research on the influence of the battery pack capacity by the cell series-parallel connection mode and the main parameters of the cell, so as to maximize the battery pack capacity after the cells are connected in series and parallel.
Aiming at studying the battery pack capacity affected by the cell series-parallel connection mode and the cell parameters, the literature [8] believed that the consistency of the battery parameters which impact the pack capacity can be divided into two categories: static parameters and dynamic parameters. The former includes monomer initial capacity, initial state of charge (SOC) and initial internal resistance, while the latter mainly includes coulombic efficiency, internal resistance change rate, capacity decay rate, temperature, and so on; at the same time, the former can affect the capacity of the battery pack at the very beginning of the group directly, while the latter affects the battery pack capacity fading through the long-term operation of the battery. Literature [9] summarizes the method of designing of battery pack topology, and introduces the problems and technology status in the current battery pack topology design, but it focuses on the balanced design of the battery pack, and there is less research on the degradation of battery pack performance due to parameter differences between cells. Literature [10] optimizes the battery size from a view of economic point, and proposes an expandable design solution that reduces the number of battery modules and improves the fault recovery capability of the battery pack. Literature [11] compared the reliability of battery packs with different topologies by analyzing battery arrays, and proposed a C3C (one cell to 3 cells) structure, which can effectively improve the reliability of battery packs. Literature [12] proposes the concepts of parallel cell module (PCM) and series cell module (SCM), which have been widely used in subsequent related literature. In literature [12], it is found that the PCM topology is independent, and self-equalization can be realized inside it, therefore, the capacity of the battery pack formed by it decays relatively slowly, but the document does not focus on the impact of the difference of battery parameters on the battery pack capacity. Literature [13] takes six battery cells as an example and combines them into different PCM and SCM topologies; through the orthogonal experiment of its charge and discharge, it is concluded that the capacity of PCM is greatly affected by the internal resistance of the cell, while the capacity of SCM is greatly affected by the capacity of the cell. However, the conclusion of literature [13] is only obtained through charging and discharging tests on a limited variety of topologies, and its principles are not analyzed and discussed, and due to the limited number of topologies, it is impossible to rule out the contingency of the conclusions. Literature [14] uses 12 V battery SCM as a module unit, and is based on the unit series and parallel connection to form battery systems with different topologies. Through simulation, literature [14] showed that the battery pack capacity composed of SCMs connected in parallel and then connected in series has strong robustness to the difference in cell capacity, and changing the position of the battery cell has a significant impact on the battery pack capacity. However, in literature [14], the number of topologies is limited, and it is only a conclusion obtained through simulation results, and no further explanations are made to this conclusion. Literature [15] compared the capacity of two topologies 2P4S (2 parallel 4 series) and 4S2P (4 series 2 parallel) by changing the positions of the different batteries, using simulation research and experimental verification, and the results show that when the cells position is constant, the capacity distribution of the former is more divergent than the latter, and its capacity value is always greater than the latter. However, in literature [15], due to the relatively simple topology, the universality of the above conclusions needs to be further verified.
Based on the abovementioned literature and considering its limitations, this article focuses on the impact of battery pack capacity on the difference of battery cell static parameters and the way of cells series-parallel connection (the influence of the difference of battery cell dynamic parameters on the battery pack capacity is beyond the scope of this article). In this paper, battery cell and battery pack models with different topologies were established. The influence of cell parameters on battery pack capacity as the number of series and parallel cells in the topology changes were researched in the MATLAB/Simulink environment. Then, from a statistical point of view, the simulation results were analyzed in principle. Finally, a small-scale battery pack experimental platform was built in the laboratory environment to verify the simulation conclusions.
2. Battery Cell Model and Battery Pack Model
2.1. Cell Model
The equivalent circuit models of battery cells mainly include Rint circuit [16] and Thevenin circuit [17]. Since the article focuses on the impact of the battery pack capacity by the static parameters of the cell at the beginning of the group, the dynamic parameters of the cell are not considered, and the article focuses on the capacity of the battery pack in the steady state. Therefore, it is appropriate to use Rint equivalent circuit for analysis and research.
The Rint equivalent circuit of the cell is shown in Figure 1:
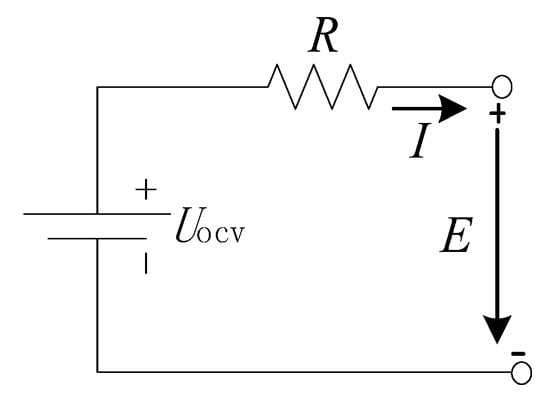
Figure 1.
Rint equivalent circuit model.
Then, according to Figure 1, we obtain:
where: E is the battery terminal voltage, UOCV is the battery open circuit voltage, R is the battery internal resistance, and I is the current, whose direction is from positive to negative.
Assuming the Uocv–SOC curve expression is:
and SOC is as shown in Equation (3):
where: Q is the quantity of electricity at present, and C0 is the initial battery capacity.
Q can be calculated by the following Equation (4):
where: C0 is the initial capacity of the battery, and SOC0 is the initial SOC of the cell.
From Equations (1) to (4), it can be seen that under the condition of constant charge and discharge current, there are mainly five static parameters of the battery, E, R, UOCV, C0 and SOC0.
Among the above five indicators, since UOCV and SOC have a relationship as Equation (2), it is sufficient to choose one of the two. In the same way, of the remaining four variables, when three variables are determined, the fourth variable can then be determined. Therefore, in the following simulations and experiments, three corresponding variables can be selected for the later analysis.
2.2. Battery System Model
A complex battery system (a battery system composed of any uncertain number of SCM or PCM, etc.) can be regarded, as is shown in Figure 2a. Any unit in Figure 2a can be considered to be composed of two battery subsystems, 1 or 2 in Figure 2b. In topology 1, every SCM is composed of m cells connected in series, and then n SCMs are connected in parallel. In topology 2, each PCM has n cells connected in parallel, and then m PCMs are connected in series.
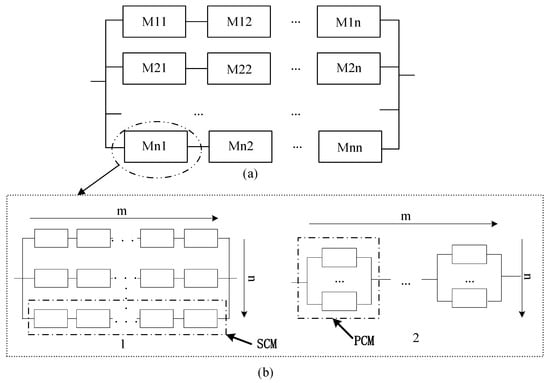
Figure 2.
Battery pack topology: (a) battery system. (b) two battery subsystems.
The article focuses on analyzing the impact of battery subsystem 1 and 2 capacity by the cell static parameters, and so it is with complex Figure 2a, thus, detailed analysis of Figure 2a is not performed.
For the battery subsystem in Figure 2, suppose the internal resistance of the battery cell is Rij, the initial capacity is Cij, and the initial state of charge is SOCij, where i is the serial number and the value is an integer between [1, m], and j is the parallel number, and the value is an integer between [1, n]. Referring to the Rint equivalent circuit model shown in Figure 1, the capacity of the battery system with two different topologies can be calculated as follows:
For 1 in Figure 2b:
For 2 in Figure 2b:
From Equations (1) to (6), it can be seen that for any topology battery system, when the charge and discharge current is determined, at the very beginning of grouping, the system capacity is mainly affected by the following static parameters: initial capacity, initial SOC, and internal resistance. The battery pack capacity can be regarded as a function of the three:
In this way, the next step is to analyze the influence of the initial capacity Cij, the initial state of charge SOCij, and the initial internal resistance Rij of the cell on the battery pack capacity under different connection topologies.
3. Simulation of Battery Pack Capacity Affected by Topology and Parameters
3.1. Metric Parameters
From Equations (5) and (6), it can be seen that when there are differences in parameters between battery cells, the actual capacity of the battery pack will be less than the theoretical capacity. In particular, the greater the difference in parameters between cells, the smaller the capacity of the battery pack. In order to quantify the influence of the cell parameters on the battery pack capacity and to facilitate the comparison between different topologies, the actual capacity of the battery pack needs to be normalized. That is, the state of health (SOH) of the battery pack is shown in Equation (8):
where: CP is the actual capacity of the battery pack, and CN is the theoretically calculated capacity of the battery pack.
From Equation (8), the SOH value is negatively correlated with the above influence, that is, for a battery pack of a certain topology, considering parameter differences, the larger the SOH value, the less the battery system capacity of the topology is affected by the parameters, and the smaller the SOH value, the greater the influence of the topology module capacity on the corresponding parameters.
It is worth pointing out that the severity of SOH changes reflects the sensitivity of the battery pack capacity to cell parameters. For a certain topology, in the case of a certain parameter difference, the more severe the SOH change trend, the more sensitive the battery pack capacity to the corresponding parameters.
3.2. Simulation Parameters and Simulation Process
The simulation uses the two battery system models shown in Figure 2b, and the model of each cell in the battery pack is shown in Figure 1. In the simulation, under the set charging current and ambient temperature (room temperature 25 °C), first two of the three influence factors are set the same, and the other factor is randomly selected within the standard deviation range and then randomly assigned to each battery cell. Later, the SOH of the battery system capacity is calculated. Then, the numerical value of m and n in the topology is changed and the SOH of the battery pack is calculated again.
The specific simulation parameter design is shown in Table 1. The value in the table is the standard unit value, where the reference value of Cij is 1 Ah, and the reference value of internal resistance Rij is 0.35 mΩ.

Table 1.
Parameters of simulation.
Further, the simulation process can be designed as shown in Figure 3:
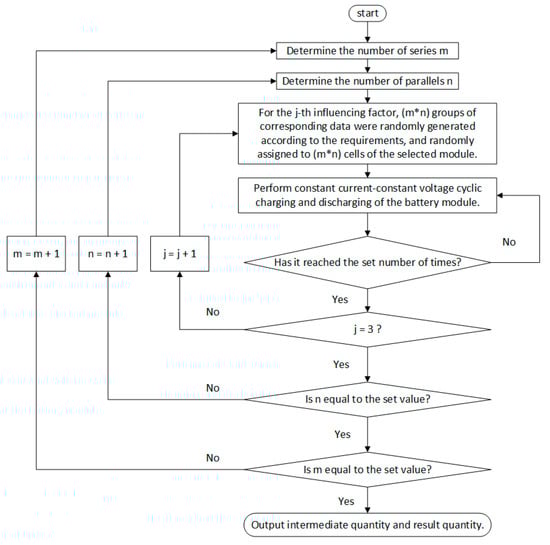
Figure 3.
Steps of simulation.
Step 1: Select the battery pack p (value is a or b), set the simulation step, determine the upper limit of the number m and n of the series branch and parallel branch, and start the simulation.
In order to shorten the simulation time and reflect the change trend of the module capacity, the upper limit of the value of m and n is set to 50, so there are 2500 types of battery system topologies.
Step 2: Randomly generate m × n sets of data as required, and randomly distribute them to each cell of the selected battery system.
For the selected battery system p of a certain topology, select a certain influencing factor q (the value is the initial capacity, initial SOC, and initial internal resistance). Let this factor randomly generate m × n sets of data within the standard deviation of the simulation parameters shown in Table 1, and randomly assign them to m × n cells of the selected module. At the same time, ensure that the data of other influencing factors of the selected module monomer are completely the same.
Step 3: Carry out the charge and discharge cycle experiment on the battery system of the selected topology. Charging adopts constant current and constant voltage mode, and discharging adopts constant current mode.
Step 4: Determine whether the set number of charge and discharge cycles is reached.
Since the research is the capacity of the battery system at the beginning of the group, the number of cycles is set to 1.
If not, continue to charge and discharge cycle simulation. If yes, the set number of times has been reached, and judge whether all three consistency influencing factors have been simulated: if not, replace the consistency influencing factors, and repeat the second to fourth steps; if yes, proceed to the next step.
Step 5: Determine whether all topologies have been simulated, that is, whether m and n have reached the set values. If no, replace m and n, repeat the first to fifth steps; if yes, end, and output the result.
3.3. Simulation Results and Conclusions
3.3.1. The Initial Capacity of the Cells Is Different
Figure 4 and Figure 5 respectively show the influence of the battery pack SOH of topology 1 and topology 2 in Figure 2 on the inconsistency of the initial capacity C0 of the cells.
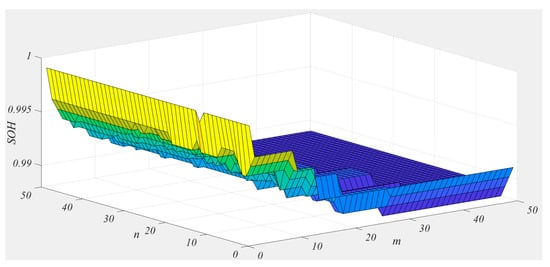
Figure 4.
The changing trend of topology 1 battery pack state of health (SOH) affected by C0.
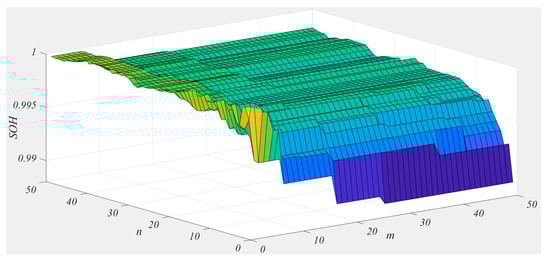
Figure 5.
The changing trend of topology 2 battery pack SOH affected by C0.
It can be seen from Figure 4: (1) Under the premise that the value of n is fixed, the SOH of the battery pack of topology 1 is affected by the inconsistency of the initial capacity and decreases with the increase of m, and tends to be stable. (2) Under the premise that the value of m is fixed, the SOH of the topology 1 battery pack is affected by the inconsistency of the initial capacity and basically changes little with the increase of n. (3) From the change rate of SOH, the sensitivity of the battery pack SOH of topology 1 to the inconsistency of the initial capacity gradually decreases with the increase of m, and tends to zero. With the change of n, the change rate of SOH is almost always 0. That is, for the battery pack 1, the sensitivity of its capacity to the inconsistency of the initial capacity is mainly related to m, and has little to do with n.
It can be seen from Figure 5: (1) Under the premise that the value of m is fixed, the battery pack SOH of topology 2 is affected by the inconsistency of initial capacity as n increases and then decreases and basically remains unchanged. (2) Under the premise that the value of n is fixed, the SOH is affected by the inconsistency of the initial capacity, and it increases slightly with the increase of m, and then is basically unchanged. (3) From the change rate of SOH, it can be seen that the sensitivity of the battery pack SOH of topology 2 to the inconsistency of the initial capacity gradually decreases with the increase of n, and tends to 0, while the change with m is almost always 0. That is, for the battery system 2, the sensitivity of its capacity to the inconsistency of the initial capacity is mainly related to n and not much to m.
3.3.2. The Initial SOC (SOC0) of the Cells Is Different
Figure 6 and Figure 7 respectively show the change trend of the battery pack SOH of topology 1 and topology 2 in Figure 2 affected by the inconsistency of the initial SOC.
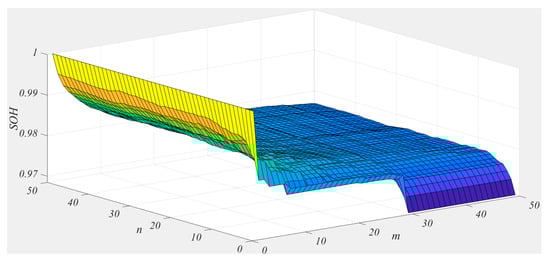
Figure 6.
The changing trend of topology 1 battery pack SOH affected by SOC0.
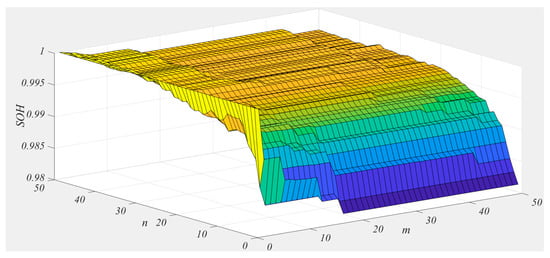
Figure 7.
The changing trend of topology 2 battery pack SOH affected by SOC0.
It can be seen from Figure 6 that when the initial SOC of the cells is inconsistent: (1) Under the premise that the value of n is fixed, the battery pack SOH of topology 1 is affected by the inconsistency of the initial SOC. As m increases, it first increases and then stabilizes. (2) Under the premise of a fixed value of m, the battery pack SOH of topology 1 is affected by the inconsistency of the initial SOC and gradually decreases and stabilizes as n increases. (3) From the rate of SOH change, it can be seen that the sensitivity of the battery pack SOH of topology 1 to the initial SOC inconsistency gradually decreases with the increase of n, and tends to 0, and the sensitivity gradually decreases with the increase of m, and tends to 0. That is, for the battery system 2, the sensitivity of its SOH to SOC inconsistency is related to both m and n.
It can be seen from Figure 7 that when the initial SOC of the cells is inconsistent: (1) Under the premise of a fixed value of m, with the increase of n, the battery pack SOH of topology 2 is affected by the inconsistency of the initial SOC, showing a trend of first decreasing and then is basically unchanged. (2) Under the premise that the value of n is fixed, the battery pack SOH of topology 2 is affected by the inconsistency of the initial SOC, and it basically keeps unchanged after a slight increase with the increase of m. (3) From the SOH rate of change, it can be seen that the sensitivity of the battery pack SOH of topology 2 to the initial SOC inconsistency gradually decreases with the increase of n, and tends to 0, while the change with m is almost 0. That is, for the battery system 2, the sensitivity of its capacity to the inconsistency of the initial SOC is mainly related to n, not much to m.
3.3.3. The Initial Internal Resistance of the Cells Is Different
Figure 8 and Figure 9 show the change trend of the battery pack SOH shown in topology 1 and topology 2 in Figure 2 due to the inconsistent initial internal resistance.
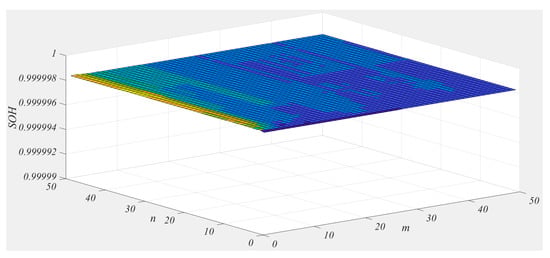
Figure 8.
Topology 1 battery pack SOH change trend affected by R0.
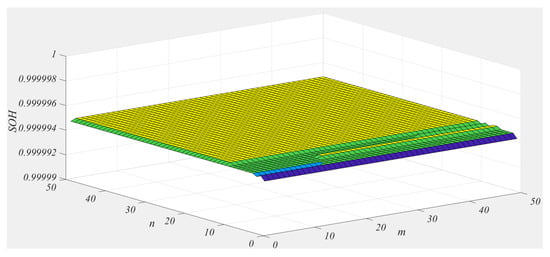
Figure 9.
Topology 2 battery pack SOH change trend affected by R0.
It can be seen from Figure 8 that when the initial internal resistances of the cells are inconsistent, under the premise of a fixed value of n, the SOH of the topology 1 battery pack is affected by the inconsistency of the initial internal resistances and increases with the increase of m, and gradually stabilizes. Under the premise that the value of m is fixed, the SOH of the battery pack of topology 1 is affected by the initial internal inconsistency and has no obvious change with the increase of n.
It can be seen from Figure 9 that when the initial internal resistance of the cells is inconsistent, under the premise that the value of m is fixed, the SOH of the topology 2 battery pack is affected by the inconsistency of the initial internal resistance, and there is no obvious change with the increase of n. On the premise that the value of n is fixed, the SOH of topology 2 battery is affected by the inconsistency of initial internal resistance, and it is basically unchanged after a slight decrease with the increase of m.
In fact, comparing Figure 8 and Figure 9, the SOH of the two topological battery packs basically has little change. The reason is that the difference in the internal resistance of a single cell does not directly affect the SOH of the battery packs, but affects the difference in charging current and temperature, which in turn affect the dynamic parameters of the battery [8], and achieve an impact on the capacity of the battery packs. This effect needs to pass a certain number of charge and discharge cycles to be clearly displayed. Since the effect of the cell dynamic parameters on the SOH of the battery packs is not the focus of the article, it is not discussed in detail here.
4. Analysis and Discussion of Simulation Results
4.1. The Initial Capacity of the Cells Is Inconsistent
When only the initial capacity of the battery cells is inconsistent, Equations (5) and (6) can be written as:
Furthermore, assuming that the standard rated capacity of each cell is CN, the influence of the battery pack capacity of two topologies by the inconsistent initial capacity of the cells can be expressed as:
- (1)
- Comparison between topology 1 and topology 2
Comparing Equations (9) and (10), when the two Equations take the same m and n, there are:
Therefore:
Therefore:
That is, when only the initial capacity is inconsistent, the capacity of topology 1 battery packs is always less than that of topology 2 battery packs when the two topologies take the same m and n.
Furthermore, we can get the following results when m and n are the same.
That is, when the same m and n are taken, the capacity of the battery packs of topology 1 is more affected by the inconsistency of the cell capacity than that of topology 2, which is consistent with the simulation conclusion.
- (2)
- Internal comparison between topology 1 and topology 2
Assuming that the initial capacity of the cells follows a normal distribution, that is:
For topology 1, take its sample statistic [18] as ; for topology 2, take its sample statistic as , then:
Combining Equations (11) and (18), we can see that the obeyed distribution is the black curve in Figure 10.
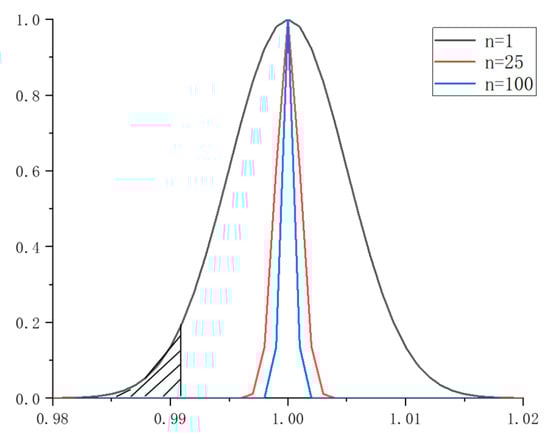
Figure 10.
Sample random quantity normal distribution.
When n is determined, as m increases, the range of the distribution on the left side of the axis of symmetry described in Equation (18) becomes smaller (the shaded part in Figure 10). That is, the value of decreases as m increases, and gradually stabilizes. In other words, when n is determined, the influence of the battery pack capacity is more affected by the inconsistency of the cell capacity as m increases, and tends to be stable.
When m is certain, can be regarded as a fixed value. According to Equation (11), it is the sum of multiple fixed values and then the average value, the result is not much changed. That is, when m is determined, the sensitivity of the battery pack capacity to the cell capacity does not change much as n increases.
Combining Equations (12) and (19), since the variance of m is closely related to n, thus:
When n is determined, the shape of the normal distribution curve is determined accordingly. At this time, with the increase of m, the range of on the left side of the normal distribution described in Equation (19) gradually decreases, that is, the value of first decreases with the increase of m and then basically remains unchanged. In other words, when n is determined, the influence of the battery pack capacity is more affected by the inconsistency of the cell capacity as m increases, and then tends to stabilize.
When m is fixed, the normal distribution curve tends to be linear with the increase of n. When n is large enough, the normal distribution curve of tends to a vertical line, as shown in the red (n = 25) and blue (n = 100) curves in Figure 10. At this time, the difference of cell capacity will no longer affect the capacity of the battery packs. That is, when m is determined, the influence of the battery pack capacity to the inconsistency of the cell capacity decreases as n increases, and then tends to stabilize.
The above analysis results, from a statistical perspective, are consistent with the previous simulation conclusions.
4.2. The Initial SOC of the Cells Is Inconsistent
When the initial SOC of the cells is inconsistent, the method of analyzing the simulation results, from the statistical point of view, is the same as that in Section 4.1, so it is not repeated here.
4.3. The Initial Internal Resistance of the Cells Is Inconsistent
In the battery system with parallel structure, when the internal resistance difference between the parallel branches leads to the unbalanced charging, the parallel branches realize the equalization by charging and discharging each other. Therefore, when analyzing the influence of the battery pack capacity by the inconsistent internal resistance of the cells, the series structure needs to be focused on.
Therefore, when analyzing the influence of the battery system capacity by the inconsistent internal resistance of the monomer, the series structure should be analyzed mainly.
When there is only difference in internal resistance between cells, the difference in internal resistance will lead to SOC difference between cells under the same charging and discharging current, which will affect the capacity of battery packs.
For any SCM in topology 1, its capacity is limited by the cells with the largest internal resistance and the cells with the smallest internal resistance in the SCM. Based on Equation (5) and referring to Equation (11), when the inconsistent internal resistance of the cells leads to inconsistent SOC, the SOH of topology 1 can be expressed as:
It should be pointed out that the above analysis is different from Section 4.2. In Section 4.2, only the initial SOC is different, and the initial SOC obeys a normal distribution. However, the SOC is inconsistent, caused by the inconsistent internal resistance of the cells, and the SOC does not obey the normal distribution. For cells with different internal resistances, they obey normal distribution:
According to Ohm’s law and the Uocv–SOC curve, resistance is positively correlated with voltage, and voltage is positively correlated with SOC, so:
Therefore, in topology 1, when n is determined, as m increases, the value of the cells Rij tends to spread across the entire normal distribution, and the difference between Rmax and Rmin is also greater; refer to Equation (22). The SOC difference between the two cells determined by Rmax and Rmin is greater. At this time, according to Equation (5), the capacity of the SCM is smaller, and the SOH of the battery pack is more affected by the inconsistent internal resistance of the cells. When the value of m reaches a certain value, the influence tends to remain unchanged. When m is determined, because topology 1 is SCM in parallel, each SCM can charge and discharge each other. Therefore, when n changes, the influence of the battery pack capacity affected by the inconsistency of the cell internal resistance is not obvious
In the same way, in any PCM in topology 2, because it is connected in parallel, cells with different internal resistances can charge and discharge each other. Therefore, when m is determined, as n changes, the SOH of the battery pack is affected by the inconsistency of the internal resistance of the cells without obvious changes. When n is determined, the capacity of the battery pack is affected by the inconsistency of the internal resistance of the cells, with the increase of m, it first decreases and then basically remains unchanged.
The above analysis is consistent with the simulation conclusion, indicating the correctness of the simulation.
5. Experiment and Analysis
In order to further verify the correctness of the simulation results and theoretical analysis, taking six cells as an example, six different topologies were combined through different series and parallel connections (Figure 11), and charge and discharge experiments were performed on them. The experiment used a cylindrical 18,650 ternary lithium battery with a nominal capacity of 2000 mAh and an ambient temperature of 25 degrees. The charging used a constant current–constant voltage mode, and the discharge used a constant current mode. The charging parameter settings of each topology are shown in Table 2, the distribution of cell parameters is shown in Table 3, and the experimental platform is shown in Figure 12.
Table 2.
Battery system charge and discharge parameters.
Table 3.
Statistical distribution of cell parameters.
The experiment adopted the orthogonal method [19,20], considering multiple factors (monomer capacity, internal resistance, and terminal voltage) and multiple levels (variation of each factor), and selected representative points from the conventional comprehensive experiment to conduct the experiment. In this experiment, four experiments were set up for each battery pack topology, and the orthogonal test table design for each experiment is shown in Table 4, based on which, the influence of battery cell static parameters on the capacity of different topology battery packs can be calculated as Equation (24). Among them, because the initial SOC of the battery is not easy to control, and considering that the battery voltage is a certain function of the SOC, in the experiment, the cell capacity (Q), voltage (U), and internal resistance (R) were taken as variables, and the battery pack capacity (C) was the dependent variable. Each charge and discharge experiment was repeated four times, and the battery pack capacity was the average value of the four tests.
Table 4.
Module equivalent capacity orthogonal experiment table L (23).
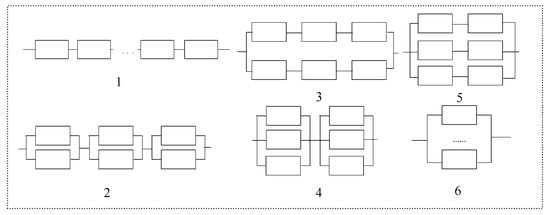
Figure 11.
Topology diagram of the experimental battery system.
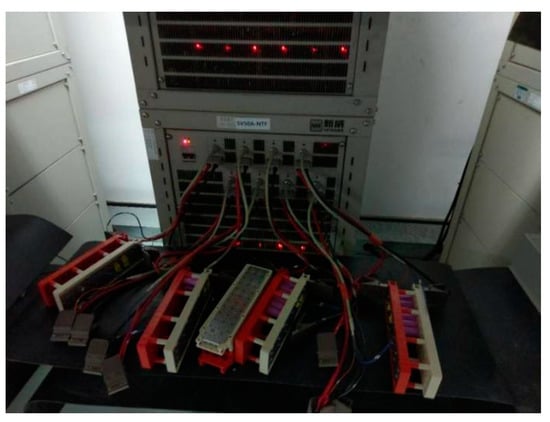
Figure 12.
Experiment platform [20].
Figure 13 shows the test results of battery pack capacity with different topologies and different experimental groups.
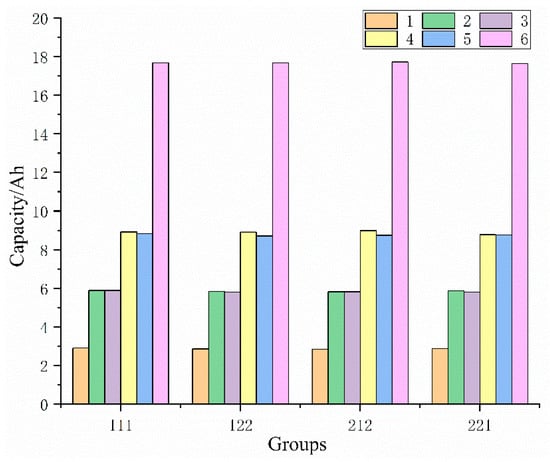
Figure 13.
Battery pack capacity of different topologies and different experimental groups.
For comparison, the above experimental results were normalized:
Among them: Cx is the capacity of the battery packs tested, CN is the theoretical capacity of the battery packs, and i is the experimental group with values of 1, 2, 3, and 4.
On this basis, for the m (m = 1,2... 6) topology modules, the range parameters reflecting the influence of the inconsistency of the cell parameters on the battery pack capacity are calculated as:
It can be seen from Equation (24) that the magnitude of the range parameter reflects the degree of influence of the battery module capacity by the cell parameters. The larger the value of the range parameter, the smaller the effect, and the smaller the value, the greater the effect.
Bringing in the experimental data, the calculation results are shown in Table 5.
Table 5.
Range of influence of parameter inconsistency on module discharge capability.
Take the inconsistent internal resistance as an example. The range KmR, which reflects the effect of cell inconsistency on the capacity of battery packs, is observed and compared with the simulation results and conclusions. Comparing the topology 1-3-5-6 in Figure 11, the range sequence obtained from the experiment is:
Comparing the simulation results in Figure 8 and its conclusions, it can be seen that the evolution of the data in KmR1 is consistent with the simulation conclusion in Figure 8, which verifies the correctness of the simulation and its conclusions.
Comparing the topology 1-2-4-6 in Figure 11, the range sequence obtained from the experiment is:
Comparing the simulation results in Figure 9 and its conclusions, it can be seen that the evolution of the data in KmR2 is consistent with the simulation conclusion in Figure 9, which verifies the correctness of the simulation and its conclusions.
In the same way, the range Kmq, which reflects the effect of the inconsistency of cell capacity on the discharge capacity of the module, can be analyzed, which is consistent with the simulation results and is not repeated here.
6. Conclusions
Compared with the research methods and conclusions described in other documents, the analysis in this paper is not limited to a specific topology, and the analysis methods and conclusions are universal. This paper compares the influence of the battery pack capacity of different topologies by the cell parameters, and draws the following conclusions:
- (1)
- In general, the battery pack composed of parallel SCMs is more affected by the inconsistent initial capacity and the inconsistent initial SOC than the battery pack composed of multiple PCMs in series, and the latter is more sensitive to the inconsistency of the cell internal resistance than the former.
- (2)
- For a battery pack composed of multiple SCMs in parallel, as the number of cells connected in series in the SCM increases, the influence of its capacity to inconsistent initial cell capacity, inconsistent initial SOC, and inconsistent initial internal resistance all increase, and gradually stabilize. With the increase in the number of SCMs in parallel, the influence of its capacity to inconsistent initial cell capacity basically remains unchanged, and the influence to inconsistent initial SOC gradually decreases and tends to stabilize. For a battery pack composed of multiple PCMs connected in series, as the number of parallel cells in the PCM increases, the influence of its capacity to inconsistent initial cell capacity and inconsistent initial SOC gradually increases and tends to stabilize. With the increase in the number of PCMs connected in series, the influence of its capacity to inconsistent initial cell capacity and inconsistent initial SOC gradually increases and stabilizes, and the influence of the inconsistent internal resistance of the cells gradually decreases and tends to stabilize.
- (3)
- When designing the topology of the battery packs in practice, if the maximum capacity of the battery pack is the design goal, then:
- When only the initial capacity is inconsistent between the cells: If topology 1 is used, the number of cells in series in the SCM should be minimized. If topology 2 is adopted, the number of parallel cells in PCM should be increased appropriately.
- When only the initial SOC is inconsistent between the cells: If topology 1 is adopted, the number of series-connected cells in the SCM should be minimized, and the number of parallel-connected SCMs should be appropriately increased. If topology 2 is adopted, the number of parallel cells in the PCM should be increased appropriately.
- When only the initial internal resistance is inconsistent between the cells: Regardless of topology 1 or topology 2, the number of parallel branches should be appropriately increased.
The next step will be on the basis of this article, comprehensively considering the cell dynamic parameters (temperature, coulombic efficiency, capacity decay rate, internal resistance change rate, self-discharge rate, etc.) that affect the battery pack capacity. Further study will be conducted on the sensitivity of the battery pack capacity with different topologies to the cell dynamic parameters, which may provide a reference for the design of the battery packs.
Author Contributions
Conceptualization, S.W. and Z.Y.; methodology, S.W. and Z.Z.; software, S.T.; formal analysis, S.W.; investigation, S.W.; data curation, Y.H.; writing—original draft preparation, D.Y. and X.L.; writing—review and editing, D.Y. and X.L.; All authors have read and agreed to the published version of the manuscript.
Funding
This research received no external funding.
Conflicts of Interest
The authors declare no conflict of interest.
References
- Mehmood, K.; Iftikhar, Y.; Chen, S.; Amin, S.; Manzoor, A.; Pan, J. Analysis of Inter-Temporal Change in the Energy and CO2 Emissions Efficiency of Economies: A Two Divisional Network DEA Approach. Energies 2020, 13, 3300. [Google Scholar] [CrossRef]
- Wen, G.; Rehman, S.; Tranter, T.G.; Ghosh, D.; Chen, Z.; Gostick, J.T.; Pope, M.A. Insights into Multiphase Reactions during Self-Discharge of Li-S Batteries. Chem. Mater. 2020, 32, 4518–4526. [Google Scholar] [CrossRef]
- Rehman, S.; Khan, K.; Zhao, Y.; Hou, Y. Nanostructured cathode materials for lithium-sulfur batteries: Progress, challenges and perspectives. J. Mater. Chem. A 2017, 5, 3014–3038. [Google Scholar] [CrossRef]
- Zhou, J.; Hua, Y.; Liu, K.; Lan, H.; Fan, C. Research on a high-precision modeling scheme for lithium-ion battery. Proc. CSEE 2019, 39, 6394–6402. [Google Scholar]
- Bai, Y.; Li, J.; He, H.; Dos Santos, R.C.; Yang, Q. Optimal design of a hybrid energy storage system in a plug-in hybrid electric vehicle for battery lifetime improvement. IEEE Access 2020, 8, 142148–142158. [Google Scholar] [CrossRef]
- U.S. Department of Energy. (May 5, 2012). 2011 Nissan Leaf-VIN 0356: Advanced Vehicle Testing-Beginning-of-Test Battery Testing Results. Available online: https://www.energy.gov/eere/vehicles/downloads/avta-2011-nissan-leaf-all-electric-vehicle-testing-reports (accessed on 13 March 2021).
- Ye, M.; Song, X.; Xiong, R.; Sun, F. A Novel Dynamic Performance Analysis and Evaluation Model of Series-Parallel Connected Battery Pack for Electric Vehicles. IEEE Access 2019, 7, 14256–14265. [Google Scholar] [CrossRef]
- Zhou, L.; Zheng, Y.; Ouyang, M.; Lu, L. A study on parameter variation effects on battery packs for electric vehicles. J. Power Source 2017, 364, 242–252. [Google Scholar] [CrossRef]
- Ci, S.; Lin, N.; Wu, D. Reconfigurable Battery Techniques and Systems: A Survey. IEEE Access 2016, 4, 1175–1189. [Google Scholar] [CrossRef]
- Jin, F.; Shin, K.G. Pack sizing and reconfiguration for management of large-scale batteries. In Proceedings of the IEEE/ACM Third International Conference on Cyber-Physical Systems, Beijing, China, 17–19 April 2012. [Google Scholar]
- Savard, C.; Sari, A.; Venet, P.; Niel, E.; Pietrac, L. C3C: A structure for high reliability with minimum redundancy for batteries. In Proceedings of the 17th IEEE International Congres of Industrial Technology, Taipei, Taiwan, 14–17 March 2016; pp. 281–286. [Google Scholar]
- Plett, G.L.; Klein, M.J. Simulating battery packs comprising parallel cell modules and series cell modules. In Proceedings of the 24th International Battery, Hybrid and Fuel Cell Electric Vehicle Symposium and Exhibition 2009, EVS 24(1), Stavanger, Norway, 13–16 May 2009; pp. 146–162. [Google Scholar]
- Wang, S.; Yin, Z.; Zheng, Z.; Han, Z.; Yin, W. The influence of cell parameters inconsistency on the performance of different topological battery modules. Electr. Meas. Instrum. 2020, 57, 76–82. [Google Scholar]
- Baronti, F.; Rienzo, R.D.; Papazafiropulos, N.; Roncella, R.; Saletti, R. Investigation of series-parallel connections of multi-module batteries for electrified vehicles. In Proceedings of the 2014 IEEE International Electric Vehicle Conference (IEVC), Florence, Italy, 17–19 December 2014. [Google Scholar]
- Song, X. Study on Modeling and Performance Analysis of Series-Parallel Connected Barrery Pack for Electric Vehicles; Chang’an University: Xi’an, China, 2019. [Google Scholar]
- Hu, X.; Li, S.; Peng, H. A comparative study of equivalent circuit models for Li-ion batteries. J. Power Source 2012, 198, 359–367. [Google Scholar] [CrossRef]
- Peng, S. Modeling and Simulation of Large Capacity Battery Systems Based on the Equivalent Circuit Method. Proc. CSEE 2013, 33, 11–18. [Google Scholar]
- DeGroot, M.H.; Schervish, M.J. Probability and statistics. J. R. Stat. Soc. 2002, 151. Available online: http://www.ru.ac.bd/wp-content/uploads/sites/25/2019/03/101_05_DeGroot_Solutions-Manual-for-Probability-and-Statistics-2012.pdf (accessed on 14 March 2021).
- Liu, Z.; Xing, K.; Rehman, R. Removal of Acid Red 88 Using Activated Carbon Produced from Pomelo Peels by KOH Activation: Orthogonal Experiment, Isotherm, and Kinetic Studies. J. Chem. 2021, 2021. [Google Scholar] [CrossRef]
- Han, Y. Study on the Influence of the Inconsistency of Lithium Battery on the Output Chracteristics under Different Topologies; North China Electric Power University: Beijing, China, 2018. [Google Scholar]
Publisher’s Note: MDPI stays neutral with regard to jurisdictional claims in published maps and institutional affiliations. |
© 2021 by the authors. Licensee MDPI, Basel, Switzerland. This article is an open access article distributed under the terms and conditions of the Creative Commons Attribution (CC BY) license (http://creativecommons.org/licenses/by/4.0/).