Article

Viability and Sustainability Assessment of Bioenergy Value Chains on Underutilised Lands in the EU and Ukraine

by
Cosette Khawaja
1,*,
Rainer Janssen
1,
Rita Mergner
1,
Dominik Rutz
1,
Marco Colangeli
2,†,
Lorenzo Traverso
2,†,
Maria Michela Morese
2,†,
Manuela Hirschmugl
3,
Carina Sobe
3,
Alfonso Calera
4,
David Cifuentes
4,
Stefano Fabiani
5,
Giuseppe Pulighe
5,
Tiziana Pirelli
5,
Guido Bonati
5,
Oleksandra Tryboi
6,
Olha Haidai
6,
Raul Köhler
7,
Dirk Knoche
7,
Rainer Schlepphorst
7 and
Peter Gyuris
8
add Show full author list remove Hide full author list
1
WIP Renewable Energies, 81369 Munich, Germany
2
Food and Agricultural Organization of the United Nations, 00153 Rome, Italy
3
Joanneum Research Forschungsgesellschaft mbH, 8010 Graz, Austria
4
Institute for Regional Development, University of Castilla-La Mancha, 13071 Ciudad Real, Spain
5
CREA Research Centre for Agricultural Policies and Bioeconomy, 00198 Rome, Italy
6
Scientific Engineering Centre Biomass Ltd., 03127 Kyiv, Ukraine
7
Research Institute for Post-Mining Landscapes, 03238 Finsterwalde, Germany
8
Geonardo Environmental Technologies Ltd., 1031 Budapest, Hungary
*
Author to whom correspondence should be addressed.
The views expressed in this publication are those of the author(s) and do not necessarily reflect the views or policies of the Food and Agriculture Organization of the United Nations.
Energies 2021, 14(6), 1566; https://doi.org/10.3390/en14061566
Submission received: 23 February 2021 / Revised: 8 March 2021 / Accepted: 9 March 2021 / Published: 12 March 2021

Abstract

:
Bioenergy represents the highest share of renewable energies consumed in the European Union and is still expected to grow. This could be possible by exploring bioenergy production on Marginal, Underutilised, and Contaminated lands (MUC) that are not used for agricultural purposes and therefore, present no competition with food/feed production. In this paper, the viability and sustainability of bioenergy value chains on these lands is investigated and measures for market uptake were developed. Using three case study areas in Italy, Ukraine, and Germany, a screening of MUC lands was conducted, then an agronomic assessment was performed to determine the most promising crops. Then, techno-economic assessments followed by sustainability assessments were performed on selected value chains. This concept was then automated and expanded through the development of a webGIS tool. The tool is an online platform that allows users to locate MUC lands in Europe, to define a value chain through the selection of bioenergy crops and pathways, and to conduct sustainability assessments measuring a set of environmental, social, and economic sustainability indicators. The findings showed positive results in terms of profitability and greenhouse gas emissions for bioethanol production from willow in Ukraine, heat and power production from miscanthus, and biogas and chemicals production from grass in Germany. The webGIS tool is considered an important decision-making tool for stakeholders, which gives first insights on the viability and sustainability of bioenergy value chains.

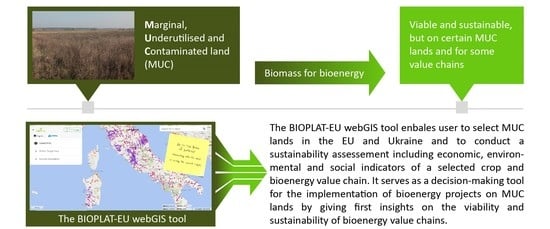
Graphical Abstract

1. Introduction

Bioenergy plays an important role and is a key element in reaching the European climate targets which requires to fulfil at least 20% of its total energy needs with renewable energies for 2020 and 32% for 2030 [1]. In 2016, the contribution of bioenergy (electricity, heat, and transport fuels) to the gross final energy consumption was 116 Mtoe (59% of all renewables and 10% of all energy sources) [2]. The supply of biomass for bioenergy (i.e., primary energy) reached 140 Mtoe in the EU in 2016, of which 4% was imported from non-EU countries and 96% was sourced from within the EU [2]. Direct and indirect supply of woody biomass accounted for 60.7% (82 Mtoe) of all EU domestic biomass supplied for energy purposes. Around 27% (36 Mtoe) originated from agricultural biomass (agricultural crops and by-products), with waste (municipal, industrial, etc.) making up the remaining 12.4% (17 Mtoe) [2]. Under the 2010 National Renewable Energy Action Plans, total biomass demand for electricity, heating, and transport is planned to reach 178 Mtoe by 2020 and the supply from agricultural crops including energy crops would need to increase by 29% and much more by 2050 [3]. In its long-term vision, the European Commission assumes that, if cultivated in a sustainable manner, short rotation coppices and perennial energy grasses can play an important role as feedstock in the production of biofuels and biogas. They represent one of the few alternatives for replacing fossil fuel methane in the gas grid and decarbonising the air transport, road freight, and maritime sectors [2].
Furthermore, bioenergy is an important element in supporting the UN Sustainable Development Goals (SDGs) in the context of climate change and energy security and implementing the Paris Agreement on climate change [4]. In the special report of the IPCC on the impacts of global warming of 1.5 °C, it was mentioned that bioenergy use is substantial due to its multiple roles in decarbonising energy, but only if it is well managed with no significant impact on agricultural and food systems, biodiversity, and other ecosystem functions and services [5]. The main concerns are food security, land use, and land use change risks on carbon emission increase or biodiversity reduction from bioenergy expansion, and challenges in achieving economic competitiveness and providing high quality and affordable energy services. Therefore, sustainability of bioenergy, which takes into consideration these issues, is a key element in order to comply with the aforementioned goals and to be socially accepted. This is also referred to in the key action number 5 of the Renewable Energy Directive (REDII) concerned with the strengthening of sustainability of bioenergy production and use in the EU [6].
Measuring sustainability in its economic, environmental, and social aspects is a complex exercise which needs a lot of data and know-how for its implementation, but various studies tried to assess one or several aspects [7,8,9]. Wang et al. reviewed the current research in this field and indicated that it is hard to draw an overall conclusion on the sustainability of bioenergy because of limited studies and contradictory results in some respects [10]. Currently, the Global Bioenergy Partnership (GBEP), is the only initiative seeking to build consensus among a broad range of national governments and international institutions on the sustainability of bioenergy. GBEP has developed 24 indicators of sustainability regarding the production and use of modern bioenergy to provide policymakers and other stakeholders with a tool that can inform the development of national bioenergy policies and programmes as well as monitor the impact of these policies and programmes. However, these indicators do not provide answers or correct values of sustainability, but rather present the right questions to ask in assessing the effect of modern bioenergy production and use in meeting nationally defined goals of sustainable development [11].
Several measures can support sustainable bioenergy expansion, one of which is the use of Marginal, Underutilised, and Contaminated lands (MUC) for biomass production as it has been reported by IRENA, IEA, and FAO [4]. These are lands that are generally no longer suitable for food/feed production or for recreational and conservation purposes. However, in some cases, they retain the potential to produce a biomass feedstock suitable for bioenergy production. Furthermore, the use of these lands for biomass production could have positive environmental and socio-economic benefits such as restoring soil productivity [12], increasing biodiversity [13], promoting rural economic development, and increasing household income [14,15]. The main challenge on these lands is that presumably biomass yields may be too low to be profitable.
In an attempt to expand the production of sustainable biomass and bioenergy, this paper aims to first investigate the viability of producing biomass for bioenergy purposes on MUC lands taking into account the techno-economic, environmental, and social aspects of bioenergy value chains. This was done by conducting site-specific agronomic, techno-economic, and sustainability assessments of selected value chains based on the GBEP indicators for three case study countries (Italy, Ukraine, and Germany). Furthermore, market and policy barriers were investigated in the case study regions with the aim of detecting the hindering factors behind the full deployment of bioenergy value chains on MUC lands, beside profitability and sustainability. This was done in the framework of the Horizon 2020 (H2020) funded project “Fostering Sustainable Feedstock Production for Advanced Biofuels on Underutilised Land in Europe” (FORBIO) [16]. The second objective is to describe how the sustainability assessment of a selected value chain on a specific MUC land could be expanded and automated, thus becoming an easy to do exercise that can be performed online by any stakeholder without the need for extensive research, expertise, and funding through the use of the developed webGIS sustainability assessment tool targeted for that purpose. This work is performed within the framework of the H2020 funded project “Promoting Sustainable Use of Underutilised Lands for Bioenergy Production Through a Web-Based Platform for Europe” (BIOPLAT-EU) [17].
The aim of this work is to promote biomass production for bioenergy purposes by exploring new lands that were not previously considered for this purpose and allowing for the conduction of an easy to do exercise, which will give first insights on the feasibility and sustainability of bioenergy value chains.

2. Materials and Methods

The first important step towards proving the viability of bioenergy value chains on MUC lands is to assess their economic, environmental, and social sustainability and then investigate market and policy barriers that might hinder their uptake.

2.1. Site-Specific Sustainability Assessment

As part of the FORBIO project, the sustainability assessment was done by screening the methodologies of the GBEP sustainability indicators and adapting them to an ex-ante methodology and to a sub-national context to assess the sustainability of the investigated biofuel value chains. A first round of harmonisation was therefore necessary to ensure that a valid reference system (known as target area) was able to show absolute and relative indicator impacts associated with the value chains tested in its appropriate context. In other words, when assessing an individual—although large—bioenergy project, it will have impacts of varying magnitude depending on the geographical scale of the evaluation process. A bioethanol plant can provide jobs that are going to impact with a certain magnitude the employment rate of the local municipality in which the plant itself is built, whereas at the national level, the same contribution to this indicator of social sustainability may be negligible. Conversely, the contribution of the produced bioethanol to modern bioenergy services would be overwhelmingly vast if considered at the municipality level. In fact, in this case, the most appropriate reference system would be the regional, national, or even the EU-level, because the contribution of one plant can have a measurable impact on the achievement of policy goals of the entire country or beyond. The methodologies for each indicator are based on the concept of comparing a baseline scenario (the evolution of the current situation, without considering the existence of a bioenergy value chain) and a target scenario, which assumes that planned actions would lead to the creation of a bioenergy value chain. Seventeen indicators were selected in the context of FORBIO. An Excel calculator was developed based on this concept. Detailed information on the design of the sustainability indicator set can be accessed here [18].
In order to apply these indicators and perform a sustainability assessment, the first step was to select MUC sites in three case study countries (Italy, Ukraine, and Germany) and then to identify the most promising crops that can be grown on each of these sites. Techno-economic assessments were then conducted and completed through sustainability assessments.

2.1.1. Site Selection

The identification of MUC lands available for biomass production was done based on in-situ knowledge of the local partners in the three case study areas. The partners pre-selected suitable areas to be examined and investigated the potential for biomass feedstock creation. The study sites represent a good variety of different contaminates, climatic conditions, administrative and economic conditions, in which the development of viable value chains for bioenergy production on MUC lands crucially depends on the strong involvement of industrial players. The locations of the case study areas are shown in Figure 1.
In Italy, the study area is located in southwest Sardinia in the Sulcis region, (39°09′ N, 8°29′ E). The annual mean temperature is 16 °C [19] and the average annual rainfall ranges from 550 to 600 mm.
The area is located in the largest contaminated Site of National Interest in Italy, which is polluted by heavy metals (mainly Cd, Pb, Cu, Zn, and Co) from industrial flumes derived from bauxite and aluminium production and coal power generation, as well as by the previous mining activities. In the municipality of Portoscuso, the legal thresholds values of pollutants are exceeded in the topsoil (0–10 cm) and groundwater in the monitoring network [20]. In this municipality, it is forbidden to cultivate and commercialise agricultural goods and to produce milk due to the potential threat to human health [21].
A GIS-based suitability evaluation of marginal and contaminated land with potential suitability for biomass production within existing land use patterns was conducted. A series of georeferenced data were identified, collected, and organised with a relational geodatabase in order to accurately spatialise the suitable land for the cultivation of crops. The following typologies were collected: soil type map, Digital Elevation Model (DEM), land use map, administrative boundaries, and climate data. Detailed methodology was described in Pulighe et al. [22].
In Ukraine, the case study area is located in the northern part of Kyiv oblast in the southwest of the Ivankiv region (50°49′ N, 029°36′ E). The average annual precipitation ranges from 550 to 650 mm, which is the highest value on the flat part of the country. The average summer temperatures range from +17 to +19.5 °C and that of winter from −4.5 °C to −8 °C [23].
After the Chernobyl nuclear explosion, large areas within the exclusion zone of Kyiv Polissia were not anymore cultivated. This contributed to the intensification of agricultural production in the remaining part of the Ivankiv region resulting in soil depletion and degradation [24]. Currently, the North of the Ukraine (including the Ivankiv region) is six times less populated than other regions due to unsuitable conditions for conducting common agricultural practices (degraded and unproductive lands are unsuitable and economically unprofitable) [25].
A statistical analysis was conducted for the identification of underutilised lands within 100 km radius from the Ivankiv town. This analysis helped to estimate the present and future potential of biomass production from annual and perennial crops. Details about the statistical analysis can be found here [26].
In Germany, the case study area is located in the region of Berlin and Brandenburg, in Northeast Germany. The annual average precipitation amounts to 700 mm in the Northwest parts and it drops to 500 mm in the Southeast. Contrarily, the average annual air temperature raises from 7.0 to 9.5 °C [27]. Even though more than half of the rain precipitation occurs during the summer, there is still a mean water deficit of 176 cm in this period [28]. Therefore, water availability can be a limiting resource for cropping.
Since 1973, within the region of Berlin and Brandenburg, up to 29,000 hectares of former agricultural sites were remodelled for sewage irrigation. Currently, all irrigation treatments of these fields have been stopped. In the official registers, the former irrigation fields are classified as “polluted areas” or “potentially contaminated sites” [29]. The long sewage irrigation periods bringing excessive loads of nutrients and pollutants impaired the soil fertility. Furthermore, hazardous substances would accumulate in the topsoil affecting both plant growth of crop species, which are particularly sensitive to them, and crop utilisation. This led to a termination of cropping on former sewage irrigation fields in 1983 [30]. Recently, a few new stands of short rotation coppice have been established by a local energy supply company and the results look quite promising. These trees are quite tolerant to various heavy metals, and the wood chips will not be used in the food chain. This is also the case for some perennial grasses like miscanthus.
A combined approach was used to identify the underutilised areas. The last systematic inventory of disused irrigation fields based on statistics of the 1990s was compared with existing landscape programs and local land use plans. Then, the current land use status of the known former irrigation fields was interpreted by means of aerial photographs in a GIS-based study.

2.1.2. Agronomic and Techno-Economic Assessment

The data for the agronomic assessment in the three case study areas were based on an analysis of the results from field trials and scientific studies of bioenergy crops conducted in the case study areas. The collected data were analysed taking into consideration crop requirements, cultivation protocols, and site-specific conditions, which can influence biomass composition and yields during the growing season. Details on the methodologies can be found here [26,31,32].
On the basis of the agronomic assessment results, the most promising value chains for bioenergy production were selected and a techno-economic assessment was then conducted. This study considered the costs and revenues of producing and selling bioenergy products at the EU market prices. Annual net benefits were estimated without considering the time of the investment. The most promising value chain scenarios were identified considering land availability, local context, soil quality, available renewable energy production, stakeholders’ involvement, local good practice trial fields, and running projects in addition to cost-benefit long-term considerations.

2.2. Market and Policy Barriers

The economic and non-economic barriers to the market uptake of the selected sustainable bioenergy value chains in the case study areas were assessed. A series of multi-stakeholder discussions held during events, workshops, and interviews was carried out to analyse the opportunities and barriers, and discuss their incidence as limiting factors. During every discussion, the results were summarised and transformed into a questionnaire. Participants were then asked to express their opinion on such barriers by filling the questionnaire. The questions were related to the following aspects: air quality, soil quality, water quality, water use, availability and stress, species invasiveness and biodiversity, landscape, land tenure, employment, income generation, health conditions and safety, novelty acceptance, financial security, profitability, access to credit, incentives, capacity development, and agronomical needs. Details about the multi-stakeholders’ analyses are available from [33].

2.3. Roll-Out for an Automated and Pan-European Sustainability Assessment

Based on some positive results in FORBIO and in order to enable a geographical outreach to all European and some neighbouring countries where similar assessments could be conducted easily and online, a web-based tool was developed within the framework of the BIOPLAT-EU project. The so-called BIOPLAT-EU webGIS tool combines a database on MUC lands in the EU and Ukraine with the Sustainability Tool for Europe and Neighbouring countries (STEN). The maps are developed based on high-resolution data such as Copernicus high-resolution layers (HRLs), time series data from Sentinels, and other satellites and their related attributes. The STEN tool assesses the social, environmental, and techno-economic sustainability aspects of defined bioenergy value chains on MUC lands.

2.3.1. Pan-European MUC Land Mapping

A compilation of a database of existing MUC lands in Europe was performed. This database was generated based on Earth Observation satellite data from Copernicus and from other national and European sources. The database is a compilation of:
  • results from related EU and international projects that have already produced valuable tools, maps, and information, which addresses sustainable bioenergy production on MUC lands;
  • data provided by governments as well as public and private stakeholders and;
  • results of remote sensing-based classification of underutilised lands in terms of time series analysis to complete the gaps.
Originally, marginal lands, which are considered lands with biophysical constraints (e.g., low fertility) or socio-economic constraints (e.g., difficult accessibility, absence of markets) [34], were also considered in the MUC land map. However, during the review of existing databases, it turned out that marginal lands categorised within the above-definition might not be usable within the framework of BIOPLAT-EU. This is because the framework condition was set to consider only land, which is currently not used or not usable (due to contamination) for food production. In fact, it was detected that marginal lands are often being used for food production despite their marginality, such as large areas of olive cultivation in Southern Italy. To avoid the “food versus fuel” issue, it was decided to include only marginal lands, which are not cultivated. This characteristic would then make those lands fall in the underutilised lands category which are considered as lands that had no signs of human activity (including grazing) over the past five years [35]. Hence, the final MUC map is a pan-European map of contaminated and underutilised lands.
For the identification of underutilised land, the envisaged wall-to-wall, continental-wide coverage detection can only be achieved through reasonable effort by remote sensing approaches. Landsat 8 (L8) from 2014–2019 was used to fulfil the five-year requirement and complemented by Sentinel-2 (S2) data from 2018 and 2019. The analysis was carried out in a stratified manner by biogeographical region and country using Google Earth Engine, an online cloud-based processing engine used for geospatial analyses and available for free for research projects. The separate assessment for each biogeographical region is needed, as underutilised lands show significantly different properties depending on their climatic, elevation, and soil properties. For a detailed description of the applied approach to map underutilised lands, the reader is referred to Hirschmugl et al. 2021 [36].
For the assessment of the contaminated lands, the Joint Research Centre map of heavy metals concentration in soils was used [37]. Its spatial resolution is 1 × 1 km and it covers 27 EU member states (not including Croatia). Maps of nine different heavy metals are provided: Cadmium, Arsenic, Chromium, Cobalt, Mercury, Copper, Nickel, Lead, Manganese, and Antimony. For each of the heavy metals, thresholds had to be defined to separate contaminated from non-contaminated soils. The threshold values represent the amount of heavy metals in soils, above which the use of the soil for food and fodder are not allowed or advisable.
The relevant EU directive [38] gives only ranges of values (Table 1 “EU directive”) rather than a specific threshold value. Previous studies [39] used Finnish thresholds for the whole of Europe, as these thresholds are well in line with the EU-directive. Within the BIOPLAT-EU project, national thresholds were used, if available. Only for countries with no national thresholds (i.e., Bulgaria, Estonia, Ireland, Latvia, Liechtenstein, and Slovenia) were concentrations proposed by Toth et al. used [39].

2.3.2. STEN Tool

A further adaptation of the FORBIO sustainability assessment methodologies described in Section 2.1.2 was required. The STEN tool signalled a significant progression in the harmonisation process from the work done in FORBIO for the development of a comprehensive, effective, and above all automated sustainability assessment. Without the harmonisation of the various methodologies, the interconnection among all sustainability indicators would not have been possible, and results would have been hardly considered within a common reference system.
This harmonisation process mainly comprised an additional reduction in the number of sustainability indicators. The resulting nine sustainability indicators are listed in Table 2 and were divided between “standard” and “advanced” indicators. The standard indicators are measured automatically by the tool, only by providing the basic information to characterise the value chain and to specify where the analysis would take place (bioenergy site). In contrast, the users are required to fill out most of the information for the advanced indicators to assess the change between the baseline and the target (with project) scenario. The standard indicators are in turn divided into three environmental indicators (Air emission, Water use, Land Use Change), one social indicator (Jobs in bioenergy sector) and four economic indicators (Net Energy Balance, Gross Value Added, Infrastructure, Capacity for the use of bioenergy). The advanced indicators, which are economic indicators are: Income, Land tenure, and Energy access. Furthermore, although the site-specific sustainability assessment (FORBIO) was based more on advanced bioenergy productions (mainly cellulosic ethanol and biomethane), STEN integrates many more crops and bioenergy pathways. This ensures the covering of all types of bioenergy, including first and 2G biofuels relying on the increased number of crops, bioenergy pathways and value chains.

2.3.3. BIOPLAT-EU webGIS Tool Development

The BIOPLAT-EU webGIS tool is formed by integrating and combining geospatial data (a set of basic layers including the GIS maps of MUC lands) and the STEN tool to perform European-wide sustainability assessments. Its development was carried out in three phases. In the first phase, the conceptual design was defined. This included the identification of user requirements, user profiles, and the use cases. The main variables and the algorithms to compute the set of sustainability indicators were identified. The webGIS system interaction with users were defined using the wireframe technique to visualize how the user would interact with the maps and the STEN.
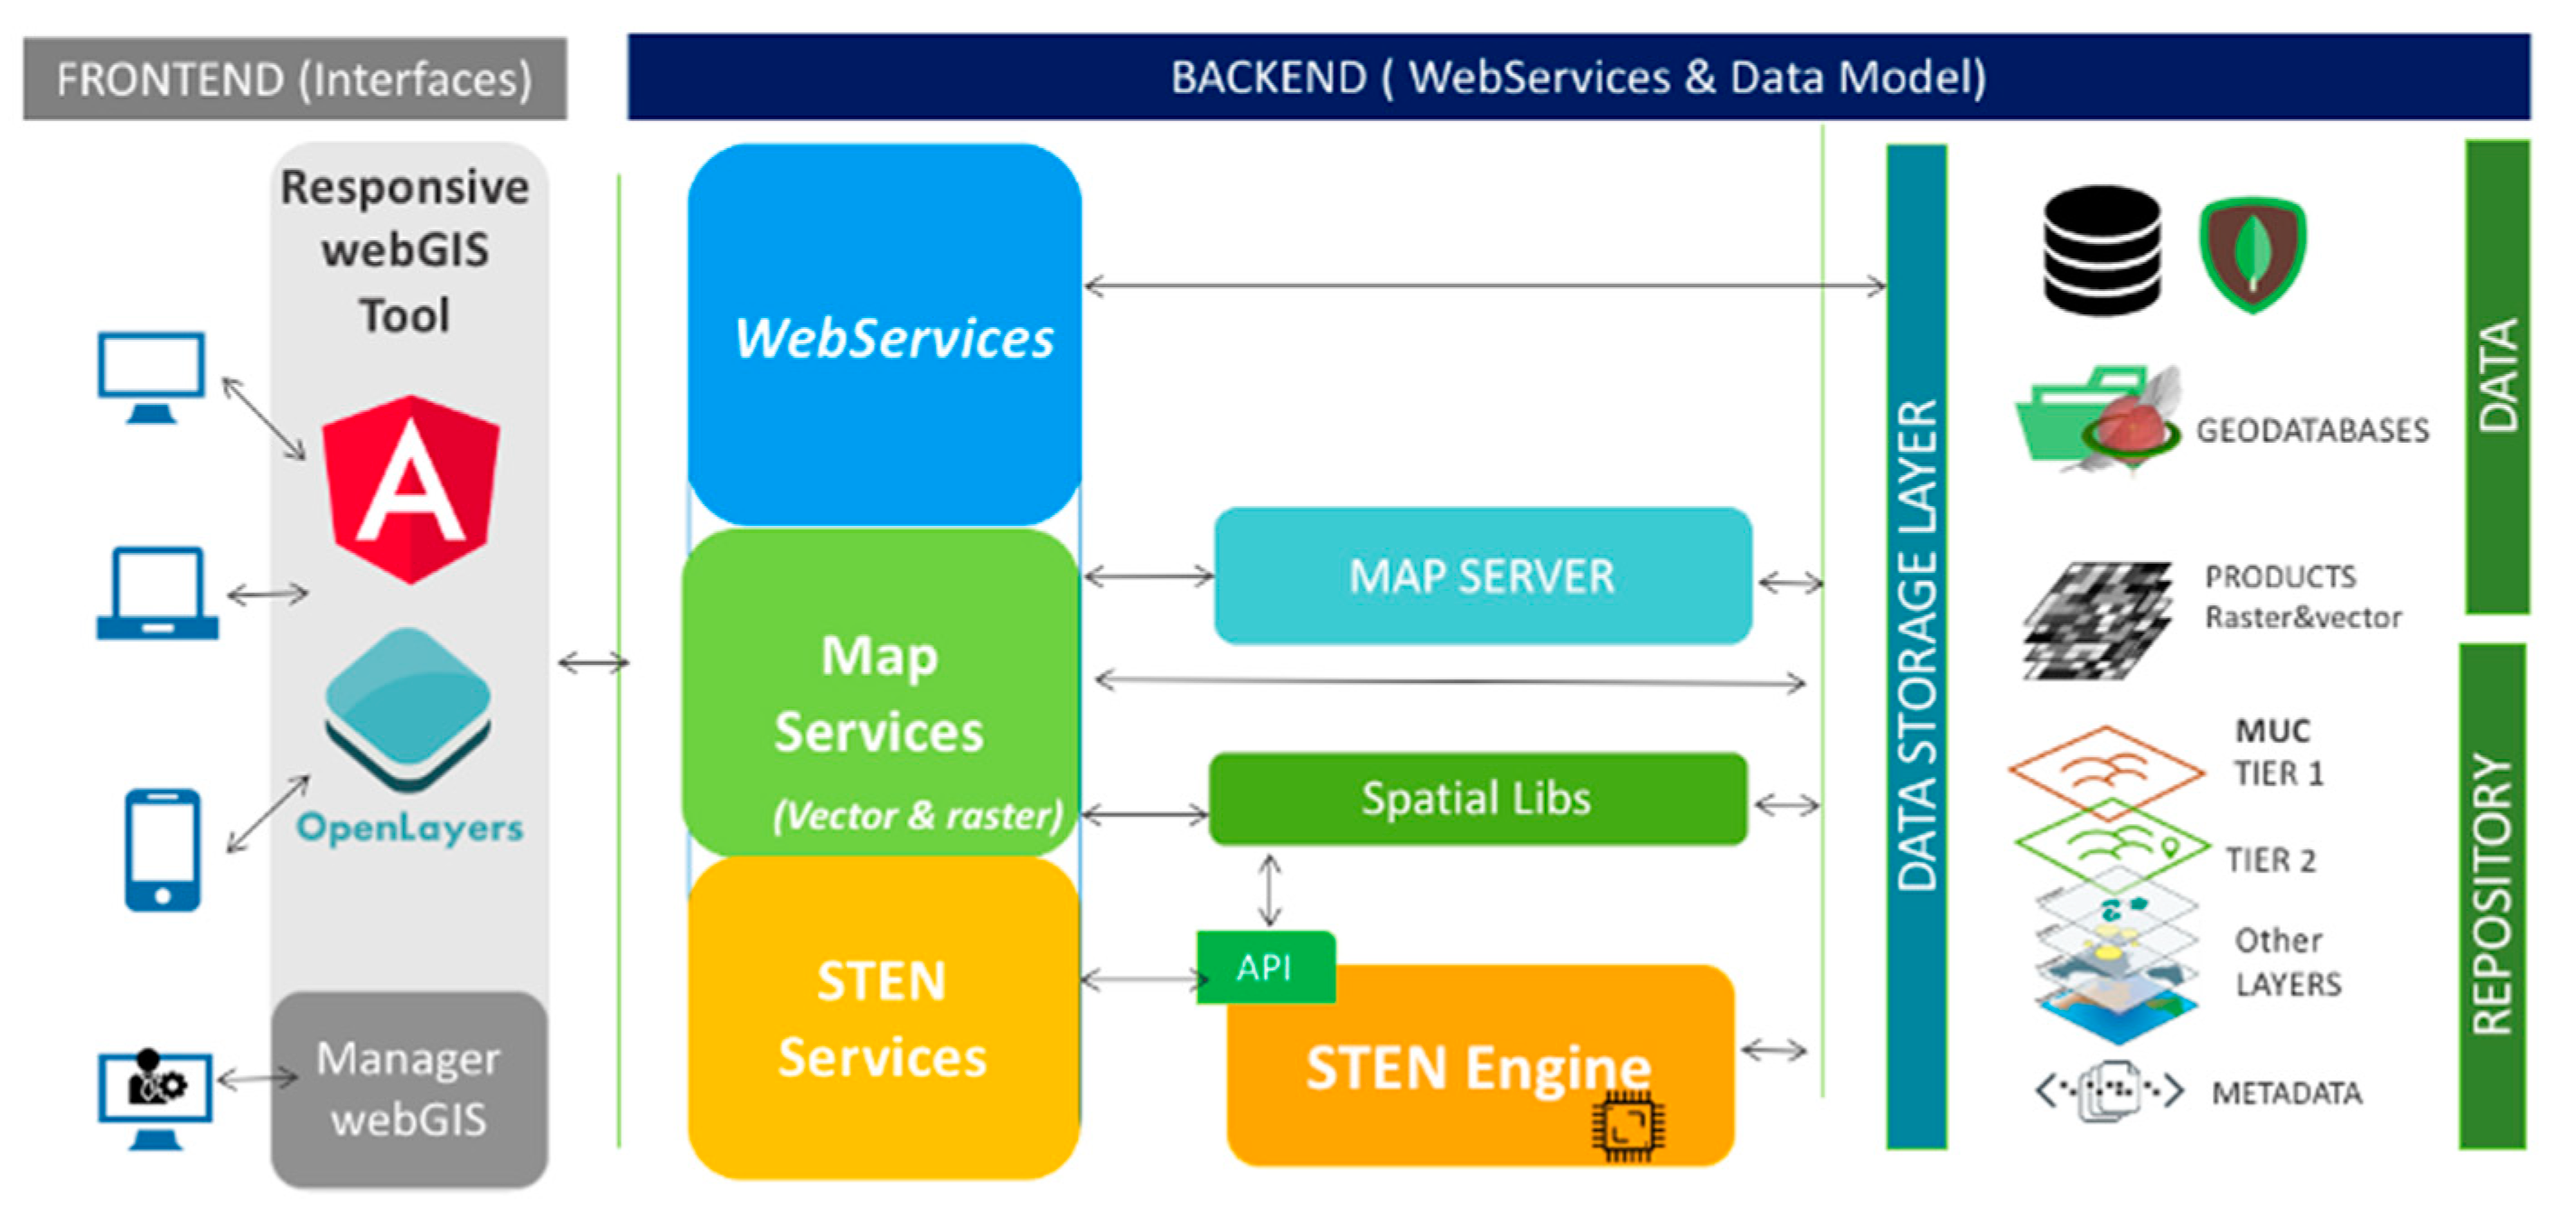
During the second phase, the prototype was developed. Its construction was carried out through agile management processes based on incremental life cycles to achieve a progressive growth of functionality. The prototype is based on the user requirements analysis, the construction of a mockup to ease interaction with users, the collection of information and elaboration of basic layers for the data model, and the development of the STEN tool for the calculation of the sustainability indicators. The webGIS tool prototype is a distributed information system with at least one server and one client, where the backend is a GIS server, and the front end is a webGIS client that runs in a Web browser. The architecture of the system is based on a client-server. The frontend includes the interface of the map, the form tool for STEN, and a representation of outputs. The map viewer allows displaying the information of interest and using that information to perform simulations of the MUC lands registered in the system. The map viewer core functionalities for layer management, layer editing, visualisation, and data management strategies were developed. The backend is made up of the set of web services, libraries, and calculation engines that implement the logic of the system, as well as the data storage layer (Figure 2).
In the third phase, the webGIS prototype will integrate all the GIS layers and the data required for its full operation and will be tested and fine-tuned before making it available for public use.

3. Results

3.1. Site-Specific Sustainability Assessments

The results of agronomic, techno-economic, and sustainability assessments for the site-specific assessments are presented below; more details for the Ukrainian and the Italian site can be found in Traverso et al. [40], and for Germany in Knoche et al. [41]. It is worth noting that in general the choices of the value chains were considerably affected by the interest of the industries in the region who have done an extensive research work on this subject.

3.1.1. Italy

Based on the GIS-based multi-criteria approach and considering a supply radius of 70 km from a hypothetical biorefinery located in Portoscuso, the total area suitable for biomass cultivation was 51,000 ha. The review and analysis of the available literature data for Sardinia revealed that giant reed (Arundo donax L.) is the most promising crop among perennial grasses for bioenergy production in the study area, and milk thistle (Silybum marianum L. Gaertn.) is the most promising among annuals [31].
Giant reed presents good comparative performances regarding yield, low irrigation needs, nutrient requirements, and water efficiency. Furthermore, it has a good conversion rate into ethanol. Based on these conclusions, giant reed was selected as a biomass feedstock for the production of second-generation bioethanol for which a techno-economic assessment was conducted.
It is important to mention that the assessment is hypothetical as it considers the existence of a second-generation bioethanol plant of a capacity of 40,000 t/year in Portovesme. The biomass yield of irrigated Giant reed was considered to be 25 t DM/ha/yr [42]. Since 70 km radius allows for a theoretical very large area available, it seems realistic that in practice the collection radius could be reduced to 40 km. Based on these assumptions, 7000 to 8200 ha of land is needed. The theoretical costs of the giant reed biomass production at plant gate summed up to 71 EUR/t DM [43]. The production cost of 2G ethanol was estimated to be 936 EUR/t. At an ethanol price of 534 EUR/t, the profitability indicator was negative by 4,120,000 EUR/year.
The environmental indicators showed generally positive impacts. The GHG performances of lignocellulosic ethanol would lead to at least a 64% reduction in tonnes of CO2eq when compared to petrol. Soil quality aspects such as erosion and soil organic carbon content would be favourably impacted by the production of biomass for biofuels production as opposed to the current situation in the target area. Water use and efficiency varies greatly between the different scenarios tested: rainfed biomass production does not require irrigation water, but it is 13% less efficient than irrigated biomass production in regard to the amount of water required per unit of energy produced. When compared with the current land cover, biomass production can reduce the infiltration of pollutants in the groundwater. Finally, biodiversity may be positively impacted in the target area. The detailed reports on the agronomic, techno-economic, and sustainability assessments can be found here [31,43,44].

3.1.2. Ukraine

Based on the statistical analysis, the potential surface of underutilised lands within a radius of 100 km from the Ivankiv town was estimated to be 55,000 hectares. Two land categories were defined as underutilised in the assessment [26]:
  • Abandoned agricultural lands, which are lands that are no longer needed for food and feed production or for other purposes;
  • Degraded or low productive lands, which are lands that are not suitable anymore for conventional commercial agriculture.
Many crops were investigated for their suitability in the case study regions. Willow (Salix viminalis L.) was considered the most suitable crop after analysis and review of field research [26].
The techno-economic assessment was conducted selecting willow as energy crop for second-generation ethanol production. It was assumed that a hypothetical biorefinery plant with a capacity of 33,400 t/year will be constructed in the Ivankiv town. 16,700 ha of land within 50 km radius from the plant were considered needed for the biomass production, assuming a mean biomass productivity of 10 t DM/ha/year [45]. The theoretical costs of the willow biomass production at plant gate summed up to 28.7 EUR/t DM [45]. Compared to the Italian case study, there is no irrigation, maintenance of irrigation systems, and supply management costs. The major costs (55%) include agricultural operations and eradication costs.
Looking at the economic indicators of the sustainability assessment, the production cost of 2G ethanol summed up to 758 EUR/t considering hypothetical investment costs. Assuming a sale price of 2G ethanol of 534 EUR/t, the profitability indicator showed a possible positive net annual benefit for 2G biorefinery of 9,457,152 EUR.
Concerning the environmental indicators, the GHG performances of lignocellulosic ethanol would lead to at least 57% reduction in tonnes of CO2eq when compared to petrol. Soil organic matter would increase by 314 kg/ha/year if the current underutilised lands are cultivated with willow for biomass production. Biodiversity may be positively impacted. The detailed reports of the agronomic, techno-economic, and sustainability assessments can be found here [26,45,46].

3.1.3. Germany

The investigations concluded that 1140 ha to 3917 ha of former sewage irrigation fields are available for the potential cultivation of energy crops. The potential size of this area is calculated without taking into consideration economical, ecological, and political barriers.
Although food and feed production is impossible on the disused sewage irrigation fields, they are still considered suitable for biomass feedstock production. However, such set-aside land requires higher operating costs while providing relatively low or uncertain yield potential with respect to regular agricultural crops. This clearly calls for an alternative land use based on low-input and undemanding crops such as self-regenerating grasses, well suited to grow on lighter soils and dry lands.
The agronomic assessment showed that among the energy crops suitable for plantation on the former sewage irrigation field, Sorghum bicolor/sudanese [46] and Siliphium perfolatium [47,48] are the most promising crops suited for a biogas value chain, whereas Miscanhtus x giganteus and Populus x sps. are the most promising for wood chip production [32]. Perennial miscanthus was in the end selected among the other energy crops for the techno-economic assessment in the framework of the FORBIO project considering two value chain scenarios [49].
  • Scenario 1: Supply of miscanthus chips to the three existing biomass power plants at average market prices
  • Scenario 2: Supply of miscanthus chips to a newly built Combined Heat and Power (CHP) biomass plant for combined heat and power production
The costs and revenues of the miscanthus supply chain in the two scenarios were calculated over a period of 20 years, considering a plantation on 1140 ha of disused sewage irrigation fields and a sustainable yield potential of 15 t DM/ha/year (Table 3). In Scenario 1, the costs were estimated to be between 13.1 and 16.7 Million EU/20 years and the revenues 26.4 Million EU/20 years, making a net benefit between 9.7 and 13.3 Million EUR over 20 years and a net annual benefit between 485,000 EUR and 665,000 EUR. The revenues in this scenario come from selling the miscanthus chips to the existing biomass power plants at 80 EUR/t DM (market price). In this case, the value chain ends at plant gate. In Scenario 2, the costs including investments in the construction of a new CHP plant accounted for 40 Million EUR/20 years while the revenues were estimated at 88 Million EU/20 years coming from electricity sale at 0.1488 EUR/kWh and 44 Million EU/20 year coming from heat sales at 0.05 EUR/kWh. The net benefit in this case was 92 Million EUR over 20 years and the net annual benefit was 6.6 Million EUR. The value chain considering investments is completed upon the production of heat and electricity, and therefore the revenues are considered to be the sale of electricity and heat.
Aside from assessing miscanthus as a biomass feedstock, the use of grass waste from the mowing of the sewage irrigation fields considered as permanent grassland was also assessed for bioenergy production. In this context, two value chain scenarios were considered:
  • Scenario 3: Supply of grass silage for one of the operating nearby biogas plants at usual market prices
  • Scenario 4: Retrofitting an existing biogas plant by integrating a new grass biorefinery module
The costs and revenues from the grass supply chain in the two scenarios were also calculated over a period of 20 years considering 1140 ha of sewage irrigations fields and a sustainable yield potential of 3 t DM/ha/year (Table 4). The grass biorefinery concept draws from Mandl et al. [50]. However, there is a data gap, as the biochemical output depends on species composition, growth conditions, cutting frequency, and date.
In Scenario 3, the costs were estimated at 1.7 Million EU/20 years and the revenues 4.1 Million EU/20 years, making a net benefit of 2.4 Million EUR over 20 years and a net annual benefit of 120,000 EUR. The revenues in this scenario come from selling the grass silage to the existing biogas plants at 60 EUR/t DM. In Scenario 4, the costs considering investments in a new grass biorefinery module was estimated at 4 Million EU/20 years, while the revenues estimation ranged from 6.7 to 9.6 Million EU/20 years coming from sales of amino acids and 0.4 Million EU/20 years coming from sales of lactic acid. The net benefit in this case ranged from 3.1 to 6 Million EU over 20 years and the net annual benefit from 155,000 to 300,000 EUR.
The sustainability assessment was conducted only for Scenario 4. The GHG performances of biomethane would lead to at least 84% reduction in emissions when compared to natural gas, but only if leakages are not counted. The soil organic carbon content in the soil slightly decreases. The water use and efficiency are positive. The detailed reports of the agronomic, techno-economic, and sustainability assessments can be found here [32,45,50].

3.2. Market and Policy Barriers

In the three case study countries, the main perceived and important barriers towards the uptake of advanced bioenergy value chains are the financial security as well as the availability of incentives to be provided to farmers (tax breaks, tariffs, etc.).
In Germany and Italy, stakeholders saw that profitability and the lack of clear and shared economic benefits for all actors of the value chain are also perceived as main barriers. Furthermore, in Italy, water use and efficiency aspects were very much in question. In order to maximise productivity (and therefore profitability), irrigation during summer months was proposed as a solution, but this could be perceived as a risk in a water scarce climate like that of Sardinia, Italy. Another barrier in Italy seems to be the novelty acceptance. In the Sulcis area, there is lack of knowledge and understanding of advanced biofuel production from biomass. In the area, agricultural production for the energy market is not common and the novelty represented by the advanced biofuel supply chain was seen by most stakeholders with evident scepticism. Additionally, the proposed crop (giant reed) is considered a novelty crop for the local farmers who have no direct experience with its long-term cultivation and is known to them as an invasive crop.
In Ukraine, in addition to financial security and lack of incentives, two of the main identified barriers were the land tenure and the low demand for liquid biofuels in the market. In Ukraine, the land tenure system is not modern and organised as it is the case in most European countries. It is not digitalised, and it is often difficult to access information. It has been reported by farmers and entrepreneurs that if someone wishes to obtain information regarding the ownership of a certain land or to get access to maps, the process is very complex, and without reliable results.
Based on the sustainability assessments and the analysis of the barriers to the deployment of 2G ethanol value chains in Italy and Ukraine, we identified a list of roadmap actions that can facilitate the market uptake of 2G ethanol and the development of its value chains. These are listed and detailed here [33].

3.3. Roll-Out for an Automated and Pan-European Sustainability Assessment

3.3.1. Pan-European MUC Land Mapping

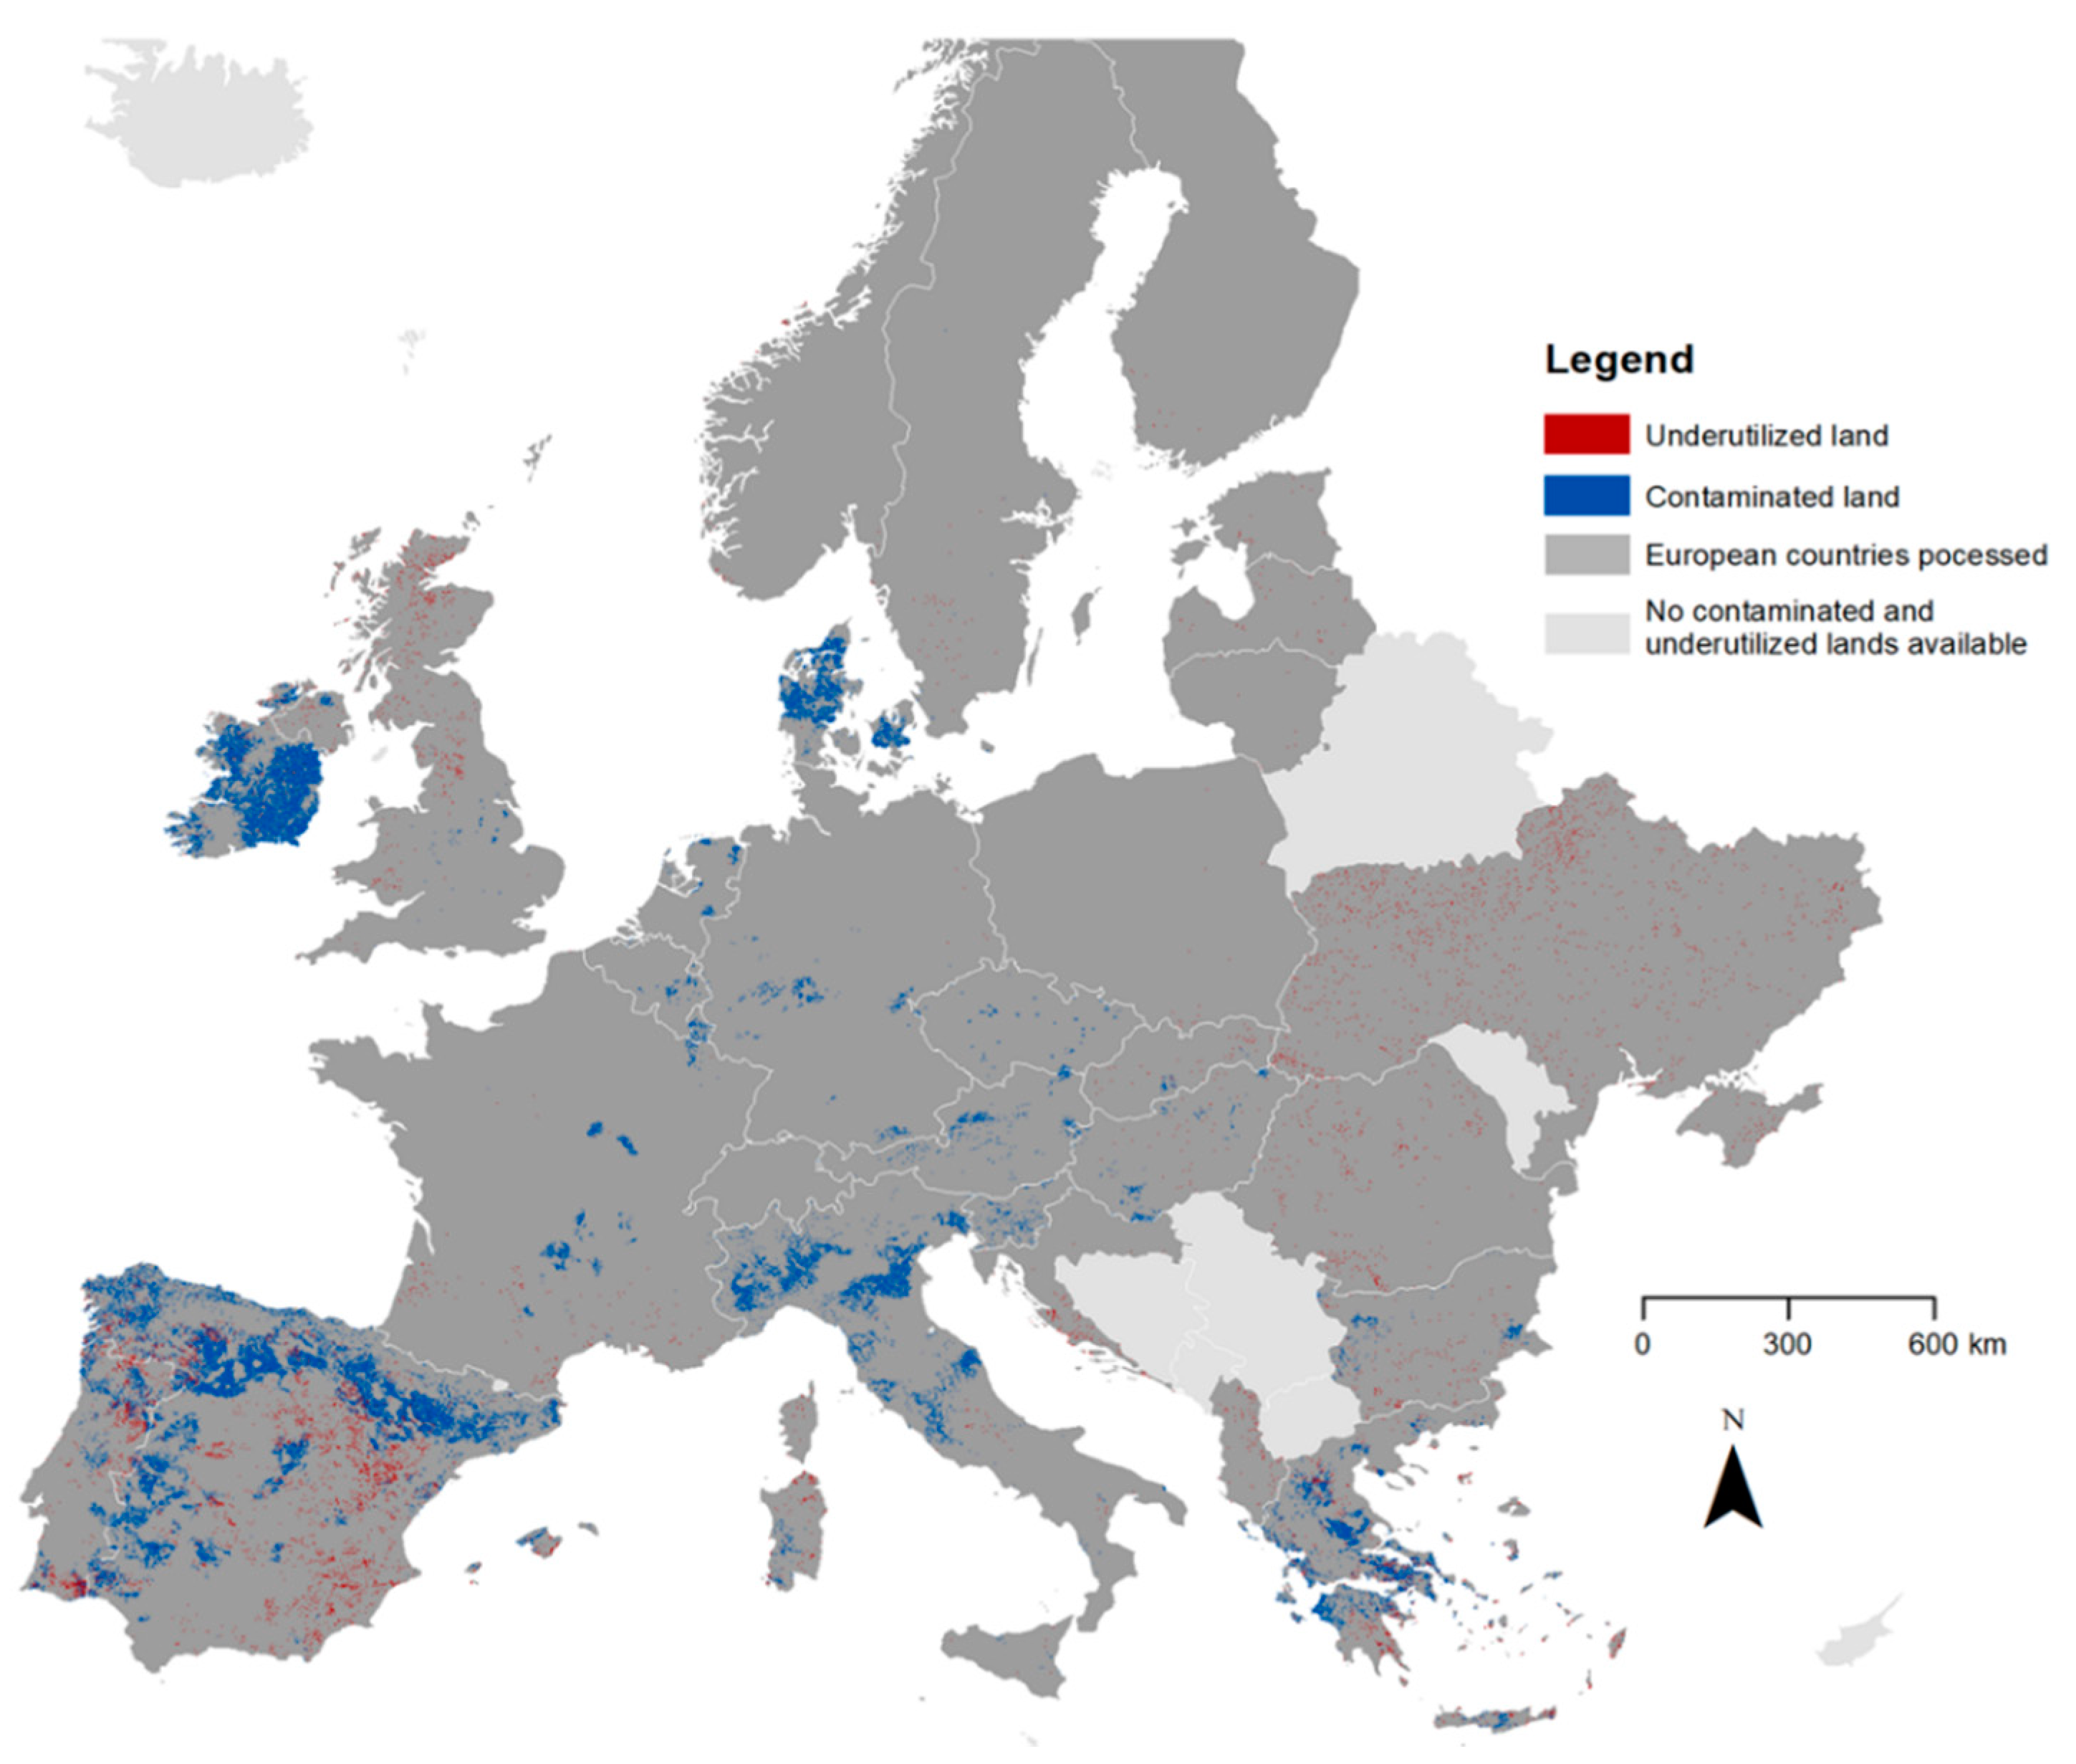
The overall mapping results for both underutilised and contaminated lands according to the methods explained above are shown in Figure 3. There are large areas of contaminated lands, specifically in Spain, Ireland, Denmark, Italy, and Greece. This results from the procedure mentioned in Section 2.3.1 in relation to the rough input data and varying national thresholds. Thus, these results should be treated with caution. However, this was the only feasible approach to integrate contaminated lands in a European-wide map because national maps are rare and/or often subject to confidentiality.
Overall, the classification resulted in a total amount of 5.3 Million ha of underutilised land. In contrast to the contaminated lands, the underutilised land map shows smaller areas. Still, significant shares were found in the Mediterranean countries (especially Spain, Croatia, and Greece), which is clearly attributable to water scarcity and thus supporting the reliability of the mapping results. In addition, larger areas are reported for Ukraine. According to the data of the ecological passports of the regions, there are more than 1 million ha of underutilised and degraded lands in Ukraine [51]. Central Europe shows small shares of underutilised lands. This may be in contrast to other findings [52,53], which included mountainous areas in the analysis, while in the BIOPLAT-EU project all steep slopes (>15°) as well as protected areas (Natura2000) and forests were excluded from the underutilised land map. More information on the accuracy of the underutilised mapping results can be found in Hirschmugl et al. [36].

3.3.2. BIOPLAT-EU webGIS Tool Functionalities

The designed BIOPLAT-EU webGIS tool can display and manage a set of basic spatial layers extending across the EU and Ukraine, and the associated tables needed for abstracting the variables required by the STEN system. This allows for the carrying out of suitability analysis on the complete issues involved in the entire bioenergy production process, on a local scale. The set of basic layers includes: (1) the Bioenergy Processing Plants (BPP), a set of points indicating location and bioenergy pathways of each facility; (2) the MUC areas, a set of polygons identifying the areas susceptible to simulate the viability of using for growing crops for bioenergy purposes; (3) the Target Area Base Layer, a set of polygons defining administrative limits; country, region, and municipality; the municipality layer incorporate those required socio-economic data about the target area to carry out simulations, and (4) the Crop Suitability layer, a set of hundreds of raster layers defining crop and yield suitability, according to the GAEZ model [54].
The system offers guidance to the potential user to interactively select the MUC land, or a part of the MUC, the BPP, and the bioenergy pathway, as well as the suitable crop. All these elements are linked to each other, so all combinations can be selected according to the user’s interest. Once the selection of MUC, BPP, and crop is made, the system defines the target area, which involves the municipalities that intersect with the selected MUC and BPP, and calculates the distance and travel time from the centre of the MUC to the BPP. All the data automatically extracted from the layer and tables populates the value chain data box table. An example about the target area is shown in Figure 4. The system is ready to run the STEN simulation, by using a complete set of indicators during a 20-year cycle to describe the evolution of a no-bioenergy scenario (baseline scenario) and the evolution of a bioenergy scenario (target scenario).
No restrictions are imposed on any user to reach this point, even for non-registered users. However, for editing and customising the values, the system requires registering as an “advanced user.” In this case, the advanced user has the capability to edit the input values to the value chain data box and run the simulation with these values.

4. Discussion

As it was mentioned in the introduction, the supply from energy crops would need to increase to comply with the 2010 National Renewable Energy Action Plans in Europe. One option would be by planting them on MUC lands since they do not induce competition with food/feed. In Italy, the production of 2G ethanol was mainly considered because there was an interest from the industry who already conducted some experiments on a range of energy crops to produce 2G ethanol [31]. Knowing that the feedstock cost is considered to be the main contributor to the total ethanol production cost [55], it was decided to explore 2G ethanol production in Ukraine where feedstock costs are lower.
In the Italian case study area, the results of the agronomic assessment showed that the most promising crop to be considered for 2G ethanol appeared to be giant reed. Although among the crops analysed, there were some crops showing higher yields, they were not selected due to insufficient supporting field data. This is not the case for giant reed where more reliable data is present. Other research seems to be consistent with these results [56,57,58]. Furthermore, lignocellulosic perennial crops are generally recognized for their environmental benefits such as carbon storage, soil erosion control, and suitable habitats for wildlife [59,60].
In the Ukrainian case study, willow was considered to be the most promising crop for 2G ethanol production due to experimental high yield production and suitable climatic conditions combined with the interest from the industry. These results seem to be consistent with the results from [61], who determined biomass production of different willow hybrids under low mineral fertilisation.
The production cost of 2G ethanol was estimated to be 936 EUR/t in the Italian case study, which is a reliable value according to E4TECH [62] that estimated the production costs of lignocellulosic ethanol in Europe to range between 940 and 1010 EUR per ton. In the Ukrainian case study, it was estimated to be 758 EUR/t. This cost is lower than the cost provided by E4TECH [62] and this is mainly due to the lower feedstock price. Both these values are higher than the EU market price value of ethanol, which was at the time of the study 534 EUR/t. This means that considering only the revenues from ethanol sales and without incentives for the production of 2G ethanol, this value chain cannot be considered competitive if the market price does not increase. However, upon calculating the profitability, the values in Italy were negative by 4,120,000 EUR/year but were positive by 9,457,152 EUR/year in Ukraine. This is mainly due to considering, in addition to the ethanol sales, the sales from heat and electricity from burning the remaining biomass after extraction of the 2G ethanol and to the policies put in place in the countries which are favourable in Ukraine and unfavourable in Italy. In fact, the price per unit of electricity generated from large scale biomass-fuelled power plants can be considered an important contributor in making the value chain profitable in Ukraine in addition to the availability of market for heat [44]. The electricity price was in this case a policy instrument that played a favourable role towards the profitability of 2G ethanol production, and this was not the case in Italy. Furthermore, in the area of Sulcis, due to both the climatic conditions (warm climate) and the scarcity of industrial sites which could use the steam, the production of heat was not considered for the analysis. Other policy related disadvantages in Italy are mentioned in [40].
In Germany, it should be taken into account that the land is hazardous and of limited production function. Therefore, a low-input demanding, and stress-tolerant feedstock was of high priority for the choice of the crop. Perennial miscanthus combines promising biomass production potential and low input requirements, especially the fast-growing, well regenerating, and relatively stress tolerant hybrid Miscanthus × giganteus [63]. As the MUC lands available are scattered and biomass yields would not be sufficient for a large-scale production of bioethanol, the 2G ethanol value chain was not considered to be plausible. Therefore, it was decided to look at other possible more decentralised pathways such as the traditional production of miscanthus chips for heat and power production considering two scenarios with and without investments in a new CHP plant. Both the scenarios were considered profitable but only as long as the price of miscanthus, which was around 80 EUR/t DM, does not fall below 50 EUR/t DM in scenario 1 (no investment). When comparing the two scenarios, Scenario 2 seems to have a much higher profitability of 92 million EUR over 20 years, but also all depends on the electricity and heat prices policies. This scenario would still be considered profitable if only electricity sales were considered. One should take into account that the calculations are based on available literature and specific indicators of the existing biomass power plants and certain operating assumptions. These findings are consistent with the findings of Panoutso et al. [64], who confirmed that the cultivation and supply of miscanthus on underutilised land for its use in small scale CHP can be financially profitable in Greece and Italy.
Other value chains were also considered, which do not involve growing any crops on the lands and instead make use of the grass growing naturally on them. Selling grass silage from sewage irrigation fields to existing biogas plants in the close neighbourhood (Scenario 3) could be most likely economically feasible if the price for delivery is 60 EUR/t DM. However, specific data on the considered biogas facilities is currently not available. Therefore, in this study biogas upgrading to biomethane was not considered. Nevertheless, it is technically feasible to upgrade biogas at nearly every production site, and biomethane production plants with capacities of 250 to 500 m3/h are economically attractive in Germany.
Looking into a more innovative approach, building a new integrated grass biorefinery (Scenario 4) is worth considering. This approach has an added value as it makes use of the biomass for chemicals production at first and then the use of by-products for bioenergy production. According to Mandl [50], economic feasibility is possible already at small-scale and local level. About 10,000 t DM/year feedstock can be processed into chemical products as well as the by-products electricity, heat, charcoal, and biofuels. Currently, green biorefineries are still in the experimental stage. The costs and revenues calculations are often rather general and profits from selling biochemicals may vary widely. For example, chemical sales prices may vary between 1000 EUR/t up to 30,000 EUR/t depending on input materials and extracted bio-based products as well as lactic acids, proteins, or fibres [65].
The results of the GHG performance for the 2G ethanol value chain showed a meaningful reduction when compared to petrol in Italy (64%) and Ukraine (57%). These results fall within the range of GHG savings calculated on various supply chains in [66,67]. However, the production of enzymes off-site is responsible for a considerable share of total emissions. A local production would surely contribute positively to further reduction in GHG.
In addition to GHG savings, other environmental benefits resulting from planting giant reed and willow were determined, such as improvement of soil quality aspects like erosion and soil organic carbon content. This has been also reported in other studies [68,69]. Biodiversity was positively affected, and this is in line with [70] who stated that biological characteristics and management of willow create a structurally diverse habitat for an array of species and protect soil and water resources. In a review on biodiversity impacts of bioenergy crop production, it was stated that 2G bioenergy crops have positive impacts on biodiversity in some cases [70].
Looking at social indicators, 2G ethanol could generate jobs and create positive changes in income with a considerable improvement of the nation’s access to modern and sustainable energy forms. This has been also reported in Kim et al. [71].
In Germany, the sustainability assessment was conducted only for Scenario 4. GHG emission results of biomethane showed a reduction of 84% but only if the methane leakages are not taken into consideration. However, it is important to note that biogas systems rarely have zero leakages. Biomethane plants of a comparable scale have at least 1.1% leakage [72]. Methane is a powerful GHG with a Global Warming Potential 25 times higher than carbon dioxide. When leaking, the total emission increase is factored in the analysis, making biomethane only 17% less carbon intense than natural gas. Concerning the soil quality, during the harvesting of grass for amino acids and bioenergy production, a considerably lower amount of residues will be left on the field, returning less organic matter to the soil. Consequently, a slight decrease of soil organic carbon content is likely to occur. However, due to the mechanised harvesting of the grass, the soil becomes more compact. As a result, water retention increases and loss of water from the root sphere decreases [44].
The process of agronomic, technoeconomic, and sustainability assessment in the case study areas needed a large amount of data, research, and information and was conducted on one value chain in each of the selected sites. Experts are also needed in the different fields and information exchange with stakeholders. This would also be the case for any assessment in any other location and for any other value chain. Looking at the complexity of this exercise and with the aim of removing these knowledge-based and technical barriers and solving the problem of finding the locations of MUC lands, the consequent step was to transform this exercise into an automated and easy to perform exercise that can be done by any stakeholder. The BIOPLAT-EU webGIS tool, which was developed to fulfil this aim, allows any stakeholder to search for MUC lands in Europe. It will give the user some specifications about these lands such as agronomic and climatic ones, and consequently what type of biomass would be suitable to be planted on these lands. The tool will then assess the environmental, social, and techno-economic sustainability aspects of the defined value chain when the user chooses or enters the required data. Such a tool does not yet exist and is considered a highly valuable and an important decision-making tool for stakeholders, which will help to stop or proceed in exploring a specific bioenergy value chain on a certain MUC land. This is believed to contribute enormously to enhancing the implementation of biomass production for bioenergy purposes.
However, an important aspect should be highlighted upon the use of the tool and more specifically upon looking for the locations of contaminated land. Mapping contaminated lands is both a difficult and sensitive issue. It is difficult due to the necessity for soil sampling and—on top of that—different legal situations in different countries and for different pollutants. In addition, it is a sensitive matter due to potential effects on land value or legal status of land use practices. These sensitivity issues may well be the reason for limited availability of national/high quality maps of contaminated lands. In the one example, where we could obtain national data, the comparison of EU-wide map with the Italian national map showed large differences. The EU-wide map tends to overestimate contaminated areas due to the coarse input data layer. On the other hand, small patches of contamination are not covered. In addition, the national map contains other pollutants than available in the EU-wide map, which makes a real comparison effectively impossible. Therefore, we want to point out that the map of contaminated lands is a first approximation to showcase the use of the webGIS tool rather than a high-accurate base layer. In any local assessments, the area has to be re-evaluated with legally binding and nationally accepted data.
Furthermore, in the webGIS tool, i.e., the STEN tool, not all the indicators which were assessed in the first phase (FORBIO) were able to be automated. For instance, the assessment of effect of bioenergy value chains on biodiversity could not be included as it appeared from the experience in FORBIO that it requires a more detailed and structured analysis, and efforts beyond the BIOPLAT-EU resources. This could be researched in a follow-up project.
In order to investigate the applicability of the webGIS tool and its accuracy, further work is envisaged. The tool will be tested on 12 specific case study areas and on various bioenergy value chains in 6 countries (Italy, Germany, Ukraine, Romania, Hungary, and Spain). Furthermore, in an attempt to remove barriers related to financing, detailed feasibility studies, business models, and financial structuring support up to the bankability of projects will be conducted and the know-how will be shared with stakeholders. NESTE, the industrial partner, will use the webGIS tool to assess the potential MUC lands where oil-based bioenergy value chains could be established sustainably at a Pan-European level. This exercise will showcase the convenience and practicality of the tool.
As a conclusion, this paper shows that there are indeed opportunities to use MUC lands to increase bioenergy production in a sustainable way in Europe and contribute towards reaching the European climate targets and SDG goals. The BIOPLAT-EU webGIS tool can play an important role in enhancing these opportunities by allowing the performance of an economic feasibility and sustainability assessment of the most common bioenergy value chains in an easy way giving the stakeholder quick and reliable first results and helping in the decision-making.
Nevertheless, it is very important to highlight that even when all technical and market uptake barriers are removed, policies can still be a hindering element to the profitability of certain bioenergy value chains. This was the case of the 2G ethanol in Italy, especially when compared with the one in Ukraine, where the price of generated electricity that can be sold to the grid played a very favourable role. In general, appropriate long-term stable policy measures need to be put in place in EU Member States to support bioenergy value chain development.

Author Contributions

C.K.: conceptualization, methodology, design, and structuring of the paper, original draft preparation. R.J., D.R.: FORBIO and BIOPLAT-EU project administration, funding acquisition. P.G.: FORBIO: project administration, funding acquisition. S.F., G.P., T.P., G.B., O.T., O.H., R.S., R.K., D.K., R.M.: investigation and implementation of the agronomic and techno-economic studies in the case study regions within FORBIO. A.C. and D.C.: conceptualization and software development of the webGIS tool in the BIOPLAT-EU project. M.H. and C.S.: investigation, data collection, and MUC lands mapping within BIOPLAT-EU. M.C., L.T., and M.M.M.: methodology for the sustainability assessment in FORBIO and BIOPLAT-EU. All authors provided their respective input and contributed to writing the manuscript. All authors have read and agreed to the published version of the manuscript.

Funding

The FORBIO and BIOPLAT-EU projects has received funding from the European Union’s Horizon 2020 research and innovation programme under grant agreement No. 691846 and No. 818083 respectively.

Acknowledgments

The authors would like to thank the consortium partners of both the FORBIO (www.forbio-project.eu, last accessed on 11 March 2021) and BIOPLAT-EU (www.bioplat.eu, last accessed on 11 March 2021) projects who implemented the tasks and contributed directly or indirectly to the completion of this paper.

Conflicts of Interest

The authors declare no conflict of interest.

References

  1. EC. The Renewable Energies Directive. Available online: https://ec.europa.eu/energy/topics/renewable-energy/renewable-energy-directive/overview_en (accessed on 2 February 2021).
  2. EC. Brief on Biomass for Energy in the European Union. Available online: https://publications.jrc.ec.europa.eu/repository/bitstream/JRC109354/biomass_4_energy_brief_online_1.pdf (accessed on 2 February 2021).
  3. EC. National Renewable Energy Action Plans 2020. Available online: https://ec.europa.eu/energy/topics/renewable-energy/national-renewable-energy-action-plans-2020_en?redir=1 (accessed on 2 February 2021).
  4. IRENA; IEA; FAO. Bioenergy for Sustainable Development. Available online: https://www.ieabioenergy.com/wp-content/uploads/2017/01/BIOENERGY-AND-SUSTAINABLE-DEVELOPMENT-final-20170215.pdf (accessed on 2 February 2021).
  5. IPCC. Global Warming of 1.5 °C. Available online: https://www.ipcc.ch/site/assets/uploads/sites/2/2019/06/SR15_Full_Report_High_Res.pdf (accessed on 2 February 2021).
  6. EC. The Revised Renewable Energy Directive. Available online: https://ec.europa.eu/energy/sites/ener/files/documents/technical_memo_renewables.pdf (accessed on 2 February 2021).
  7. Pour, N.; Webley, P.A.; Cook, P.J. A Sustainability Framework for Bioenergy with Carbon Capture and Storage (BECCS) Technologies. Energy Procedia 2017, 114, 6044–6056. [Google Scholar] [CrossRef]
  8. Jin, E.; Sutherland, J.W. A Proposed Integrated Sustainability Model for a Bioenergy System. Procedia CIRP 2016, 48, 358–363. [Google Scholar] [CrossRef] [Green Version]
  9. Buchholz, T.S.; Volk, T.A.; Luzadis, V.A. A participatory system approach to modelling social, economic and ecological components of bioenergy. Energy Policy 2007, 35, 6084–6094. [Google Scholar] [CrossRef]
  10. Wang, J.; Yang, Y.; Bentley, Y.; Geng, X.; Liu, X. Sustainability Assessment of Bioenergy from a Global Perspective: A Review. Sustainability 2018, 10, 2739. [Google Scholar] [CrossRef] [Green Version]
  11. GBEP. The Global Bioenergy Partnership Sustainability Indicators for Bioenergy. Available online: http://www.globalbioenergy.org/fileadmin/user_upload/gbep/docs/Indicators/The_GBEP_Sustainability_Indicators_for_Bioenergy_FINAL.pdf (accessed on 2 February 2021).
  12. Scott, A.; Page-Dumroese, D. Wood Bioenergy and Soil Productivity Research. BioEnergy Res. 2016, 9, 507–517. [Google Scholar] [CrossRef]
  13. Pedroli, B.; Elbersen, B.; Frederiksen, P.; Grandin, U.; Heikkilä, R.; Krogh, P.H.; Izakovičová, Z.; Johansen, A.; Meiresonne, L.; Spijker, J. Is energy cropping in Europe compatible with biodiversity?—Opportunities and threats to biodiversity from land-based production of biomass for bioenergy purposes. Biomass Bioenergy 2013, 55, 73–86. [Google Scholar] [CrossRef]
  14. GNESD. Bioenergy—The Potential for Rural Development and Poverty Alleviation. Available online: https://www.researchgate.net/publication/264232675_Bioenergy_The_potential_for_rural_development_and_poverty_alleviation/link/53d2bfed0cf228d363e955d0/download (accessed on 2 February 2021). [CrossRef]
  15. Zolin, M. Diversification of Household Income in Rural Areas: Opportunities and Risks of Biomass Energy. Open Geogr. J. 2011, 4, 16–28. [Google Scholar] [CrossRef] [Green Version]
  16. The FORBIO Project: Fostering Sustainable Feedstock Production for Advanced Biofuels on Underutilised Land in Europe. Available online: https://forbio-project.eu/ (accessed on 14 December 2020).
  17. The BIOPLAT-EU Project: Promoting Sustainable Use of Underutilised Lands for Bioenergy Production through a Web-Based Platform for Europe. Available online: https://bioplat.eu/ (accessed on 14 December 2020).
  18. FORBIO: D3.2—Report on the Design of the Sustainability Indicator Set. Available online: https://forbio-project.eu/assets/content/publication/D3.2_Inventory_of_sustainability_indicators.pdf (accessed on 14 December 2020).
  19. Aru, A.; Baladaccini, P.; Delogu, G.; Dessena, M.A.; Madrau, S.; Melis, R.T.; Vacca, A. Nota Illustrativa Alla Carta Dei Suoli Della Sardegna, Scala 1:250.000; Dipartimento di Scienze della Terra Università di Cagliari: Cagliari, Italy, 1991. (In Italian) [Google Scholar]
  20. ARPA SARDEGNA—Piano di Disinquinamento per il Risanamento del Territorio del Sulcis Iglesiente. Available online: http://www.sardegnaambiente.it/index.php?xsl=612&s=149955&v=2&c=4586&idsito=21 (accessed on 14 December 2020). (In Italian).
  21. Comune di Portoscuso Ordinanza N.9 del 6 marzo 2014—Divieto di commercializzazione o distribuzione a qualunque titolo di alimenti derivanti dalle produzioni nel Comune di Portoscuso. Available online: https://gruppodinterventogiuridicoweb.files.wordpress.com/2014/03/ordinanza-n-9-del-6-marzo-2014-divieto-di-commercializzazione-di-alimenti.pdf (accessed on 14 December 2020). (In Italian).
  22. Pulighe, G.; Bonati, G.; Fabiani, S.; Barsali, T.; Lupia, F.; Vanino, S.; Nino, P.; Arca, P.; Roggero, P.P. Assessment of the Agronomic Feasibility of Bioenergy Crop Cultivation on Marginal and Polluted Land: A GIS-Based Suitability Study from the Sulcis Area, Italy. Energies 2016, 9, 895. [Google Scholar] [CrossRef]
  23. Zubets, M.V. Scientific bases of agricultural production in the area of Polissia and Western Ukraine. Acad. Agrar. Sci. 2010, 944. Available online: http://ir.znau.edu.ua/bitstream/123456789/8317/11/nauk_osnovi_agro_vir_v_zoni_polissya_2010_944.pdf (accessed on 2 February 2021).
  24. Raychuk, L.A. Some aspects of Agricultural Manufacturing at the radioactively contaminated land of Kiev Polissia. Scientific Bulletin of National Forestry University of Ukraine. Ecol. Environ. 2015, 25, 161–166. [Google Scholar]
  25. Statistical Yearbook of Kyiv Oblast in 2015; Department of Statistics in Kiev Region: Kyiv, Ukraine, 2016.
  26. FORBIO: D2.5—Agronomic feasibility study in Ukraine. Available online: https://forbio-project.eu/assets/content/publication/20161212-FORBIO_agronomic%20feasibility%20Ukraine_CTXI_disclaimer.pdf (accessed on 2 February 2021).
  27. Kopp, D.; Schwanecke, W. Standörtlich-Naturräumliche Grundlagen Ökologiegerechter Forstwirtschaft; Deutscher Landwirtschaftsverlag: Berlin, Germany, 1994. [Google Scholar]
  28. Studie zUr klimatischen Entwicklung Im Land Brandenburg Bis 2055 und Deren Auswirkungen Auf Den Wasserhaushalt, Die Forst- und Landwirtschaft Sowie Die Ableitung Erster Perspektiven. Available online: https://www.pik-potsdam.de/en/output/publications/pikreports/.files/pr83.pdf (accessed on 11 March 2021).
  29. Bundesministerium für Justiz und Verbraucherschutz: Bundes-Bodenschutzgesetz Vom 17. März 1998 (BGBl. I S. 502), das Zuletzt Durch Artikel 101 der Verordnung vom 31. August 2015 (BGBl. I S. 1474) Geändert Worden Ist. Available online: http://www.gesetze-im-internet.de/bbodschg/index.html (accessed on 2 February 2021).
  30. Schmidt, M. Planungsrelevante Aspekte einer Rieselfeldnachnutzung im Verflechtungsraum Brandenburg—Berlin. In Rieselfelder Brandenburg-Berlin, Studien- und Tagungsberichte des Landesumweltamtes; Band 9; Landesumweltamt Brandenburg: Brandenburg, Germany, 1995; pp. 4–10. [Google Scholar]
  31. FORBIO: D2.1—Agronomic Feasibility Study in Italy. Available online: https://forbio-project.eu/assets/content/publication/FORBIO_D21_approved.pdf (accessed on 2 February 2021).
  32. FORBIO: D2.3—Agronomic Feasibility Study in Germany. Available online: https://forbio-project.eu/assets/content/publication/FORBIO_D2.3_07.12.2016_disclaimer.pdf (accessed on 2 February 2021).
  33. FORBIO: D4.3—Production of a Roadmap for the Removal of the Main Economic and Non-Economic Barriers to the Market Uptake of Advanced Bioenergy in the Case Study Sites Including Roles and Responsibilities of each Relevant Stakeholder Group in their Implementation. Available online: https://forbio-project.eu/assets/content/publication/D4.3_FAO_final_12_12_2018.pdf (accessed on 2 February 2021).
  34. Food and Agricultural Organisation (FAO); Consultative Group on International Agricultural Research (CGIAR). Research Priorities for Marginal Lands, the Framework for Prioritizing Land Types in Agricultural Research, the Rural Poverty and Land Degradation: A Reality Check for the CGIAR. 1999. Available online: https://core.ac.uk/download/pdf/132695116.pdf (accessed on 10 March 2021).
  35. FAO. Statistics Division, Land Use and Irrigation—Codes and Definitions. 2014. Available online: www.fao.org/fileadmin/templates/ess/ess_test_folder/Definitions/LandUse_list.xls (accessed on 2 February 2021).
  36. Hirschmugl, M.; Sobe, C.; Khawaja, C.; Janssen, R.; Traverso, L. Pan-European Mapping of Underutilised Land for Bioenergy Production. Land 2021, 10, 102. [Google Scholar] [CrossRef]
  37. JRC. Maps of Heavy Metals in the Soils of the EU, based on LUCAS 2009 HM Data. Available online: https://esdac.jrc.ec.europa.eu/content/maps-heavy-metals-soils-eu-based-lucas-2009-hm-data-0#tabs-0-description=1 (accessed on 2 February 2021).
  38. Council of the European Union. Directive 2002/32/EC of the European Parliament and of the Council of 7 May 2002 on undesirable substances in animal feed—Council statement. Official Journal L 140, 30/05/2002 P. 0010–0022. Available online: https://eur-lex.europa.eu/legal-content/EN/TXT/?qid=1591166382702&uri=CELEX%3A32002L0032 (accessed on 2 February 2021).
  39. Toth, G.; Hermann, T.; Da Silva, M.R.; Montanarella, L. Heavy metals in agricultural soils of the European Union with implications for food safety. Environ. Int. 2016, 88, 299–309. [Google Scholar] [CrossRef] [PubMed]
  40. Traverso, L.; Colangeli, M.; Morese, M.; Pulighe, G.; Branca, G. Opportunities and constraints for implementation of cellulosic ethanol value chains in Europe. Biomass Bioenergy 2020, 141, 105692. [Google Scholar] [CrossRef]
  41. Knoche, D.; Mergner, R.; Köhler, R.; Rutz, D.; Janssen, R. Mobilization of disused sewage irrigation fields for sustainable green biomass utilization—An applied feasibility study in the metropolis region Berlin & Brandenburg, Germany. In Proceedings of the 27th European Biomass Conference and Exhibition, Lisbon, Portugal, 27 May–30 May 2019; pp. 377–386. [Google Scholar] [CrossRef]
  42. Arca, P. Cropping Systems for Biomass Production under Mediterranean Conditions: Implantation Techniques and Soil Carbon Balance. Ph.D. Thesis, University of Sassari, Sassari, Italy, 2016. [Google Scholar]
  43. FORBIO: D2.2—Techno-Economic Feasibility Study in Italy. Available online: https://forbio-project.eu/assets/content/publication/20161216_FORBIO_D2.2_disclaimer.pdf (accessed on 2 February 2021).
  44. FORBIO: D3.3—Final Report on the Sustainability Assessment of the Selected Advanced Bioenergy Value Chains in all the Case Study Sites. Available online: https://forbio-project.eu/assets/content/publication/D3.3_FINAL_02.07.2018.pdf (accessed on 2 February 2021).
  45. FORBIO: D2.6—Techno-Economic Feasibility Study in Ukraine. Available online: https://forbio-project.eu/assets/content/publication/20180206_FORBIO_D2.6_Techno_economic_feasibility.pdf (accessed on 2 February 2021).
  46. Jäkel, K.; Glauert, T.; Rieckmann, C.; Hartmann, A.; Fritz, M.; Märtin, M.; Barthelmes, G.; Theiß, M.; Pötzschke, K.; Scharff, A. Pflanzenbauliche, Ökonomische und Ökologische Bewertung Von Sorghumarten und -Hybriden Als Energiepflanzen; Heft 15; Schriftenreihe des Landesamtes für Umwelt, Landwirtschaft und Geologie Sachsen (Hrsg.): Dresden, Germany, 2015; p. 338. (In German) [Google Scholar]
  47. TFZ. Bioenergie-Dauerkulturen Auswahl Ökologischer Alternativen. Available online: https://www.tfz.bayern.de/mam/cms08/rohstoffpflanzen/dateien/tfz_wissen_p_dauerkulturen_web_s.pdf (accessed on 2 February 2021).
  48. Gansberger, M.; Montgomery, L.F.R.; Liebhard, P. Botanical characteristics, crop management and potential of Silphium perfoliatum L. as a renewable resource for biogas production: A review. Ind. Crops Prod. 2015, 63, 362–372. [Google Scholar] [CrossRef]
  49. FORBIO: D2.4—Techno-Economic Feasibility Study in Germany. Available online: https://forbio-project.eu/assets/content/publication/Technoeconomic_feasibility_FORBIO_Germany_12.04.2018.pdf (accessed on 2 February 2021).
  50. Mandl, M.; Graf, N.; Thaller, A.; Böchzelt, H.; Schnitzer, H.; Steinwender, M.; Wachlhofer, R.; Fink, R.; Kromus, S.; Ringhofer, J. Grüne Bioraffinerie—Aufbereitung und Verwertung der Gras-Fraktion; Berichte aus Energie- und Umweltforschung; Bundesministerium für Verkehr, Innovation und Technologie, Bmvit: Vienna, Austria, 2006; p. 67. (In German)
  51. Ministry of Ecology and Natural Resources of Ukraine. Available online: https://mepr.gov.ua/news/35913.html (accessed on 2 February 2021).
  52. SeemLa Project: Sustainable Exploitation of Biomass for Bioenergy from Marginal Lands. Available online: https://www.seemla.eu/home/ (accessed on 2 February 2021).
  53. MAGIC Project: Marginal Lands for Growing Industrial Crops: Turning a Burden into an Opportunity. Available online: http://magic-h2020.eu (accessed on 2 February 2021).
  54. GAEZ: Global Agro-Ecological Zones—Model Documentation. Available online: http://www.fao.org/fileadmin/user_upload/gaez/docs/GAEZ_Model_Documentation.pdf (accessed on 2 February 2021).
  55. Padella, M.; O’Connell, A.; Prussi, M. What is still Limiting the Deployment of Cellulosic Ethanol? Analysis of the Current Status of the Sector. Appl. Sci. 2019, 9, 4523. [Google Scholar] [CrossRef] [Green Version]
  56. Angelini, L.G.; Ceccarini, L.; Nassi o Di Nasso, N.; Bonari, E. Comparison of Arundo donax L. and Miscanthus x giganteus in a long-term field experiment in Central Italy: Analysis of productive characteristics and energy balance. Biomass Bioenergy 2009, 33, 635–643. [Google Scholar] [CrossRef]
  57. Fernando, A.L.; Boléo, S.; Barbosa, B.; Costa, J.; Duarte, M.P.; Monti, A. Perennial Grass Production opportunities on Marginal Mediterranean Land. Bioenergy Res. 2015, 8, 1523–1537. [Google Scholar] [CrossRef]
  58. Mantineo, M.; D’Agosta, G.M.; Copani, V.; Patanè, C.; Cosentino, S.L. Biomass yield and energy balance of three perennial crops for energy use in the semi-arid Mediterranean environment. Field Crop. Res. 2009, 114, 204–213. [Google Scholar] [CrossRef]
  59. Immerzeel, D.J.; Verweij, P.A.; van der Hilst, F.; Faaij, A.P.C. Biodiversity impacts of bioenergy crop production: A state-of-the-art review. GCB Bioenergy 2014, 6, 183–209. [Google Scholar] [CrossRef] [Green Version]
  60. Chimento, C.; Almagro, M.; Amaducci, S. Carbon sequestration potential in perennial bioenergy crops: The importance of organic matter inputs and its physical protection. GCB Bioenergy 2014, 8, 111–121. [Google Scholar] [CrossRef]
  61. Weih, M.; Nordh, N.E. Determinants of biomass production in hybrid willows and the prediction of field performance from pot studies. Tree Physiol. 2005, 25, 1197–1206. [Google Scholar] [CrossRef] [Green Version]
  62. E4TECH: Ramp up of Lignocellulosic Ethanol in Europe to 2030 Final Report. 2017. Available online: http://www.e4tech.com/wp-content/uploads/2017/10/E4tech_ICLE_Final_Report_Dec17.pdf (accessed on 2 February 2021).
  63. De Vries, S.C.; van de Ven, G.W.J.; van Ittersum, M.K. First or second generation biofuel crops in Brandenburg, Germany? A model-based comparison of their production-ecological sustainability. Eur. J. Agron. 2014, 52, 166–179. [Google Scholar] [CrossRef]
  64. Panoutsou, C.; Chiaramonti, D. Socio-Economic Opportunities from Miscanthus Cultivation in Marginal Land for Bioenergy. Energies 2020, 13, 2741. [Google Scholar] [CrossRef]
  65. Novalin, S.; Zweckmeier, T. Renewable resources—Green biorefinery: Separation of valuable substances from fluid fractions by means of membrane technology. Biofuel Bioprod. Biorefining 2009, 3, 20–27. [Google Scholar] [CrossRef]
  66. Slade, R.; Bauen, A.; Shah, N. The greenhouse gas emissions performance of cellulosic ethanol supply chains in Europe. Biotechnol. Biofuels 2009, 2, 15. [Google Scholar] [CrossRef] [Green Version]
  67. Morales, M.; Quintero, J.; Conejeros, R.; Aroca, G. Life cycle assessment of lignocellulosic bioethanol: Environmental impacts and energy balance. Renew. Sustain. Energy Rev. 2015, 42, 1349–1361. [Google Scholar] [CrossRef]
  68. Gioacchini, P.; Cattaneo, F.; Barbanti, L.; Montecchio, D.; Ciavatta, C.; Marzadori, C. Carbon sequestration and distribution in soil aggregate fractions under Miscanthus and giant reed in the Mediterranean area. Soil Tillage Res. 2016, 163, 235–242. [Google Scholar] [CrossRef]
  69. Stauffer, M. Changes in soil quality over time in a very short rotation willow coppice as compared with the neighbouring soils of an alluvial forest, grassy strip and annual crop. Rev. For. Française 2015, 66. [Google Scholar] [CrossRef] [Green Version]
  70. Volk, T.A.; Verwijst, T.; Tharakan, P.J.; Abrahamson, L.P.; White, E.H. Growing fuel: A sustainability assessment of willow biomass crops. Front. Ecol. Environ. 2004, 2, 411–418. [Google Scholar] [CrossRef]
  71. Kim, S.; Dale, B.E. Potential job creation in the cellulosic biofuel industry: The effect of feedstock price. Biofuel Bioprod. Biorefining 2015, 9, 639–647. [Google Scholar] [CrossRef]
  72. IEA. Methane Emissions from Biogas Plants. 2017. Available online: https://www.ieabioenergy.com/wp-content/uploads/2018/01/Methane-Emission_web_end_small.pdf (accessed on 2 February 2021).
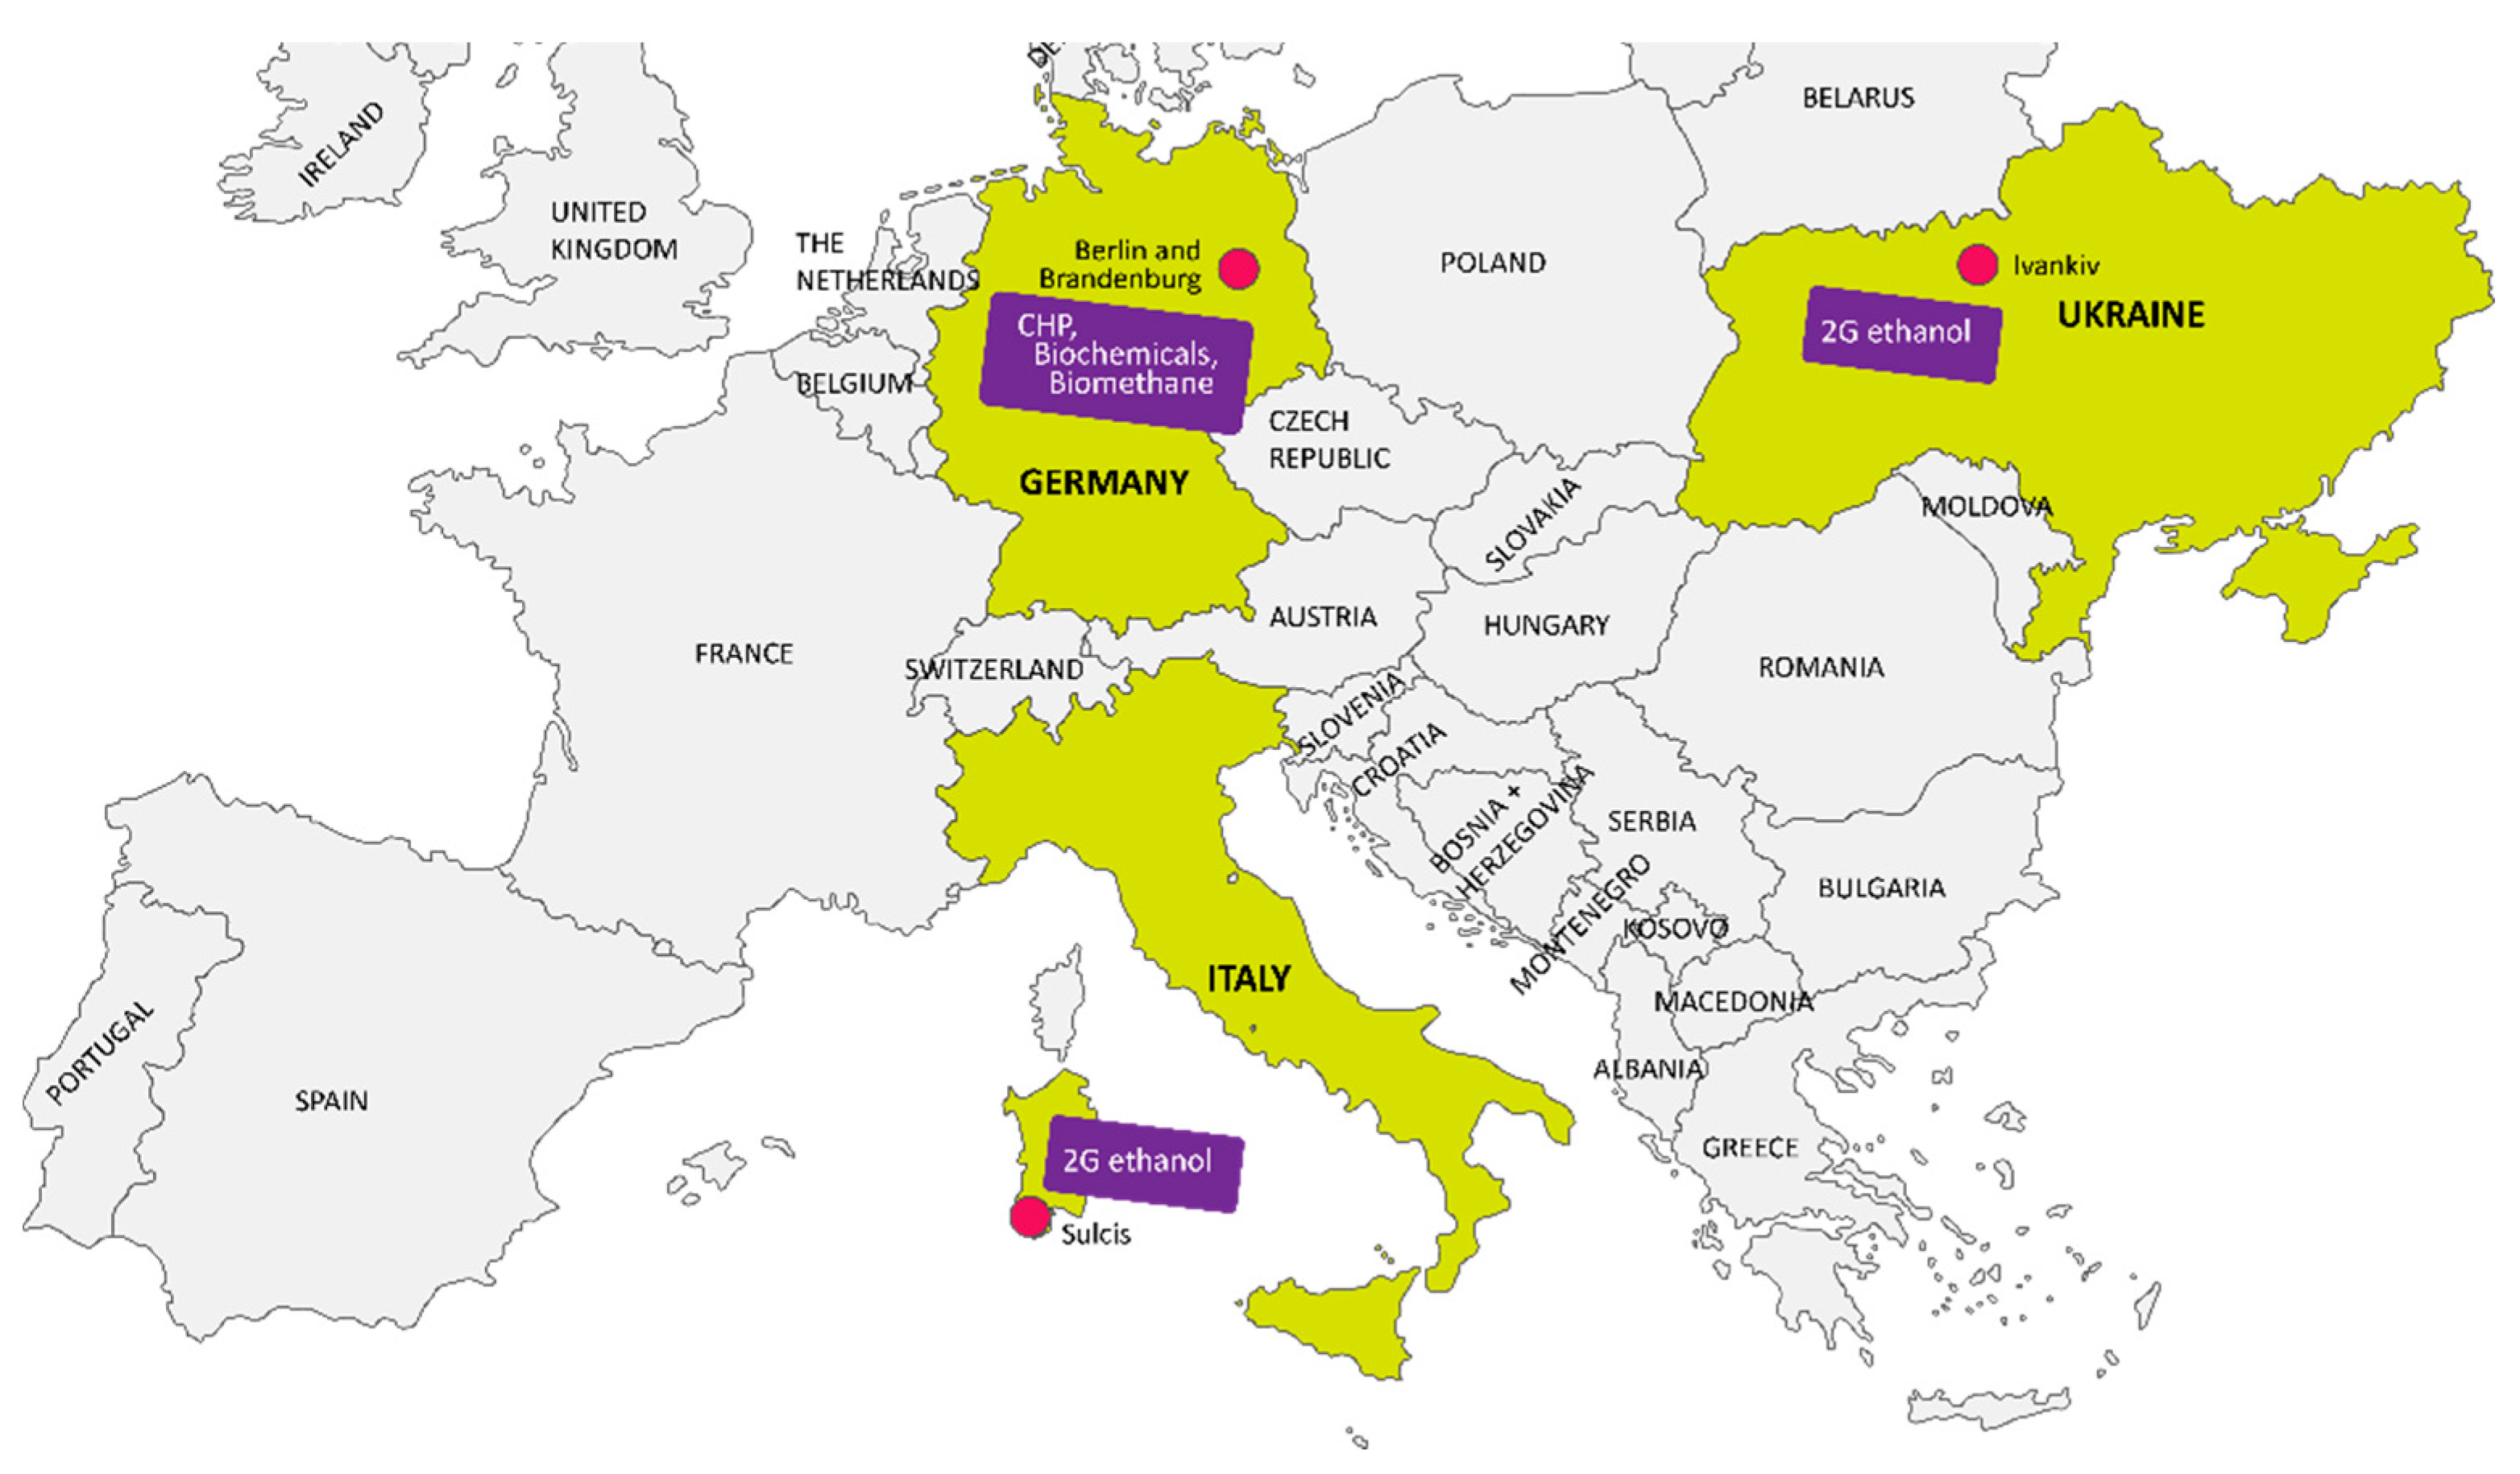
Figure 1. Location of the case study sites.
Energies 14 01566 g001
Figure 2. WebGIS tool prototype architecture based on client-server.
Energies 14 01566 g002
Figure 3. Mapping results for Europe and Ukraine covering underutilised and contaminated lands.
Energies 14 01566 g003
Figure 4. Value chain data box for a target area.
Energies 14 01566 g004
Table 1. Thresholds for heavy metal concentrations in soils.
Heavy MetalEU-Directive ThresholdsFinnish Thresholds
Arsenic (As)n/a5
Cadmium (Cd)1–31
Chromium (Cr)n/a100
Copper (Cu)50–140100
Mercury (Hg)1–1.50.5
Nickel (Ni)30–7550
Lead (Pb)50–30060
Zinc (Zn)150–300200
Cobalt (Co)n/a20
Manganese (Mn)n/an/a
Antimony (Sb)n/a2
Vanadium (V)n/a100
Molybdenum (Mo)n/an/a
Table 2. Sustainability Tool for Europe and Neighbouring countries (STEN) sustainability indicators.
Standard IndicatorsAdvanced Indicators
EnvironmentalAir Emission
Water Use
Land Use Change
SocialJobs in Bioenergy sector
EconomicNet Energy BalanceIncome
Gross Value AddedLand Tenure
InfrastructureEnergy Access
Capacity for the use of bioenergy
Table 3. Costs and revenues of Scenario 1 and Scenario 2.
Scenario 1Scenario 2
Costs (Million EUR/20 years)13.1–16.740
Revenues (Million EUR/20 years)26.4132
Net Benefit (Million EUR/20 years)9.7–13.392
Net annual benefit (EUR/year)485,000–665,0006.6 Million
Table 4. Costs and revenues of Scenario 3 and Scenario 4.
Scenario 3Scenario 4
Costs (Million EUR/20 years)1.74
Revenues (Million EUR/20 years)4.17.1–10
Net Benefit (Million EUR/20 years)2.43.1–6
Net annual benefit (EUR/year)120,000155,000 to 300,000
Publisher’s Note: MDPI stays neutral with regard to jurisdictional claims in published maps and institutional affiliations.