1. Introduction
Buildings represent about 40% of the total energy demand in the European Union (EU) [
1]. Energy efficiency is the aim of one of the 20-20-20 Europe 2020 targets; therefore, a broad area of research has been devoted to energy efficiency in buildings.
Energy consumption in buildings is influenced by six factors [
2]: (1) climate, (2) envelope characteristics, (3) building-service and energy-system characteristics, (4) building operation and maintenance, (5) occupant activities and behavior, and (6) indoor environmental quality provided.
While climate is a factor that cannot be acted upon, several building envelope technologies can be adopted to improve a building’s energy efficiency in the phase of construction or renovation of a building: air sealing, building insulation, windows, and roofs [
3]. Factors (1) and (2) lie outside the scope of the FEEdBACk (Fostering Energy Efficiency and BehAvioral Change through ICT) project, which addresses the remaining ones. The factor building-service and energy-system characteristics has evolved due to advances in ICT; emerging concepts such as grid-responsive buildings play significant roles in stabilizing power grids for the future [
4]. In FEEdBACk, tools deemed necessary in providing these services were developed, such as decision support tools for facility management and optimization tools for the use of controllable loads, which also serve the purpose of factor (4), building operation and maintenance. Motivating energy-efficient behaviors (factor (5)) and maintaining comfort levels (factor (6)) while monitoring both are also at the core of this project.
The main motivation behind this work is, therefore, to bridge two fields of knowledge that have been traditionally separate: social sciences and engineering. Most of the advanced engineering algorithms presented herein have been proposed elsewhere in the literature and have been proven to work in several contexts. However, the innovation of this project and contribution for the state-of-the-art does not lie in these algorithms individually, but rather their integration and application together with social sciences techniques to tackle a well-known problem that has a huge impact in global warming—the inefficient use of energy.
Several issues influence user behaviors, such as daily routines, economic factors, and ethics. Studies that were conducted to better understand consumer decision-making, and its behaviors [
5,
6] demonstrate that users might change their behaviors if they perceive the real impact of their actions.
A recent systematic literature review conducted by Paone and Bacher [
7] on the impact of building-occupant behaviors regarding energy efficiency and on its influencing methods identified three major stratagies to promote behavioral change: eco-feedback, social interaction, and gamification [
8,
9]. Although there is no standard definition for gamification, ultimately, various authors converge to define gamification as the use of game elements in non-game contexts to improve user experience and user engagement [
10]. Regarding energy applications, major gamification techniques use game elements and mechanics to engage and motivate building occupants to adopt energy-efficient behaviors. Therefore, gamification becomes a central piece of the FEEdBACk project.
Besides FEEdBACk, a number of recent projects have aimed to increase energy efficiency through behavioral change using ICT solutions. Among these projects, the eTEACHER project (
http://www.eteacher-project.eu/, accessed on 15 February 2021) also focused on the end-user, used gamification techniques and sensors, and provided tailored advice to building users. However, with regard to engineering, no advanced algorithms such as the ones proposed in FEEdBACk were envisioned (e.g., none of their algorithms use forecasting techniques). Another noteworthy project is inBETWEEN (
https://cordis.europa.eu/project/id/768776 accessed on 15 February 2021), which also lacks the advanced algorithms proposed in FEEdBACk and has inferior use of sensors. Finally, in the UtilitEE project (
https://www.utilitee.eu/ accessed on 15 February 2021), the building automation component dominates the project, but neither gamification nor algorithms using forecasting techniques were integrated. The remainder of this paper is as follows: in
Section 2, the objectives, concepts, and methodology of FEEdBACk are provided; in
Section 3 the data management and monitoring of energy and comfort are addressed; in
Section 4, the segmentation of building user profiles are detailed; in
Section 5, the gamification platform is presented; in
Section 6, new ICT and data analysis applications developed in FEEdBACk are detailed; and in
Section 7, conclusions are drawn and directions for future work are proposed.
2. FEEdBACk Project
FEEdBACk stands for Fostering Energy Efficiency and BehAvioral Change through ICT. The project was funded by the European Commission under Call “H2020-EE-2016-2017”. In this section, an overview of the project objectives, methodology, and demonstration is presented.
The consortium is composed of 8 partners based in 7 different countries—Portugal, the Netherlands, Switzerland, Spain, the United Kingdom, Denmark, and Germany. In
Appendix A a description of the involved partners is presented.
2.1. FEEdBACk Objectives
The core objective of FEEdBACk is to promote, stimulate, and deliver energy efficiency through behavioral change. To encourage more efficient energy utilization and more responsible consumer behavior, a gamification platform was developed to motivate behavioral change by fostering awareness and consumer engagement through a pervasive application that analyzes context, sends personalized messages, and manages gamified peer competition and feedback.
The specific objectives are as follows:
exploit innovative and user-friendly ICT solutions to promote users’ and interested stakeholders’ engagement and to foster energy efficiency;
explore intelligent control and automation to optimize the utilization of controllable resources;
include insights from social and behavioral sciences to maximize permanent behavioral change;
maintain/improve comfort levels and indoor air quality;
make energy-usage data accessible to users and to designated third parties;
set up demonstrators with different characteristics, and quantify impacts using rigorous baselines; and
investigate the potential for replication to other boundary conditions
2.2. Concept and Methodology
The FEEdBACk project envisages the development of innovative applications to encourage users of buildings to comprehend and then adopt more energy-efficient behaviors and to aid building managers in maximizing energy savings, not only fostering users’ behavioral change but also using automation to optimize energy consumption, generation, and storage of controllable and flexible devices without compromising comfort levels and indoor air-quality parameters.
In order to achieve the project objectives, several components were developed.
Figure 1 overviews the project components, which are detailed in the remainder of the present paper:
The gamification platform is embedded in a broader ICT-based platform for energy efficiency with an interactive energy management system, which aids interested stakeholders in optimizing “when and at which rate” energy should be buffered and consumed, with several advantages, such as reducing peak load, maximizing local renewable energy consumption, and delivering more efficient use of the resources available in individual buildings or blocks of buildings. This system also interacts with an automation manager and a users’ behavior predictor application.
The approach to motivate behavior change is made by intrinsically motivating the user to change procedures and to take advantage of opportunities to improve energy efficiency without compromising comfort level and autonomy. In order for the user to feel in control, the application analyzes the users’ context and past behavior to choose the right moment to introduce advice notices.
This pervasive application is composed of a context-aware module that identifies the context of the user (space and time) to provide input to a behavior predictor application. The behavior predictor incorporates advanced machine learning algorithms run in a closed loop to evaluate users’ reactions to the stimulus sent by the energy manager. This application also provides a simple and intuitive interface for the gamification platform.
To maximize overall system energy efficiency, the energy manager also interacts with an automation manager application for which the main goal is to manage in an optimal manner all the controllable devices available in the buildings’ premises, such as heating, ventilation, and air conditioning (HVAC) systems and thermal loads, taking into account equipment technical restrictions, comfort level, and indoor air-quality requirements.
An overview of the demo sites (Portugal, Spain, and Germany) is provided in
Appendix B.
The abovementioned apps were developed, tested, and implemented mostly in the Porto demo. Additionally, a competition envisioned by the project and partially implemented is described in
Appendix C. However, due to the COVID-19 pandemic, the office and services buildings (Porto and Barcelona) were left empty for months whereas the residential building (Lippe) were occupied for longer hours than before the pandemic. Due to this reason, full implementation of the FEEdBACk solution was not completed, since the baseline scenario for energy consumption would not reflect the reality of the observed consumption, and therefore, the possible energy savings that would validate the FEEdBACk solution would not be realistic.
3. Data Management Architecture for Monitoring Energy and Comfort
3.1. FEEdBACk Suite
The FEEdBACk Suite is, as its name suggests, the FEEdBACk project apps’ graphic user interface suite. It basically consists of a group of displays that aggregates the different results of the apps developed within the FEEdBACk project. The suite is placed over the DEXMA Monitoring platform as the company database is used by the project apps. Moreover, it is expected to let external third parties create their own apps and to use it as well.
The aim of the suite is to improve user experience and the tool’s usability. Initially, the energy manager app had to display all these app results. However, that would not have been consistent with the energy manager app description and was not very intuitive for the user. For this reason, the consortium agreed on developing a display for each of the apps in the FEEdBACk project that were not displayed in the mobile app already.
The presented format allows the DEXMA platform to execute the installation process faster, simpler, and more efficiently while the end user is only required to click an install button (later, some extra configurations may be required for each app). The app’s results displayed in the suite are as follows:
Energy manager
Net load forecasting
Occupancy forecasting
Load disaggregation
Automation manager
In
Figure 2, the whole FEEdBACk interconnection architecture is presented. It can be observed where the different apps are hosted and what is their relation with the ICT-based platform.
As previously described in
Section 3.1, an input for the Dexma Monitoring Platform is provided by energy meters and sensors. In the remainder of this section, an overview of the data management involving the meters and sensors used in the project is provided.
3.2. Metering
This section concerns energy metering in the Porto demo (see
Appendix B).
The building monitoring system consists of a group of meters addressing energy consumption in real-time in more than 160 points, installed in all circuit breakers on all electrical boards in the building. This building incorporates a very extensive set of loads and is equipped with an HVAC system that is centrally controlled, 4 L, 3 server rooms (with about one hundred servers), around 400 personal computers, coffee machines, water machines, refrigerators, printers, and lights, among others.
The sub-metering system consists of three parts: energy meters, gateways, and a server. These equipment were used to measure the energy consumption in the most relevant circuits of the building. The energy meters were equipped with three current transformers (one per phase) and allowed us to obtain the following information:
Active power
Active energy
Current
Frequency
Power factor
Voltage
Every 15 min, the meters store the measurements and then send it to a gateway, as shown in
Figure 3.
This gateway’s main function conveys the meter measurements to the server, where the data are permanently stored. The gateway is required since the meters use PLC (power-line communication) technology and the server only communicates using a TCP/IP (transmission control protocol/Internet protocol), commonly known as the computer network. This network uses the infrastructure previously implemented.
The server is a virtual machine running a Linux operating system, a MySQL database to allow us to persistently store all collected data, a JAVA plugin that performs the communication between the gateways, and the Perl scripting language to allow us to carry the data from the plugin into the database. The JAVA plugin collects information from all gateways and temporarily stores this information in object format that can be accessed through an HTTP REST API.
The current capacity of the server is about 250 thousand samplings, which, when divided by the approximately 160 m that make up the total installation, allows us to store temporarily about 1500 measurements per meter. If each meter provides a measurement every 15 min, this allows us to store data for around 15 days.
Through a URL, it is possible to obtain the data of each meter in JSON format. To safeguard this information, a PERL script was developed that accesses the indicated URL, extracts this information, and inserts it in the database for permanent storage.
To avoid duplicate values, whenever one accesses the REST API to obtain data, they are automatically deleted from the server. This script runs automatically at one-minute intervals. This enables the amount of data pending on the REST server to be as limited as possible and to make the data available as quickly as possible.
For the project competition in Porto, 14 teams were created (as detailed in
Appendix C). They were distributed according to their location in the buildings and the ability to determine their consumption (e.g., one open space is one team, and a row of offices in the same area is another team). Generally, each circuit breaker is related to only one type of load, which can be divided into the following categories:
Lights
Outlets
HVAC
Fan
Splitter
Hand Dryer
Lifts
Server Room
Server AC
Due to limitations of existing electrical circuits and respective metering, it was necessary to divide the consumption into two teams in some cases. As it is not possible to physically perform a load division, it was necessary to create additional meters (which will be called virtual devices) that contain a percentage of the consumption obtained by the actual real meter. With the creation of virtual devices, the opportunity was taken to go further and to try to simplify the meter system to make it easier to share information between partners. Thus, virtual devices were renamed as follows EM_PLACE_LOAD, where the words are defined as follows:
EM—electricity meter, to differentiate these devices from others;
PLACE—load location in the building or related to the team; and
LOAD—the type of load it represents.
Virtual devices were also created to represent the total consumption, either per floor, building, or team. In this way, it is possible to access information using just one meter, as if it was a real meter. These devices have the same periodic information as real meters and are generated shortly after obtaining information from real meters.
Table 1 lists the devices used by the gamification application, where it is possible to view part of the existing virtual devices:
These data were sent via HTTP REST API in JSON format to DEXCell (as detailed in
Section 3.1), thus allowing us to share information with other partners not only through custom graphics but also through its own API.
Figure 4 represents an example of the data collected from meters and visualized using the FEEdBACk suite presented in
Section 3.1.
3.3. Multisensor
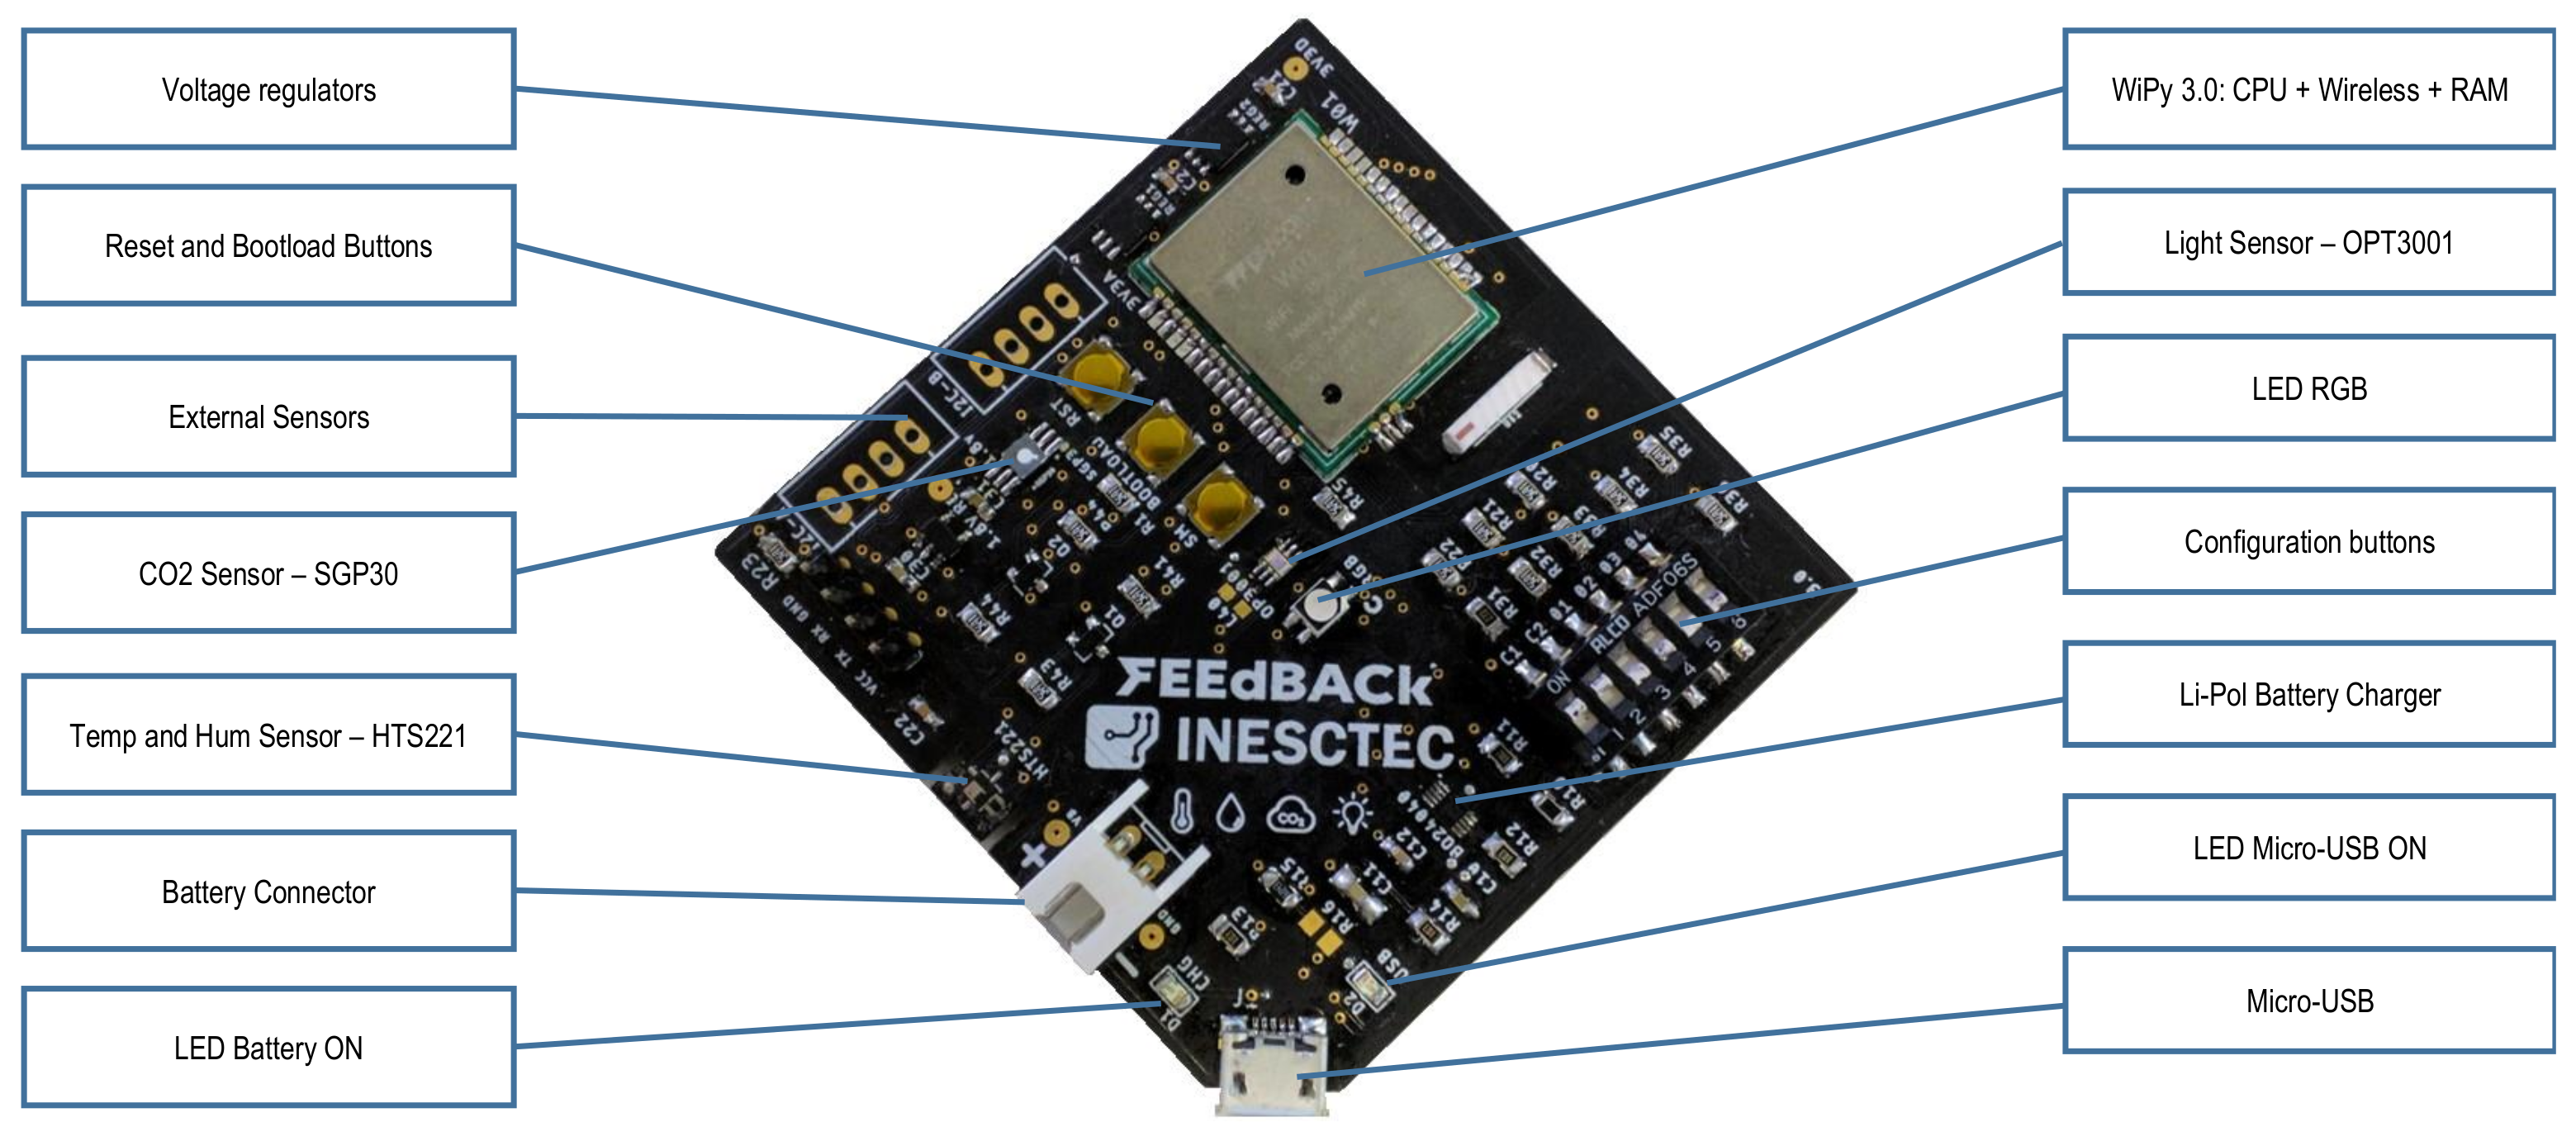
In order to assess the indoor air quality in a workspace, a sensor was installed that is capable of measuring temperature, humidity, and CO2. Furthermore, it was necessary to be able to send measurements in real time using the existing infrastructure (typically wireless network) and to store this data persistently in a database.
Obtaining these data has three objectives:
Inform users in real-time about the current conditions of their room,
Allow us to define the comfort values for each room (considering that each room has different sizes, orientations, and number of users),
Allow us to create forecasting models regarding the occupation of the locations where they are installed—see the sections regarding occupancy forecast (
Section 6.3) and behavior predictor (
Section 6.4).
As there was not an ideal, off-the-shelf solution that could suit the requirements presented above, we decided to design a sensor from scratch with the following requirements:
Sensors: Temperature, Humidity, and CO2
Real time communication
Wireless network connection
Ability to store measurements locally in case of network failure
Ability to send those measurements when connectivity is restored
Possibility to define how often to send measures
Possibility to use rechargeable battery
Direct power supply (typically 230 V)
Configuration via web page (from the device itself)
Basically, the sensor consists of a WiPy processor, measurement sensors, micro-USB port, and battery connector for power. During the development stage of the sensor, we decided to include a light sensor since the extra cost was relatively small.
The sensor operates as follows:
Every 15 min, the micro-python processor checks all the sensors for their measurements,
It sends this information via a web service to a server and stores the information in a MySQL database;
This information is then sent to the DEXCell project platform.
Between the measurement period, the sensors enters a state called “deep sleep”, where their energy consumption is reduced to a minimum and only keeps a timer running that allows the device to wake up again after a predefined period. This solution allows the device to be used with a 2000 mAh lithium battery. With this system, it is possible to have the device unplugged and running during circa one month and a half without recharging needs. Due to physical impossibility, it is not possible to know the battery’s state of charge, so it is not possible to know when to replace it with a charged one. Another limitation occurs when it operates continuously (or at relatively short intervals). The processor has a tendency to heat up, which will influence the measured temperature value. Another limitation exists on the CO2 sensor, since it does not read values below 400 ppm. In general terms, this not a concern since the discomfort limits are the reason for measuring CO2 and those are only above 600 ppm. However, the information received by users may seem inaccurate because it may give rise to the idea that the sensor has malfunctioned (always transmitting the same value) when the sensor does not actually detect lower values. Regarding the light sensor, it was found that it obtains different values depending on the location of the equipment. Moreover, it makes no distinction between sunlight or artificial light. However, it is an important aid in occupancy charts as the room is typically not used without light.
Figure 6 and
Figure 7 show the measurements obtained by the multisensor on 24 September 2020.
4. User Profile Segmentation
User profiling segmentation in FEEdBACk is based on user behavior, more specifically on the specific motivational drivers and barriers for changing energy behavior that characterize a particular user profile. Pro-environmental values and attitudes were used as the main variable that determines which profile a user is assigned. This section describes our approach to user profile segmentation and how the results are applied in the project.
The three demonstration sites that implement and test the FEEdBACk gamification platform represent three unique settings, most evident in the split between residential (Lippe) and nonresidential buildings (Barcelona and Porto). The nonresidential buildings consist of different types of buildings, e.g., a multi-storey office building in Porto and multi-purpose public buildings in Barcelona, which results in a large variation in the types of users as well as how and why they are users in these different buildings. Similarly, the residential buildings represent a range of different types of households. The user profile segmentation task was therefore challenged by accounting for these structural differences while considering how they may interact with the users’ energy related behaviors as well as the motivational drivers and barriers for changing that behavior.
The chosen methodology for developing user profiles was to develop an extensive questionnaire that consisted of different sections where pro-environmental values, attitudes, perceptions, and beliefs were explored from different angles. The questions were formulated as statements, which were answered using a 5-point Likert scale, which allowed us to quantify the data sample.
The formulation of questions was based on three models: The Theory of Planned Behaviors (TPB) [
11], the New Ecological Paradigm Scale (NEP) [
12], and Place Attachment (PA) [
13]. The TPB was more recently applied to explain pro-environmental intentions as well as behavior in the workplace [
14,
15,
16]. As a theory for predicting behavior, the TPB was on one hand cited as being useful [
17,
18] while other authors highlighted its limitations [
19,
20,
21].
The NEP scale has been used to measure a given population’s environmentally conscious world view [
12] and the degree to which an individual feels that they are part of nature rather than separate from it: human activities are seen as directly linked with (and thus affecting) global environmental changes [
22]. For an assessment of the application of the NEP scale, see [
23].
The notion of place attachment has been used here as a multidimensional construct comprising place dependence, place identity, place affect, and place social bonding [
13] and thus as based on both a relationship with the place itself and with the others in that given place. Although primarily used in the context of the natural environment, the place attached is used here in the context of a workplace. We were interested in exploring if—and how—the workplace may become that physical space in which pro-environmental behaviors are valued and may reinforce positive feelings of place attachment, e.g., reinforcing pride, acknowledgement, and satisfaction with the workplace (see also [
24]).
A total of 219 complete responses were collected and analysed. The analytical process had one significant restraint, mainly that the project decided to limit the number of user profiles to six unique profiles. This factor had to be kept in mind when determining how to build the profiles and the associated decision tree. Details about the six profiles can be found in
Appendix E. Overall, the analysis had a threefold goal:
To identify key data (and hence questions) that could be used to develop user profiles. This was done with the purpose of also being able to identify a decision tree for the users’ profiling app based on a consolidated version of the user profile questionnaire. The decision tree was used to assign individuals a user profile;
To define six unique user profiles including a description of the motivational drivers and barriers for each profile;
To analyze the interrelationship between the motivational drivers and the environmental envelopes of the buildings in the pilots and to segment users within a profile group according to the environmental envelope they are located in.
User segmentation is important as it also is used to ensure that users receive only relevant action-related messages. An example of such a message could be “Remember to open the blinds and use daylight instead of artificial lighting”. This message would only be relevant (1) if users can control the blinds and the lights, (2) if they are in a room with windows/blinds, and (3) if windows are situated so that daylight can enter (i.e., Do windows face south, north, east, or west?). Moreover, such a message should also consider the actual real-time weather and time of day.
In the analysis, we looked for common patterns and trends across the entire data sample, being particularly sensitive to differences between the nonresidential and residential data samples. We also checked the inner consistency of separate sections (e.g., questions representing a unique framework) using Cronbach’s Alpha. As a result, the NEP scale was discarded and we focused instead on questions related to the TPB model (notions of place attachment will be explored further in forthcoming work on behavioral change assessment.). When separating the data related to TPB, we found a clear pattern that, even where respondents had similar overall attitudes, values, and beliefs, they had very different perceptions of self-efficacy and how resourceful respondents felt with respect to reducing energy.
Based on the findings from the analysis, a decision tree for user profiling was developed, which allowed the app to automatically assign user profiles based on the combination of 18 questions on pro-environmental attitudes, beliefs, values, and perceptions and 4–6 (demo site specific) segmentation questions. By assigning user profiles to each participant in FEEdBACk, the aim is to stimulate the psychological underpinnings of users’ energy behaviors with the purpose of strengthening their intentions and transforming intentions into concrete habits.
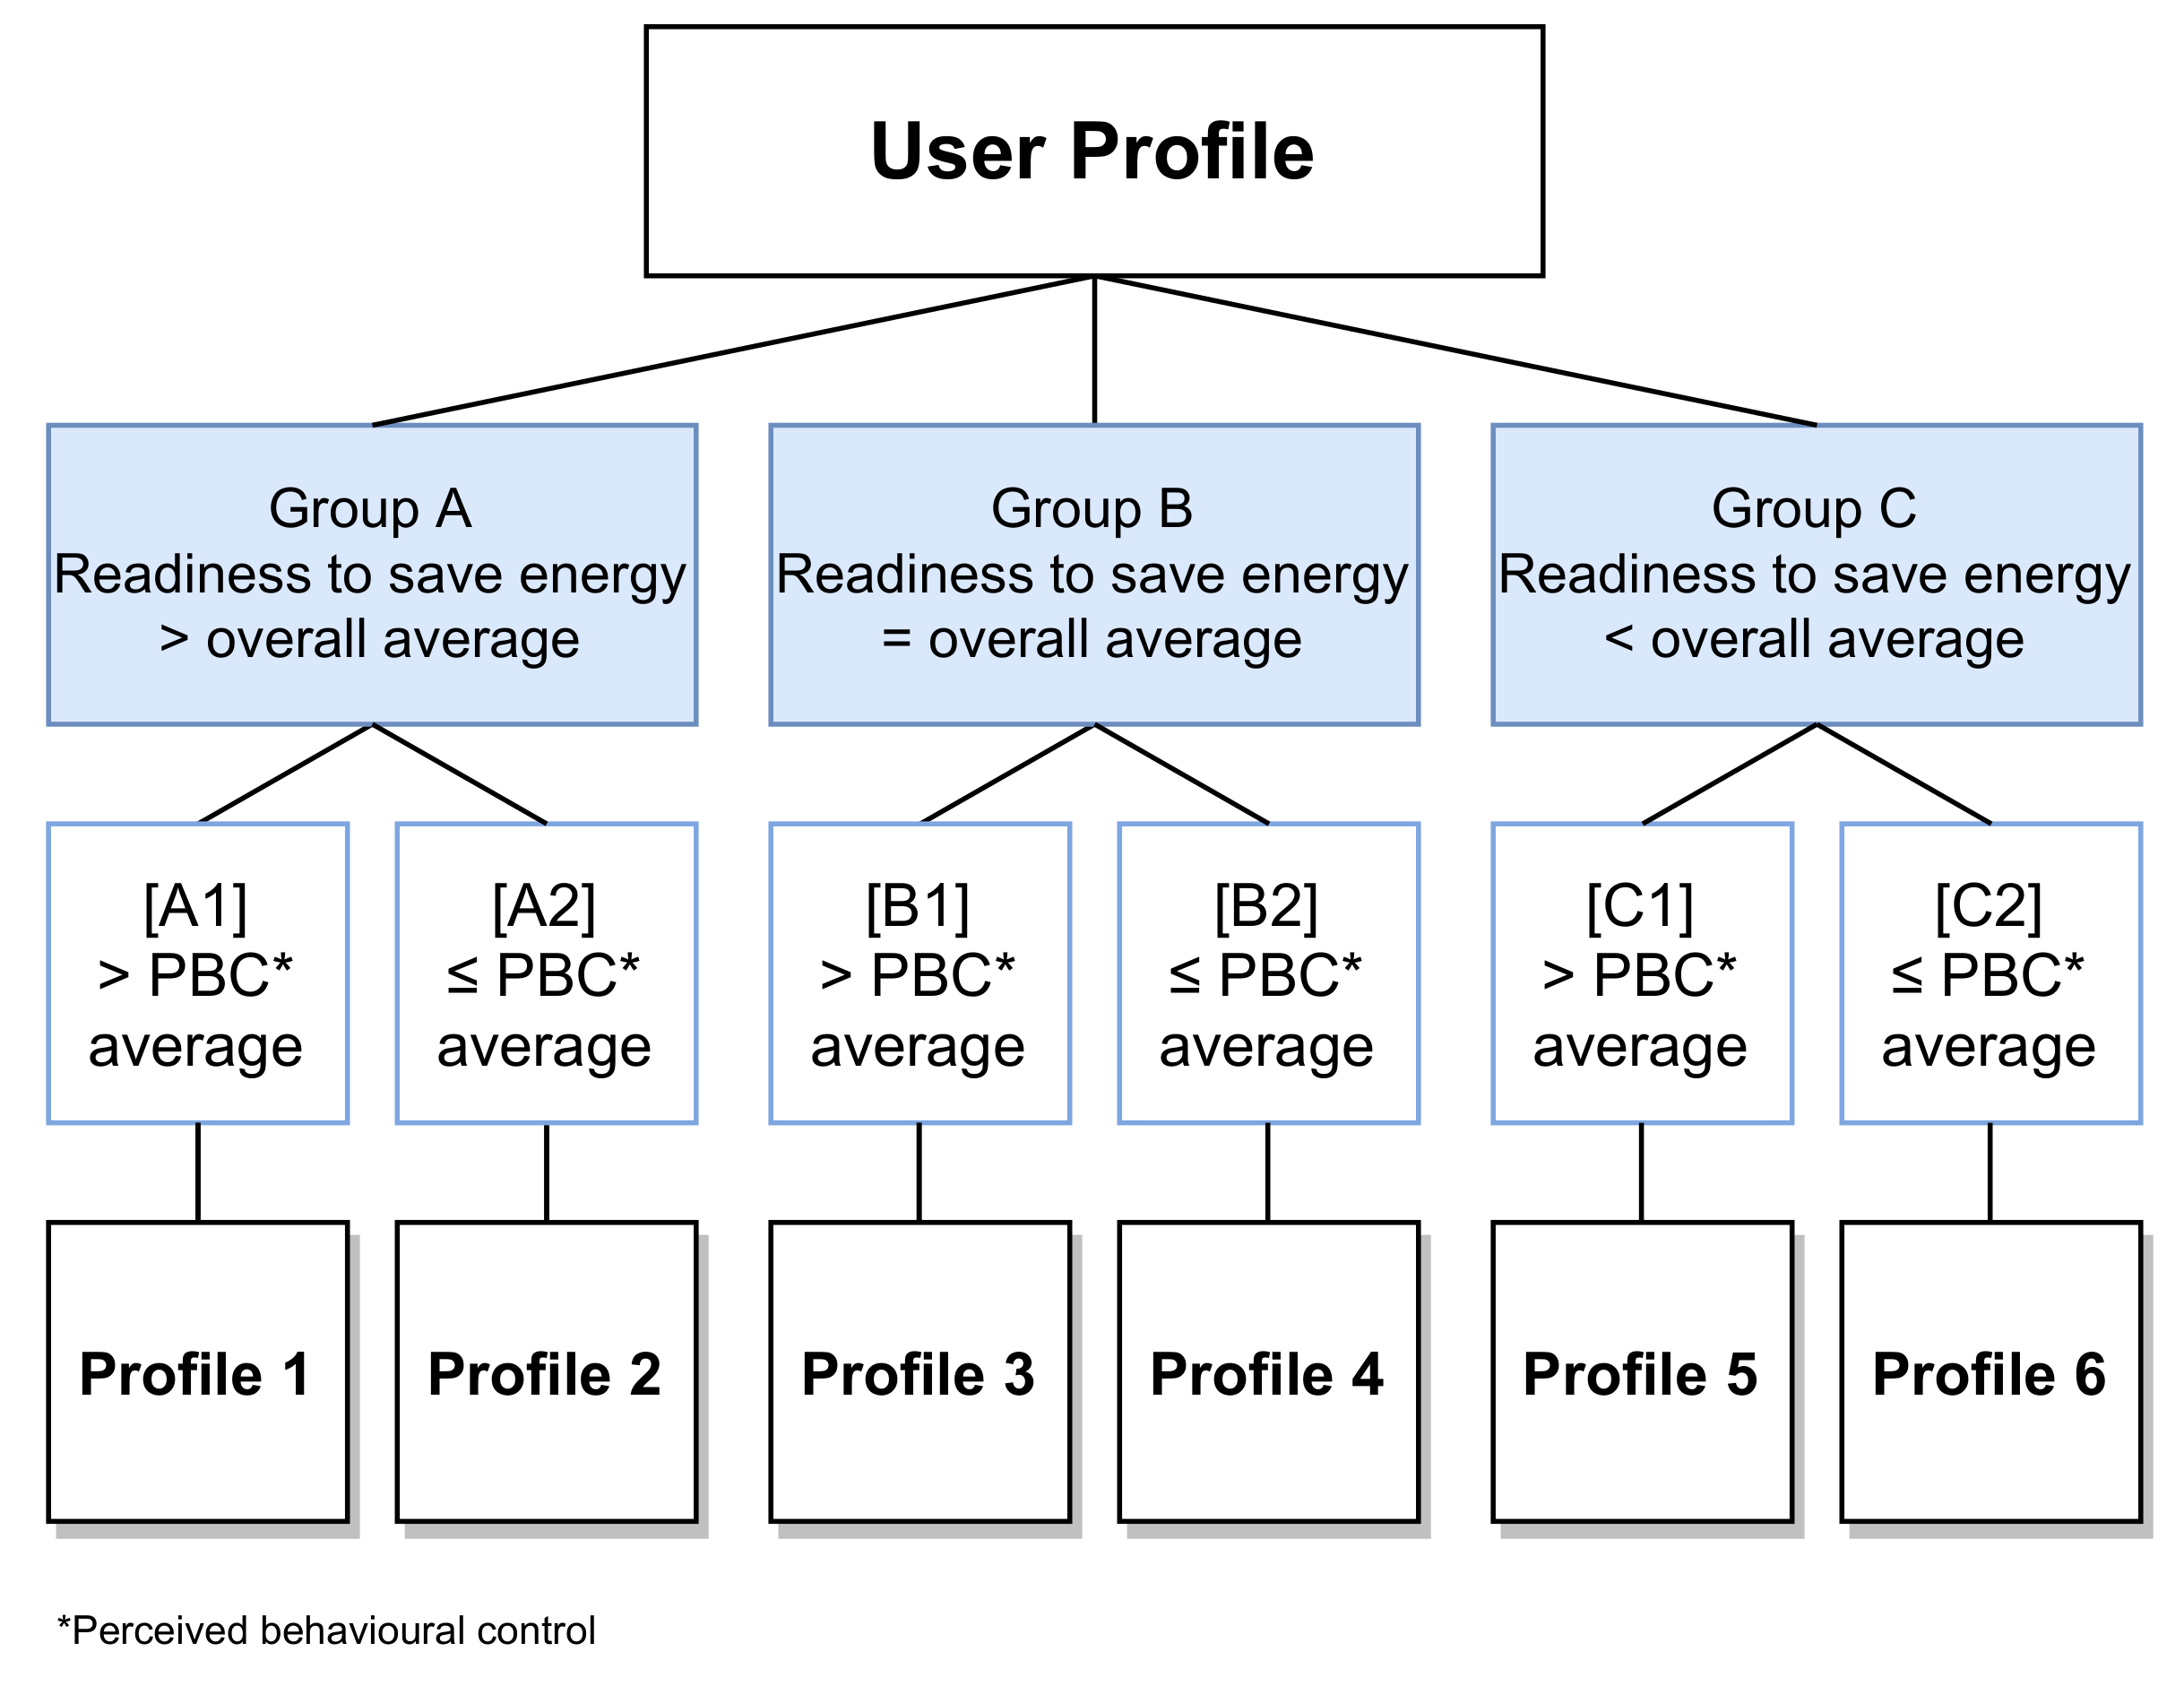
Figure 8 shows the decision tree that was be implemented in the users’ profiling app to assign each individual player a user profile. It is based on the scores received from the user profiling questionnaire presented in
Appendix D.
The decision tree was based on the following calculation:
The above formula must be used to calculate first “Readiness to save energy”, which results in three distinctive groups (A, B, and C). Next, the formula is applied for each of these three groups to calculate the “Self-efficacy” score for each. “Readiness to save energy”: this is the overall total score based on all 18 questions related to behavior. “Self-efficacy”: this is the score based on the 6 questions related to perceived behavior control (PBC) or self-efficacy (see
Appendix E).
Figure 9 shows an example where the total number of entries (respondents) is 51.
Figure 10 illustrates the subsequent step, where the focus is on the average score for the six questions related to PBC. In this case, for group A, the average score for PBC is 3.9 and group A was thus split into two groups: Profile A1 and Profile A2. The formula must be applied to groups B and C also, resulting in a total of six unique user profiles, which are presented in detail in
Appendix E.
5. Gamification Platform
The gamification platform (
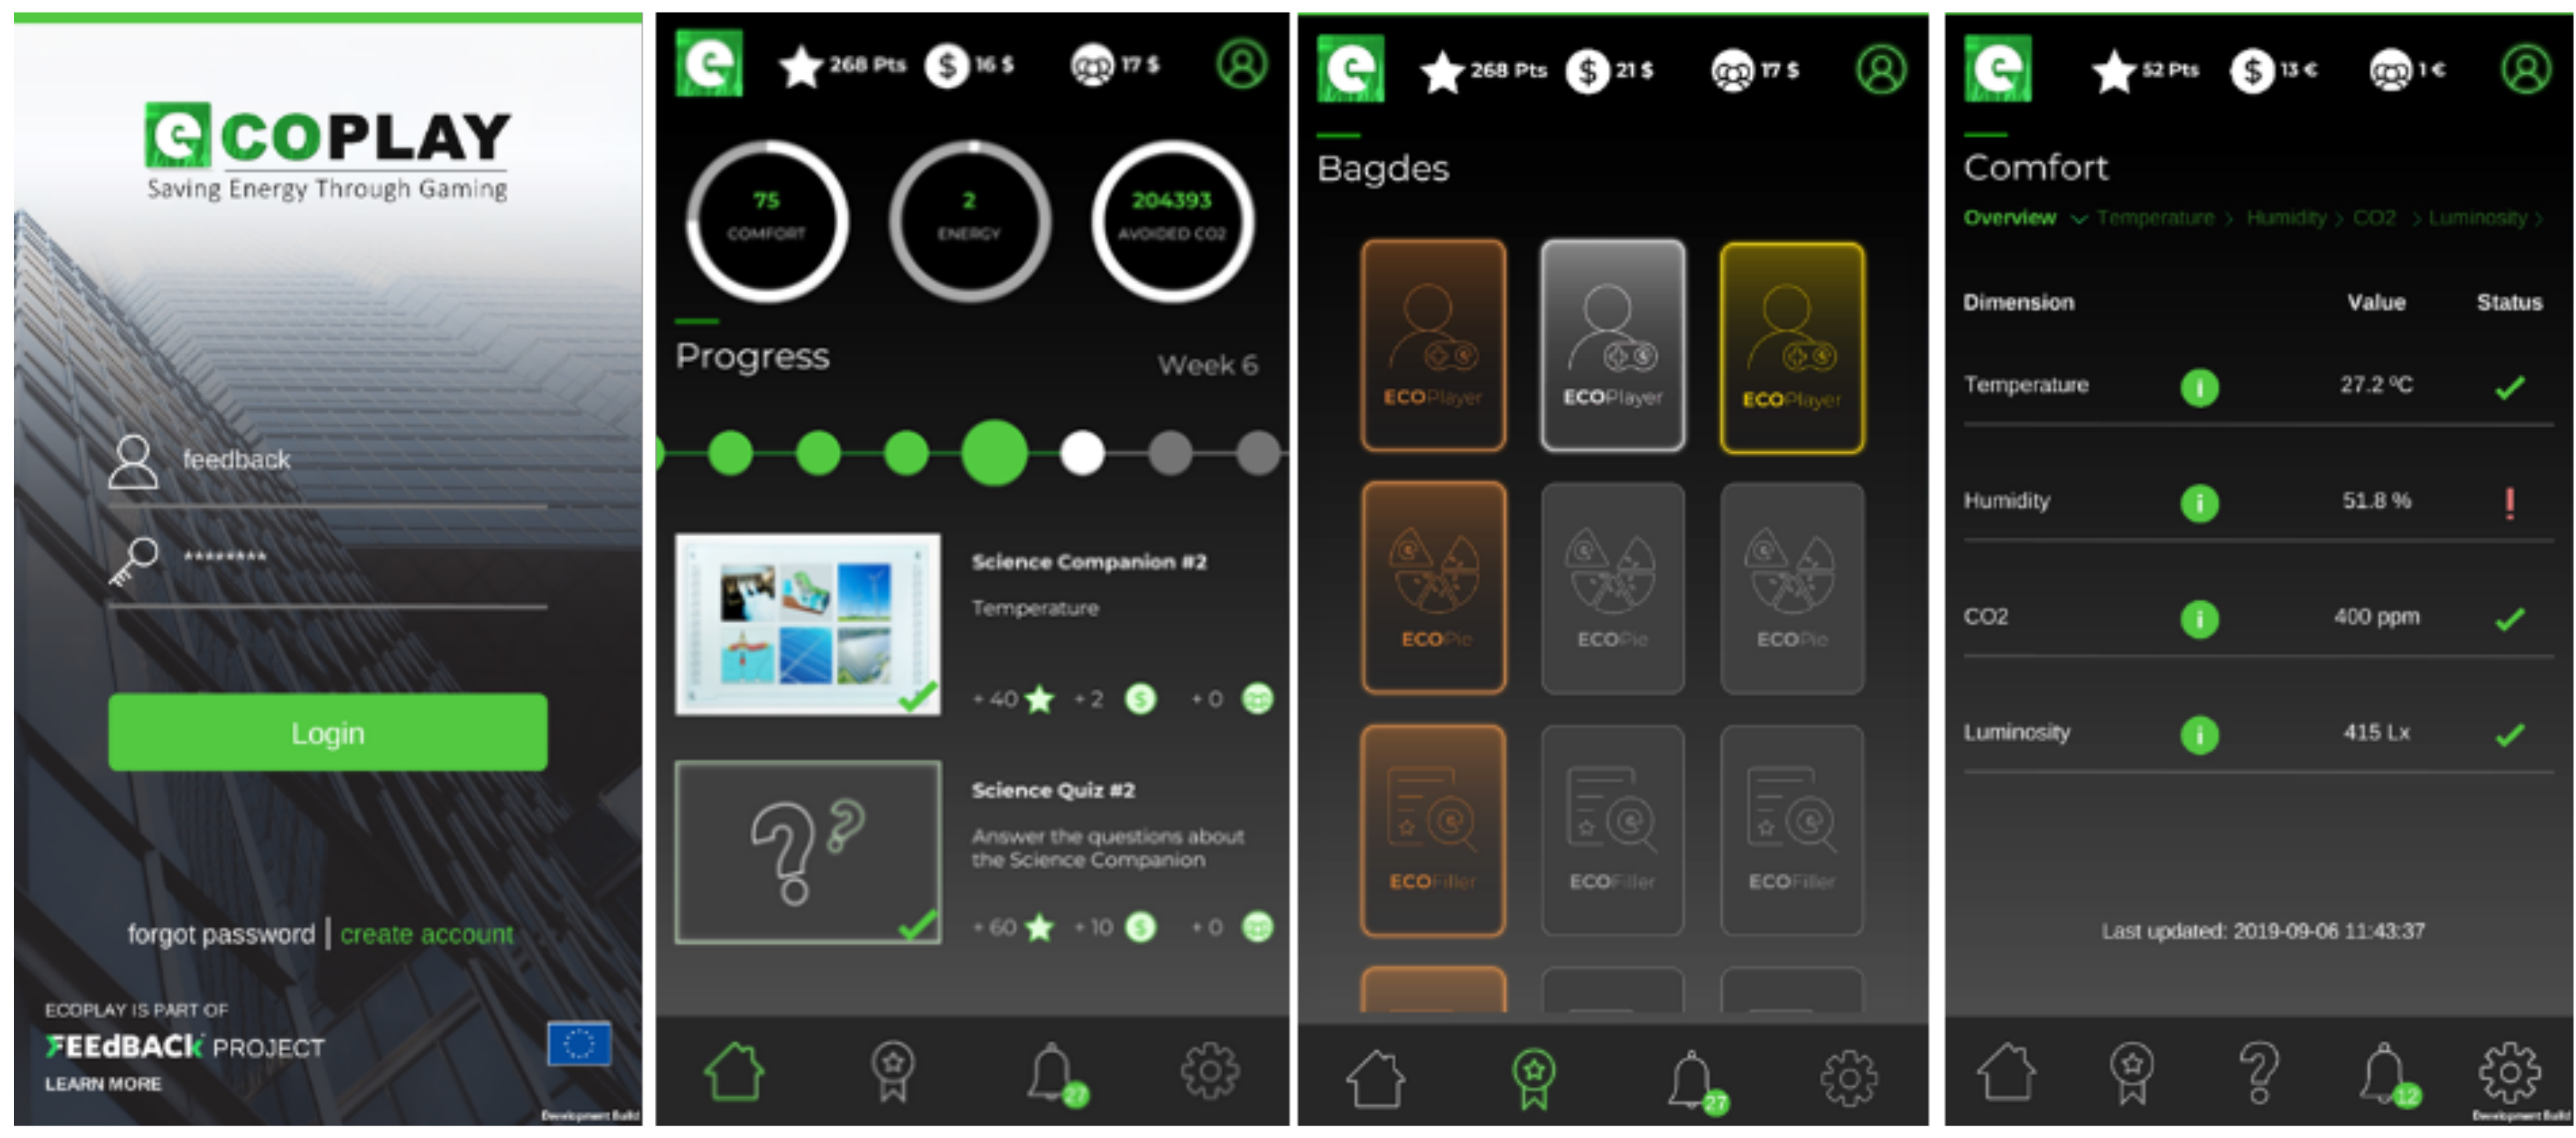
Figure 11) consists of a set of elements that aim to provide the user, through a mobile application, with an experience that leads to encouraging a more efficient-energy utilization and a more responsible consumer behavior. The face of this entire ecosystem is the pervasive mobile application (ECOplay), which analyzes context and sends personalized messages through a gamified peer competition.
As we can see in
Section 3.1, the gamification platform engages in a broader interactive energy management system, which aids interested stakeholders in optimizing the utilization of the resources available in individual buildings or blocks of buildings and in maximizing energy savings. This system enables decision support capabilities and interacts with several other applications, such as an automation manager (
Section 6.5) and a users’ behavior predictor (
Section 6.4).
The gamification platform sends several types of messages:
Alarms: These messages warn the game master when a group is not configured correctly (i.e., a user is no longer working/living on a location). They are displayed on the energy manager Graphical user interface (GUI.)
Short-term recommendations related to personal environment settings and activity in order to save energy (i.e., please remember to turn off the monitors when you leave the office!). These recommendations are displayed on the gamified mobile app.
Short-term recommendations related to facility settings and directed to the facility manager (i.e., please turn off the AC as indoor temperature is below 23 ). These recommendations are displayed on the energy manager GUI.
Mobile Application
Based on previous research findings (
Section 1), a platform based on a gamification approach was developed in the course of the FEEdBACk project, where each user is encouraged to firstly raise their level of understanding of options for energy use and its implications and then to engage them to set their own personal targets, to interact competitively with other users, and to be motivated through different reward schemes according to their group intrinsic characteristics.
The developed mobile application (
Figure 12) has an interactive and user-friendly GUI to motivate permanent behavioral change by fostering awareness, understanding of energy options, and consumer engagement through personalized and opportunistic messages and gamified peer competition.
The mobile app presents different types of screens, according to the goals set:
Login and create accounts for each user, selecting their location;
A complete gaming dashboard where the user can understand what is the current progress, what are the next things that must be done, how to obtain scores (individual and team points), and energy- and comfort-related metrics. It is on this screen that they jump to other functionalities;
Individual and team leader boards;
List of badges with the indication of what was gained and what must be done to earn mores;
Comfort measures and graphics;
Energy measures and graphics;
List of all received notifications;
User and application settings;
In addition, the users have the possibility to reflect on their peers’ progress towards energy efficiency, thereby increasing visibility, awareness, and commitment. Levels of learning and understanding energy use also is provided by videos, quizzes, and other learning objects that are available weekly according to a learning and engagement plan.
The developed gamification engine does not have to simulate or model the potential behavior change—it will be able to aggregate the data from media-enabled training programmes plus anecdotal evidence through user storytelling and then actually measuring the impacts, both technical and emotional, on a daily basis. This allows for significantly improving the range and quality of information and behavioral understanding.
6. New ICT and Data Analysis Applications Developed in FEEdBACk
6.1. Net Load Forecasting and Baseline
The Net Load Forecasting and Load Baseline application is composed by three core services:
Photovoltaics (PV) Forecasting Service generates photovoltaic energy generation forecasts, with 15 min time resolution, for a time-horizon up to 72 h ahead. It was applied for the case of INESC TEC (see
Appendix B), for the solar panels installed in the building rooftop, which amounts to 16.38 kW of installed power;
Load Forecasting Service generates energy consumption forecasts, with 15 min time resolution, for a time-horizon up to 48 h ahead. This forecast is trained to take into account the most recent available data;
Load Baseline Service provides daily estimations of power consumption profiles for the preceding day, with 15 min time resolution. This forecast is based on historical measurements of data prior to the actions promoted in the scope of the project.
Combining objectives 1 and 2 allows for obtaining the building net load forecast, which is of interest for maximizing the building self-consumption. Combining objectives 2 and 3 allows for quantification of the behavioral change induced by the project.
The structure of the application and respective services is illustrated in
Figure 13.
The services presented in
Figure 13 are constituted by supervised machine learning models that exploit exogenous information such as numerical weather predictions (NWP) combined with on-site measurements data (PV energy generation and energy consumption gathered by FEEdBACk project data metering systems) to produce the respective outputs (e.g., forecasts or baseline estimations).
The historical and daily NWP data used by all the services in this application were generated by the mesoscale Weather Research and Forecasting (WRF) model. This information is currently available at MeteoGalicia THREDDS server (
https://www.meteogalicia.gal/web/modelos/threddsIndex.action (accessed on 15 February 2021)), which is a publicly available service that enables access to data catalogs of multiple data providers. For each service (e.g., PV forecast, load forecast, and load baseline), a selection of weather variables is explored.
6.1.1. Load Forecasting
The Load Forecasting Service is responsible for providing short-term forecasts on energy consumption for different appliances (such as lights, outlets, and HVAC, among the others mentioned in
Section 3.2). It consists of a framework of various forecasting models, combined to provide point forecasts up to a 48 h ahead of the time horizon. This ensemble aims to leverage the performance of each individual model, thereby mutually improving their quality and producing better forecasts.
The models, in general, depend on on-site historical energy consumption measurements data and exogenous information such as WRF-NWP variables (which are described in
Table 2).
The process is presented in
Figure 14. After accessing the necessary data, feature engineering techniques are used to create new variables that improve the forecasting quality of the models. Such a set of features includes calendar variables, lags of the historical measurements, and a selection of weather variables (and/or their lagged variants). An analysis of the days subject to forecasting determines the presence of holidays or bridge days, which influence the subset of historical data used as input and for which features are selected for the models. In the case of regular days, an extra selection step, based on correlation, defines the subset of features used as input. The requisites are as follows:
Naive model: only the last equivalent day consumption records are needed.
Model based on data from last week (LastWeek): for this model, only calendar variables are used to select previous seven days’ same-hour records and prediction is a weighted average of those values.
Conditional Kernel Density Estimation (cKDE) and Gradient Boosting Trees (GBT): a subset of all the engineered variables as mentioned above are fed into these models.
For GBT regression, two different implementations are used, from the Python package
sklearn [
25] and the framework provided in LightGBM [
26]. In the case of cKDE [
27], online optimization of hyperparameters using the Nelder–Mead algorithm is also performed in order to improve the forecast quality. A total of five different models are applied to each forecast computation. In the ensemble phase, their performance is evaluated using last month’s available forecasts and the two best models are selected, after which the mean value of those two models’ forecasts is used as the final output. Not all five models are used in order to avoid averaging with models that recently performed worse. Finally, the results are stored in the database to be used for calculation of the net load forecast (along with the PV power forecasting module output from the next subsection) and other applications.
Table 3 shows the duration of a single run of the service considering the various phases of the process.
6.1.2. PV Power Forecasting
The PV power forecasting service relies on machine learning models combined with feature engineering techniques to generate short-term (up to 72 h ahead) solar energy forecasts. These forecasts are later used by the Net Load Forecasting Application to estimate the future net load of the INESC TEC building.
The forecasting models embedded in this application depend on the following data sources: (1) historical power production measurements from local power plants (e.g., household or buildings PV panels) and (2) numerical weather predictions (NWP) for a predefined selection of weather variables.
Analogous to the
Section 6.1.1 application, the NWP variables are extracted on a daily basis from the Meteogalicia THREDDs server. The selection of weather variables for this service is presented in
Table 4.
The machine learning pipeline considered in application is illustrated in
Figure 15.
As depicted by
Figure 15, there are four steps in the data pipeline. Initially, NWP and raw energy generation measurement data were retrieved from the FEEdBACk project central database. These timeseries were then temporally aligned and imputation techniques (i.e., linear interpolation) were used to replace the missing values in between hours (no imputation was performed for more than one hour of missing values).
To improve the quality of forecasts, feature engineering techniques were applied individually to each raw NWP timeseries. The techniques implemented for this application result from the extensive study in [
28]; therefore, only a brief description of each is provided below.
Temporal variance : Three temporal variance indicators considering
hours moving windows centered in a specific lead-time of interest
:
Average of past NWP runs (: average of the four available forecast runs (
) for a specific lead-time of interest
.
Lags and leads : Preceding (lags, ) and following (leads, ) with respect to each lead-time in the forecast horizon.
The combination of feature engineering techniques with nonparametric models such as gradient boosting trees (GBT) was effective regarding solar power forecasting. As an example, the top performing models in the Global Energy Forecasting Competition 2014 (GEFCom2014) included gradient boosting forecasting models in their methodology. Additionally, the model that ranked second only used on-site information, which means that great improvements in the forecast quality can be obtained by carefully exploring local information [
29,
30].
In this work, the Python open-source scikit-learn library [
25] GBT implementation was used. The models were trained on a supervised fashion (i.e., weather-to-power model) considering the historical up-to-date PV measurements and NWP-WRF data. To maximize the forecasting quality, the GBT hyperparameters were optimized using the Bayesian optimization algorithm [
31] using the package [
32].
The trained models were then used to produce PV power forecasts using daily weather forecasts as input information. These forecasts were then stored in the FEEdBACk project central database to be used later by the remaining software applications (e.g., Net Load Forecasting Application).
Considering that the entire framework illustrated in
Figure 15 runs upon requests and its forecasts are subsequently used to calculate net load forecasts, it is important to assess the total computational time of each forecast run.
Table 5 presents the computational times of every step in the forecast pipeline. The results were extracted from a single run on a Intel(R) Xeon(R) CPU E3-1245 v5 @ 3.50 GHz with 32 Gb RAM.
6.1.3. Load Baseline
The baseline estimation component consists on forecasting energy consumption based on an alternative scenario where there are no control actions. In this case, we understand that these actions will be stimulus given to end users in order to influence their own consumption behavior and consequently taking control over load curves. Therefore, the deployed statistical models are based on consumption patterns before the implementation of the FEEdBACk project. The data points are produced as output displayed in the form of time series. These values correspond to consumption granules of 15 min serving as a comparison to real equal-resolution consumption metering (as in
Section 3.2). Thus, we can calculate energy savings when we differentiate that variable pair. In order to develop statistical models for estimation of (what we designate by) load baseline along the time, we need predictors such as simple calendar factors (hour, day of the week, month, etc.) and exogenous variables to tackle a multiple regression problem.
The seasonal variables are inferred from timestamps collected in energy consumption databases. For the FEEdBACk project, we obtained meteorological conditions (irradiance, temperature, relative humidity, and cloudiness) as exogenous predictors. Measures of these explanatory variables are registered in the three demo municipalities. MeteoGalicia (
https://www.meteogalicia.gal/web/modelos/threddsIndex.action (accessed on 15 February 2021)) service provides datasets with that type of one-hour granularity measurement joined to each consumption node dataset through interpolation, with municipality in common.
Regarding the creation of most effective predictive models, we took feature engineering and parameter tuning as a starting point. Gradient boosting trees (GBT) [
25] was chosen as a regression algorithm for application because (I) it performed better for an instrumental variable estimation, (II) it has large flexibility in parameter optimization, and (III) it does not need scale transformation at the level of predictors. As scoring criteria, we adopted the mean absolute error divided by maximum history consumption measure verified on each node.
Firstly, the tested models were oriented for distinct predefined feature subsets, where it distinguished them from several weather conditions. For a first collection of consumption nodes integrated at the Porto demo site, models combining four variable subsets with two temporal resolutions and using fixed parameter settings were tested. Therefrom, several node models sharing the best scores up to third decimal place were checked. Even so, most results kept the score below the naïve model (estimations based on previous-day consumption).
Due to unsatisfactory results, feature extraction after was adopted, namely indicator variables and others such as season of the year or monthly minimum/maximum average consumption. About weather features, only the (external) temperature predictor was kept because it correlated significantly better with load consumption (than the remaining ones) in most consumption nodes. Instead of feature-oriented modeling to achieve greater assertiveness on statistical models, parameter optimization was used on the GBT algorithm through Grid Search using the 9-fold cross validation [
25] method. Therefore, the closest results to real consumption where nodes with regularity were achieved.
Thus, a forecasting model suitable for each consumption node was produced, meaning assignment of realistic estimations to distinct devices, rooms, floors, buildings, and demonstrators. Considering a specific parameter tuning per node, an operational module (see
Figure 16) was developed, capable of estimating the baseline for a certain time horizon and taking into account launch time (beyond system time). If estimation day is ordinary (neither a public holiday nor bridge), then the statistical model applies predictions based on timestamps inferred from the forecasting window. This type of model only accepts energy forecasts if temperatures are completely available.
In the case of problems related to weather info database, alternative models are used, which were trained with no exogenous variables. For holiday scenarios, a rule scheme is followed consisting of previous-consumption simple averages by each time of day corresponding to the same times according to the applied rule. Output values are sent to the respective demo database, where datasets contain timestamps with node addresses, request times, measured units, and energy forecasts.
6.2. Load Disaggregation
Load disaggregation application aims to provide an overview of the electricity consumption in buildings. For instance, it transforms the whole-building aggregated power measurements to specific consumption values allocated to categories of devices. The application allows us to avoid physical monitoring of individual appliances’ power consumption employing nonintrusive load monitoring (NILM) [
33]. Therefore, such an approach not only contributes to preserving occupants’ privacy but also saves effort and cost of sensors installation at each power outlet in the building. Moreover, load disaggregation techniques are suitable for both tertiary and residential buildings. NILM methods can be classified into various groups, such as supervised and unsupervised [
34], and low-frequency and high-frequency methods. The latter frequency-based division is determined in detail in the works of [
35,
36]. The load disaggregation approach deployed in the current project falls into the unsupervised low-frequency category and is thus suitable for disaggregating power measurements obtained from conventional smart meter at a 15-min resolution.
Figure 17 represents the application’s block scheme, where the primary input and output data streams are depicted. The unsupervised device usage estimation (DUE) algorithm [
37] represents the core of the load disaggregation application for residential households. The DUE differs from the methods proposed previously in the literature by being a hybrid methodology between load profile simulation and load disaggregation. Due to its unsupervised nature, the algorithm does not require any training. Therefore, it extracts essential model parameters from various available data sources.
There are three types of inputs required for the DUE algorithm. First, the load profile of the household is obtained, which consists of aggregated low-frequency active power measurements at 15-min resolution. Second, household metadata is collected using targeted or publicly available surveys. The essential information includes the list of appliances present in the house; the characteristics of the inhabitants, namely number, age group, and employment status; and the frequency of using various devices. Third, probability statistics of daily activities are plugged in from the time-of-use survey. The algorithm requires that these data generate activity chains for each member of the household based on the Markov model. On the output side, the DUE algorithm provides disaggregated load curves according to 8 distinct categories: cooking, entertainment, fridge, heating, information and communication technology, standby, housekeeping, and light. Each category is composed of various common household appliances and the interested reader can refer to [
37] for more details.
The workflow of the DUE algorithm can be described in two steps: pretreatment and the main disaggregation procedure. As the methodology is sequential, it has to be repeated for each of the days of interest in the household load curve. First, the standby and the fridge consumption are filtered out from the power signal. The prior is identified as the minimum power level of the considered day; thus, occasionally, it includes the constant part of the fridge consumption. The latter is extracted from the night time periodic signal of all the days in consideration and is further synchronized with the power signal of each particular day. Once these two categories are detected in the load curve, they are subtracted from the power measurements and the algorithm proceeds to building activity chains for each inhabitant above the age of 10. The methodology varies between inferring the activity chain for a teenager and an adult. Activities are allocated with respect to the occupancy patterns of the household, which can be deduced from the power peaks of the load curve. As partial occupancy is not considered, all inhabitants are assumed to be present in the house when a power peak is detected. Teenagers between the ages of 10 and 18 are expected to have unpredictable activity chains; therefore, they are treated separately and their chains are created randomly. Once activity chains are generated for each member of the household, the algorithm allocates respective appliances based on their usage probability per activity, usage duration, and their power demand. The optimization procedure described is repeated until the difference between the measured and the simulated load curves is smaller than the predefined tolerance.
Despite being unsupervised, the DUE algorithm delivers estimation accuracy comparable to one from the supervised NILM algorithms. Moreover, computational performance is the advantage of the DUE algorithm. Due to its sequential nature, the execution time scales linearly with the length of the dataset. Therefore, the user of the load disaggregation application can choose historical periods of variable duration to overview their electricity consumption patterns.
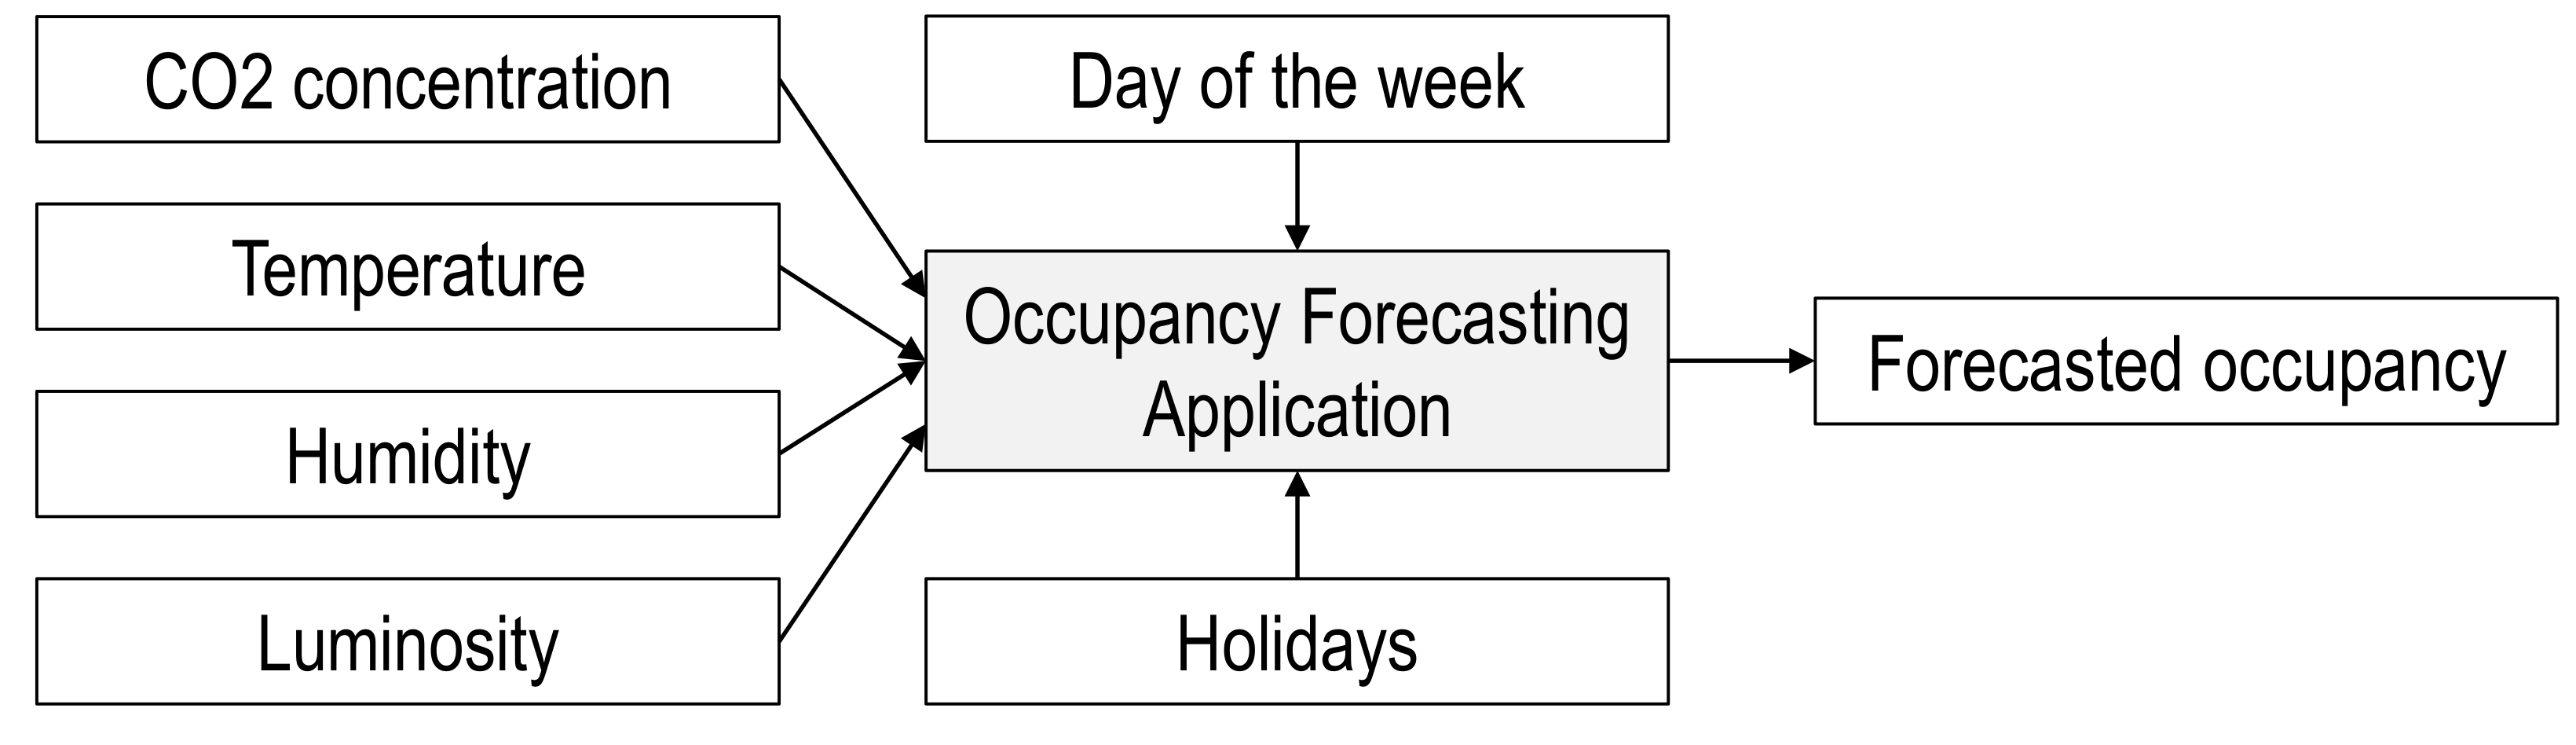
6.3. Occupancy Forecast
The occupancy forecasting application supports other applications by indicating a building’s occupancy for the days ahead. Depending on the demonstration site, the app provides forecasted presence and absence information by sub-metering zone, by functional area, or by a house as a whole. The algorithms to forecast occupancy can be classified into schedule-based and context-aware [
38]. The latter approach, at the core of the developed application, depends entirely on sensing the conditions of indoor climate or by approximating it through electricity or water usage. The methodology is based on indirect occupancy detection; hence, no devices of which the purpose is precisely to detect the presence, such as video cameras, passive infrared sensors, or motion sensors, are used. The choice of an indirect approach was made for two reasons. First, it preserves users’ privacy as the occupancy information is inferred contrary to being collected. Second, it allows us to effectively exploit meters and sensors already in place or installed in the course of the project. Another way to classify the occupancy algorithms is to divide them into supervised and unsupervised, where some of the most prominent works in the field [
39,
40] deploy the prior and the latter methods, respectively.
There are two types of algorithms developed for occupancy forecasting in the framework of the FEEdBACk project, with their methodology, design, validation, and testing detailed extensively in [
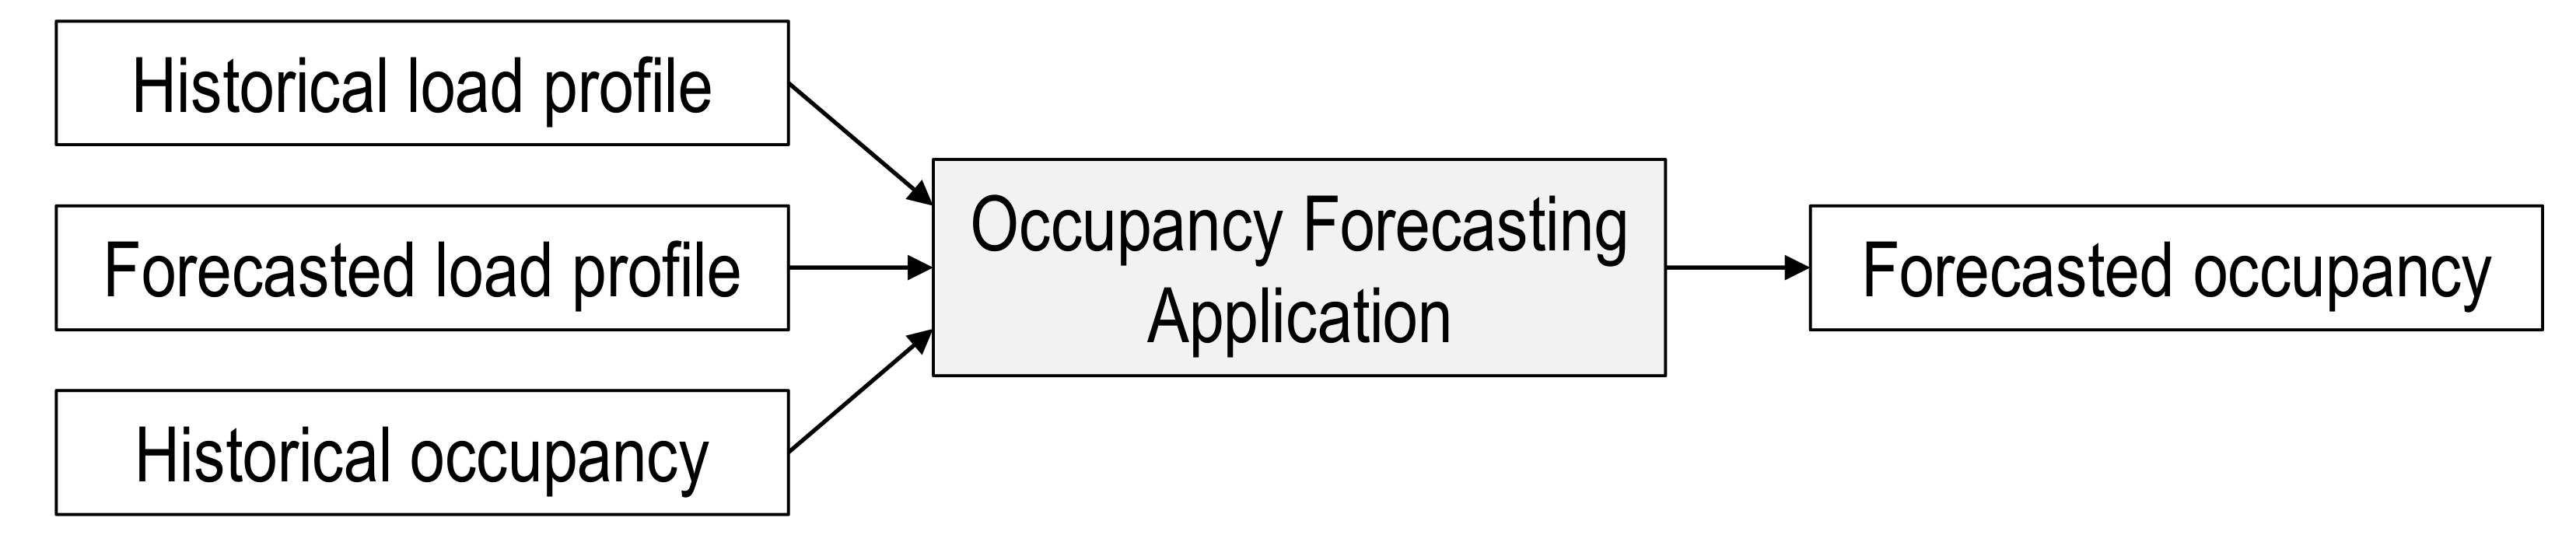
41]. The general algorithm is fully unsupervised, and it can be applied to all demonstration sites. In the particular case of the Porto demonstration site, a supervised version of the algorithm can be used instead of an unsupervised one. It takes the advantage of inferring day-ahead occupancy from electrical consumption data and historical occupancy information available in Porto. In both cases, the output of the algorithm is similar: binary vector of occupancy, indicating presence or absence, with a defined time resolution.
Figure 18 describes the supervised occupancy forecasting algorithm. The necessary input information contains both historical and forecasted data streams. In order to enable the algorithm’s learning, historical load profile and occupancy patterns need to be collected. The prior constitutes low-frequency electrical consumption measurements, which can be obtained from a conventional smart meter. The latter is represented by clock point occupancy recorded at building entrances. The forecasted load profile is constructed using the methodology described in
Section 6.1.
The main process steps include preprocessing and modelling. First, the initial data are loaded. To improve its quality, any erroneous measurements are removed and missing values are imputed. Second, the raw data are transformed into meaningful data sets using feature extraction. In this work, the novel method of extensive feature engineering is proposed. Over 60 manually designed features are segmented into three main categories: statistical features, load curve shape features, and time-related features. Third, feature scaling and standardisation are applied to avoid uneven influence of magnitudes on the algorithm’s learning. The last step before modelling includes feature selection based on principal component analysis and recursive feature elimination combination, as not all the features contribute equally to occupancy inference. In the modelling phase, the support vector machine is deployed to produce day-ahead occupancy forecasts.
Figure 19 depicts the block scheme of the unsupervised occupancy forecasting algorithm. The method relies on ambient environment data to estimate occupancy. Such data include measurements of relative humidity, indoor temperature, CO
2 concentration, and luminosity and can be obtained using the multisensor solution developed in
Section 3.3.
The algorithm works by executing two parts sequentially. First, the occupancy is detected from historical ambient environment measurements using unsupervised machine learning techniques: K-means clustering and majority voting. Second, powerful time series forecasting models are deployed to produce day-ahead occupancy from occupancy detected in the historical period. Examples of such models include long short-term memory neural network and Prophet [
42]. Additional regressors such as day of the week, time of day, and national holidays can be applied to improve the forecasting accuracy.
For both algorithms, the output data can be represented as the binary occupancy vector with 15-min resolution. Therefore, the day-ahead forecast consists of 96 values, where 1 indicates presence and 0 indicates absence. In case a higher level of detail is required, the same algorithms can be utilized to produce forecasts related to the number of people or the occupation level in a particular space, ranging from low to high. Both supervised and unsupervised occupancy forecasting algorithms were extensively tested on the dataset collected from the Porto demonstration site and showed the highest prediction accuracies of 98.3% and 97.6%, respectively [
41].
6.4. Behavior Predictor
The behavior predictor resorts to machine learning techniques and serves the purpose of identifying opportunities for lowering electricity consumption, departing from the overarching objectives of feedback, that is, more than the act of saving energy, the main goal is inducing behavioral change that will save energy. In a resumed way, the output of the behavior predictor is a set of alert messages that users receive in the mobile app (
Section 5) that coincide with periods of time where consumption is forecasted as “excessive”, although not intended to interfere with the users’ comfort levels.
The objectives of the behavior predictor are threefold:
Identify opportunities for behavioral change to be sent to users in the form of smartphone alerts;
Predict the impact of such alerts, regarding energy savings;
Keep track of the evolution of behavior reactions to the sent messages.
The behavior predictor is in fact constituted by 5 predictors, each addressing different issues (see
Table 6 for more details) and is intended to be applied for each team according to specifications of
Section 4. As a result, there are 75 models for behavior prediction at the INESC TEC building in Porto (5 models × 15 teams = 75 models).
In
Figure 20, an overview of the behavior predictor is presented. In terms of time, there are three execution phases: day-ahead, when predictions are made and opportunities identified; real-time, when messages are sent; and day-after, when the impact of the messages is evaluated.
Each of the building blocks in
Figure 20 is now briefly described.
Day-ahead stage: this code is run daily at midnight;
Load Forecast: values of energy for the model under assessment (either plugs, lights, or HVAC)—see
Section 6.1 for more details;
Occupancy forecast: binary information concerning the occupancy of the room—see
Section 6.3 for more details;
Opportunities Forecast: this is the core of the behavior predictor, which identifies the opportunities for energy saving. It should be noted that the process for training the decision trees is fully automated. More info on this topic is given below;
Forecast impact of opportunities: takes the historical reaction to stimuli and calculates the predicted impact. This refers to savings in percentage and is calculated as a weighted average using the following rule: 50% for the average of all previous reactions to the previous + 50% of the reaction to the last message. More info on this topic is given below in the day-after stage;
Message selection: to avoid sending too many messages to the app users, this module takes the many opportunities identified by the behavior predictor to select only one of them to be sent. Typically, messages that have the highest potential for savings are selected; however, to avoid having the user receiving always the same kind of alert, the ones that are never or rarely selected are occacionally chosen to induce some variety;
Real-time Stage: this code is run every hour and checks whether there is an alert for any room.
Outdoors temperature in real time: self-explanatory
Room occupancy: inferring data from the multisensor; this step performs verification of the actual room occupancy (see
Section 3.3).
Send: the message is sent if the conditions presented in the
Table 1 are met.
Gamification Platform: in this block, communication between the behavior predictor and the gamification platform is performed via a database using MySQL language.
Day-after stage: This code runs at the same time as the day-ahead stage.
Assess the impact of the previous-day message: this impact is returned in percentage, taking it as a ratio between the verified load and forecasted load. If the actual load is higher than the forecasted load, the values are disregarded because that would mean negative savings.
The behavior predictor communicates with the gamification platform the impact of the message so that the behavior is transformed into bonuses for the user (see
Section 5).
Here, further details regarding the machine learning models are provided. It should be noted that they can be trained online, i.e., the models are trained as many times as intended with the most recent data, in opposition to offline training in which the models are only trained once. The chosen machine learning methodology was decision trees because this is a binary classification problem and decision tree outputs are easy to interpret (a phenomenon known as white box). Decision tree classifiers have been applied for diverse domains such as intrusion detection, energy modelling for buildings, generating catalogs in e-commerce, image processing, diagnosis in medicine, fault detection in quality control, detecting lane boundaries in intelligent vehicles, and pattern recognition in remote sensing [
43]. The implementation was done in Python using scikit-learn [
25]. The methodology followed is found in [
44]. Essentially, to create these models, it is necessary to access stored metered data (see
Section 3.2) and to rely on multisensor (
Section 3.3) data to obtain the load and occupancy ground truth. A second step is to detect outliers in these measurements and to remove them from training. The third step is to define what constitutes an opportunity, and here, we relied on statistical measures (e.g., we assume thresholds based on quartiles of historic consumption data). The training is done using a train–test split of 70%–30%, using cross-validation of 10, and the parameters of the tree classifier are estimated resorting to grid search. Scoring is done using “recall” as a metric because the goal is to identify as many true positives as possible.
Implementation of the code is done using Python 3. The computation time for each team in the competition is in the order of 20 s for the day-ahead code and 0.02 s for the real-time code, when running on a Intel x64 Core i7-2600 CPU @ 3.40 GHz with 8 GB of RAM.
6.5. Automation Manager
The automation manager application aims to produce optimized schedules to operate controllable loads. Heating, ventilation, and air conditioning (HVAC) is chosen as the target load to employ optimization techniques. The underlying reason for this choice is that HVAC is the largest energy consumer in both residential and tertiary buildings [
45]. Therefore, applying intelligent control to manipulate the HVAC load can provide substantial potential energy savings. For more details, on the state-of-the-art and various HVAC-control methods existing in the literature, an interested reader is referred to the review works of [
46,
47]. The goal of the current application is to produce the most energy-efficient day-ahead schedules without compromising the users’ comfort. The optimization process focuses on generating optimal timetables for heating and cooling systems, respectively. Once computed, these timetables are supplied to building managers and household owners for verification and deployment. If the building has direct automated control of loads, the manager can apply schedules to the equipment through computer interfaces. Otherwise, the produced optimal schedules become operational guidelines for dedicated personnel to manually switch on and off the systems at the required time.
Figure 21 represents the input and output data streams of the automation manager algorithm, which is detailed in [
41]. There are four main types of incoming information required to produce HVAC schedules. First, the building metadata need to be collected. It includes the building’s surface, preferred cooling and heating set-points, and heat transfer coefficients. The latter are often absent from the building’s envelope. Therefore, additional methods to infer those coefficients responsible for thermal losses and thermal gains must be applied. Second, the weather data are recorded, namely the outdoor temperature and solar radiation. As those parameters are collected hourly, this defines the time resolution of the algorithm. Third, occupancy information is considered for two reasons. On the one hand, it allows us to estimate heat gains from people and to calculate the building’s thermal load in a more precise manner. On the other hand, knowing when occupants are present in a specific space provides an opportunity to provide heating or cooling only where it is necessary. Avoiding using HVAC in unoccupied areas becomes the main contribution to potential energy savings. Fourth, the algorithm takes the HVAC demand of the building into account. It helps to provide the baseline for building’s operation and can be useful to infer thermal coefficients if those are absent.
The algorithm at the core of the automation manager application functions according to the set of predefined rules. These rules can be described as the following:
If the building’s thermal load is positive, the heating should be turned on. If it is negative, cooling is on.
On and off switching is organized according to the set-point temperatures. If the outdoor temperature is lower or equal to the heating set-point, the heating is on. If it is higher or equal to the cooling set-point, cooling is on.
If there is at least one occupant present in a space, heating or cooling might be turned on. If the space is empty, both systems are turned off to avoid energy waste.
No simultaneous operation of heating and cooling systems is allowed. This rule means that the space cannot be cooled down and heated at the same time, as it does not make sense from a thermodynamics point of view.
Outdoor temperature evolution should be taken into account. If its fluctuations are short-term and are not significant in their order of magnitude, no intermediary on/off switch should be realized. Instead, the guidelines should be kept similar to the ones in the previous time window. This rule helps prevent irrelevant alternations between heating and cooling systems and their states. Additionally, it allows us to extend the lifetime of the equipment and to avoid unnecessary maintenance.
The proposed HVAC automation algorithm demonstrated 15.4% of potential energy savings on the test dataset collected from the Porto demonstration site [
41]. Further extensions to the algorithm should consider the HVAC system ramp-up times by introducing preheating and precooling periods. The length of such periods can be determined dynamically by taking into account the initial indoor temperature conditions and anticipated occupancy at the workspace. Realizing such an extension reduces the thermal discomfort of occupants to a minimum. Another option for improvement is to increase the time resolution of the algorithm. It allows us to consider more frequent changes in the occupancy status and environmental conditions of space. Therefore, the energy management strategy for controllable loads can become even more efficient and can potentially produce higher energy savings.
6.6. Energy Manager
The energy manager application is a display used for the Facility Managers (FM) and the Game Master (GM) as a support decision tool. The app objective is to display short messages generated in the FEEdBACk back-end modules that help the FMs and GMs understand what happens in the facility and to the teams.
These short messages can be related to long- or short-term actions depending on the action urgency or implementation complexity. Short-term scope messages (from now on, notifications) are generated in the gamification platform, while long-term scope (from now on, recommendations) are generated in the recommendations engine.
The information required from both the gamification platform and energy manager engine to generate the messages comes from the monitoring platform database, which is filled with FEEdBACk project apps and metering devices data. The interaction complexity is quite high in terms of data sharing. However, in the simplified chart presented in
Figure 22, the interconnection can be observed.
The energy manager app solution was designed to cover two real needs observed during the project definition: (a) the energy savings not related to human behavior and (b) the energy savings not achievable due to the incapacity to perform an action by the end-users.
To cover the first need, we give the FM suggestions on how energy can be saved according to changes in the facility. The idea was to run historic information into algorithms to decide which changes are more suitable for solving recurrent issues. The problems could also be related to air quality. The expected outputs are messages that match the facility’s needs and come from a backlog list that include valuable information, such as expected savings ratios.
The second problem is related to the end-users capability to perform energy-saving actions; it often happens that some actions related to energy consumption cannot be carried out by the end-users. For instance, HVAC settings in most Barcelona pilot buildings are only controllable by the FM. As the mobile app user targets are common employees, the energy manager app is used as a display to inform the FM when actions are not assigned to any of the end-user groups.
7. Conclusions and Future Work
The FEEdBACk project proposed a framework that promotes, stimulates, and delivers energy efficiency through behavioral change. To encourage more efficient energy utilization and more responsible consumer behavior, a gamification platform was developed to motivate behavioral change by fostering awareness and consumer engagement through a pervasive application that analyses context, sends personalized messages, and manages gamified peer competition and feedback.
The FEEdBACk solution was planned for implementation at three demonstration sites, in Porto (Portugal), Barcelona (Spain), and Lippe (Germany). A competition was envisioned for exploiting the gamification platform in these sites, but due to the COVID-19 pandemic, office buildings were left empty and the competition was never fully implemented. Therefore, the platform was not fully implemented and, for this reason, there are no results available yet to validate the value proposition of the project. Even so, several simulations were run using pre-COVID-19 historical data to validate the developed applications and hardware, which prove the value of the work developed.
The project yielded a diverse set of relevant outputs:
A set of state-of-the-art algorithms fully integrated and prepared to run in real-time that allows for forecasting energy consumption, PV production, buildings occupancy, energy baselines, and building users’ behavior.
A low-cost multisensor for temperature, humidity, luminosity, and CO2 concentration levels that revealed a good performance working in a standalone mode (wireless and with a built-in battery) and conveying measurements in real-time to a database from the project.
Innovative social sciences techniques integrated into computational applications for users segmentation, which resulted in 6 distinct user profiles that were extensively described, allowing for better adjustment of the engagement and gamification activities to the interests of the citizens.
An eclectic ICT platform capable of collecting, treating, storing, and displaying to the user all the relevant data with the overarching goal of increasing energy efficiency. The high flexibility of the ICT platform enables its straightforward implementation in a variety of contexts, whether they are different types of buildings (residential, office, or public buildings), different countries (a multi-language feature was implemented), or even buildings with different sensing levels (only one sensor and one meter are required per team).
A mobile application for iOS and Android that serves as a front-end for the ICT platform and that enables interaction with the users. It incorporates a diversified set of multimedia content, games, quizzes, and informative charts in a peer competition environment, with the aim of raising engagement and awareness and of promoting behavioral change that is sustained with time.
The high flexibility of the ICT platform and all the attached components facilitates the scalability and replicability of the project outputs and their exploitation in the future by different stakeholders, such as the following:
Building owners, who can use the platform to minimize energy cost by increasing energy efficiency and by reducing overall consumption.
Energy services companies, who may install meters and sensors and use the platform also to increase energy efficiency and to reduce overall consumption.
Aggregators/Retailers, who can use the platform to adjust energy consumption to market prices.
Electricity network operators, who can use the platform to change electricity consumption profiles and adjust it to the electricity grid needs.
As future work, the consortium intends to exploit the full FEEdBACk platform in a real-world environment to collect enough data to validate both the individual applications and the fully integrated solution. Additionally, a set of papers are being prepared, which will exploit the results obtained in the most promising and innovative apps developed in the project, such as occupancy forecasting and the behavior predictor.


 ,
, 


