Article

Analysis of Reasons for Reduced Strength of Multiply Conveyor Belt Splices

Faculty of Geoengineering, Mining and Geology, Wroclaw University of Science and Technology, Na Grobli 15 St., 50-421 Wrocław, Poland
*
Author to whom correspondence should be addressed.
Energies 2021, 14(5), 1512; https://doi.org/10.3390/en14051512
Submission received: 14 February 2021 / Revised: 5 March 2021 / Accepted: 7 March 2021 / Published: 9 March 2021
(This article belongs to the Special Issue Mining Technologies Innovative Development)

Abstract

:
Belt conveyors are used for the transportation of bulk materials in a number of different branches of industry, especially in mining and power industries or in shipping ports. The main component of a belt conveyor is its belt, which serves both as a support for the transported material along the conveyor route and as an element in the drive transmission system. Being crucial to the effective and reliable operation of the conveyor, the belt is also its most expensive and the least durable element. A conveyor belt comprises a core, covers and edges. A multiply textile belt, in which the core is constructed of synthetic fibers such as polyamide, polyester or aramid, is the oldest and still the most commonly used conveyor belt type. The plies are joined with a thin layer of rubber or another material (usually the material is the same as the material used in the covers), which provides the required delamination strength to the belt and allows the plies to move relative to each other as the belt is bent. Belts are installed on the conveyors in a closed loop in order to join belt sections, whose number and length depend on the length and type of the belt conveyor. Belts are joined with each other in a splicing procedure. The cutting of the belt core causes belt splices to be prone to concentrated stresses. The discontinued core also causes the belt to be the weakest element in a conveyor belt loop. The article presents the results of strength parameter tests that were performed on laboratory and industrial splices and indicated the reasons for the reduced strength of conveyor belt splices. Splice strength is reduced mainly due to incorrect preparation of the spliced surfaces and to different mechanical parameters of the spliced belts.

1. Introduction

Transportation systems consisting of belt conveyors are considered to be the most efficient and effective solution for transporting large amounts of bulk materials [1]. The most expensive and the least durable element of a belt conveyor is its conveyor belt, as it directly contacts the transported material and is therefore prone to such damage as punctures, longitudinal cuts and tears. It serves to support and move the transported material along the conveyor [2,3]. In actual operating conditions, the conveyor belt suffers from impacts caused by the transported material. These impacts are observed in locations where the transported material is fed to the conveyor, frequently leading to belt damage. In many cases, the belt is damaged beyond further use [4]. Such damage causes the entrepreneur to suffer financial losses due to the need to replace the damaged belt section and, as a result, to also make new splices.
Another function of the belt is to transfer longitudinal forces required to overcome resistance to motion. The belt comprises a core, which is expected to transfer loads. The core is protected by covers and edges.
Multiply textile belts are the oldest type of conveyor belts, and they are still commonly used. This type of belt was patented by Thomas Robinson and first used in 1891 in a magnetite mine in New Jersey, USA. Textile cores in multiply belts are presently most typically manufactured of 100% synthetic fibers, such as polyamide, polyester or aramid. The textile plies in the core are spliced with a thin layer of rubber or another material (usually the material is the same as the material used in the covers), which provides the required delamination strength to the belt and allows the plies to move relative to each other as the belt is bent on the drive, tail and take-up pulleys [5,6,7,8]. This type of conveyor belt is most widely employed in underground mines, power plants, cement plants, harbors, etc., as well as in other locations where materials are transported with the use of the belt. conveyors. The splice in such type of a belt is a layer-based structure with a complex distribution of stresses due to disturbed belt structure, which results from discontinuing the textile plies in the belt core. Splices, which allow shorter belt sections to be joined into a loop having a length corresponding to the length of the conveyor, are an underestimated element of the belt conveyor [9,10,11].
In underground bituminous coal mines, the length of belt sections is limited by the size of the excavations and of the transport shaft. A belt on a reel has a certain volume, and therefore, in underground mines, belts are typically transported to the installation location in sections no longer than 150 m. This is not a problem in surface mines. Belts used in such mines are transported on special double reels that allow the transportation of continuous belt sections with no splices and lengths reaching 700 m. The weight and size of the reels with belt sections of such lengths cause problems when the belt is transported on public roads from the manufacturer to the place of installation. These problems are worth overcoming, however, as the belt loop has very few splices.
Efforts towards installing belt sections of lengths reaching technical limits make splices the weakest link in the belt loop [12]. The smaller their number, the greater the reliability of the entire loop. From the perspective of its reliability, a conveyor belt loop is a system of spliced belt sections arranged in series, and the strength of splices installed in belts operated in mines rarely reaches the full strength of a new belt. Splices are thus areas most prone to developing discontinuities in the belt loop. In order to avoid splice breaks, a number of different splice monitoring methods are implemented. Splices are monitored on occasions when belt loop inspections are performed (for both the sections and the splices) by the maintenance crew or with the help of computer-aided digital image analysis [13,14,15]. Another implemented solution involves measuring changes in the lengths of distances between special magnets installed in the belt [16]. Research has also been performed into automatic splice inspections in magnetic systems [15].
Splice strength is affected by a number of factors [17,18]. The most important of these factors include the splicing method and the choice of splicing materials. The above have a decisive influence on splice fatigue life. Another important factor is the quality of the installed splice, which depends on the proper geometry of splices [19,20,21], which should be adjusted to the belt’s design and operating conditions, as well as on observing best practices in the field of splicing technology. The pressure to reduce conveyor downtime (i.e., to avoid production-related losses) and harsh conditions in underground mines has a negative influence on the static and dynamic strength of splices. The above fact has been confirmed in numerous tests performed by Laboratorium Transportu Tasmowego (Belt Conveying Laboratory, further: LTT) as part of research works and expert opinions requested by conveyor belt producers and users. Such research has been continued for over 25 years [22,23,24], and during that time more than 300 belt splices were tested for numerous companies from Poland and abroad. The results of this research became an impulse for more detailed works regarding the values and distributions of stresses in splice bonds [25]. This research project resulted in improved reliability of cold-vulcanized splices, their increased service life, and a lower cost of their installation. These effects were obtained by identifying the properties of the conveyor belts and of the splicing materials which have a significant influence on the stress values in the adhesive bonds and thus on splice service life.
Based on research performed for the mining industry, reduced splice strength was identified to result from defective splicing procedures and materials. Figure 1 shows the percentage shares for the reasons behind the lowered strength of splices in multiply conveyor belts.
Although 27.6% of splices were found not to show any faults regarding the installation technique, they did show lowered strength. An additional 13.1% of splices demonstrated lowered strength as a result of attempts to splice belts having different strength properties. Splice strength decrease caused by inappropriate belt selection is a significant problem to be avoided. While the selection of materials appropriate for a particular type of belt seems a relatively easy task in light of the research results available in the field, the selection of appropriate belts is practically beyond the capacity of the splicing specialist. The belts to be spliced are selected by splicing companies only on the basis of the belt width, its nominal tensile strength and the number of plies in the core. It is typically impossible to select belts that would be produced by the same manufacturer and thus be made of identical materials. As conveyor belt manufacturers use various materials (e.g., various textile plies), some strength parameters of conveyor belts having an identical nominal strength and the number of plies may significantly differ. The results of tests performed in companies that employ belt conveyors to transport bulk materials demonstrate that these differences lead to reduced belt loop strength in the location of the splice.
The strength of a single conveyor belt splice determines the strength of the entire belt loop installed on the conveyor [26], and therefore splicing technology is an issue of key importance. Tests of splices for industrial applications performed by LTT demonstrate clearly that improper technology used in preparing textile plies for splicing may be a reason behind splice strength reductions by as much as several tens of percent. The results of laboratory tests presented in this article indicate the causes of this type of fault.
The article presents the results of laboratory tests into the strength parameters of splices in multiply conveyor belts with various strength characteristics. The presented test results also include the results for splices installed on belts damaged due to improper pre-splicing preparation of the surfaces of textile plies. The analysis of the results leaves no doubt that the two factors have a negative influence on splice strength by lowering splice quality.

2. Theoretical Background

The measurement of splice breaking force allows the identification of belt strength loss due to the introduction of a splice, for example during its installation on the belt conveyor. This simple test provides information of key importance for the belt user. It also demonstrates that splices in multiply textile belts are still a major limitation to taking full advantage of the belt strength. Lowered splice strength is primarily caused by a number of mistakes made during the splicing procedure (Figure 1). Another reason may lie in an inappropriate selection of the spliced belts, i.e., in splicing belt sections that have different mechanical properties. These mistakes can be eliminated from the splicing procedure by increasing the quality-related demands placed on the splicing technicians. Avoiding splice strength reductions due to improperly selected belts appears to be a greater challenge. Belts offered by manufacturers using different materials and production technologies may show significantly different properties even if they are selected on the basis of identical nameplate tensile strengths and number of plies in the core. This is the object of the theoretical considerations presented below and confirmed further in this article with the results of laboratory tests.

2.1. The Mathematical Model

The mathematical modeling of splices in multiply conveyor belts was an issue addressed inter alia in [27,28]. In view of the above publications, the influence of various mechanical properties of splices on the stress distribution observed in the splice was analyzed for a conveyor belt model based on the following assumptions:
  • the textile plies in the belt core are considered to be elastic elements subject to Hooke’s law,
  • due to the low elastic modulus value of rubber, which is incomparably smaller than in the case of the plies, normal stresses in the layers of rubber between the plies and in the belt covers were ignored,
  • the stresses in the textile plies are balanced in the belt cross-section, which is located at a finite distance from the failure location,
  • in the area where load disturbances are observed, the layer between the plies is subject to non-dilatational strains,
  • the rubber between the plies is treated as a linear elastic body subject to Hooke’s law.
Further assumptions included:
  • the values of longitudinal elasticity moduli for textile plies in the spliced belts are different,
  • the differences in elasticity moduli values between individual plies of the same belt are negligibly small in comparison to the difference between the spliced belts,
  • when tensioning the undamaged belt core, strain in individual plies is equal.
With the above assumptions, the stresses which occur in textile plies of a belt core, in any longitudinal cross-section of the belt, are shown in Figure 2.
Considering the balance conditions of forces acting on the elements of individual plies in the cross-section of the belt element with a length “dx” leads to the following balance equations:
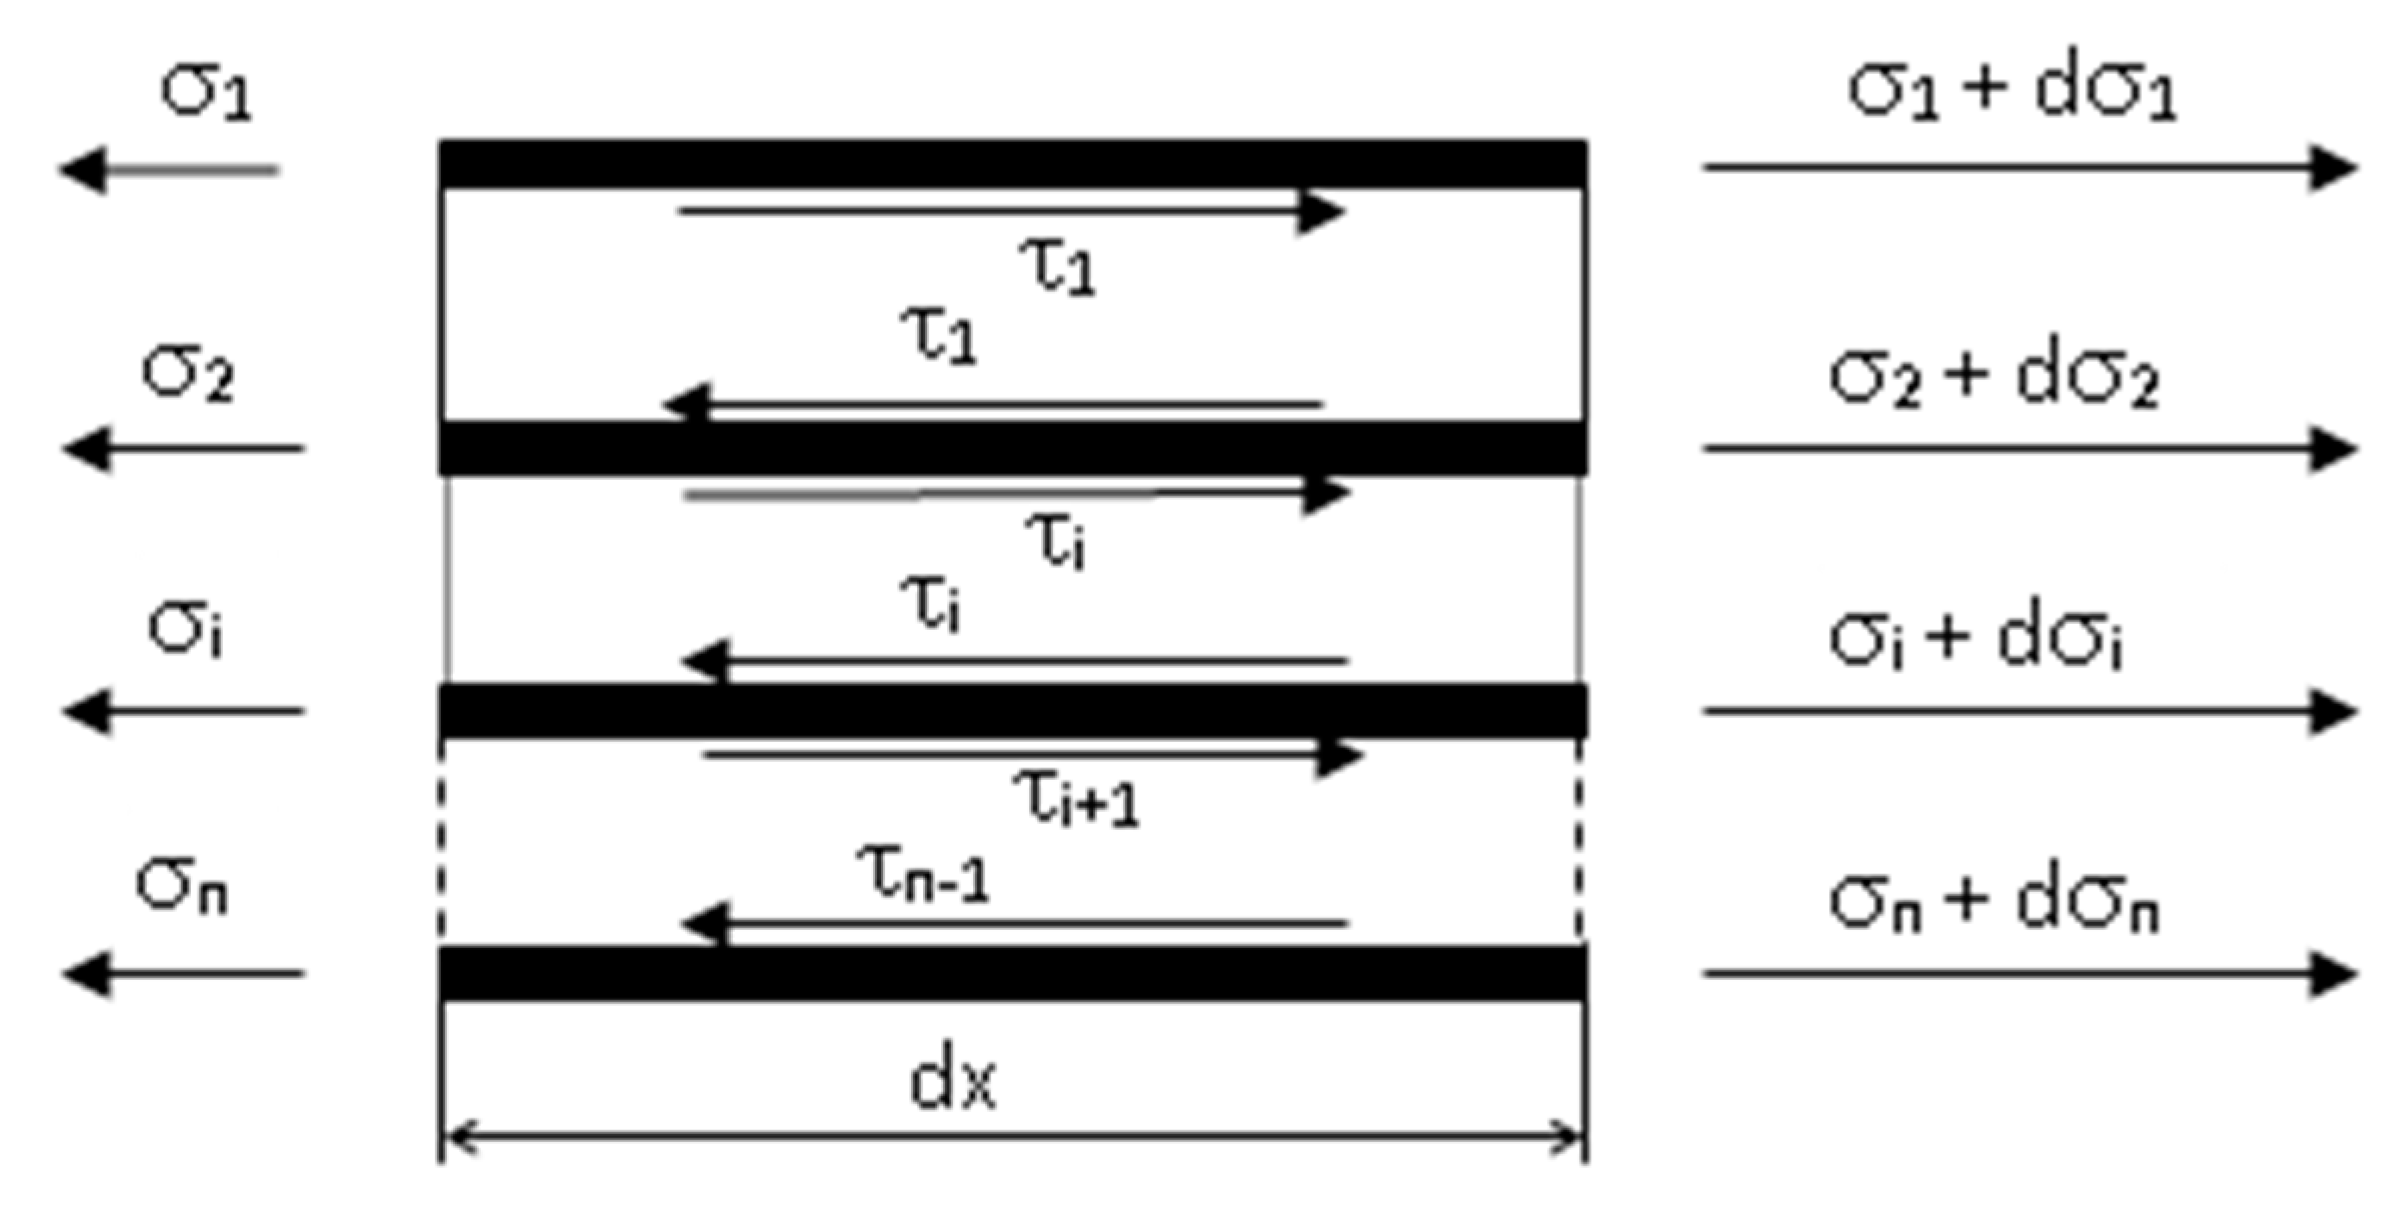
  • the case for an ith ply, where 1 ≤ i < n, and n is the number of plies in the belt, is described by Equation (1),
    σ i + τ i d x = τ ( i 1 ) d x + σ i + d σ i
  • the case for an nth ply is described by Equation (2),
    σ n = τ ( n 1 ) d x + σ n + d σ n
The plies adjacent to each other in the cross-section of the belt core are joined with a layer of inter-ply rubber (or a layer of adhesive rubber). Consideration for the relationship between the extent of deformation in the layer of inter-ply rubber and the shear stresses acting on this layer, represented in Equation (3),
τ i = G d Δ U
allows the formulation of differential Equations (4)–(6), which describe the stresses in individual plies:
  • for the first ply (i = 1),
    d 2 σ 1 d x 2 = G d [ 1 E 2 σ 2 1 E 1 σ 1 ]
  • for plies from the second one (i = 2) to the penultimate one (i = n − 1),
    d 2 σ i d x 2 = G d [ 1 E ( i + 1 ) σ ( i + 1 ) 2 E i σ i + 1 E ( i 1 ) σ ( i 1 ) ]
  • for the last, external ply in the cross-section (i = n),
    d 2 σ n d x 2 = G d [ 1 E ( n 1 ) σ ( n 1 ) 1 E n σ n ]
The symbol G used in Equation (3) is the transverse elasticity modulus of the inter-ply rubber, d is the thickness of the inter-ply rubber and ΔU is the displacement of the adjacent plies. The symbol Ei used in the differential equations is the elasticity modulus of the ith ply.
The above relationships form a system of “n” differential equations (where “n” is the number of plies in the belt) describing the stresses in the plies of a belt subjected to uniaxial tension. Moreover, the balance Equation (7) holds for any transverse cross-section of the belt and replaces any of the above equations:
i = 1 n σ i = c o n s t
In Equation (7), σi is the stress in the ith ply, and n represents the number of plies in the belt.
With identical strain in the plies outside the zone affected by the cut, the values of stresses in these plies depends on the elastic modulus values in individual plies and is described by Equation (8), in which σT is the stress in the conveyor belt:
σ i = σ T E i i = 1 n E i
The above mathematical model of a splice in a multiply belt is a system of “n” second-order ordinary differential equations, in which “n” is the number of plies in the conveyor belt. This allows analyses of stress distributions in the spliced area of a multiply conveyor belt, in which individual plies were discontinued at the contact points of individual steps. The assumed boundary conditions for the solution are defined by the characteristic geometrical and material parameters of the splice, such as the location of the failure in the cross-section of the core, the length of the step or the mechanical properties of the belt and of the joining materials. The application of this model in the calculations of stress distributions in the splice requires an instantiation of the number of equations, the values of the required parameters and the initial conditions. The calculations consist in numerically solving a system of differential equations by substituting the derivatives with differential quotients and by solving the resulting system of linear algebraic equations.

2.2. Calculation Results

The stress distributions in the spliced area of a four-ply belt were calculated for the following cases:
  • the mechanical properties of the splices in the belts were uniform,
  • the mechanical properties of the splices in the belts were not uniform.
A series of calculations was performed for various assumed difference values of longitudinal elasticity moduli for the plies of the spliced belts. Due to the splice symmetry, the calculations needed to be performed only for two cases of the failure location in the cross-section of the core: when the cut is made in the external ply (the beginning of the first and the end of the second step), and when the cut is made in a ply located directly under the external ply (the contact point between the first and the second step, and between the second and the third step). The results of the calculations are shown in Table 1. The following constant values were assumed in the calculations: E = 2000 kN/m, G = 750 kN/m2, d = 0.001 m.
The theoretically calculated values of maximum stress concentrations in the splices of conveyor belts with plies having different mechanical properties indicate a superposition of the disturbances in load distributions that can be observed in the zone affected by the failure and that result from the location of the damaged splice and from the influence of the discontinued core structure.

3. Materials and Methods

3.1. Problem Formulation

The strength of a splice in a multiply conveyor belt is always smaller than the strength of the belt itself [22]. This fact results from a number of factors, the most important of which include:
  • the number of textile plies in the belt core,
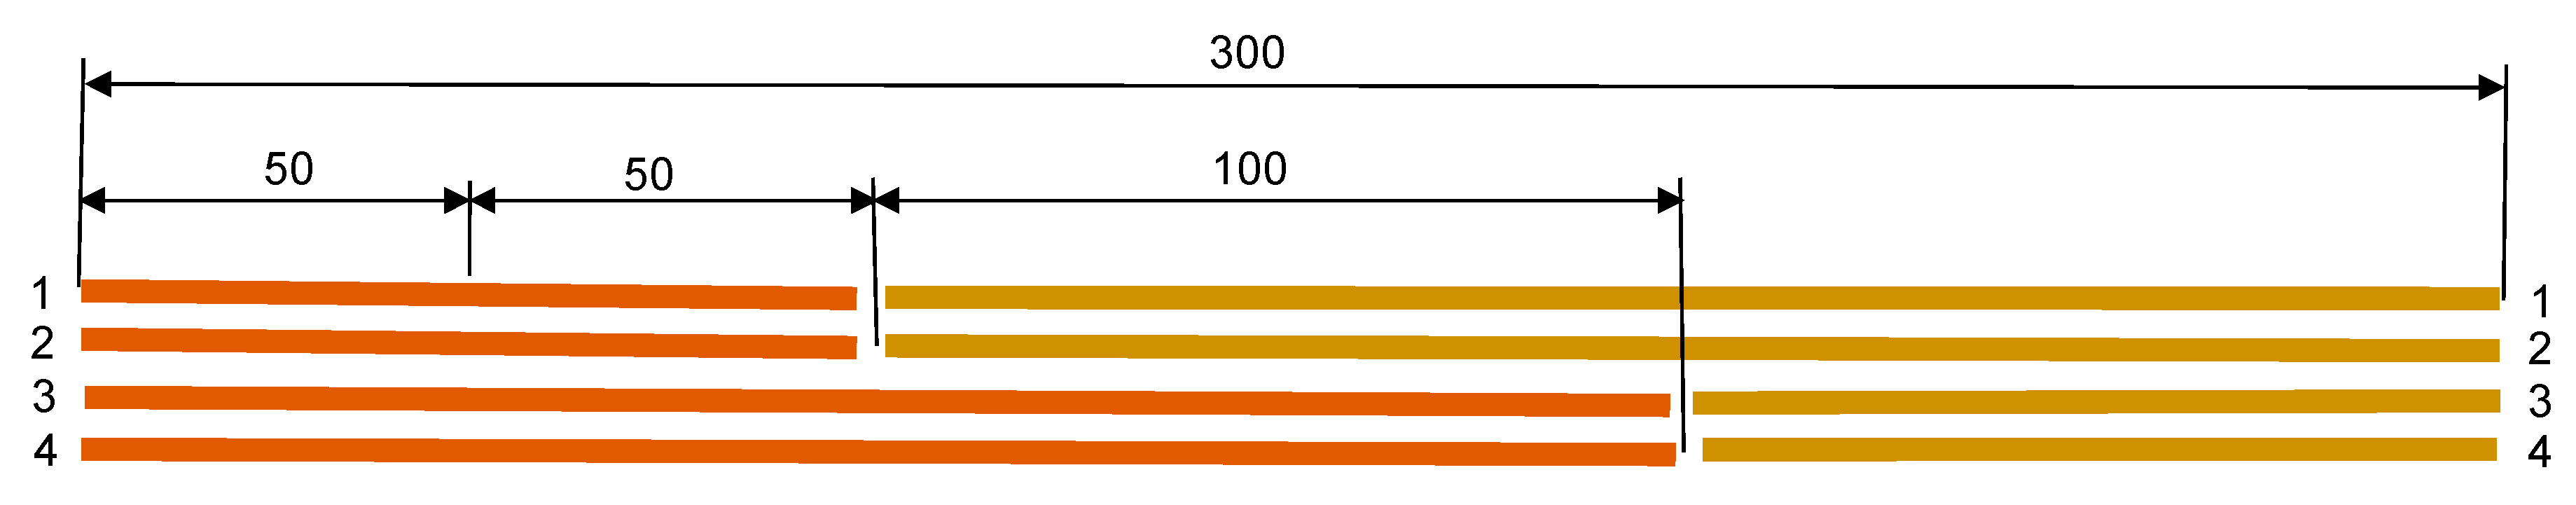
  • the length of the splice step,
  • adhesive properties of the bonding materials,
  • strength properties of the textile plies,
  • strength properties of the rubber between the plies and of the adhesives,
  • the splicing technology.
The design of the splice in a multiply belt necessitates that the cross-section in the splice step contacts will have one ply less than in the spliced belt.
Therefore, the belt strength in those cross-sections is reduced by the value of 1/n, where n is the number of plies in the belt. The reduction of belt strength is thus in reverse proportion to the number of plies. The actual strength loss is even greater as a notch phenomenon occurs due to ply discontinuity in the splice. The loss is further increased by an uneven distribution of shear stresses in the adhesive bond and by stress concentration at splice contact points. Figure 3 shows an example of stress distribution (identified in tests performed at LTT) [25] in the adhesive bond of two splices having an identical nominal strength of 1000 kN/m and an identical number of textile plies. The step length in those splices was 250 mm, and the total splice length was 3 × 250 mm = 750 mm.
The splices differed in the material used for belt plies. The results indicated in orange were obtained from a P-type belt with polyamide core, and the results in black from an EP-type belt with polyamide-polyester core. The highest shear stresses were recorded on the contact points of the outer steps (Lp = 0 and 750 mm). These are several times higher than the stresses recorded on the contact points of the middle steps (Lp = 250 and 500 mm).
Research indicated that the stress concentration factor kτ, see Equation (9), has values between 2.6 and 3.6:
k τ = τ max τ s r
where τmax—maximum shear stress in ply contact points; τsr—mean shear stress in the splice.
Research performed by Hardygóra [29] demonstrated that tensile stresses in belt plies also have an uneven distribution, and the stress concentration factor of tensile stresses in the plies located in the vicinity of ply contact points in splice kσ (see Equation (10)) has values between 1.7 and 1.9:
k σ = σ max σ s r
where σmax—maximum tensile stress in the ply; σsr—mean tensile stress in belt plies outside the splice.
The development of shear and tensile stresses may lead to the destruction of the splice in a multiply belt due to:
  • the coming apart of the plies, if the shear strength of the adhesive bond is exceeded,
  • the breaking of textile plies in the belt core, if their tensile strength is exceeded.
Static tensile strength tests of splices demonstrate that the latter is the most common case of splice destruction. On the other hand, the plies in the splice come apart practically only in the case when the adhesive bond has faults due to mistakes in the performed splicing procedure.

3.2. Conveyor Belt Splice Specimens

The object of the research was splices in multiply conveyor belts with polyamide-polyester (type EP, E—polyester, P—polyamide) or polyamide (type P) textile carcass. The splices were installed with the use of the heat curing method, in which the required adhesion force between the individual elements of the splice was obtained owing to appropriate vulcanization temperature and pressure in the vulcanization press. The splices were built according to the schematic drawing in Figure 4.
The drawing shows a splice installed in a belt with four textile plies in the core. It is a three-step lap-type splice. This means that the number of steps in the splice is smaller by one than the number of plies in the belt core. The splices indicated in Table 2 with numbers 6 and 9 were installed as a strap type. This fact means that unlike in the case of lap-type splices, the number of steps in the latter type of splice is equal to the number of plies in the core.

3.2.1. Laboratory Splices

The test specimens were divided into two groups. The first group contained laboratory splices, prepared at LTT. The splices were used to investigate how ply roughening influences their strength. Prior to splicing, the canvas had to be appropriately and precisely prepared. Ensuring that the fabric is carefully cleaned of residual rubber and that the test results are repeatable required appropriate conditions to be provided. Figure 5 shows the belt fabric prepared for splicing.
In order to identify how different mechanical belt properties influence splice strength, tests were performed also on splices prepared in laboratory conditions.
The tests were performed on four-ply belts with a textile EP core having a nominal tensile strength of 2000 kN/m. The belts were obtained from three different manufacturers. They differed in the material used for belt plies (P or EP). The tested belts had never been used on a conveyor. They were supplied by the manufacturers in 10 m long sections. They were given the following symbols: Belt 1, Belt 2 and Belt 3. Prior to performing the tests, belt parameters were checked for compliance with ISO 14890 [30]. The belts were found to comply with the standard.

3.2.2. Industrial Splices

The second group of test specimens consisted of industrial splices made by conveyor belt operators. The splices had been made in belts operated in underground mines as well as above the ground surface. They had been cut from the belt loop and supplied to LTT in order to test their strength parameters. The specimens included splices installed both in ordinary belts (no. 1, 2 and 4 in Table 1) and in fire-resistant belts, dedicated to working in an environment prone to the risk of gas (methane) or coal dust explosion. These splices are indicated in Table 1 with the symbol GTP (acronym from Polish “Górnicze Taśmy Przenośnikowe”—mining conveyor belts). The belts had different tensile strengths: 630, 1250, 1400, 1800, 2000 and 2500 kN/m. The number of textile plies was between 3 and 5. The differences reflect the fact that the belts represent a wide range of applications.

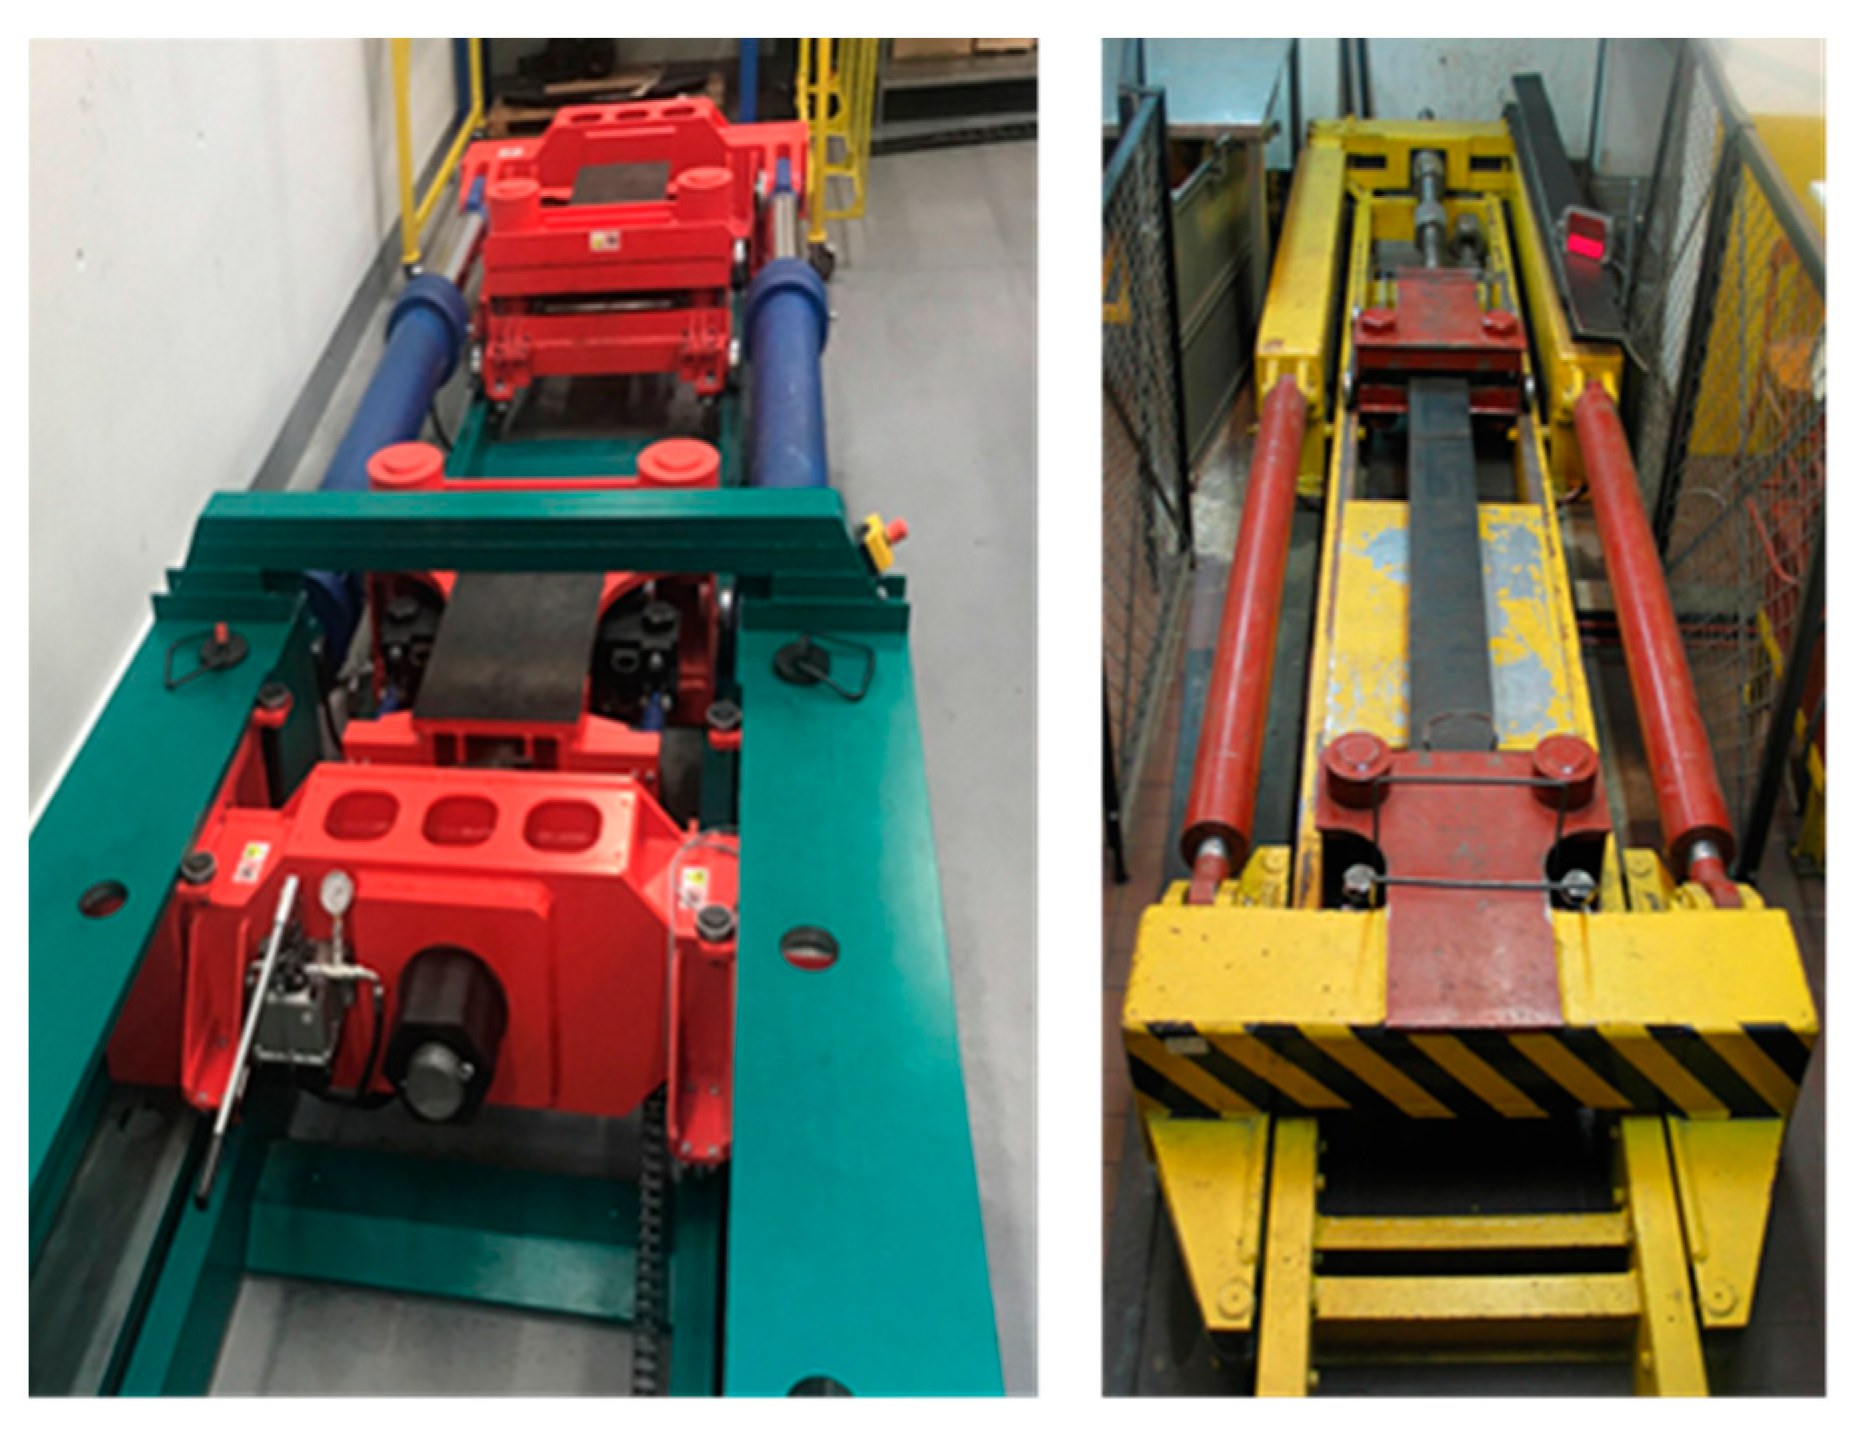
3.3. Methods of Experimental Research—Tests of Conveyor Belts and Their Splices

The described methods here for testing the strength parameters of conveyor belts and their splices are standardized [31,32,33,34]. The standards provide precise instructions on the number and preparation of test specimens, as well as on the test conditions. As a result, different laboratories can perform conveyor belt tests in an identical manner, and the obtained results are comparable.
This article presents the results of tests performed at the Belt Conveying Laboratory, Wroclaw University of Science and Technology (LTT).
LTT has almost thirty years of experience in laboratory tests of conveyor belts, splices, rubber, fabric, rubber compounds and plastics. The laboratory also holds the Research Laboratory Accreditation Certificate No. AB 710 awarded by Polish Center for Accreditation [35].
LTT cooperates with the industry and carries out research and scientific projects for the industry. It also provides consultancy on conveyor belts and their splices at the stages of designing and operating conveyor transportation systems. It offers verifications of the parameters of new conveyor belts (as an independent party) and the monitoring of belt parameter changes during belt operation. The laboratory issues expert opinions on the quality of splices and uses the results of these tests to indicate the reasons for reduced splice strength.

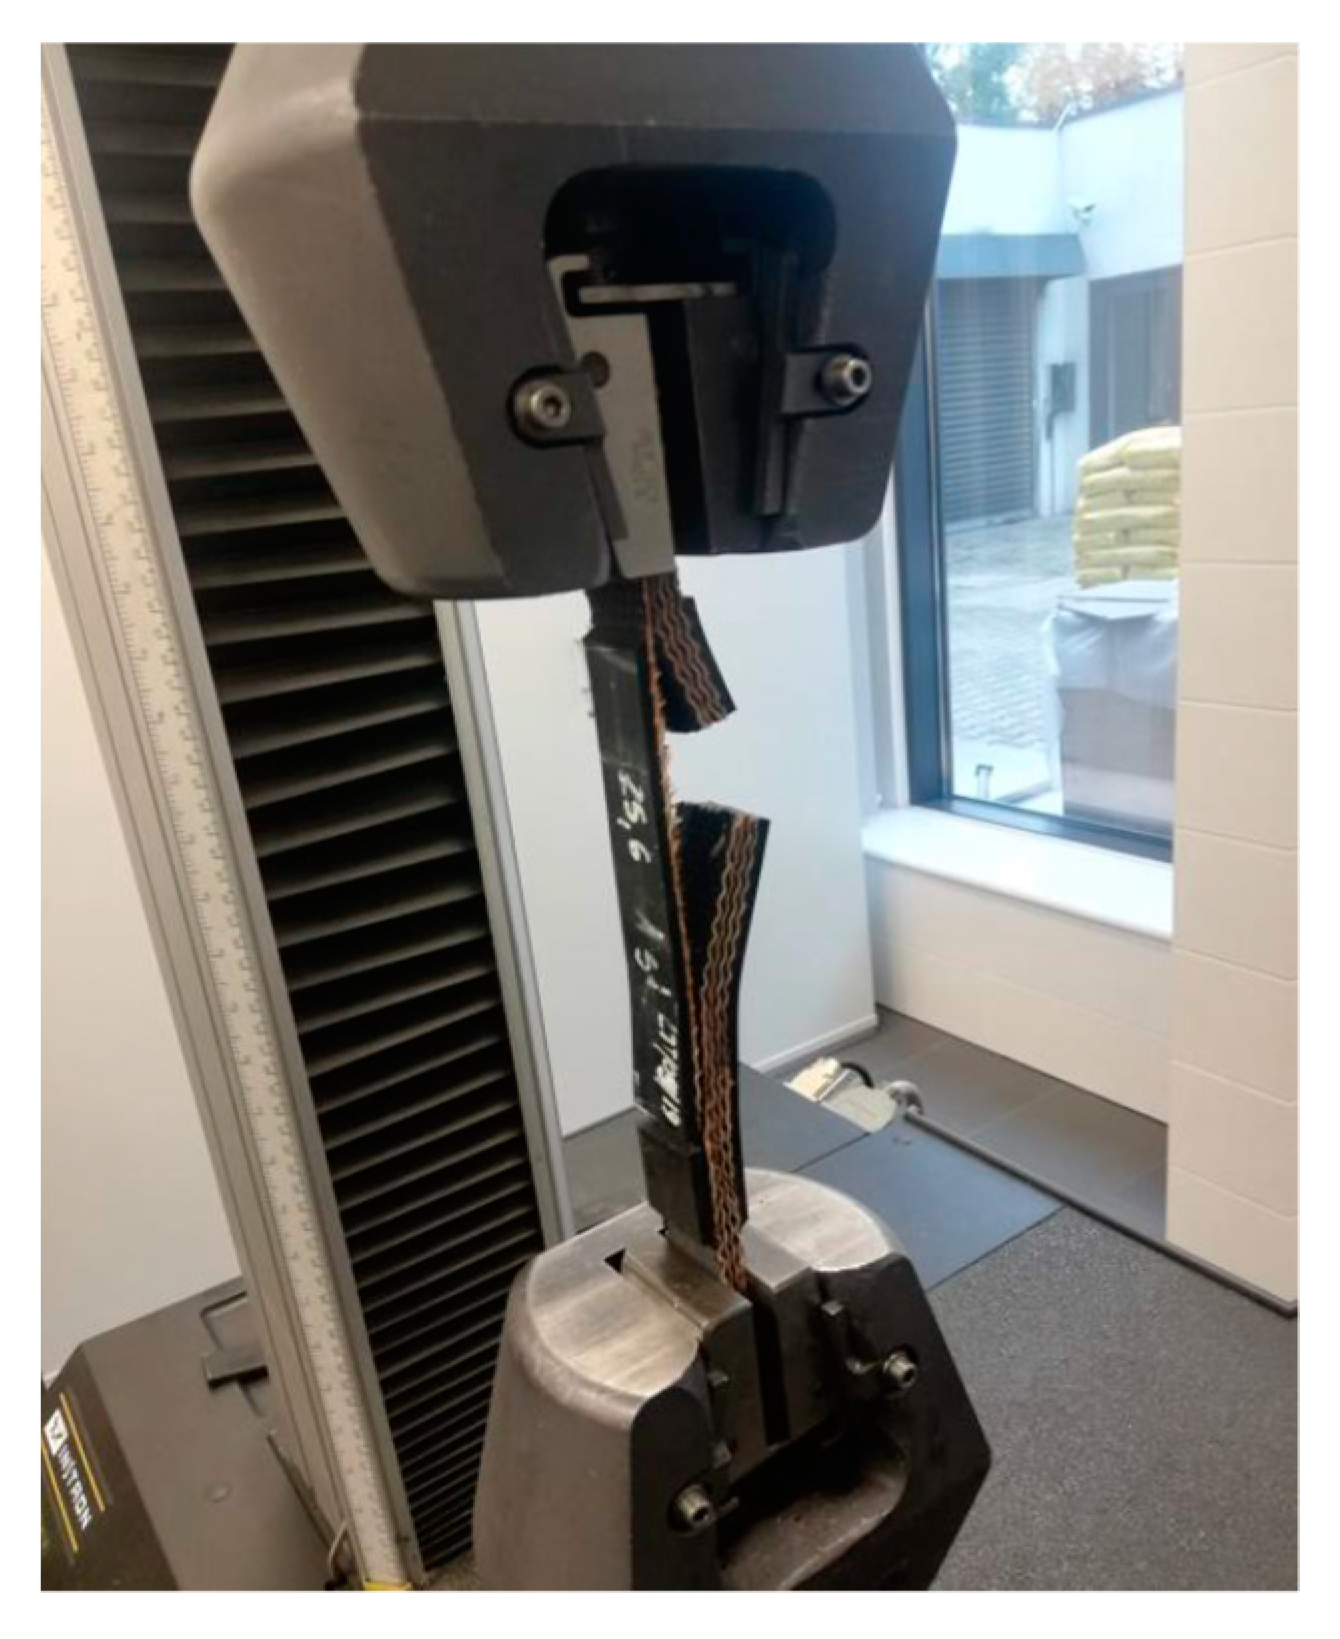
3.3.1. Splice Strength Tests

Splice tensile strength tests were performed according to a test method described in the PN-C-94147 standard [31]. This test method consists of placing a full-length splice in the jaws of the testing machine and in subsequently tensioning it at a constant speed of 100 mm/min until core rupture. During the test, a record is made of both the tensile force and the corresponding splice elongation. The splice specimens were from 200 to 400 mm in width.
Splice strength tests were performed in the two testing machines shown in Figure 6. The machine on the right (yellow color) is type ZP-40, capable of testing splice specimens up to 4000 mm in length and 200 mm in width. The splices may be stretched with a force of up to 400 kN. In order to meet the demands resulting from a trend to increase belt nominal strength, the ZP-40 test rig at LTT has been upgraded. Due to its design limitations, the old rig only allowed testing belt specimens having a nominal strength of up to 3200 kN. Therefore, in 2019, the laboratory was equipped with the ZP-100 splice tensile testing machine (Figure 6 on the right). The new test rig allows tests of belt splices having a nominal strength of up to 7800 kN. The possibility to use a tensile force exceeding 1000 kN enabled tests of splice specimens having a width of up to 500 mm. The ZP-100 machine is currently the only testing machine of this size in Poland to allow strength tests of full-length (8000 mm) splices.
The results of splice strength tests were verified against the required strength defined in relationship (11), as per [31]:
R z = 0.85 R r n 1 n kN / m
where Rr—actual belt tensile strength, kN/m; n—number of plies in the belt core; 0.85—factor allowing for stress concentration at step contact points in areas where the ply is discontinued.
The splice strength is compared to the actual belt strength. If the actual belt strength cannot be identified, then the splice strength is compared to the nominal belt strength provided by the manufacturer. The final result is in the form of an arithmetic mean from tests performed on three specimens.

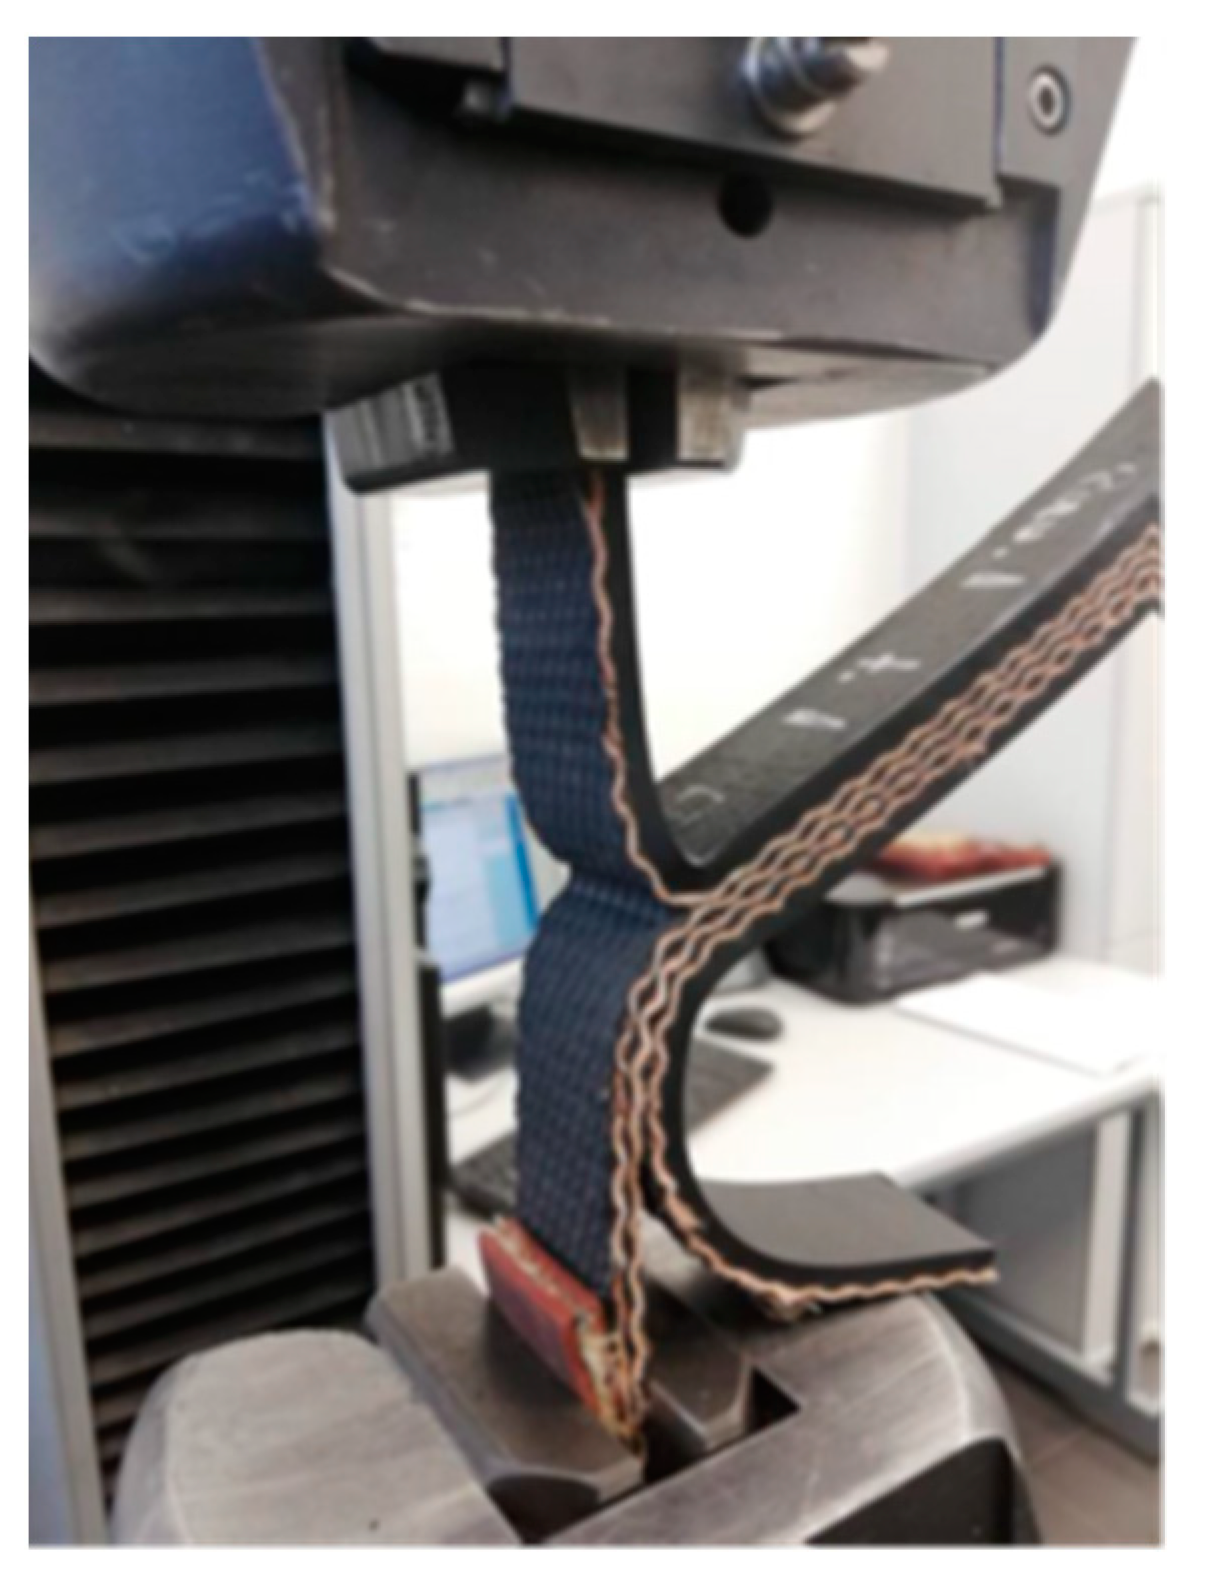
3.3.2. Delamination Strength Tests of the Adhesive Bond

The delamination strength of the adhesive bond in the splice (in the longitudinal direction) was tested following the method described in ISO 252:2018 [32]. This test method consists of delaminating the textile plies. The delamination process was performed at the speed of 100 mm/min along a minimum length of 100 mm. During the test, the delaminating force was recorded in time. The test specimens were 25 mm in width and a minimum of 300 mm in length. The tests were performed on the INSTRON 4467 testing machine. Figure 7 shows the belt specimen during the delamination test.
Delamination strength tests of the adhesive bond were performed for each splice step. In the case of 4-ply belts, three splices were delaminated: on the first splice step (between ply 1 and ply 2), on the second splice step (between ply 2 and ply 3) and on the third splice step (between ply 3 and ply 4).
The adhesive strength W between the plies in the longitudinal direction can be calculated from Equation (12):
W = F m b kN / m
where W—adhesion strength, in [kN/m]; Fm—mean delaminating force, in [kN], as a median; b—nominal specimen width, in [mm].
The final result is provided in the form of an arithmetic mean value obtained from three measurements on each splice step.

3.3.3. Testing the Shear Strength of the Adhesive Bond

The shear strength of the adhesive bond is tested in accordance with the method described in PN-C-94147 [31]. Figure 8 is a schematic view of the specimen prepared for shear strength tests of the adhesive bond.
Test specimens were 30 mm × 300 mm in size and have cuts in their two upper plies and two bottom plies. The cuts were 100 mm in length. The specimens were placed in the clamps of the testing machine and tensioned with a speed of (100 ± 10) mm/min until the specimen is broken.
Figure 9 shows the specimen placed in the clamps of the INSTRON 4467 testing machine.
Shear strength of the adhesive bond τ should be calculated following Equation (13):
τ = P b l kN / m 2
where P—breaking force, in [kN]; l—length of the layer subjected to shear, in [m]; b—specimen width, in [m].
The final result is provided in the form of an arithmetic mean value from five measurements.

3.3.4. Belt Strength Tests

Belt tensile strength was tested following the method described in ISO 283:2016-01 [33]. The belt specimen having the shape of an oar with the clamp part of an appropriate length and width is placed in the clamps of the testing machine. The length of the specimen and the width of the clamp part depend on the strength of the belt. A 100 mm long measurement basis is marked on the specimen in order to measure belt elongation. The testing machine is equipped with a video extensometer, which measures belt elongation during the tensioning of the belt. The test results provided by the machine are then interpreted in appropriate software and subsequently stored and displayed as a graphic representation on the computer screen located on the machine. After the specimen is placed in the clamps of the testing machine, it is tensioned at a constant speed of 100 mm/min until it breaks or the core strength is significantly reduced. During the test, a record is made of both the tensile force and the belt elongation. The tests were performed on the LabTest 6.100 testing machine. It was calibrated in an accuracy class of 0.5 (while the standard requires calibration in an accuracy class of 1), and it was approved by the Polish Central Office of Measures. Figure 10 shows the testing machine with the belt specimen secured in the clamps and with the video extensometer.
The belt strength R test results were calculated from relationship (14):
R = F m a x b   kN / m
where Fmax—maximum value of the tensile force, kN; n—specimen width at its most narrow part, m.
As a standard, the tests are performed on three specimens. If the belt breaks in an area beyond the measurement basis, the test result is rejected and an additional specimen is tested.

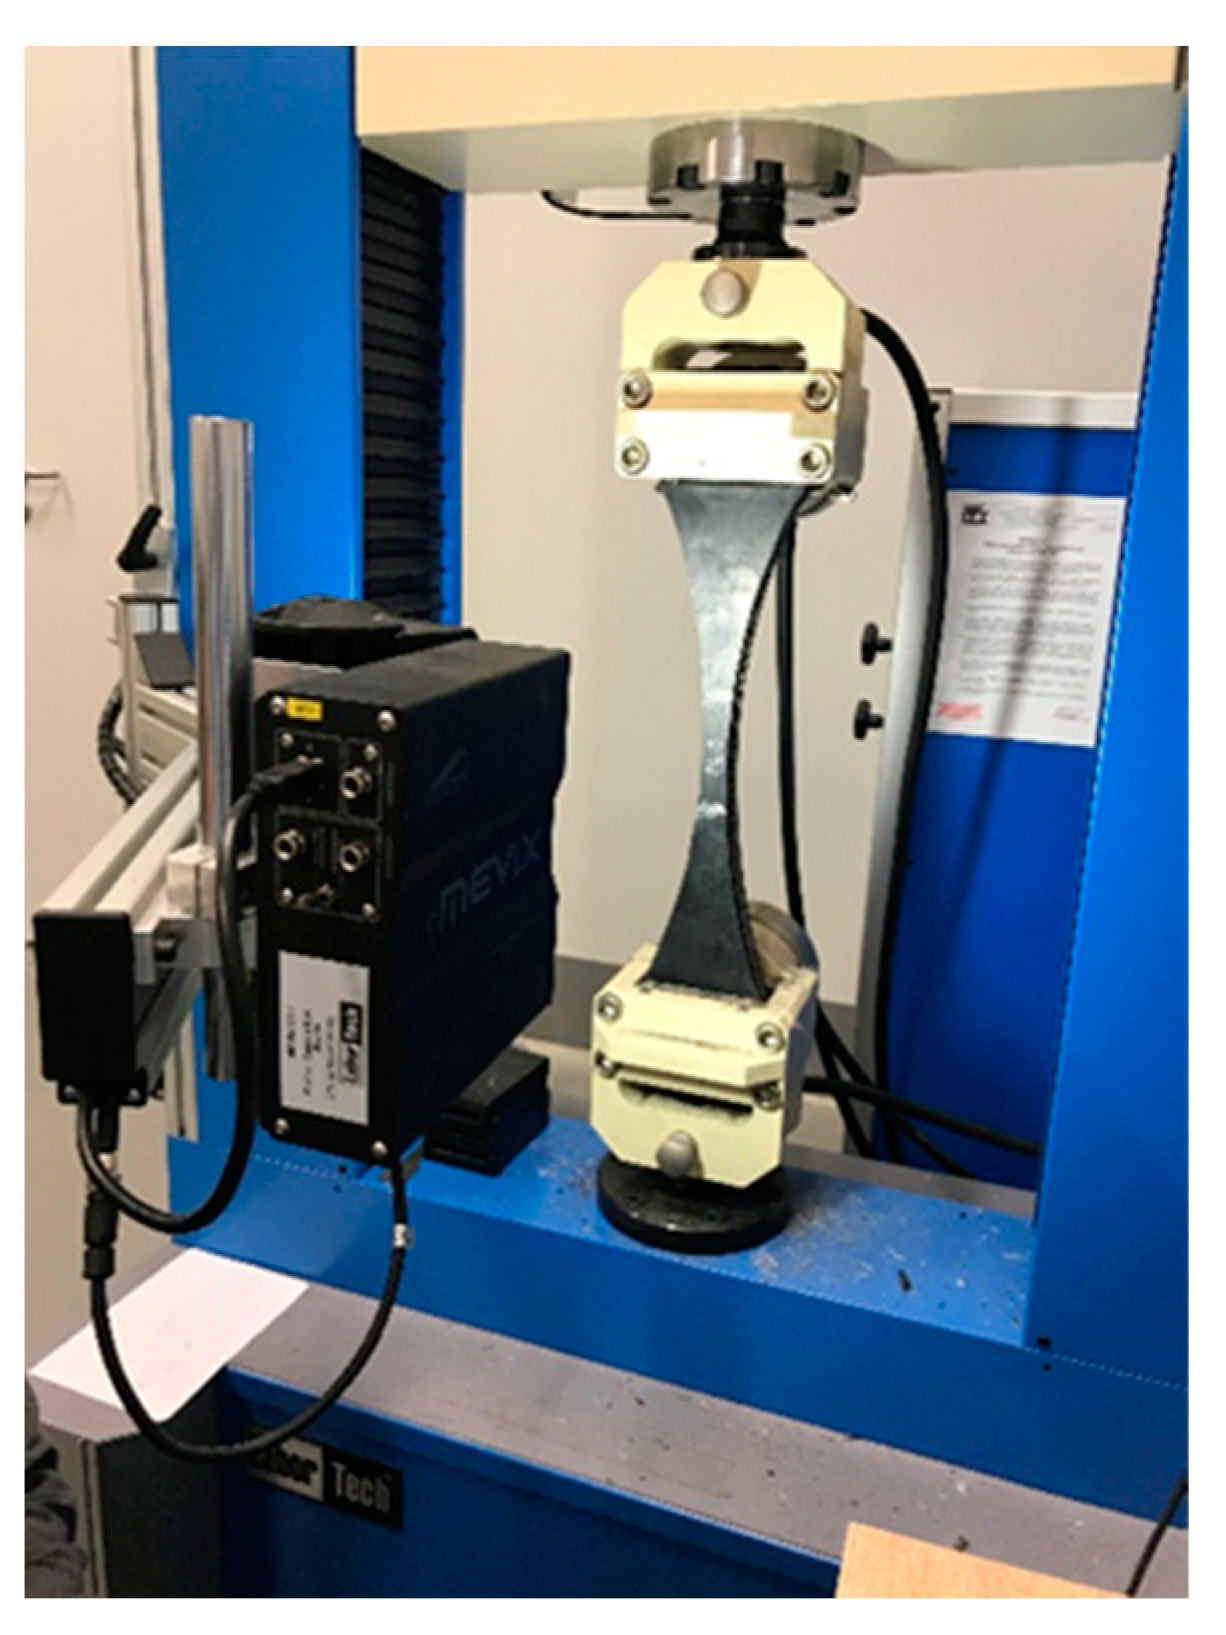
3.3.5. Tests of Belt Modulus of Elasticity

Tests of the modulus of elasticity for textile core belts were performed with the use of a standard method described in ISO 9856:2005 [34]. The method requires rectangular belt specimens, 500 mm in length and 50 mm in width and cut along the length of the belt. The measurement basis for marking the specimen elongation is required to be 100 mm. The belt specimens are subjected to sinusoidal tensile loads within the range from 2% to 10% of the belt nominal strength at a frequency of 0.1 Hz. The analysis is performed on an elastic hysteresis from 200 load cycles (Figure 11). After 200 load cycles, the force–elongation curve is used to read the values of plastic elongation ∆lp and of elastic elongation ∆le for the tested specimen. The modulus of elasticity E is defined as the relationship between the increase of stress ∆F and the increase of belt elastic strain εelast (Equations (15) and (16)):
E = Δ F ε e l a s t N / mm
ε e l a s t = Δ l e l o 100 %
where εelast—belt elastic strain, %; lo—initial length of the reference section, mm.
Figure 11 shows examples of the test results for belt modulus of elasticity obtained with the standard method [36]. The hysteresis loops indicated in the graph are the 1st and the 200th loop for a selected belt specimen.
The tests of the modulus of elasticity were performed on the Zwick/Roell Amsler HC 25 machine for dynamic tests up to 25 kN, equipped with an extensometer mounted on the specimen for measuring its elongation.

4. Results and Discussion

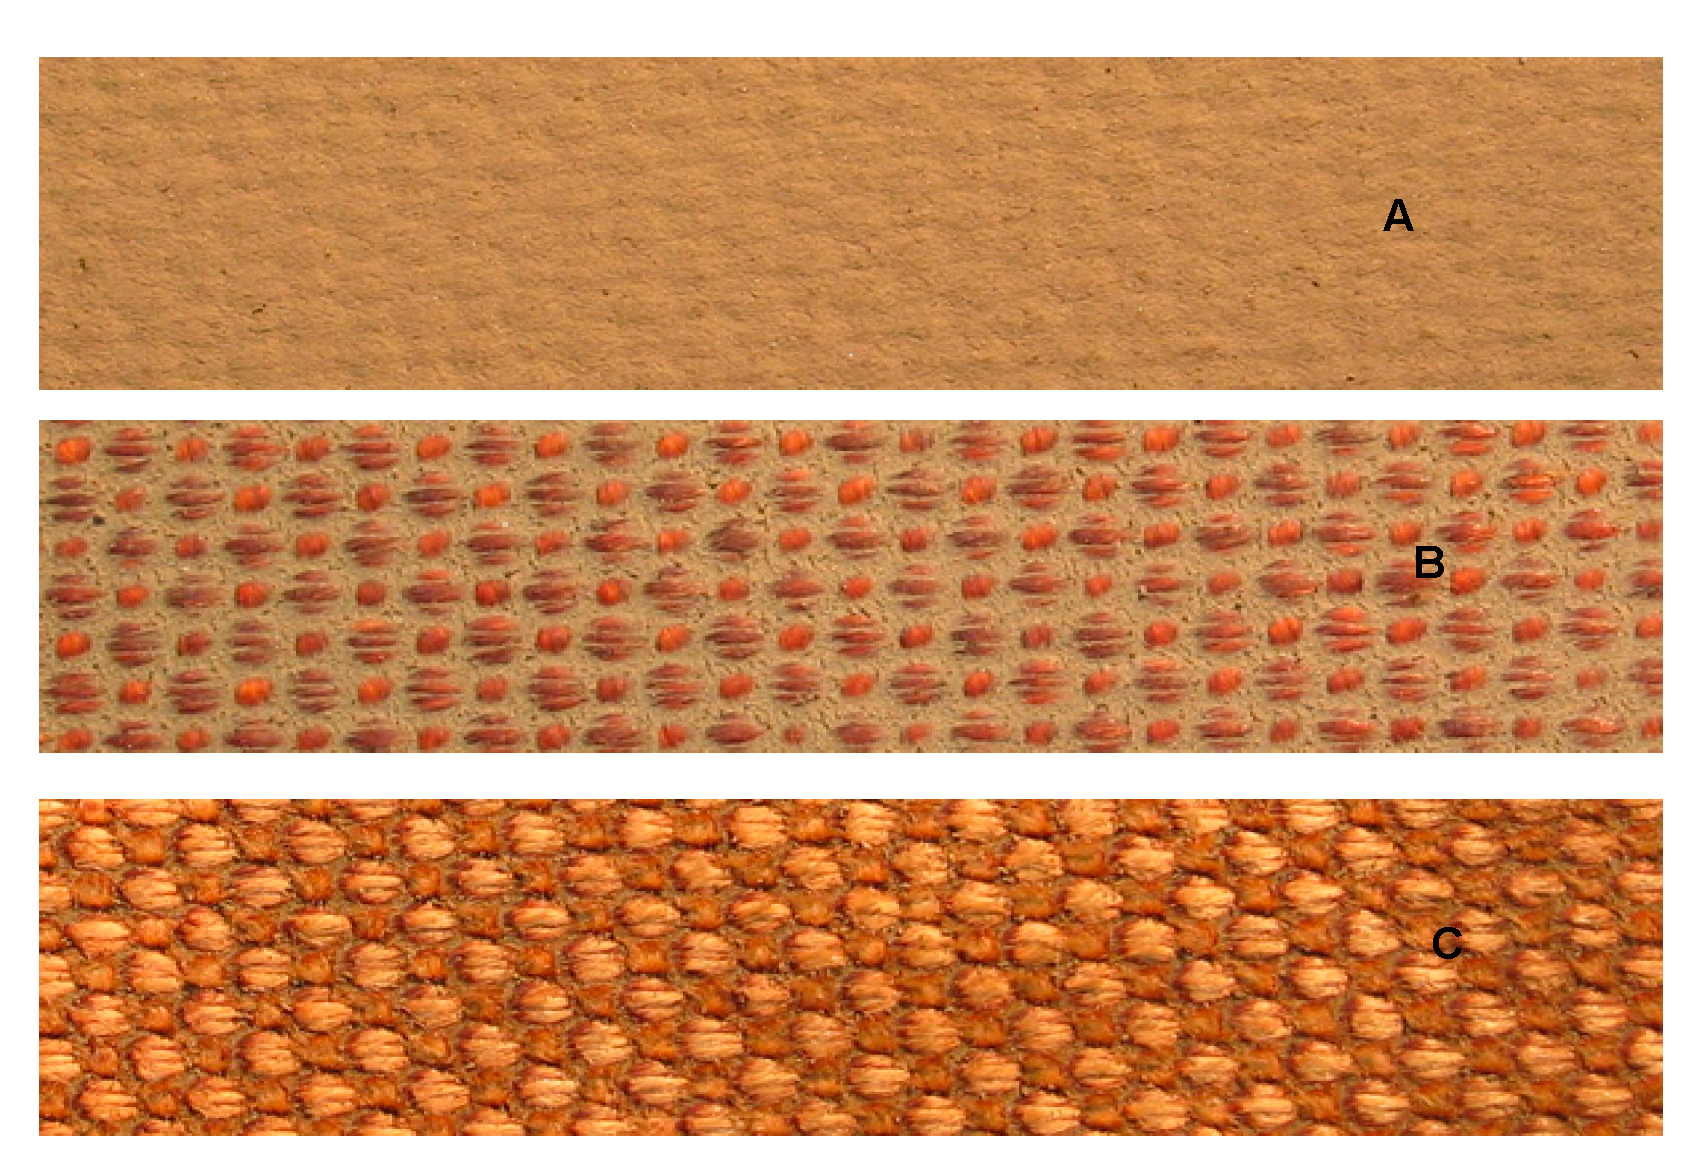
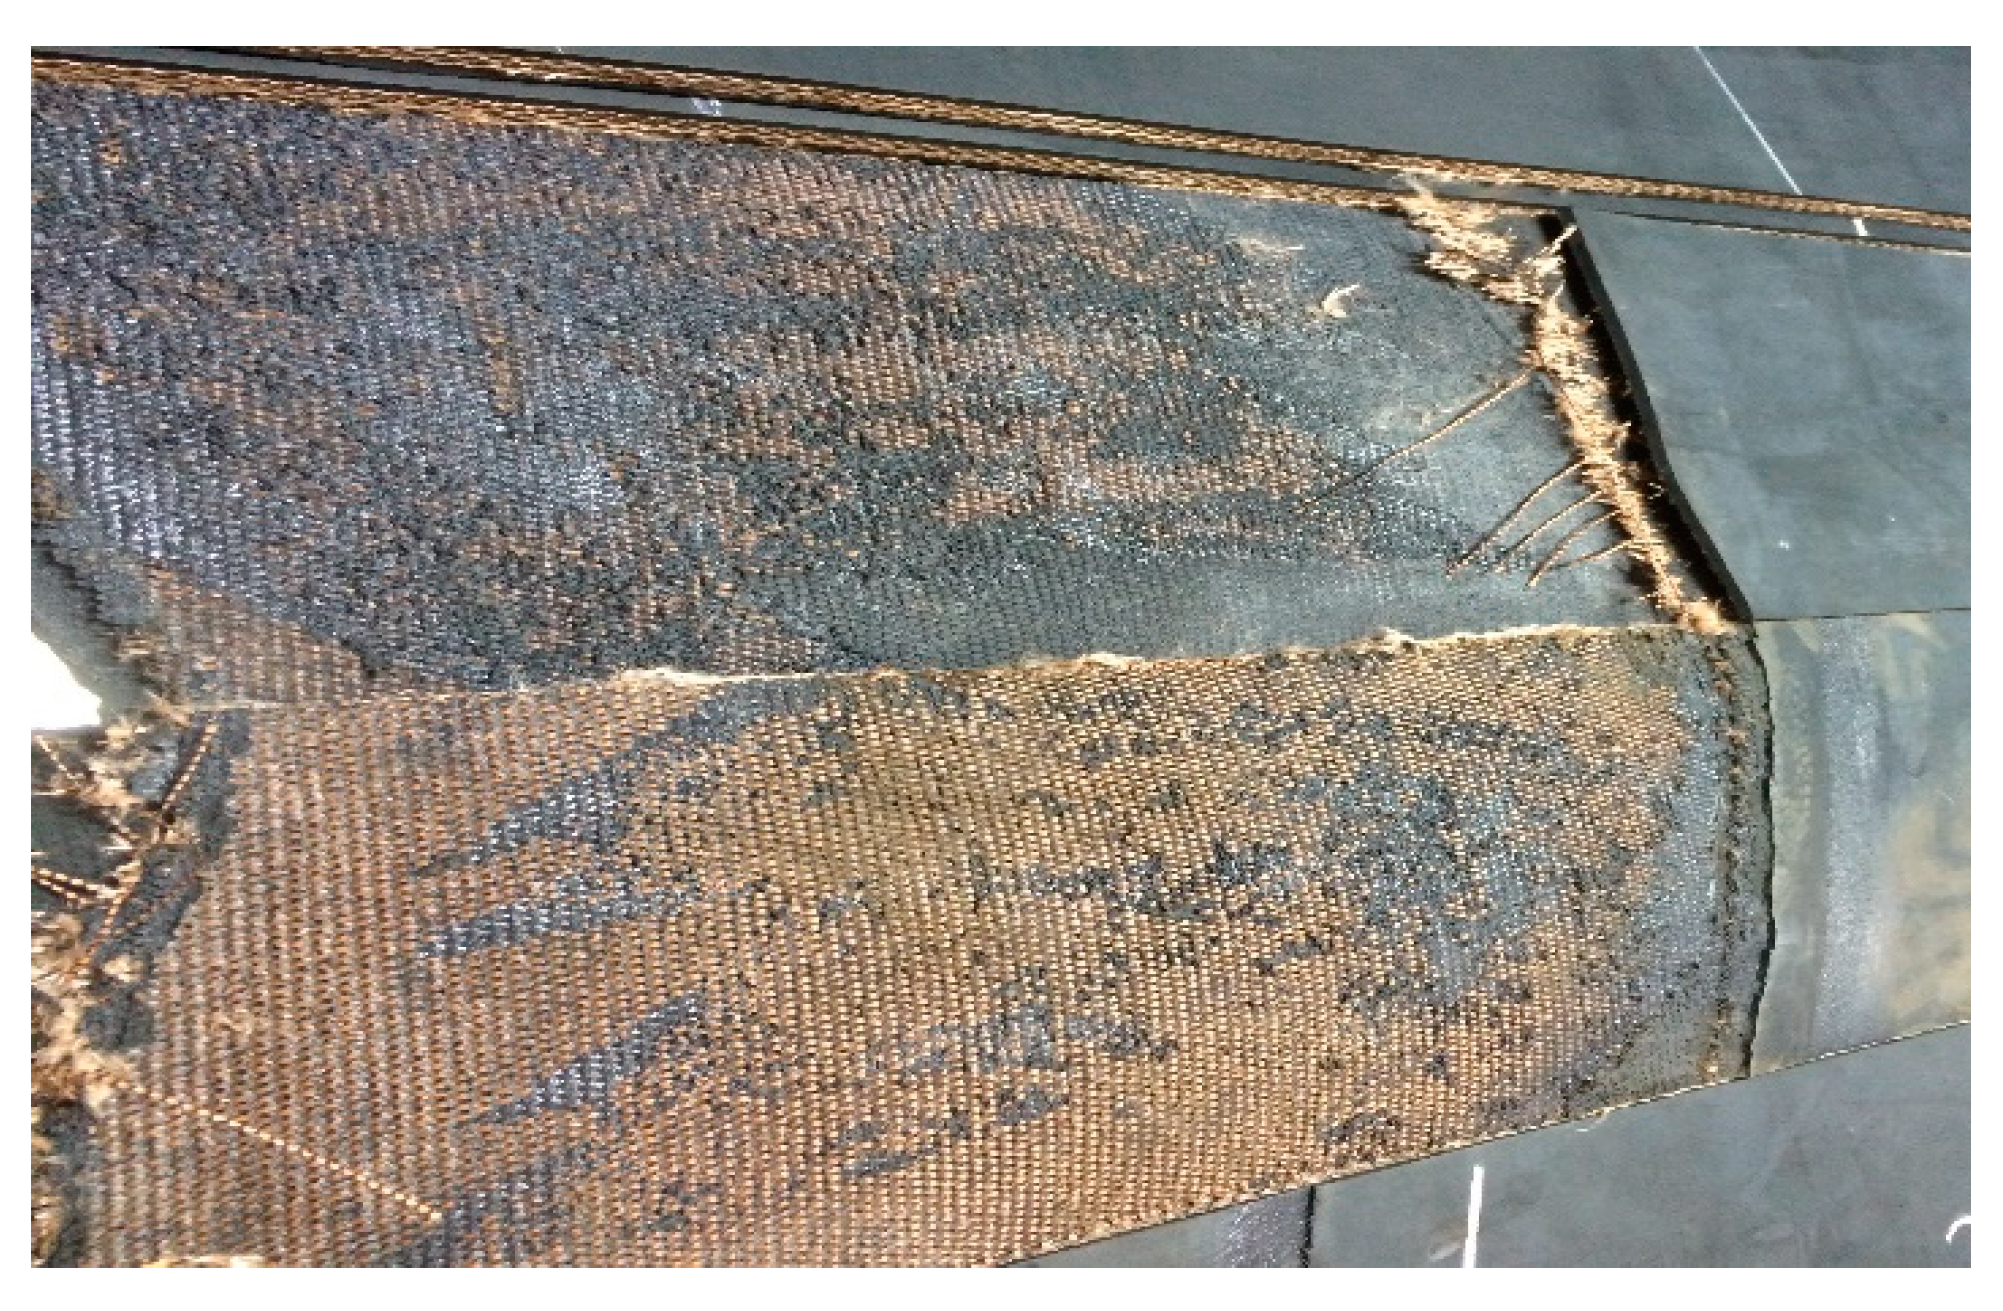
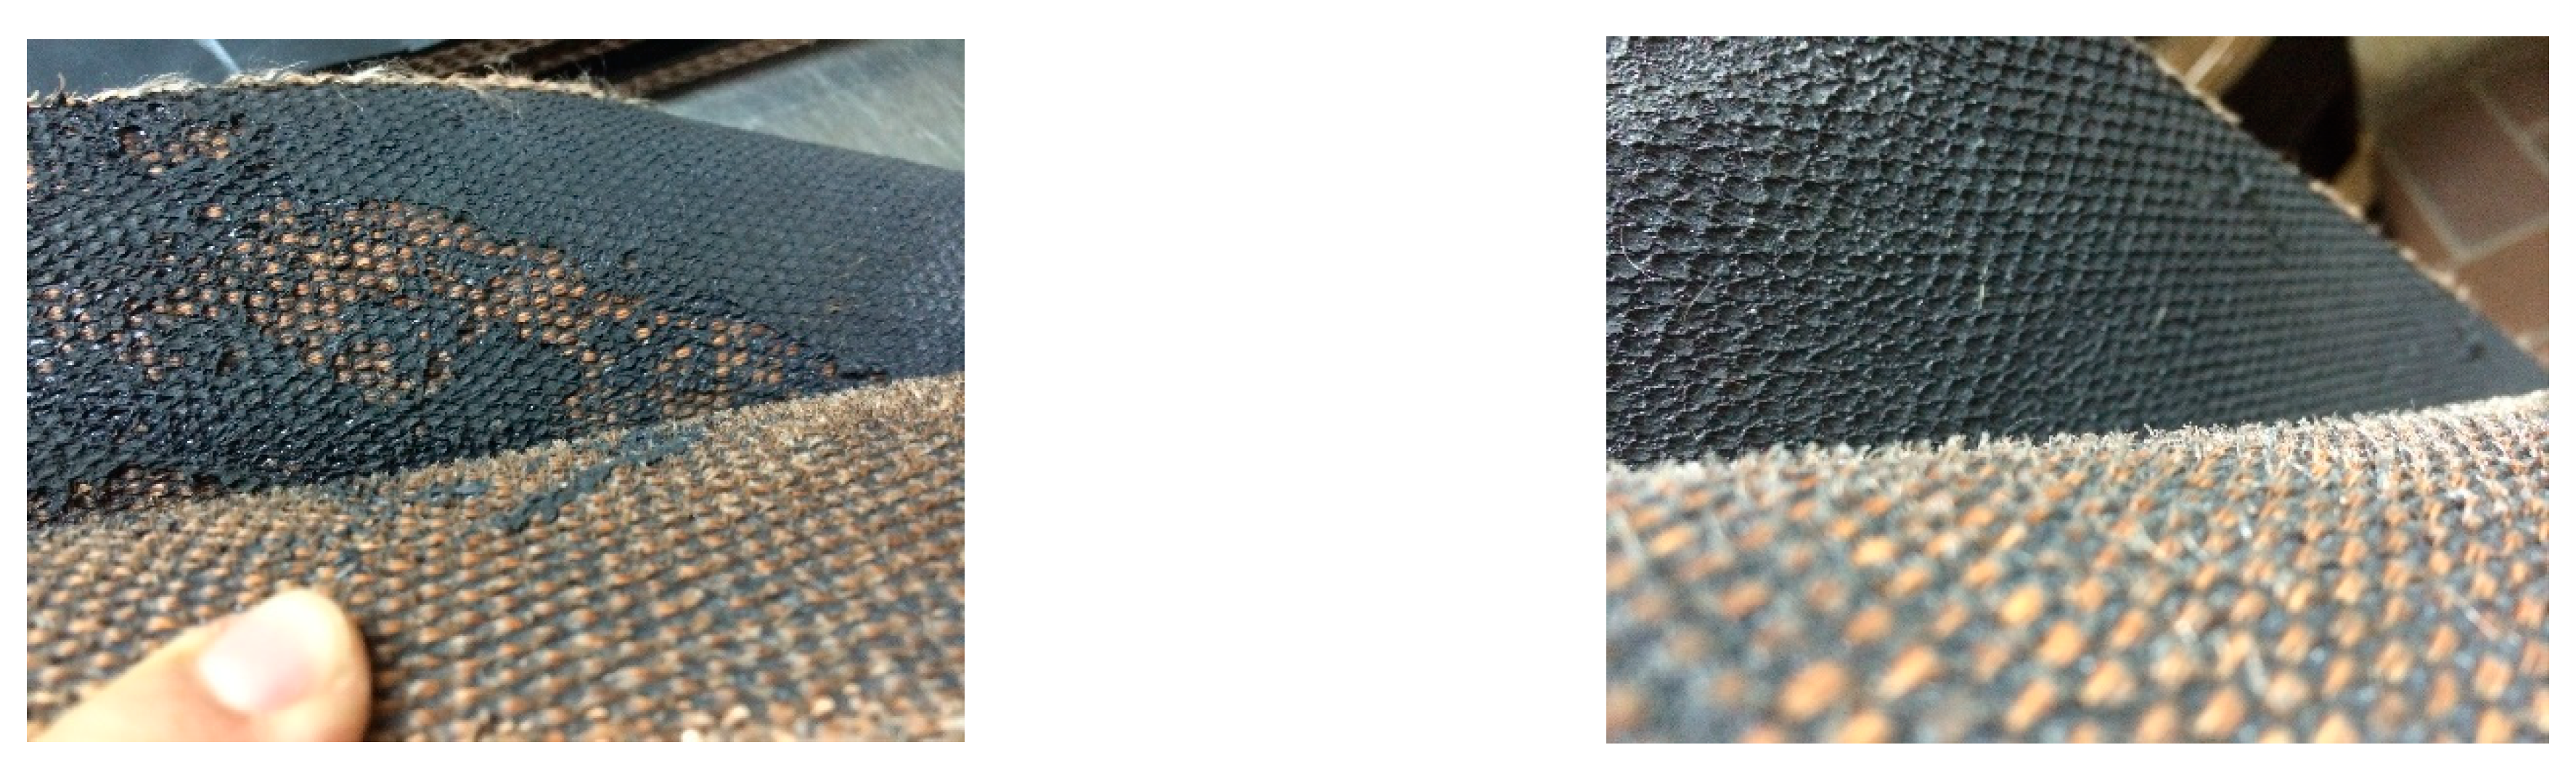
4.1. The Influence of Ply Roughening on the Strength Parameters of Splices

Currently, the majority of splices tested by LTT for the industry partners meet the required values of strength parameters. The splices demonstrate the tensile strength Rz, which is described with relationship (11).
However, some of the splices do not have the required strength. Table 2 presents the results of tensile strength tests performed for several selected splices that did not demonstrate the minimum tensile strength and failed as a result of breaks in the belt plies.
Investigations of the reasons for the lowered splice strength presented in Table 1 led to the conclusion that in each case, the spliced surfaces of the textile belts had been roughened in a manner that affected their structure. Ply surfaces are prepared directly before they are covered with glue in order to clean them from the residual friction rubber or to level any rubber surface irregularities. This operation should be performed with much care so as not to damage the ply structure. Plies not covered by friction rubber are not recommended for roughening. As shown in an example in Figure 12, this recommendation had not been observed in the cases discussed here.
The splice partially shown in Figure 12 (splice 1 in Table 2) failed upon reaching a strength of 663 kN, which is just 54% of its required strength. The splice failed gradually. Already at the value of 400–450 kN/m, the spliced plies started to break. The reason for the plies breaking at such low loads was found to lie in the fact of the surface roughening. In this case, the roughened plies not only broke at the splice contact points but also became locally fractured in various locations on their surfaces. The structure of the textile plies had been damaged due to excessive roughening. The damaged fibers in the cords are clearly visible after the ply is removed (see Figure 13). The splice partially shown in Figure 13 (splice 2 in Table 2) failed at a load 47% lower than required. As in the case of the previous splice, excessively roughened plies were observed.
In order to find the degree at which ply roughening decreased the strength of the belt itself, comparative tensile strength tests were performed for belt specimens obtained both from the area of the splice and from outside of this area. The specimens from the splice area were cut to avoid any ply contact locations. Table 3 contains the test results for three selected splices, referred to in Table 2 by numbers 1, 11 and 12.
The results presented in Table 3 indicate that the reason behind significantly lowered splice strength lies in the reduced belt strength in the splice area. As roughening is performed only for the two bonded plies in each splice step, and the results from Table 3 describe the simultaneous breaking of all belt plies, the strength loss in the roughened plies should be assumed to be greater than the results obtained during the belt tests.
In order to investigate the influence of ply roughening on ply strength, tests were performed on a conveyor belt type EP 2000/4. This is a four-ply belt with a textile, polyamide-polyester core having a nominal tensile strength of 2000 kN/m. The belt was delaminated between the second and the third ply, obtaining two-ply cores referenced with symbol EP 1000/2. The 1800 mm long belt was divided into three sections of equal lengths, designated with letters A, B and C. Section A was not subjected to any preparation. Section B was roughened on both sides to remove the friction rubber until the ply fabric was reached, with much attention not to damage the plies. Section C was roughened on both sides to remove the friction rubber and subsequently the ply fabric was further roughened until the surface reached uniform roughness. Figure 5 shows the surfaces prepared in accordance with the above descriptions.
Specimens for tensile strength tests were then cut from each of the belt sections. The results of these tests are shown in Table 4.
Specimens A were not roughened, and their strength was thus assumed at 100%. The strength of specimens B decreased by approximately 6% despite efforts not to damage the ply fabric. The strength of specimens C decreased by approximately 46% with respect to the value recorded for specimens A. It should be noted, however, that the evaluation of the degree of roughening is subjective and therefore the results may be in a wide range of values.
In order to identify the influence of ply roughening on splice strength properties, the tests were performed on three different belts type 2000/4 provided by three different manufacturers. The tests consisted in delaminating the belts between the second and the third ply and in subsequently preparing the delaminated surfaces using the method described above (see Figure 5). The plies were then spliced again using the hot vulcanization method. Mean results of the shear strength and the delamination strength of the splice specimens are shown in Table 5.
The results of delamination and shear strength tests were compared with the same parameters, which had been identified for the belts used in the above splices. The obtained results allow a definite conclusion that the best strength properties were observed in splices in which the plies were not roughened (splice A), and the worst strength properties in splices in which ply surfaces are excessively roughened until the fabric became rough and the fibers are damaged (splice C).
The comparison of the results of shear and delamination strength tests for the adhesive bond between the splice with roughened plies (splice C) and the splice with no ply roughening (splice A) indicates clearly that roughening significantly affected the strength test results. The tested shear strength for splice C was only at 21% to 63% of the values obtained in the case of splice A. The tested delamination strength for splice C was also much lower than the results for splice A, reaching only 55–77% of the strength observed in the unroughened splices.

4.2. Different Properties of Spliced Belts Influencing Splice Strength

As the relationship between the elongations and stresses observed at conveyor belt tensioning is non-linear, the consideration of the elongation–stress relationship as a linear relationship requires defining the elastic modulus for particular load limits and for a particular minimum load. The value of the modulus was calculated in the full range of the set belt loads. The value of the longitudinal elastic modulus for textile plies was calculated with the use of software and on the basis of the closest to linear part of the stress–strain curve (in the set range). The calculated values of longitudinal elasticity moduli for plies in various load ranges are shown in Table 6.
Selected conveyor belts were used to prepare six splices for strength tests. Figure 14 shows the shape and the dimensions of the splices. The splices were hot-vulcanized and prepared by joining the belts in various combinations: Belt 1 with Belt 1 (1-1), Belt 2 with Belt 2 (2-2), Belt 3 with Belt 3 (3-3), Belt 1 with Belt 2 (1-2), Belt 1 with Belt 3 (1-3) and Belt 2 with Belt 3 (2-3).
The measured splice strength values are presented in Table 7. The obtained splice strength was compared against the strength required as per PN/C-94147 [31] and against the nominal strength of the spliced belts (which was 1000 kN/m). In the case when different belts were spliced, a comparison was also made with the strength of the splice in the same belt. The values presented in the table, in the cells where the rows representing splices of different belts (1-2, 1-3, 2-3) cross with the columns representing splices of identical belts (1-1, 2-2, 3-3), define the relationship (expressed as percentage) between the strength measured for splices of different belts and the strength measured for splices of identical belts (assumed as 100%).
The tests indicate that splices of belts whose plies have different mechanical properties (different longitudinal modulus of elasticity) show lower strength than splices of identical belts. The strength of splices between different belts, referred to as 1-2, 1-3 and 2-3, was 70–97% of the strength recorded for splices 1-1, 2-2, 3-3. The difference between the values of elastic moduli for plies in different belts is observed across the entire range of the carried loads (see Table 6).
The difference between the mechanical properties of the belt with polyester-polyamide core (EP) and the mechanical properties of the belt with polyamide core (P) results from the different mechanical properties of the two materials. The elastic modulus value is low for polyamide and high for polyester. The selection of belts with identical strength and number of plies but made of materials with significantly different mechanical properties was a conscious choice dictated by the intention to obtain a clear demonstration of the influence of this configuration on the splice strength.
The difference between the elastic moduli observed in the case of belts with polyamide core is caused by the fact that the manufacturers of conveyor belts use different materials in the plies and different manufacturing technologies. As a result, apparently identical belts having the same nominal tensile strength, number of plies and width show different mechanical properties, and this leads to the lowered splice strengths demonstrated in the tests. While the difference between the polyester-polyamide (EP) belt and the polyamide (P) belt is obvious to splicing professionals, there is practically no method that would allow belts of identical nameplate parameters to be properly selected without strength tests (excluding a scenario in which the belts are provided by the same manufacturer). The splice strength is additionally reduced (with respect to splices of identical belts) due to increased concentrations of tensile stresses in the plies and to increased shearing stresses in the rubber (adhesive) layer between the plies.

5. Conclusions

The main results and conclusions can be summarized as follows:
  • The laboratory tests of belts and splices, which were performed in both laboratory conditions and in actual mining plants, confirmed the conclusions of the theoretical considerations pointing to differences between the mechanical properties of spliced belts as one of the reasons behind reduced splice strength.
  • In multiply conveyor belt splices, stresses concentrate both in the plies and in the adhesive bond located in the cross-sections of the ply contact points, leading to reduced splice strength. However, tests of some splices made in industrial installations show strengths lower than expected from the losses due to stress concentrations and reduced number of plies in the splice. Investigations allowed an observation that the reason behind such cases lies in the inappropriate preparation of belt plies in the process of splicing.
  • As the plies are cleaned and roughened with excessive intensity in order to remove residual friction rubber, the ply fabric becomes exposed and the belt strength is reduced, in effect leading to reduced splice strength. The strength loss may reach up to several tens of percent. The roughening of plies in vulcanized splices also lowers their shear and delamination strength.
  • The tests demonstrated that the highest strength parameters were observed in the case of splices in which the plies were not cleaned from the friction rubber, and therefore this procedure should be performed only if required in order to level irregularities or reduce the thickness of the friction rubber. The roughening procedure cannot cause the fabric of the plies to become exposed, as this inevitably damages the fabric.
  • The research results also indicate that the observed decrease in the strength of the same type of belts provided by different manufacturers is due to different mechanical properties of the plies, and in this case, to different elastic moduli. Knowledge about the belt modulus of elasticity is therefore crucial for rationally designing belt splices, analyzing their dynamics and improving the effective usage of the belt, which is the most expensive and the most important element of a belt conveyor.
  • Tests of selected conveyor belts indicated that plies of the same type show different mechanical properties if provided by different manufacturers. This fact is due to the use of different materials and belt manufacturing technologies.
  • The laboratory tests of full-length splices demonstrated that properly made splices of identical belts meet or even exceed the strength requirements offered in current standards.
  • The laboratory tests of the belts and splices confirmed the conclusions of belt splice tests performed in the mining plants and pointed to the difference between the mechanical properties of the spliced belts as one of the reasons behind reduced splice strength.

Author Contributions

Conceptualization, M.H.; methodology, M.H.; software, M.B.; validation, M.H.; formal analysis, M.H.; investigation, M.H., M.B.; resources, M.H., M.B.; data curation, M.H.; writing—original draft preparation, M.B.; writing—review and editing, M.H., M.B.; visualization, M.B.; supervision, M.H.; project administration, M.H. All authors have read and agreed to the published version of the manuscript.

Funding

This research was co-financed by the Polish Ministry of Science and Higher Education for 2020.

Institutional Review Board Statement

Not applicable.

Informed Consent Statement

Not applicable.

Data Availability Statement

The data presented in this study are available on request from the corresponding author.

Conflicts of Interest

The authors declare no conflict of interest.

References

  1. Kawalec, W.; Suchorab, N.; Konieczna-Fuławka, M.; Król, R. Specific Energy Consumption of a Belt Conveyor System in a Continuous Surface Mine. Energies 2020, 13, 5214. [Google Scholar] [CrossRef]
  2. Mu, Y.; Yao, T.; Jia, H.; Yu, X.; Zhao, B.; Zhang, X.; Ni, C.; Du, L. Optimal scheduling method for belt conveyor system in coal mine considering silo virtual energy storage. Appl. Energy 2020, 275, 115368. [Google Scholar] [CrossRef]
  3. Zimroz, R.; Krol, R. Failure analysis of belt conveyor systems for condition monitoring purposes. Min. Sci. 2009, 128, 36, 255–270. [Google Scholar]
  4. Ambriško, Ľ.; Marasová, D. Experimental Research of Rubber Composites Subjected to Impact Loading. Appl. Sci. 2020, 10, 8384. [Google Scholar] [CrossRef]
  5. Andrejiova, M.; Grincova, A.; Marasova, D. Analysis of tensile properties of worn fabric conveyor belts with renovated cover and with the different carcass type. Eksploatacja i Niezawodność—Maint. Reliab. 2020, 22, 472–481. [Google Scholar] [CrossRef]
  6. Marasova, D.; Ambrisko, L.; Andrejiova, M. Examination of the process of damaging the top covering layer of a conveyor belt applying the FEM. Measurement 2017, 112, 47–52. [Google Scholar] [CrossRef]
  7. Molnar, W.; Nugent, S.; Lindroos, M.; Apostol, M.; Varga, M. Ballistic and numerical simulation of impacting goods on conveyor belt rubber. Polym. Test. 2015, 42, 1–7. [Google Scholar] [CrossRef]
  8. Rudawska, A.; Madleňák, R.; Madleňáková, L.; Droździel, P. Investigation of the effect of operational factors on conveyor belt mechanical properties. Appl. Sci. 2020, 10, 4201. [Google Scholar] [CrossRef]
  9. Bajda, M.; Blazej, R.; Jurdziak, L.; Hardygóra, M. Impact of differences in the durability of vulcanized and adhesive joints on the operating costs of conveyor belts in underground mines. Scientific Papers of the Institute of Mineral and Energy Economy. Pol. Acad. Sci. 2017, 99, 71–88. [Google Scholar]
  10. Doroszuk, B.; Król, R. Conveyor belt wear caused by material acceleration in transfer stations. Min. Sci. 2019, 26, 189–201. [Google Scholar] [CrossRef]
  11. Jurdziak, L. The conveyor belt wear index and its application in belts replacement policy. In Proceedings of the Ninth International Symposium on Mine Planning and Equipment Selection, Athens, Greece, 6−9 November 2000; Balkema, A.A.: Rotterdam, The Netherlands; pp. 589–594. [Google Scholar]
  12. Temerzhanov, A.; Stolpovskikh, I.; Sladkowski, A. Analysis of reliability parameters of conveyor belt joints. Transp. Probl. 2012, 7, 107–112. [Google Scholar]
  13. Bancroft, B.; Ch, F.; Pilarski, T. Belt Vision System for Monitoring Mechanical Splices. In Proceedings of the Conference materials: Longwall USA International Exhibition and Conference, Pittsburgh, PA, USA, 3–5 June 2003. [Google Scholar]
  14. U.S. Department of Energy’s. Effective Conveyor Belt Inspection for Improving Mining Productivity. U.S. Department of Energy Office of Energy Efficiency and Renewable Energy. 2004. Available online: http://www.nrec.ri.cmu.edu/projects/belt_inspection/tech/effectconvey.pdf (accessed on 11 May 2017).
  15. Kozłowski, T.; Wodecki, J.; Zimroz, R.; Błazej, R.; Hardygóra, M. Diagnostics of Conveyor Belt Splices. Appl. Sci. 2020, 10, 6259. [Google Scholar] [CrossRef]
  16. Mazurkiewicz, D. Monitoring the condition of adhesive-sealed belt conveyors in operation. Eksploat. Niezawodn. Maint. Reliab. 2005, 3, 41–49. [Google Scholar]
  17. Bajda, M.; Błażej, R.; Hardygóra, M. Impact of selected parameters on the fatigue strength of splices on multiply textile conveyor belts. IOP Conf. Ser. Earth Environ. Sci. 2016. [Google Scholar] [CrossRef]
  18. Błażej, R.; Bajda, M.; Hardygóra, M. Monitoring creep and stress relaxation in splices on multiply textile rubber conveyor belts. Acta Montan. Slovaca 2017, 22, 116–125. [Google Scholar]
  19. Heitzmann, P.; Froböse, T.; Wakatsuki, A.; Overmeyer, L. Optimization of textile conveyor belt splices using Finite Element Method (FEM). Logist. J. 2016. [Google Scholar] [CrossRef]
  20. Long, X.; Li, X.; Long, H. Analysis of influence of multiple steel cords on splice strength. J. Adhes. Sci. Technol. 2018, 32, 2753–2763. [Google Scholar] [CrossRef]
  21. Xianguo, L.; Xinyu, L.; Zhenqian, S.; Changyun, M. Analysis of Strength Factors of Steel Cord Conveyor Belt Splices Based on the FEM. Adv. Mater. Sci. Eng. 2019. [Google Scholar] [CrossRef] [Green Version]
  22. Hardygóra, M.; Bajda, M.; Błażej, R. Laboratory testing of conveyor textile belt joints used in underground mines. Min. Sci. 2015, 22, 161–169. [Google Scholar] [CrossRef]
  23. Kirjanów, A. Analysis of the results of the strength tests of finger splices. Min. Sci. 2015, 22, 31–37. [Google Scholar] [CrossRef]
  24. Wozniak, D. Laboratory tests of indentation rolling resistance of conveyor belts. Measurement (London) 2020, 150, 107065. [Google Scholar] [CrossRef]
  25. Bajda, M.; Błażej, R.; Hardygóra, M.; Jurdziak, L. Project NCBiR no PBS3/A2/17/2015. In Joints of Multi-Ply Conveyor Belts with Increased Functional Durability (Złącza Wieloprzekładkowych Taśm Przenośnikowych o Zwiększonej Trwałości Eksploatacyjnej); Wrocław University of Science and Technology: Wroclaw, Poland, 2018; in press. (In Polish) [Google Scholar]
  26. Bajda, M.; Blazej, R.; Jurdziak, L. Partial replacements of conveyor belt loop analysis with regard to its reliability. In Proceedings of the 17th International Multidisciplinary Scientific GeoConference SGEM, Albena, Bulgaria, 27 June–6 July 2017; pp. 645–652. [Google Scholar] [CrossRef]
  27. Madziarz, M. Wpływ Konstrukcji i Technologii Wykonywania Połączeń Tkaninowych Taśm Przenośnikowych na Ich Wytrzymałość (Influence of the Splice Design and the Splicing Technology in Textile Conveyor Belts on Their Strength); Wrocław University of Science and Technology, doctoral dissertation: Wroclaw, Poland, 1998. (In Polish) [Google Scholar]
  28. Błażej, R. Wpływ Właściwości Mechanicznych Rdzenia Taśm Przenośnikowych Tkaninowo-Gumowych na Wytrzymałość ich Połączeń (The Influence of the Mechanical Properties of the Core of Rubber-Textile Conveyor Belts on Splice Strength). Ph.D. Dissertation, Wrocław University of Science and Technology, Wroclaw, Poland, 2001. (In Polish). [Google Scholar]
  29. Research project no 8T12A 03521. Optimization of the Construction of Multi-Ply Conveyor Belt Splices; Wrocław University of Science and Technology, Mining Institute: Wroclaw, Poland, 2004. [Google Scholar]
  30. International Standard ISO 14890. Conveyor Belts—Specification for Rubber or Plastics Covered Conveyor Belts of Textile Construction for General Use; European Committee for Standarization: Brussels, Belgium, 2013. [Google Scholar]
  31. Polish Standard PN-C-94147. Rubber products. In Guiding Principles for Conveyor Belts Jointing by Vulcanization; Polski Komitet Normalizacyjny PKN: Warsaw, Poland, 1997. [Google Scholar]
  32. International Standard ISO 252. Conveyor belts. Adhesion between constitutive elements. In Test Methods; European Committee for Standarization: Brussels, Belgium, 2018. [Google Scholar]
  33. International Standard ISO 283. Textile conveyor belts. Full thickness tensile strength, elongation at break and elongation at the reference load. In Test Method; European Committee for Standarization: Brussels, Belgium, 2016. [Google Scholar]
  34. International Standard ISO 9856. Conveyor belts. In Determination of Elastic and Permanent Elongation and Calculation of Elastic Modulus; European Committee for Standarization: Brussels, Belgium, 2005. [Google Scholar]
  35. The official website of the Belt Conveying Laboratory. Available online: www.ltt.pwr.edu.pl (accessed on 25 August 2020).
  36. Furmanik, K.; Pracik, M. Experimental identification of rheological parameters standard model of belt conveyor. Mechanics 2011, 2, 25–33. [Google Scholar]
Figure 1. Percentage share for the reasons behind the lowered strength of splices in multiply conveyor belts [25].
Energies 14 01512 g001
Figure 2. Stresses in an elementary length of a belt core cross-section, τ—shear stresses, σ—tensile stresses.
Energies 14 01512 g002
Figure 3. Shear stress distribution τ along the total splice length Lp. Splice in belt type EP 1000/4 (black), splice in belt type P 1000/4 (orange) [25].
Energies 14 01512 g003
Figure 4. Schematic drawing of a splice in a 4-ply belt.
Energies 14 01512 g004
Figure 5. Textile plies: (A)—unroughened, (B)—roughened friction rubber, (C)—roughened fabric.
Energies 14 01512 g005
Figure 6. Test stands.
Energies 14 01512 g006
Figure 7. Delamination between ply 1 and ply 2.
Energies 14 01512 g007
Figure 8. Schematic view of the specimen prepared for splice shear strength tests.
Energies 14 01512 g008
Figure 9. Schematic view of the specimen prepared for splice shear strength tests.
Energies 14 01512 g009
Figure 10. The LabTest 6.100 testing machine.
Energies 14 01512 g010
Figure 11. The 1st and the 200th hysteresis loop for a belt specimen.
Energies 14 01512 g011
Figure 12. Roughened ply in the splice on belt type EP 1800/5.
Energies 14 01512 g012
Figure 13. Roughened ply in the splice on belt type EP 1800/5.
Energies 14 01512 g013
Figure 14. The shape and the dimensions of the tested splices: lst—length of the splice step; 250 mm, Lp—splice length, 750 mm; LA—bias length, 0.3∙B = 210 mm; B—belt width, 700 mm.
Energies 14 01512 g014
Table 1. Calculated values of stress concentrations.
Difference between Elasticity Moduli for the Plies
E1 < E2
Maximum Stress Concentration in Comparison to:
Stresses in Splices of Identical BeltsStresses in Undamaged Belt
σ10σ20σ30σ40σ101σ202σ303σ404
at the end of step 1
50%0.83-1.091.081.24-1.591.12
40%0.86-1.071.061.28-1.561.1
30%0.89-1.051.051.33-1.531.09
20%0.93-1.031.031.39-1.51.07
10%0.96-1.021.021.43-1.491.06
at the beginning of step 2
50%0.79-1.111.11.18-1.621.14
40%0.83-1.091.081.24-1.591.12
30%0.85-1.081.071.27-1.581.11
20%0.9-1.051.051.35-1.531.09
10%0.94-1.031.031.4-1.51.07
at the end of step 2
50%0.880.89-1.220.921.3-1.82
40%0.90.91-1.190.941.33-1.78
30%0.920.94-1.140.961.37-1.7
20%0.940.96-1.10.981.4-1.64
10%0.970.99-1.041.011.45-1.55
at the beginning of step 3
50%0.880.89-1.240.921.28-1.85
40%0.890.91-1.20.931.33-1.79
30%0.910.93-1.160.951.36-1.73
20%0.940.95-1.110.981.39-1.66
10%0.960.96-1.070.991.42-1.6
Table 2. Results of tensile strength tests for industrial splices.
Splice No.Belt TypeSplice Tensile StrengthSplice Strength Loss
Required [kN/m]Measured [kN/m][%]
1EP 1800/5122466346
2EP 1800/5122465347
3GTP 1250/370853025
4P 630/335722038
5GTP 2000/4127589730
6GTP 2000/41700 1137519
7GTP 1800/4114788823
8GTP 1800/4114780030
9GTP 2500/521,251181415
10GTP 1250/370857619
11GTP 1400/489259234
12GTP 2000/41265700 145
1 Strap-type splices.
Table 3. Test results of splice strength.
No.Belt TypeSplice Tensile Strength, [kN/m]Belt Strength Loss in the Splice Area, [%]
outside the Splicein the Splice
1EP 1800/51802124331
11GTP 1400/4139574646
12GTP 2000/41985139230
Table 4. Results of strength tests for specimens of belts A, B and C.
Belt SymbolSpecimen DesignationBelt Tensile Strength
[kN/m] [%]
EP 1000/2A1135100
EP 1000/2B107394
EP 1000/2C51946
Table 5. Splice shear and delamination strength test results.
No.Belt TypeSpecimen DesignationShear StrengthDelamination Strength
[MPa] [%][N/mm][%]
1EP 2000/4Belt No. 13.081008.4100
2 Splice A2.69877.893
3 Splice C2.07675.059
4GPM 2000/4Belt No. 23.7510010.8100
5 Splice A2.687110.9101
6 Splice B2.71724.340
7 Splice C1.58422.321
8GPM 2000/4Belt No. 34.2310010.7100
9 Splice A3.05726.662
10 Splice B2.67635.349
11 Splice C1.80424.138
Table 6. Values of longitudinal elasticity moduli for the belt cores in various load ranges.
Load Range,
[kN]
Percentage of Nominal Load, [%]Longitudinal Elasticity Modulus of Belt Core, Ep
[kN/m]∙103
Belt No. 1Belt No. 2Belt No. 3
2–410–202.60.81.1
4–620–402.00.81.0
6–830–401.11.11.5
8–1040–501.31.31.8
10–1250–601.81.61.9
12–1460–702.21.72.7
14–1670–802.41.92.6
16–1880–903.02.22.5
18–2090–1003.72.13.0
10–2050–1002.71.92.3
14–2070–1002.82.02.3
Table 7. Values of longitudinal elasticity moduli for the belt cores in various load ranges.
Splice Symbol (Numbers of Spliced Belts)Mean Splice Rupture Strength,
[kN/m]
Splice Strength vs. the Required Value, [%]Splice Strength vs. the Strength Recorded for Splices of Identical Belts, [%]Splice Strength vs. the Nominal Belt Strength, [%]
1-12-23-3
1-1670105---67
2-2635100---64
3-3780122---78
1-2468737074-47
1-36059590-7861
2-361396-977961
Publisher’s Note: MDPI stays neutral with regard to jurisdictional claims in published maps and institutional affiliations.

