1. State of Photovoltaics Development in the World
The global use of renewable energy sources (RES) is steadily increasing, which is due, among other things, to the rapid increase in demand for energy in countries that have so far been less developed [
1]. Other reasons include the desire of various countries to become self-sufficient in energy, significant local environmental problems, as well as falling prices of renewable energy technologies—mainly photovoltaic and wind power stations. Furthermore, at least for some OECD countries, it is important to mention the pursuit of the climate protection objectives adopted at the Conference of the Parties (COP21), which took place in Paris from the 30 November to the 11 December 2015 [
2]. The objective of the then signed climate agreement, which was to enter into force in 2020, is to reduce greenhouse gas emissions by 2050 to keep global temperature rise below 2 °C concerning the pre-industrial era and to achieve climate neutrality after 2050. In the case of the European Union, the directions for achieving these objectives are set out in the document package “Clean Energy for all Europeans,” which was accepted by the European Parliament and the Council of the European Union. The last four of its eight acts were adopted by the Council of the European Union on 22 May 2019 [
3]. Achieving the assumed objectives requires, among other things, a further increase in the use of sources of renewable energy (RES), whereby in the case of power engineering, this mainly concerns wind and photovoltaic power stations.
Based on the International Renewable Energy Agency’s (IRENA) data, on the use and capacity of RES in the world, it can be concluded that the above-mentioned RES technologies have developed fastest over the last ten years (2010–2019) [
4]. As shown in
Table 1, the installed overall capacity of photovoltaic systems (PV) has increased particularly quickly by as much as 14 times. The growth of the wind power sector has become slightly slower, as the installed capacity of these power stations on land (onshore) has increased three times, and at sea (offshore) about 9 times. Note that the onshore wind power station grew much earlier than offshore with the installed capacity of the latter equal to only 2.134 GW in 2009 [
5]. On the other hand, in 2009 the installed capacity of photovoltaic installations was almost seven times lower than that of onshore wind farms and in 2018 the installed capacity of both technologies was already on a similar level. Overall, the total installed capacity of RES has doubled compared to 2009 [
5].
Looking at the impressive increases in the installed capacity of photovoltaic power stations, one must keep in mind that, unfortunately, its use during the year is small and based on various items of literature is averages between 1100 and 1600 h/a [
1] or about 1650 h [
6] and based on website Weather Online [
7,
8] in the period 2006–2018 is 1713 h, while in 2014–2018 it is 1769.1 h. Please remember that the numbers refer to the specific situation in Poland and will be different e.g., for countries in the solar belt. As a result, even though in 2017, for example, the share of installed photovoltaic power was 17.57% of the total installed overall capacity of RES, the share of electricity produced in the photovoltaic installation was only 6.88% [
5]. If we take into account the fact that in 2017 the production of electricity from renewable sources (hydro + non-hydro renewables and waste) was 24.9% [
5], the electricity produced in photovoltaic installations represented only 1.71% of total production. Therefore, if the International Renewable Energy Agency IRENA [
5] forecasts that photovoltaics should cover one-fourth of global electricity demand in 2050, it needs to further grow intensively, not only in countries that have already invested heavily in this technology.
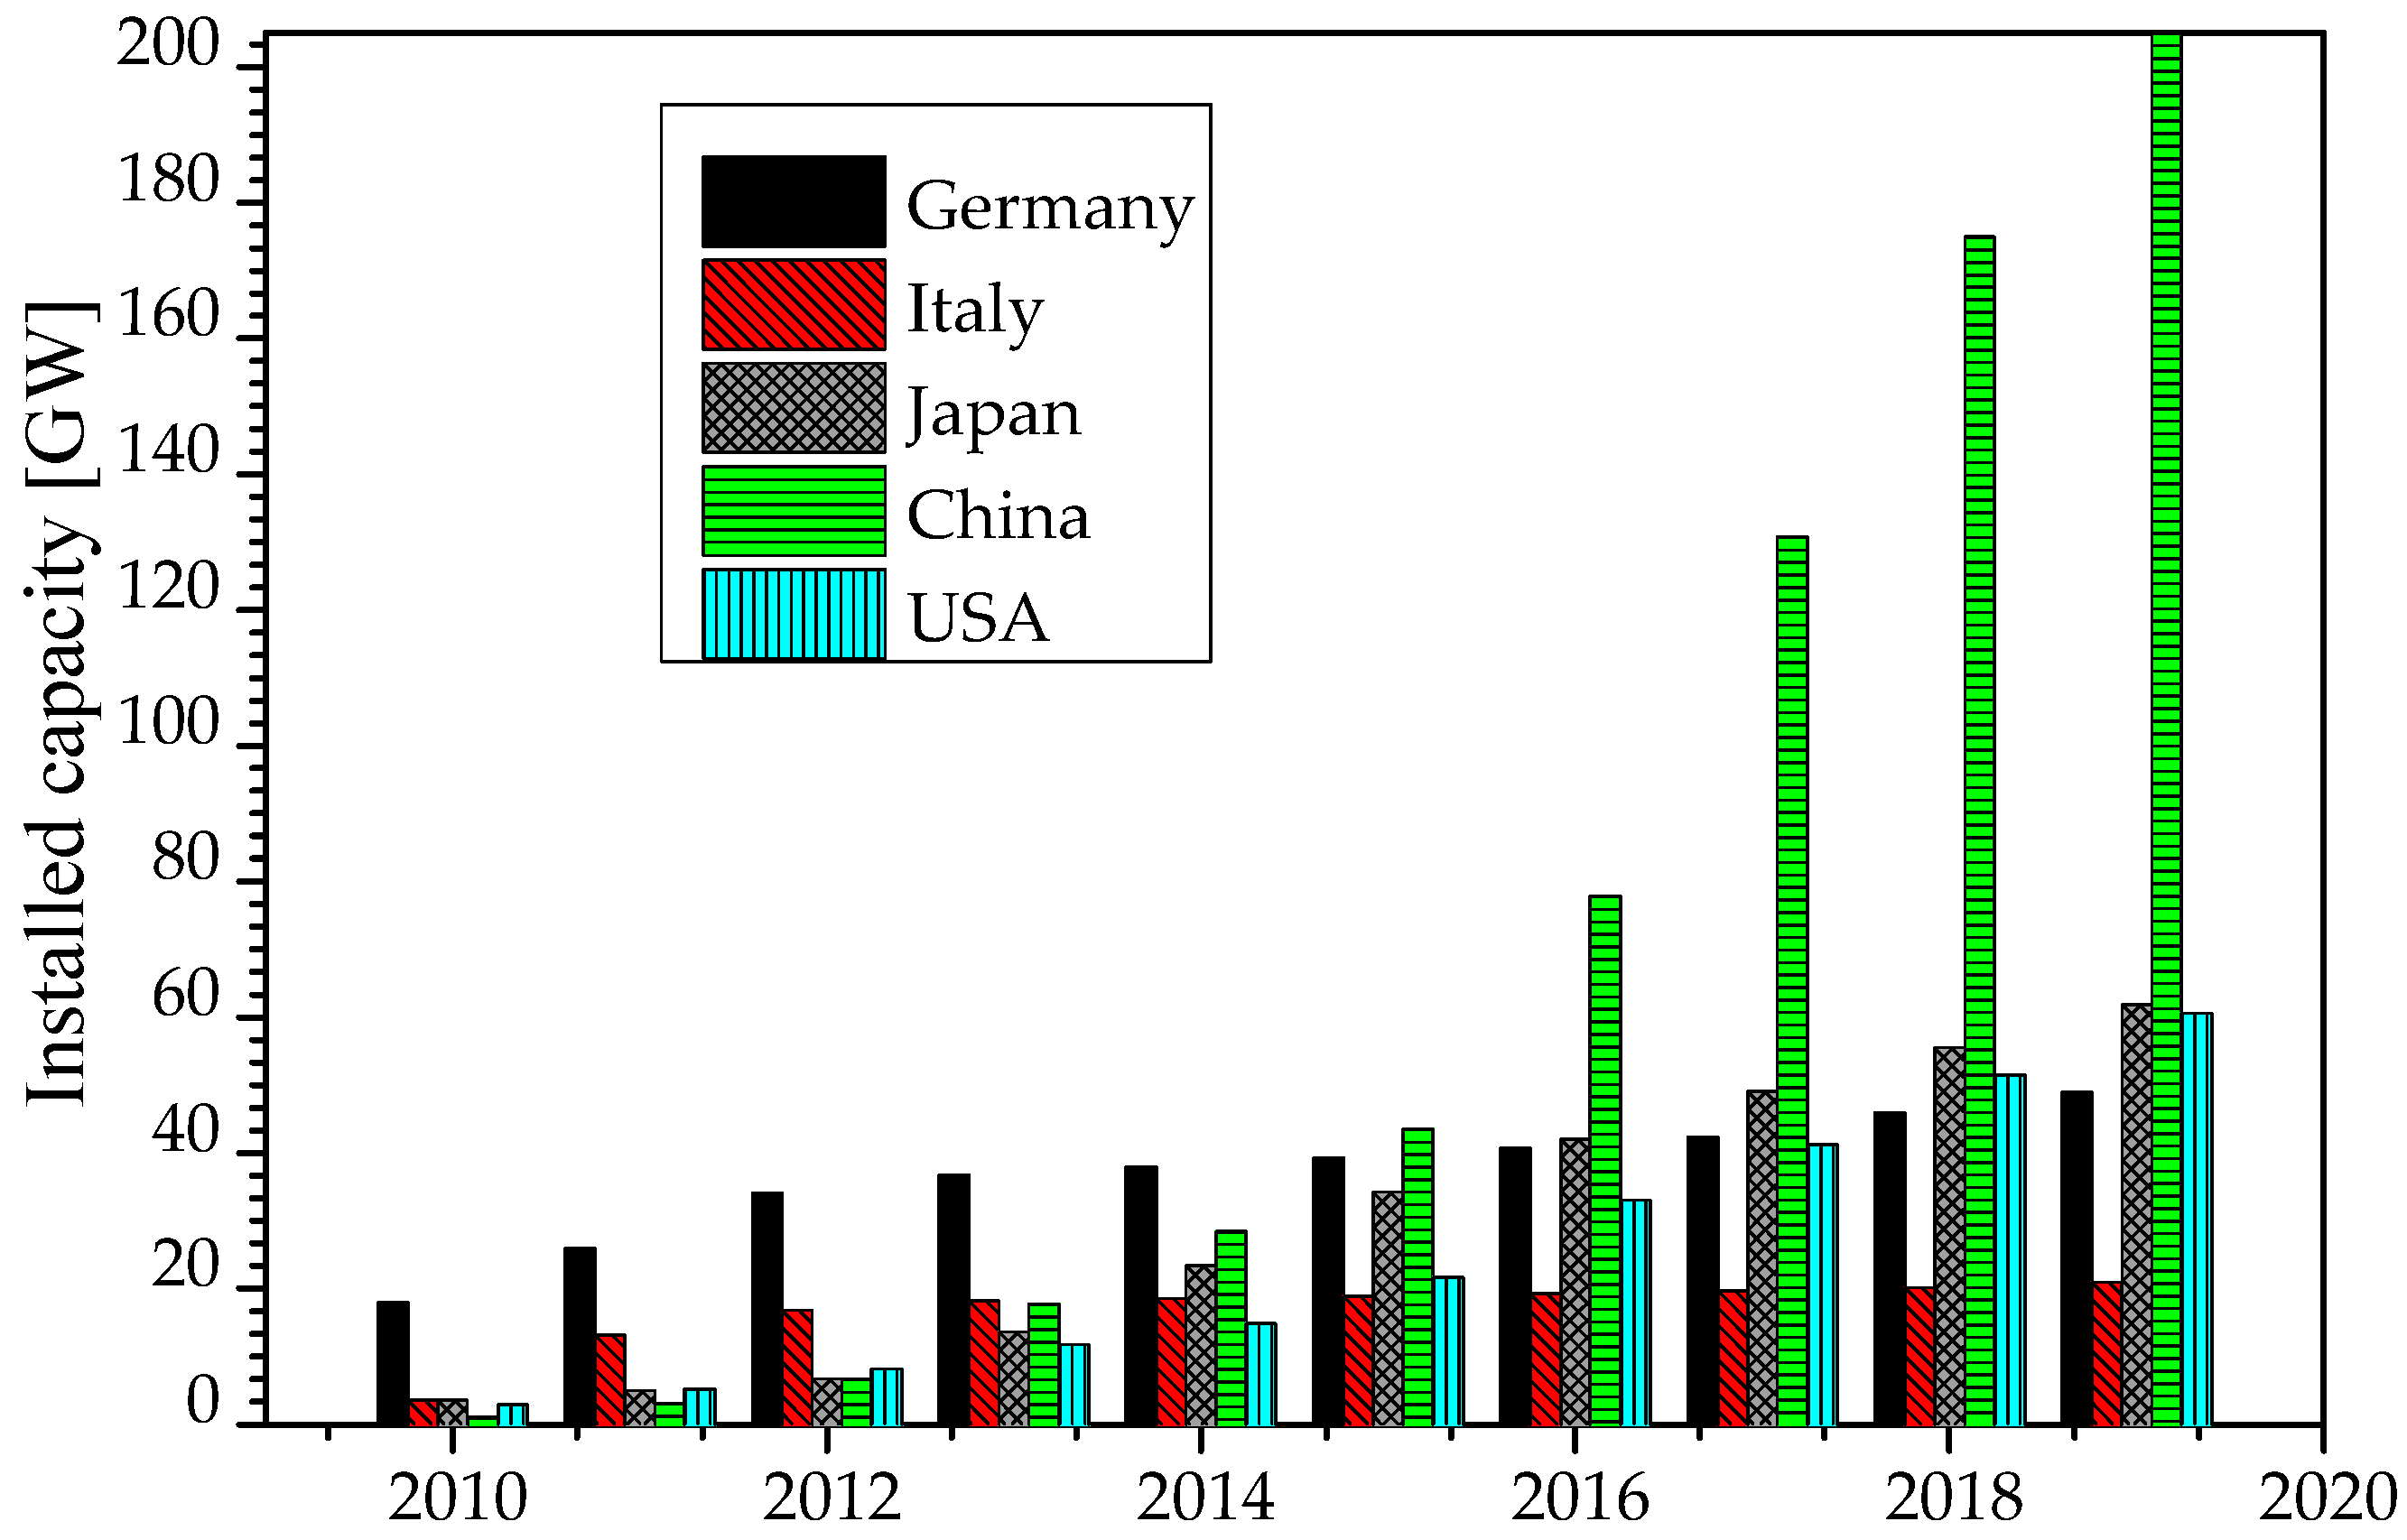
Figure 1 shows the changes in installed capacity in the countries currently leading the development of photovoltaics. As one can see, for a very long time Germany was in the first place, but in 2015 it was overtaken by China, which invested heavily in various energy technologies, including photovoltaics. Interestingly, in 2009, the installed capacity of these installations in China was only 415 MW. Japan has been in second place in terms of installed capacity of photovoltaic installations since 2016, and in 2018 the USA overtook Germany. There has been a clear stagnation in the development of photovoltaics in Italy, with India joining the five countries with the highest installed capacity of this technology, ahead of Italy in 2018 with an installed capacity equal to approximately 26 GW.
When predicting the development of photovoltaics, one should not forget about the associated problems and should strive to solve them. For example, the production of photovoltaic modules requires large quantities of aggressive chemicals, so it is necessary to take appropriate measures to ensure its safety for the environment [
9,
10]. The periodic nature of operation of photovoltaic power stations, as well as wind power stations, requires the development of an energy storage technology if their use is to increase [
11]. Finally, the problem of decommissioning of obsolete generation facilities and the associated, “availability, including recyclability, of the resources needed for the production of wind and solar power stations” is often overlooked or neglected [
12].
2. RES in Poland’s Energy Policy
One of Poland’s climate and energy objectives as set out in the, “National Plan of Energy and Climate 2021–2030”, concerns the use of energy from renewable sources [
13]. According to the Plan, in 2030 the share of RES in gross final energy consumption should be 21–23%. However, the above-mentioned document stipulates that this objective is “conditional, i.e., that its implementation at the level of 23% will be possible if Poland receives additional EU funds, including those allocated to equitable transformation” [
13]. Indeed, in Poland, increasing the use of renewable energy sources is a great challenge if one considers that in 2018 about 80% of its electricity [
14] and about 70% of its district heat [
15] was generated from hard coal and lignite. According to the provisions of the document in question, the share of coal in the power industry is expected to decline and should amount to 56–60% in 2030, while the share of RES would increase to approximately 32%. For comparison, in 2018 the share of power stations using renewable forms of energy in the national electricity production was equal to 7.24% [
14] and in 2009 it was only 0.55% [
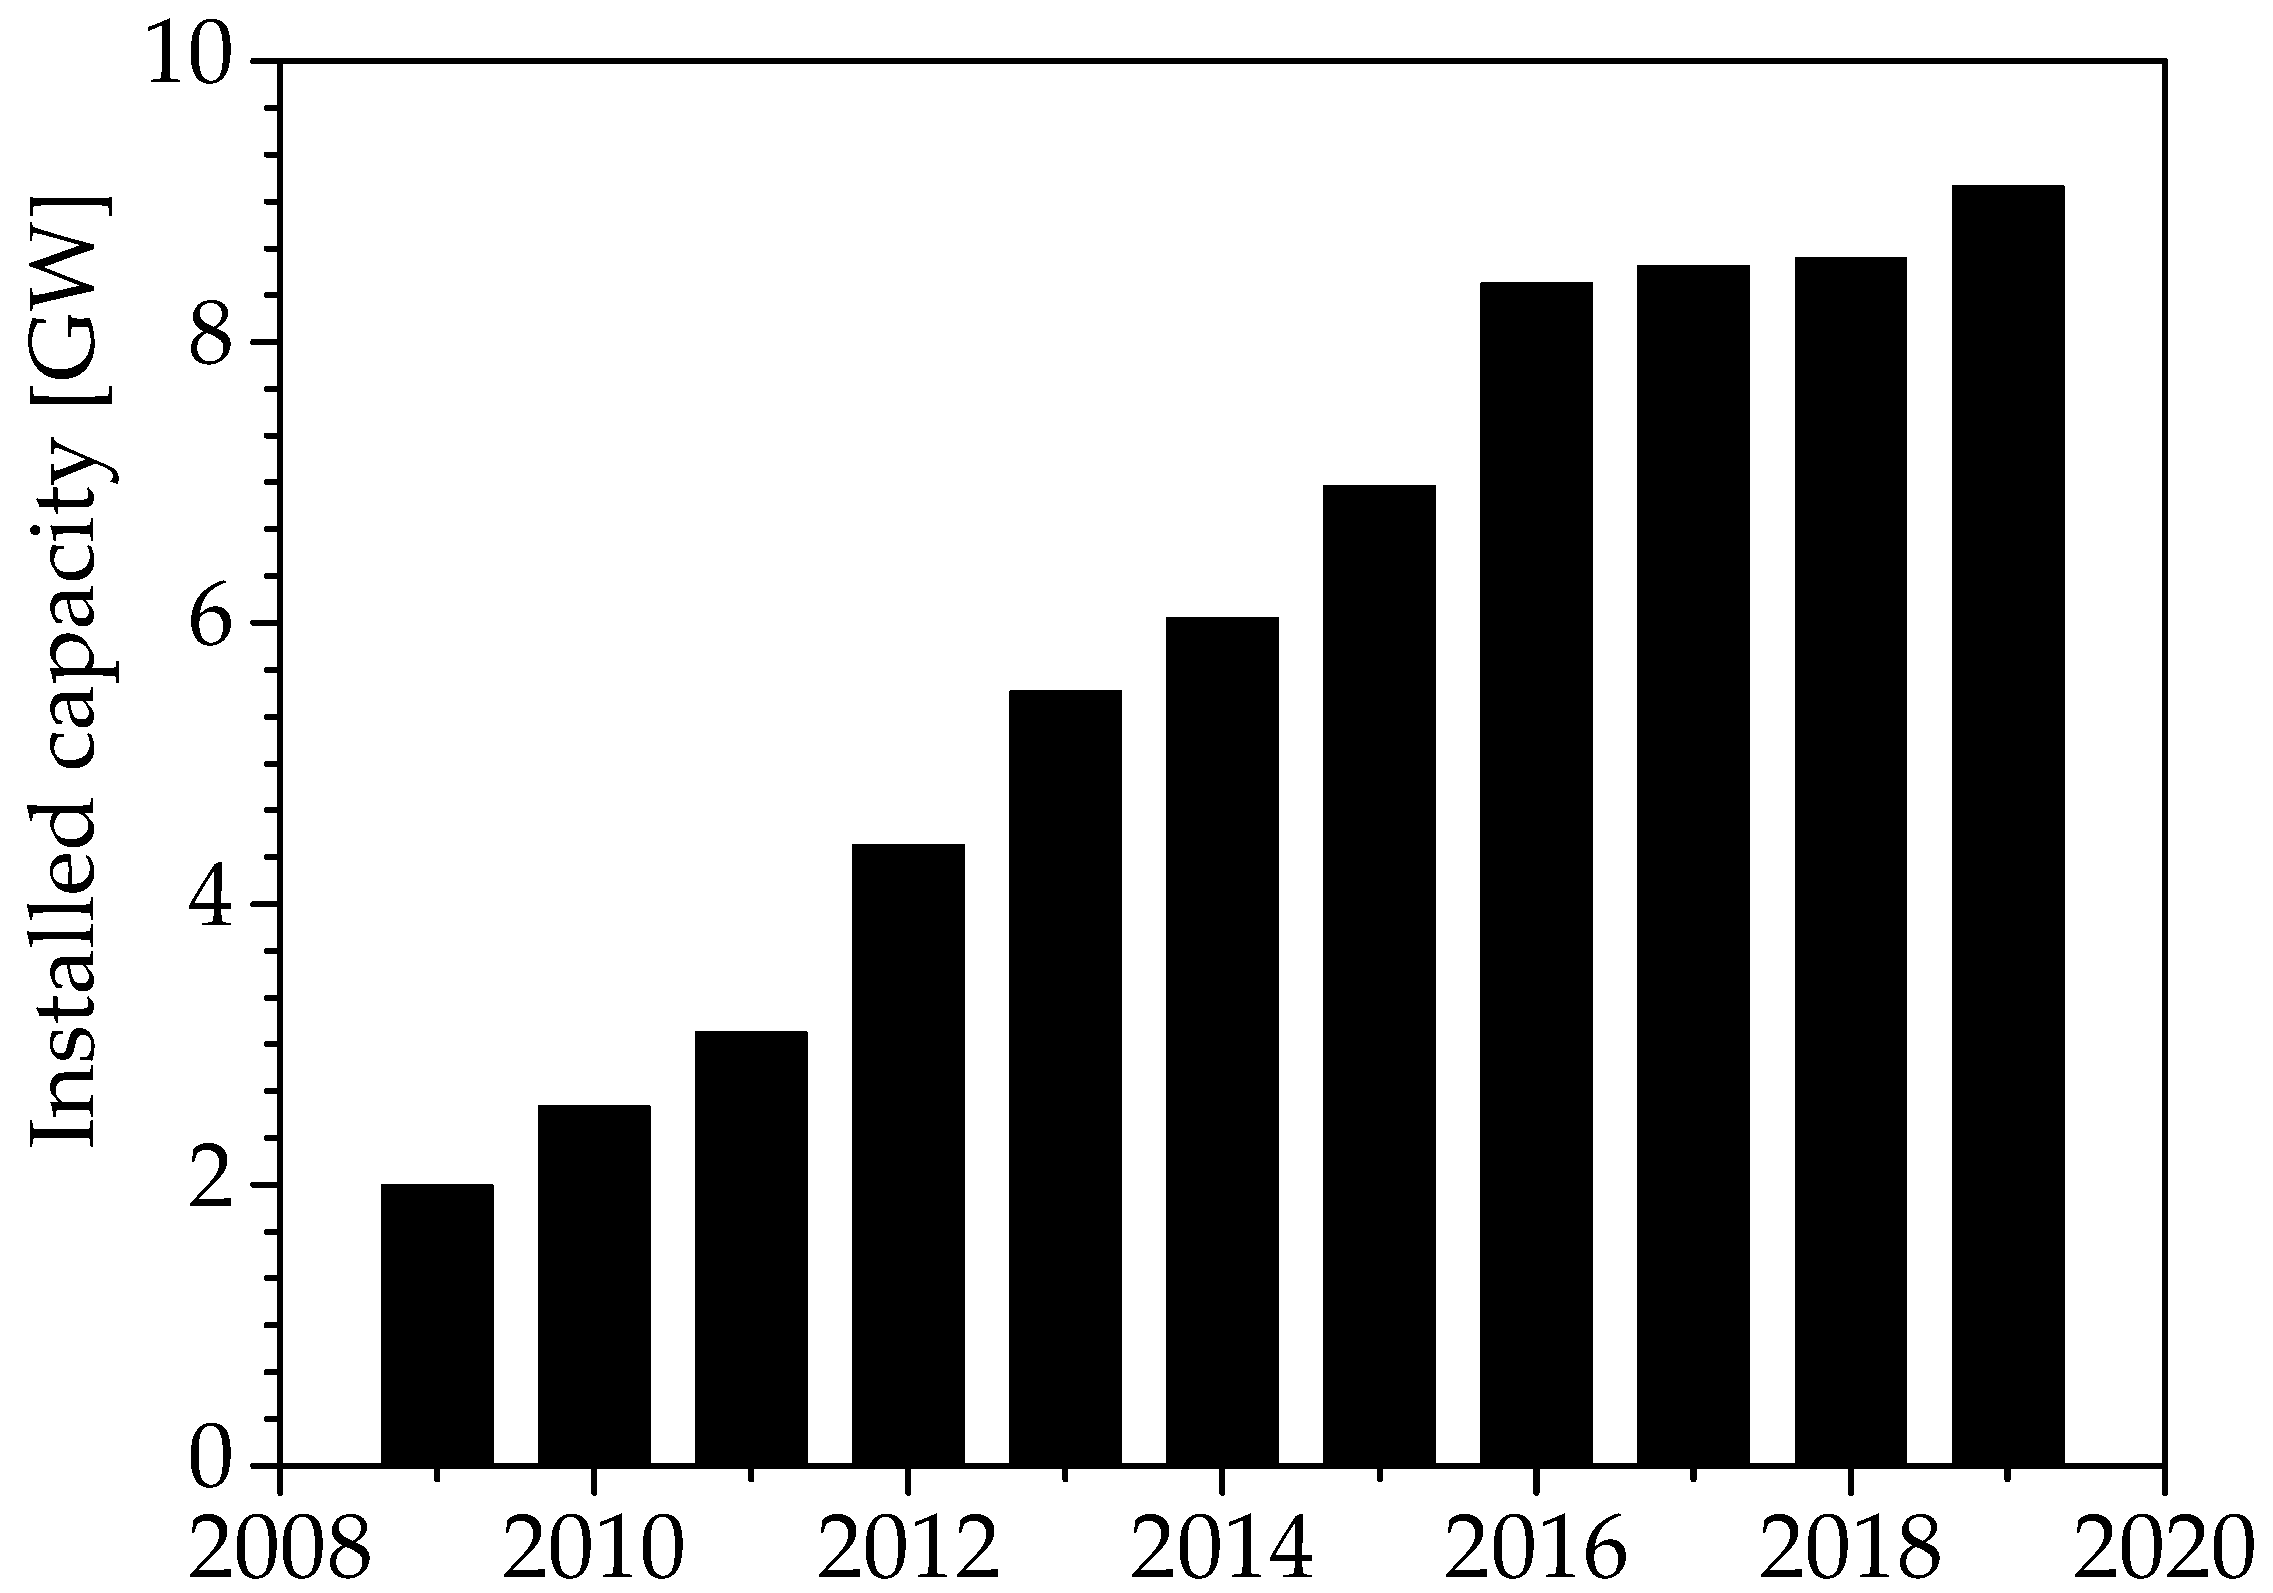
16]. Among the RES installations in 2010, the first place was taken by wind power stations, whose installed capacity accounted for 46% of the total installed capacity. This share grew in subsequent years and in 2016 it was 69% (5,807,416 MW). Unfavorable legislative solutions for wind energy in the same year resulted in only small increases in installed wind energy capacity in the following years, which also resulted in a slowdown in the growth of the total installed capacity of RES in the power system [
17]. In 2017, the unfavorable provisions were partially changed, but the deficiencies of the legal environment in which renewable energy operates disrupted its development.
Figure 2 shows the total installed capacity of the licensed RES installations in 2009–2019 based on data from the Energy Regulatory Office.
In 2015, the Act on Renewable Energy Sources [
19] introduced an auction support system for RES, whose goal is growth in their generation capacity in the country’s power system. The Energy Regulatory Office in Poland (ERO) communication issued on the occasion of the 5th anniversary of the system’s operation stated, among others [
20]: “The beneficiaries of the auction system are mainly producers who use solar and onshore wind energy to generate electricity. The remaining technologies are marginal, although there is still potential in the biogas technology projects.” The same publication estimated, based on the results of the auctions held in 2016–2019, that “about 3.4 GW of newly installed capacity in the wind technology, about 1.7 GW in the PV technology, and less than 70 MW of newly installed capacity in other RES technologies may be created.” A decrease was also observed in production costs, especially in wind installations, but also in photovoltaic installations, because “the average price from the bids won in 2017 was 372 PLN/MWh, in 2018 it was only 352 PLN/MWh, and in 2019–317 PLN/MWh.” The winning projects are dominated by new installations, i.e., installations which would start generating electricity after the auction session closing date. In general, “more than 2000 installations were supported in the auctions held between 2016 and 2019. The total value of energy covered by the winning offers amounted to more than PLN 38 billion” [
20].
3. The Status and Prospects of Photovoltaics in Poland
Poland is one of the countries where the development of photovoltaics started late and only at the end of 2011 its installed capacity exceeded 1 MW [
18]. In the following years, the process accelerated and at the end of 2019 the installed capacity of photovoltaic installations connected to the power grid was almost 1300 MW. In the same year Poland was ranked fifth in the EU in terms of new PV capacity growth [
21]. However, one must keep in mind that these values of capacity are still very small.
Table 2 shows the changes in the installed capacity of photovoltaic installations in Poland in 2011–2019. The data shown are related to the total capacity and the capacity of large and small PV facilities. The difference between the capacity values specified for a given year is the installed capacity of the so-called micro-installations, i.e., photovoltaic installations with the total installed electrical power of no more than 50 kW that are connected to the power grid with the nominal voltage lower than 110 kV [
21]. As you can see, the share of micro-installations in the total installed photovoltaic power has been growing steadily, to exceed the capacity of other installations in 2017. At the end of 2019, the capacity of micro-installations represented 63% of the total installed photovoltaic capacity. According to the report of the Institute for Renewable Energy (IEO) titled, “Photovoltaic Market in Poland 2019” [
22], “a significant part of photovoltaic micro-installations (approx. 75% of the power) are installations made by individual prosumers (as defined in the Renewable Energy Act [
19]), which means that in practice these are installations on individuals’ properties, while the rest are micro-installations at businesses.” This makes Poland’s photovoltaics, unlike those of many countries in Europe, very dispersed. The establishment of prosumer installation is undoubtedly favored by numerous support schemes such as the subsidy under the, “My Electricity” program, the discount scheme, and the preferential loans offered by some banks. The government priority program, “My Electricity” plays a special role in increasing the installed capacity of micro-installations [
23]. This program, piloted by the Ministry of Climate and Environment, concerns the co-financing of photovoltaic micro-installations with installed capacities from 2 to 10 kW and is addressed to households. A prosumer may obtain a grant covering up to 50% of the purchase and assembly costs of the installation, but not more than PLN 5000. The program is planned for 2019–2025 or until the funds allocated for this purpose are exhausted (PLN 1 billion). They come from the EU CO
2 Emissions Trading System (EU ETS). The interest in obtaining funding was so great that the budget was exhausted in the first two editions of the program in 2019 and 2020. The availability of domestic solutions and devices for micro-installations on the market was undoubtedly a favorable factor. Polish companies mainly offer roof installations, as well as installations integrated with the building, and to a lesser extent, products for photovoltaic farms. As a result, in 2020, a steep increase in the installed capacity of the PV installation in the National Power System was achieved: on 1 January 2020 it was 1300 MW, and on 1 November 2020 it was already over 160% more, i.e., 3430 MW. Therefore, the assumed goal was achieved, which was to obtain an additional micro-installation capacity of at least 1000 MW. Despite the significant increase in installed photovoltaic capacity in the Polish power sector, its share in the total installed capacity is still small and amounted to less than 3% in 2019. The share of installed capacity of all RES was almost 16% (the installed capacity in the National Power System at the end of 2019 was 46,799 MW) [
24].
High hopes for a significant increase in the capacity of photovoltaic power stations are linked to the aforementioned auction system. In 2016–2018, three auctions for installations with a capacity of up to 1 MW were won by photovoltaic projects with a total capacity of 871 MW [
22]. In the auction held on 10 December 2019 for new wind and photovoltaic installations with capacity not exceeding 1 MW, all bids (1044) were for PV installations. As a result of the auction, 759 projects won, with the total capacity of approximately 900 MW [
25]. Thus, the power of the winning PV projects in auctions held in 2016–2019 was almost 1.8 GW. For various reasons, not all investment projects will be implemented, but it would still be a very large capacity increase if we consider the situation at the end of 2019 and the intensive growth of micro-installations. Assuming a similar increase in the capacity of micro-installations in 2019, the total new capacity in photovoltaics will be 3.6 GW. If we take into account that the time to implement the winning projects is now 24 months (temporarily it was 18 months), the statutory deadline for the implementation of projects from the auction held in December 2019 is the end of December 2022.
In the case of large installations, the problem is to obtain bank financing on which the development of RES in 2006–2015 was based [
22]. The banks so far involved in RES projects have become cautious due to the outstanding loans granted so far mainly for wind investment projects. This was mainly due to the instability of the law and not always well-thought-out legal provisions (e.g., the issues associated with the so-called, “windmill law”) [
17]. Another factor that may hurt the implementation of the winning projects is the supply of components for photovoltaic farms. It turns out that China has the dominant share in the world’s production of photovoltaic modules (in 2019 it was equal to 72% [
26,
27]) and the global coronavirus pandemic has resulted in a reduction of its production volumes and a disruption of supply. Reduced supply may, of course, lead to higher prices and thus to higher investment costs. In the case of prosumers, the situation looks better, as they use mainly modules made in Poland—Polish companies provide about 50% of the supplies [
26,
27].
The current economic crisis has shown how dangerous it is to rely on suppliers from China and other Asian countries for photovoltaic investment projects. This dependence is also unfavorable because of the expected further increase in demand for photovoltaic modules in the world and, as Bett [
10] rightly points out, Europe should not give away this huge market to China, but should have its share in it. It is a good thing that, as set out in [
27] “more than 90 companies and research institutions from 15 EU countries have signed the declaration and launched the Solar Europe Now campaign,” the primary objective of which is “a renaissance of a globally competitive European photovoltaic industry.” The duration of support to RES in the auction system will end in 2021. Currently, the Ministry of Climate is working on extending the support system for 5 more years. This was called for, among others, by the Polish Association of Photovoltaics [
28]. The acceleration of the growth of photovoltaics in recent years does not mean that the industry will be able to cope on its own now. Further government action to support not only photovoltaics but RES in general is necessary if their position in the energy market is to be strengthened, as well as to gain general economic benefits through increased investments, employment, and exports from companies operating in their environment.
On the basis of the draft Polish Energy Policy until 2040 [
29], it can be concluded that the development of renewable energy sources will be largely based on photovoltaics. The question about the economic viability of investments in this type of power station in current and anticipated conditions becomes relevant.
4. The Economic Viability of a Photovoltaic Farm in Polish Conditions
The paper analyses the costs of a model 1 MW photovoltaic farm located in the south-eastern part of Poland. The production of electricity from a photovoltaic farm during a year is highly variable, which is influenced by the solar radiation at a given time, the outdoor temperature, as well as the way the modules are installed, and their technology. For the analysis it was assumed that a 1 MW photovoltaic farm generates 1106.4 MWh of electricity during the year [
30]. Such an installation operates only for 118 h a year with its full rated power, while during the remaining hours its production significantly drops and for almost a half of the year it is equal to zero [
30,
31]. Please remember that the number-assessed data refer to the specific situation in Poland, based on available literature use the data published in Polish website CIRE [
30,
31], which is led by the Energy Market Agency SA (Agencja Rynku Energii Spółka Akcyjna—ARE SA). It is also possible to calculate these data from base “Typical Meteorological Year” (TMY) from Photovoltaic Geographical Information System (PVGIS) [
32], which include data for many countries, including Poland, with the option of selecting individual locations using interactive application.
The financial analysis of the project covers a period of 15 years of operation including the time of its implementation. Total capital investment outlays, based on the experience of investors in 2019 and the literature [
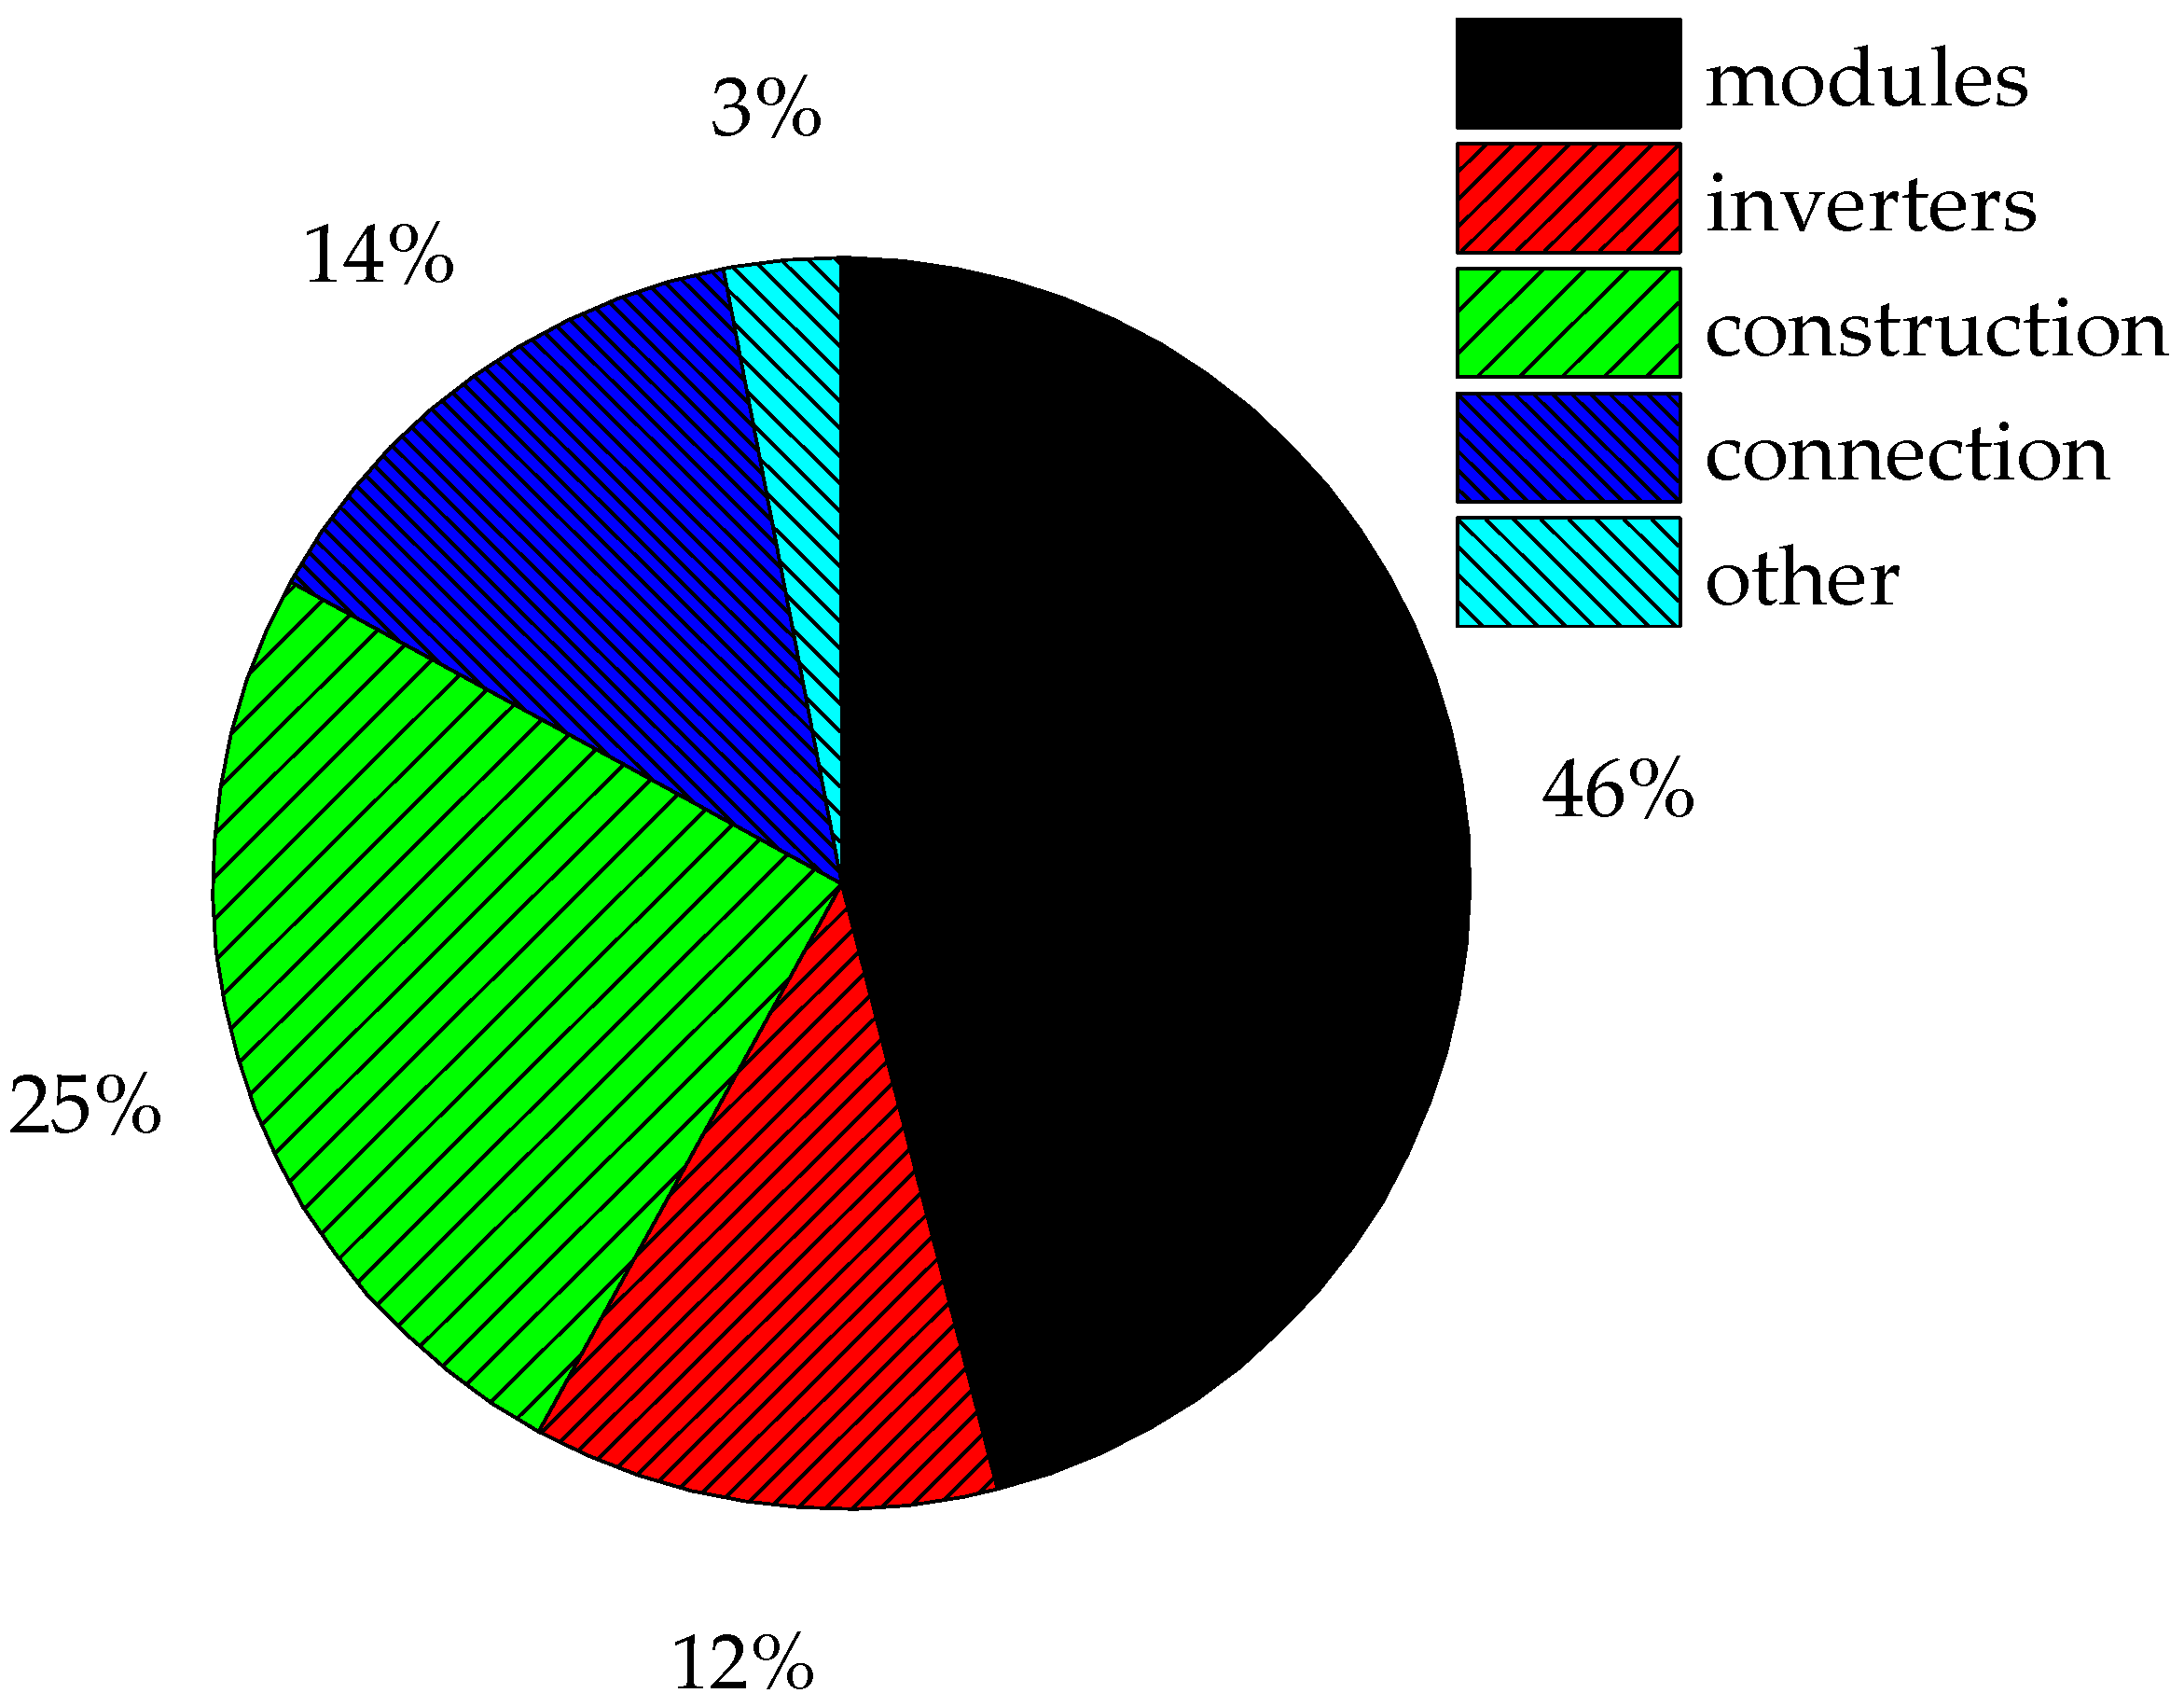
33], were assumed to be on the level of PLN 2,400,000 (case A). Due to the current market situation and the increase in prices, the economic analysis also includes an increase in the investment costs to PLN 3,500,000 (case B), and their components are presented in
Figure 3. We assume an increase of investment costs on the base’s actual situation on the market, expert opinions, and also the situation on the market in the context of the pandemic Covid-19, increase of work costs, problems with productions and delivers, and many others [
34,
35]. The method of financing of the project was tested in different options, depending on the adopted credit level. The assumed costs are covered by own funds and credit, which amount to (1) 0%, (2) 40%, and (3) 60% of the initial outlays, respectively. The annual interest rate of the loan was assumed to be the sum of the WIBOR 3M index and the bank’s margin of 3% [
30], with annual capitalization of interest starting from the day of the installation start-up. The discount rate in the analysis was assumed to be 8.5%. Three options of electricity selling costs were assumed. In Case I, the reference price for photovoltaics with unit capacity of up to 1 MW was assumed to be 385 PLN/MWh [
36]. This value was assumed based on the Polish Regulation of 15 May 2019 concerning the reference price [
37]. Cases II and III assume the prices from the last auction of 2019, i.e., the maximum price at which energy was sold: 327.00 PLN/MWh (case II), and the minimum price at which the energy was sold: 269 PLN/MWh (case III).
A characteristic feature of photovoltaic installations is zero variable costs of O and M. The value of operating costs was estimated at 72,109.44 PLN [
33]. These costs include the service charge, the property, and land tax, own electricity consumption equal to 500 kWh/month, and insurance costs for the installation in case of random events such as theft. The analysis included income tax at 19% and the depreciation rate of 7%. The depreciation base includes the cost of purchasing panels and inverters, the cost of installing the module support structure and the ground-surface work, and the cost of making the connection. The basic assumptions for all the options are shown in
Table 3.
Three indicators will be used to assess the economic efficiency. These values will allow us not only to determine whether the investment is profitable, but also to determine in which year the PV farm will start to bring profits. Cash flow (CF) is the aggregate the difference between income and expenses for a given period [
38,
39]. CF ratio is determined using the equation:
where: t—number of years.
The net present value (NPV) of the flow of profits over simulation time is calculated as the aggregated value of discounted annual profits and is given by:
where: CF
t—cash flow during the period t, r—discount rate,
I0—total investment costs, t—number of years, n—the final year of the calculation.
The internal rate of return (IRR) is the discount rate that makes the net present value (NPV) of all cash flows equal to zero in a discounted cash flow analysis. IRR calculations rely on the same formula as NPV does. The investment is profitable when the IRR assumes a higher value of the discount rate, when the difference between them is of greater value, the investment is more profitable (IRR > r). This factor can be represented by the equation [
38,
40]:
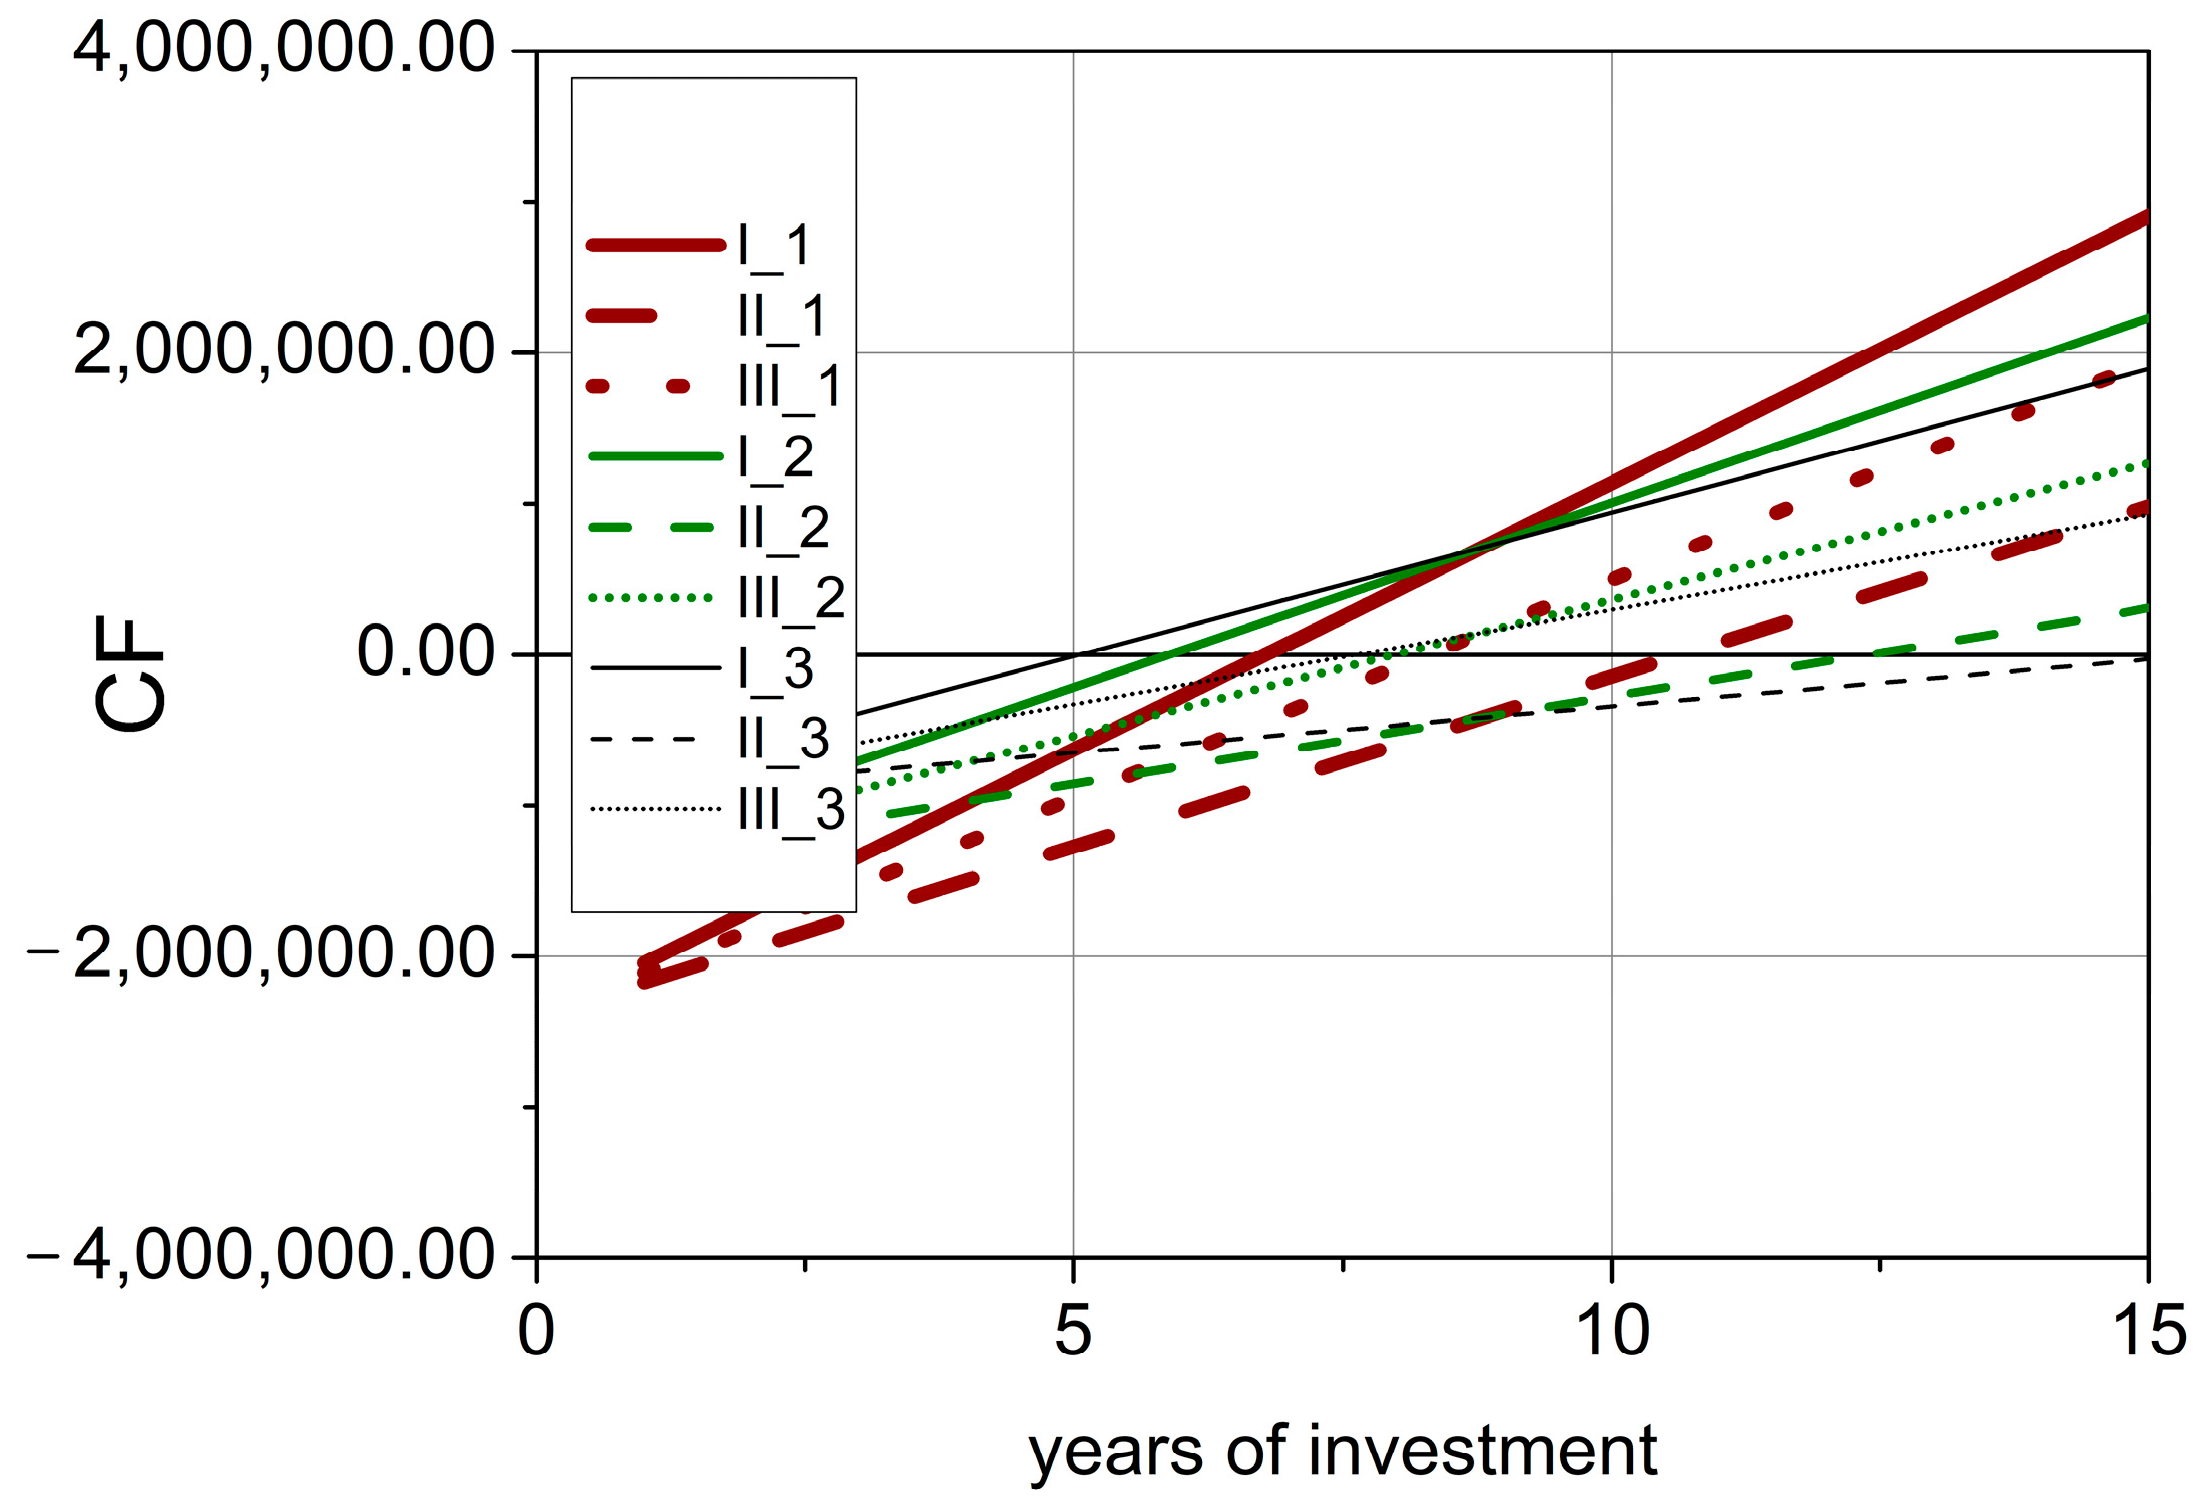
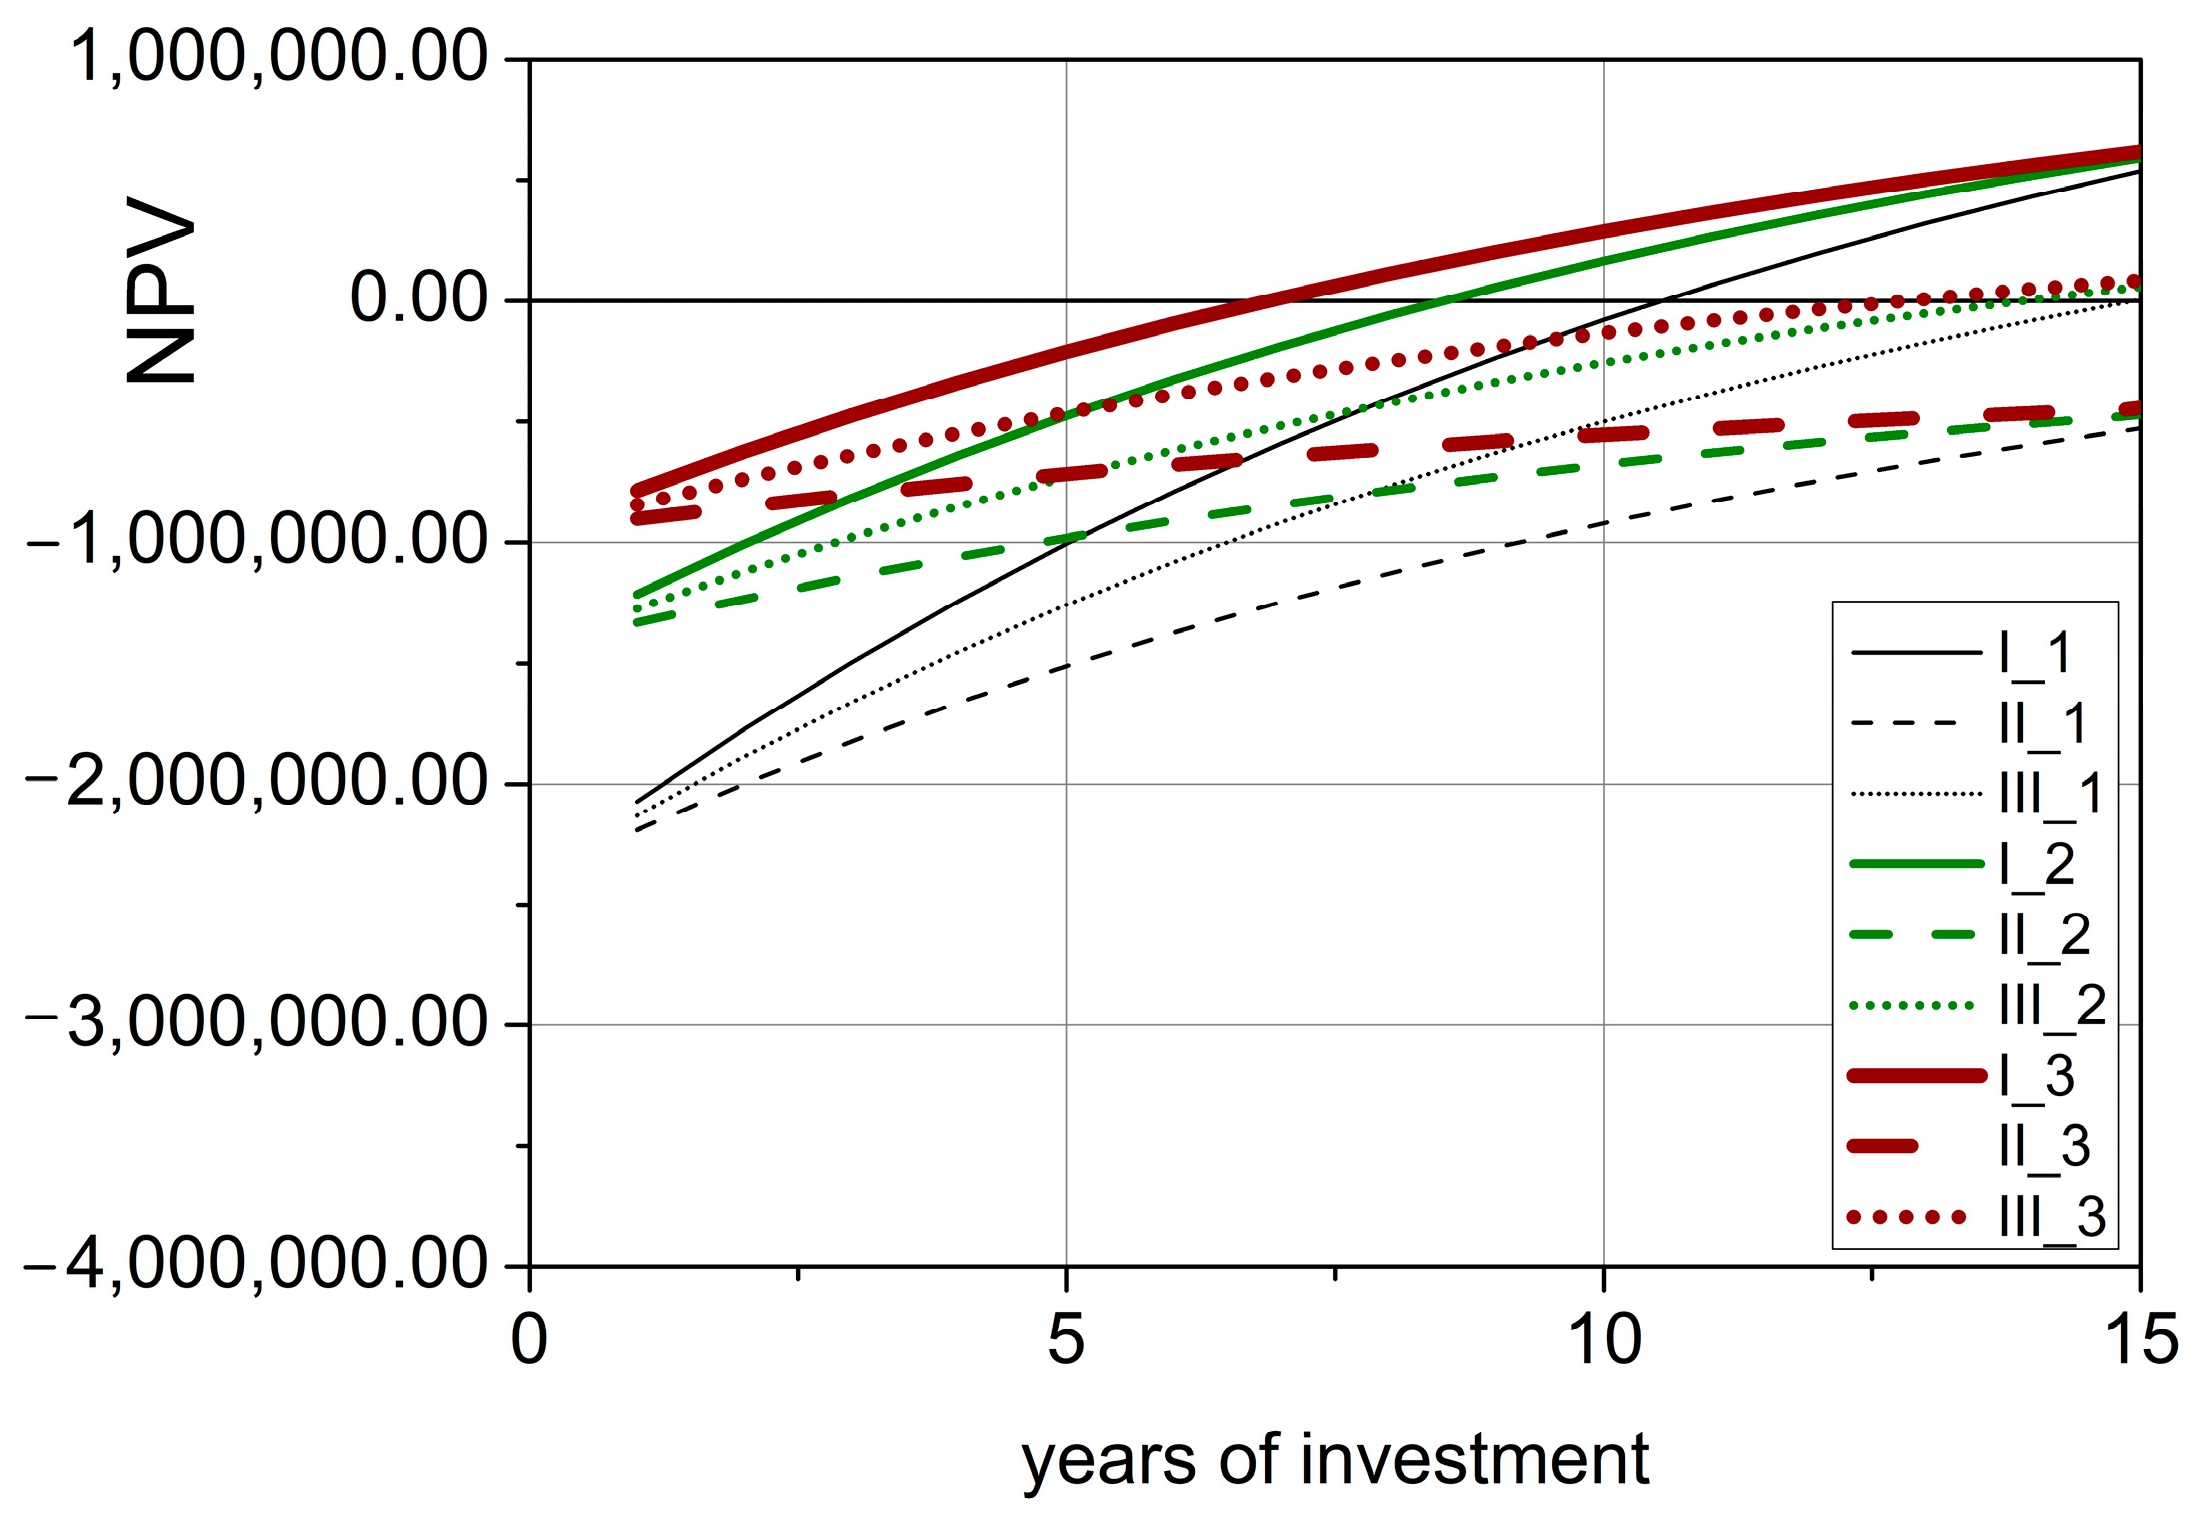
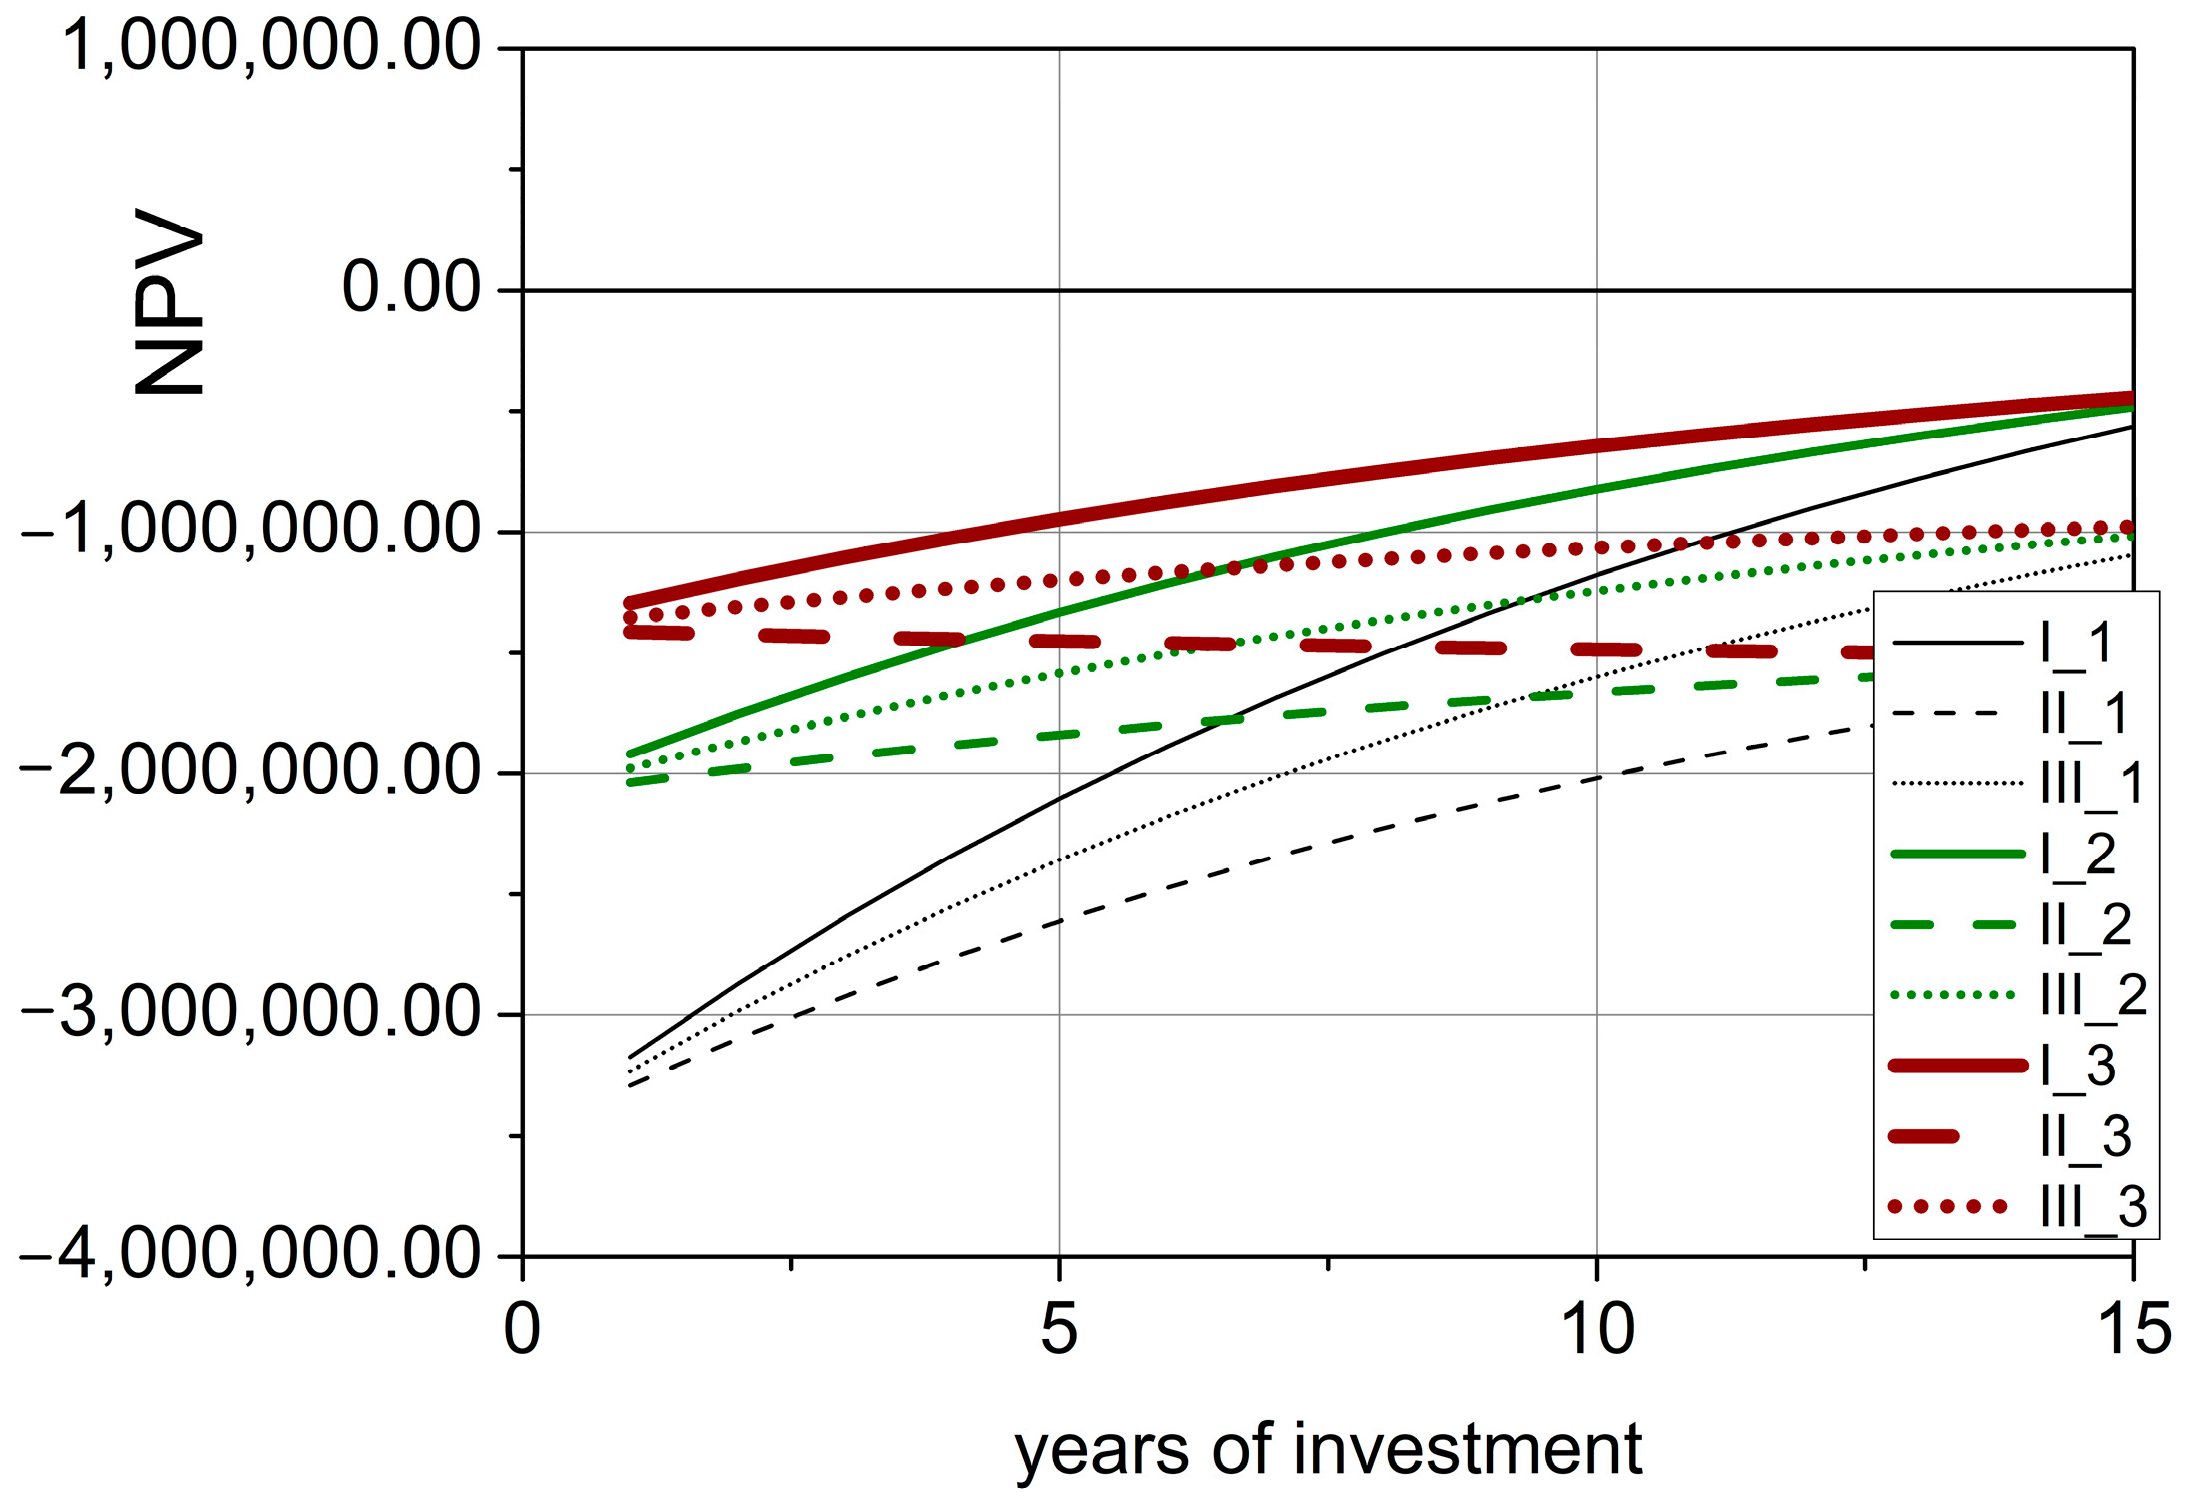
Figure 4 summarizes the value of the CF for all case A. The presented graph shows that the profitability of all cases A is from 5 to 12 years depended on the financial model of the investment. In contrast, all cases in B indicate worse economic rates. Because the CF does not take into account price fluctuation over time, so to determine a more accurate economic profitability, these effects will be presented below in form of the NPV ratio (see
Figure 5 and
Figure 6).
Therefore, the NPV of the investment was used as the fundamental criterion for assessing its profitability. A necessary condition justifying the economic sense of the investment is that the NPV value is greater than or equal to 0. The diagrams shown in
Figure 5 and
Figure 6 show the relationship between the NPV value achieved and the price of electricity. The analysis shows that with the given investment and technical assumptions, the options which are economically justified in the period of 15 years are those whose total investment outlays are equal to about PLN 2.4 million and for which the price of electricity is at least 327 PLN/MWh. The financing method is important to the speed of achieving a return on investment in the zero investment year. The most advantageous form turns out to be the financing of the investment with a loan equal to 60% of the investment outlays. In the event of an increase in the investment costs (case B), positive values of NPV are only achieved after more than 20 years of operation with the assumption that electricity is sold for the maximum reference price, which is expected to be lower in 2020 compared to the previous year.
In conclusion, the results of this economic analysis, i.e., after 15 years of operation of the photovoltaic system, presented in the form of the IRR indicator, confirmed the profitability of the investment at a sufficiently high sales price of electricity. The IRR indicators are shown in
Table 4. Since the IRR > r, the project should be accepted. For calculations the discount rate was assumed on level 8.5%. The cases that are profitable are in bold. All cases in B, from the point of view of this factor are unprofitable. Depending on the adopted assumptions, the results of the analysis may be different, which can be verified with a good and well thought-out financial model of the investment.
5. Conclusions and Summary
For several years now, Poland has been witnessing intensive growth in photovoltaics. As recently as 2012, its installed capacity was approximately 1 MW and in 2019 it reached 1300 MW. However, the installed capacity of Poland’s photovoltaic installations is still small compared to other leading European Union countries, such as Germany and Italy. Its percentage share in the total installed capacity of the national power industry is also very small: in 2019 it was only approximately 3%. Already in 2020, a rapid increase in the installed capacity of photovoltaic installations was noted and this trend should continue in the coming years. However, while in the last two years the increase in capacity was mainly due to micro-installations (mainly thanks to the already completed government support program “My Electricity”), in the coming years there should be an increase in the capacity of large installations supported by the auction system [
41,
42]. In the years 2021–2022, projects from the last three auctions should be commissioned, as the implementation of the winning auction projects from 2018 has been extended until May 2021. This was due to the problems related to the global coronavirus pandemic. The development of photovoltaic farms, however, still faces obstacles resulting mainly from the difficulties in obtaining financing and the availability of equipment for solar farms mainly from abroad on the market.
The economic analysis of an investment in a photovoltaic farm with a capacity of 1 MW showed moderate profitability. In the extremely optimistic option, i.e., the reference price for photovoltaics equal to 385 PLN/MWh, the simple payback time (SPBT) is 5 years. It should also be noted that the analysis was made with quite optimistic assumptions concerning the investment costs. Therefore, the fate of won investments at the lowest electricity prices and with the expected increase in investment outlays is uncertain. Without the possibility for obtaining loans for large photovoltaic investments, and without further state support in the form of an extension of the auction system, it will be difficult for photovoltaics to play a major role in the Polish electricity sector.
The growing ecological awareness of the society, as well as the desire to reduce growing electricity bills, result in a great interest in photovoltaics in households. However, the financial support from the state is of fundamental importance for the increase in the installed capacity of the micro-installation, as demonstrated by the implementation of the “My Electricity” program. Similarly, in the case of large projects, energy auctions are decisive for their growth. However, as shown in the article, winning the auction does not guarantee the implementation of the project.


