Article

Early Detection of Broken Rotor Bars in Inverter-Fed Induction Motors Using Speed Analysis of Startup Transients

by
Tomas A. Garcia-Calva
1,
Daniel Morinigo-Sotelo
2,*,
Vanessa Fernandez-Cavero
3,
Arturo Garcia-Perez
1 and
Rene de J. Romero-Troncoso
4
1
HSPdigital-Electronics Department, University of Guanajuato, Salamanca 36700, Mexico
2
Research Group HSPdigital-ADIRE, Institute of Advanced Production Technologies (ITAP), University of Valladolid, 47011 Valladolid, Spain
3
Miguel de Cervantes European University, 47012 Valladolid, Spain
4
HSPdigital-Mechatronics Department, Autonomous University of Queretaro, San Juan del Rio 76806, Mexico
*
Author to whom correspondence should be addressed.
Energies 2021, 14(5), 1469; https://doi.org/10.3390/en14051469
Submission received: 2 February 2021 / Revised: 19 February 2021 / Accepted: 1 March 2021 / Published: 8 March 2021
(This article belongs to the Special Issue Early Detection of Faults in Induction Motors)

Abstract

:
The fault diagnosis of electrical machines during startup transients has received increasing attention regarding the possibility of detecting faults early. Induction motors are no exception, and motor current signature analysis has become one of the most popular techniques for determining the condition of various motor components. However, in the case of inverter powered systems, the condition of a motor is difficult to determine from the stator current because fault signatures could overlap with other signatures produced by the inverter, low-slip operation, load oscillations, and other non-stationary conditions. This paper presents a speed signature analysis methodology for a reliable broken rotor bar diagnosis in inverter-fed induction motors. The proposed fault detection is based on tracking the speed fault signature in the time-frequency domain. As a result, different fault severity levels and load oscillations can be identified. The promising results show that this technique can be a good complement to the classic analysis of current signature analysis and reveals a high potential to overcome some of its drawbacks.

Graphical Abstract

1. Introduction

The use of induction motors (IMs) in industrial applications with variable speed systems is widespread because they are more reliable, versatile, and efficient than line-fed machines [1]. High-performance IMs are considered robust machines, but they require reliable condition monitoring systems to avoid unprogrammed stops in production lines and reduce maintenance costs. The rotor cages of IMs are usually made from copper bars; these bars are exposed to failures in applications with variable operating conditions because of the excessive mechanical stresses involved [2]. Much attention has been directed to the study of broken rotor bar (BRB) fault, because if undetected it can develop into catastrophic machine breakdown [3]. Many papers in the literature have studied the diagnosis and condition monitoring of the IM rotor, but most only deal with machines operating at a constant speed and whole broken rotor bars. Nowadays, variable speed systems where the IM is driven by voltage source inverters (VSIs) are more common; they are used in a wide range of applications—namely, material handling, lifting, textile, compressors, pumps, mills, winders, and lifts [4]. These VSIs are usually pulse width modulators (PWM) that produce non-sinusoidal voltages using a solid-state inverter by rapidly switching the output voltage on and off. It is known that no matter how accurate the switching of the PWM is, they are an inherent source of harmonic distortion in IM voltages and currents, which has a negative impact on the efficiency of fault detection techniques [5].
Motor current signature analysis (MCSA) is the most popular method in preventive maintenance and it is considered the reference technique for broken bar fault diagnosis in squirrel-cage motors. The stator current signature analysis of motors under transient operation (such as startup) has received special attention in the last decade as an alternative to improve the reliability of stationary analysis and reduce the rate of false alarms in the classic MCSA [6,7]. To do this, detection and diagnosis methodologies have been proposed based on time-frequency ( t , f ) decompositions capable of identifying fault signatures and complementing the analysis of the stationary current signals [8,9,10,11,12]. These works achieve the identification of fault signatures and extract condition indicators from the single-phase electrical current in the startup transient. Nevertheless, most of these methods assume a line-fed induction machine, and the analysis of transients, such as startups, in inverter-fed IMs is still an active field and an open question.
Different approaches for the condition monitoring of inverter-fed IMs under startup transient regimes have been studied recently [13,14]. BRB detection under non-stationary conditions consists of tracking fault-related signatures called sideband harmonics. Unlike motors powered directly from the grid, VSIs introduce several harmonic components produced by the PWM that overlap with these signatures, obstructing their recognition and the accuracy of the fault diagnosis. Different tools have been proposed to overcome these issues and improve the reliability of fault diagnostic methods based on transient analysis. These tools include adaptive transforms [15,16], non-linear signal decompositions [17,18], demodulation schemes [19,20,21], statistical methods [22,23,24], intelligent algorithms [25,26,27,28], and combined techniques. However, all these methodologies focus on the analysis of the stator current signal.
This paper proposes the analysis of the rotor speed signal for the detection of broken rotor bars at incipient states in inverter-fed induction motors during the startup transient. This technique is also used to distinguish load oscillations to avoid false positives. It is demonstrated that the speed analysis of induction motors in the time-frequency domain offers a reliable detection of broken rotor bars when the stator current analysis fails due to low-slip operation, load oscillations, overlapped signatures, and other non-stationary conditions. The proposed technique is used to obtain and evaluate speed fault pattern variations and evolutions along the startup transient. The method is applied to real speed signals from laboratory experiments and compared to the analysis of the stator current of an induction motors subjected to different fault severities and load oscillations. This proposal can be a valuable and attractive complement to other techniques based on stator current, vibrations, or thermal analysis [29,30,31]. Results demonstrate that the analysis of the motor speed during startups in VSI-fed IMs can detect broken rotor bars, even at low fault severities, and distinguish this fault from load oscillations to avoid false positives. This proposal can be a valuable and attractive complement to other techniques based on stator current analysis and can help to avoid false alarms in VSI-fed IM systems. The capability of speed analysis is examined in this work, which is an extended contribution of the conference paper presented in [32].

2. Influence of Rotor Fault on Motor Speed

2.1. Theoretical Background

Electrical current analysis techniques for detecting BRB in IM are based on how the power spectral density (PSD) of the stator current is affected. This fault type increases the bar resistance, produces asymmetry in the airgap’s electromagnetic field, and gives rise to sideband harmonics [33] located at:
f r f = f s ( 1 ± 2 k s ) , k = 1 , 2 , 3 ,
where f s is the power supply fundamental frequency, s is the rotor slip, and k is an integer. The low-order components (when ( k = 1 ) ) are of special interest for fault diagnosis because they have larger amplitudes than high-order components. The ( 1 2 s ) f s component is known as the left side-band harmonic (LSH) and the frequency component at ( 1 + 2 s ) f s is known as the right side-band harmonic (RSH), since they are located to the left and the right of f s in steady-state analysis. In a faulty IM, the air-gap torque is affected by the flux linkages and the stator currents. The linkages fluxes are given by:
ψ = v a R s i a d t ,
where v a is the stator voltage, R s is the stator resistance, and i a is the stator current. The interaction of the ( 1 ± 2 s ) f s components with the fundamental magnetic flux produces an oscillatory torque at frequency 2 s f s in the total torque, which is given by:
Γ ( t ) = Γ 0 + 3 P ψ k = 1 N I k s i n ( 2 k s f s t + α ψ α k ) ,
where Γ 0 is the dominant torque component produced by the fundamental component of the stator current, α k is the ripple phase, and P is the pole-pair number. The fault components at the torque ripple produce a low-frequency modulation on the motor speed, with twice the slip frequency when the rotor is damaged [34]. The content of the angular speed for a faulty motor can be modeled in (rad/sec) by [35]:
ω r ( t ) = ω m ( t ) + k = 1 N 3 P ψ J 2 s ω I k c o s ( 2 k s f s t + α ψ α k ) ,
This can be expressed in (r.p.m.) by:
n r ( t ) = 120 ω r ( t ) 4 π ,
where 2 k s f s are the speed oscillations due to the faulty rotor, J is the inertia, and ω m is the angular speed fundamental component for a healthy induction motor in r.p.m., given by:
n m ( t ) = 120 f s ( t ) P ( 1 2 s ( t ) ) .
The most used method to detect fault-related oscillations in induction motors is the steady-state analysis of the stator current based on frequency analysis by Fourier transform (FT). Spectral leakage around the first harmonic is the main drawback of this analysis, whose causes are non-strict stationary conditions, non-integral digital frequencies, and the inherent finite time window of the analysis [36]. A comparison of the stator current and the speed analysis performed on healthy and faulty conditions of the motor operating under steady state is shown in Figure 1. The fundamental supply frequency at 50 Hz is noticed in Figure 1a, where a concentration of leaked energy is present in adjacent spectral bins. The LSH is observed at 44.86 Hz with an amplitude of −35.7 dB in the current spectrum of the motor with one BRB. Its amplitude is higher than the LSH of the healthy motor with −38.58 dB, which may be undetectable without a speed reference. Figure 1a,b shows the spectra of the stator current and the speed of the same tests of an induction motor in healthy and faulty states (one broken rotor bar). For the latter, the spectrum shows an increase in the speed oscillation at a 2 s f s frequency of 11.3 dB compared to the same component for the healthy case. The spectral leakage around the dominant frequency f s (50 Hz) in the stator current spectra is significant when compared to the low level of leakage around the fundamental speed component n r (0 Hz).

2.2. Time-Frequency Analysis of Startup Transient

At start-up transient or speed variations, neither the current nor the rotor speed can be considered as stationary or deterministic processes because their amplitude, frequency, and phase are not constant, besides the fact that behaviors and measurements are susceptible to many disturbances and unpredictable errors such as digital quantization, external vibrations, noise, and other environmental effects. It becomes necessary to consider the signals as random processes. In this work, the ( t , f ) analysis of the speed signal is computed by a high-resolution PSD estimation called multiple signal classification (MUSIC), which is a frequency estimation technique based on eigen analysis. MUSIC algorithm requires a short number of observed points to offer a high-resolution spectrum estimation, which makes it a suitable technique for VSI-fed induction machines analysis at startup transient [37].
The PSD of n-observation samples of the speed process is defined as the discrete-time Fourier Transform of its autocorrelation sequence:
P x x ( f ) = T k = r n n [ k ] e j 2 π f k T ,
where the variable r n n [ k ] is the autocorrelation function of the n r [ k ] and is defined as n r [ k ] = E [ n r [ k ] n r [ k + l ] ] . The speed vector n r = [ n r ( 0 ) , , n r ( n 1 ) ] can be written as n r = x + η = Sa + η , where η is the additive noise in the measured signal and the x vector [ x ( m ) , x ( m + 1 ) , , x ( m + n 1 ) ] = Sa is defined as:
x = e j ω 1 m e j ω 2 m e j ω q m e j ω 1 ( m + 1 ) e j ω 2 ( m + 1 ) e j ω q ( m + 1 ) e j ω 1 ( m + n 1 ) e j ω 2 ( m + n 1 ) e j ω q ( m + n 1 ) a 1 e j 2 π ϕ 1 a 2 e j 2 π ϕ 2 a q e j 2 π ϕ q ,
The autocorrelation matrix of the measured mechanical speed can be written as the sum of the autocorrelation matrices of the signal x and the noise η as R n n = R x x + R η η . An eigen decomposition of R x x and R n n , s can be expressed as a linear combination of the principal eigenvectors [ v p + 1 , , v n ] [38]. In the multiple signal classifications algorithm, the power spectral density is defined as:
P x x ( f ) = k = p + 1 N s H ( f ) v k ( f ) 2 ,
where s ( f ) is the complex sinusoidal vector. Since P x x ( f ) has its zeros at the frequencies of the sinusoids, it follows that the reciprocal of P x x ( f ) has its poles at these frequencies. Therefore, the spectral estimation is computed as:
P ^ x x q ( f ) = 1 s H ( f ) V ( f ) V H ( f ) s ( f ) ,
where V = [ v p + 1 , , v n ] is the matrix of eigenvectors of the noise subspace. The resulted spectrum displays sharp peaks at frequencies of the mechanical speed oscillations, hence the PSD estimation is used for a high-resolution time-frequency analysis.

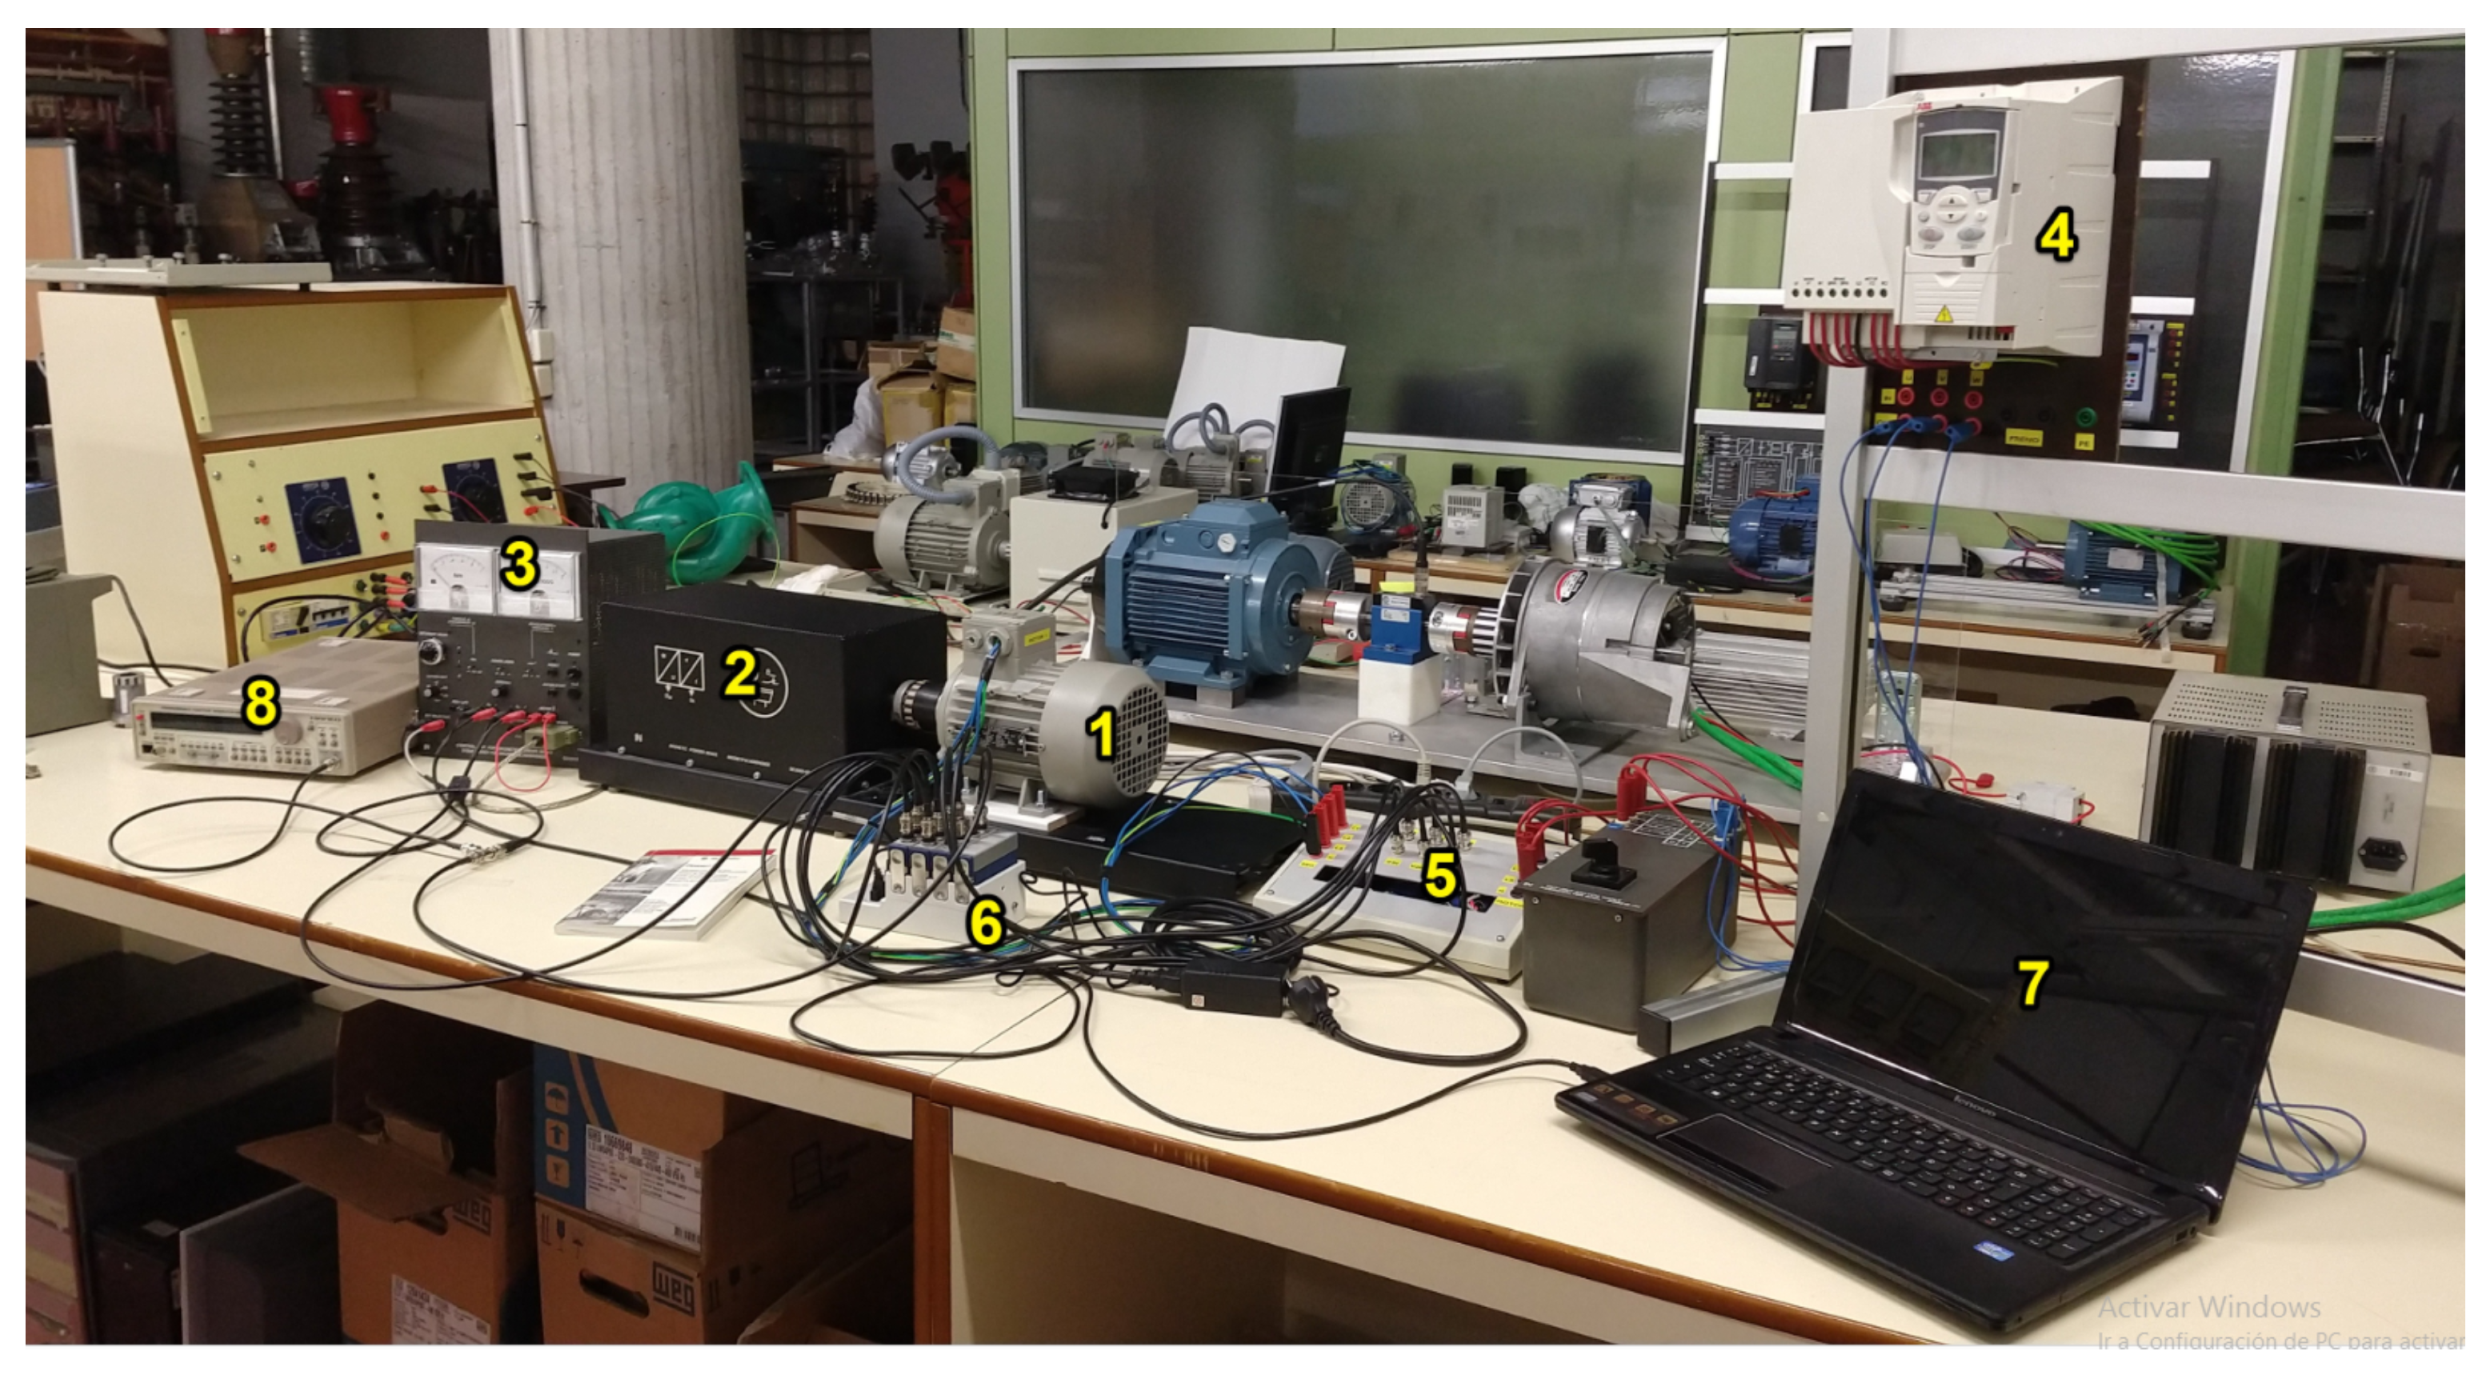
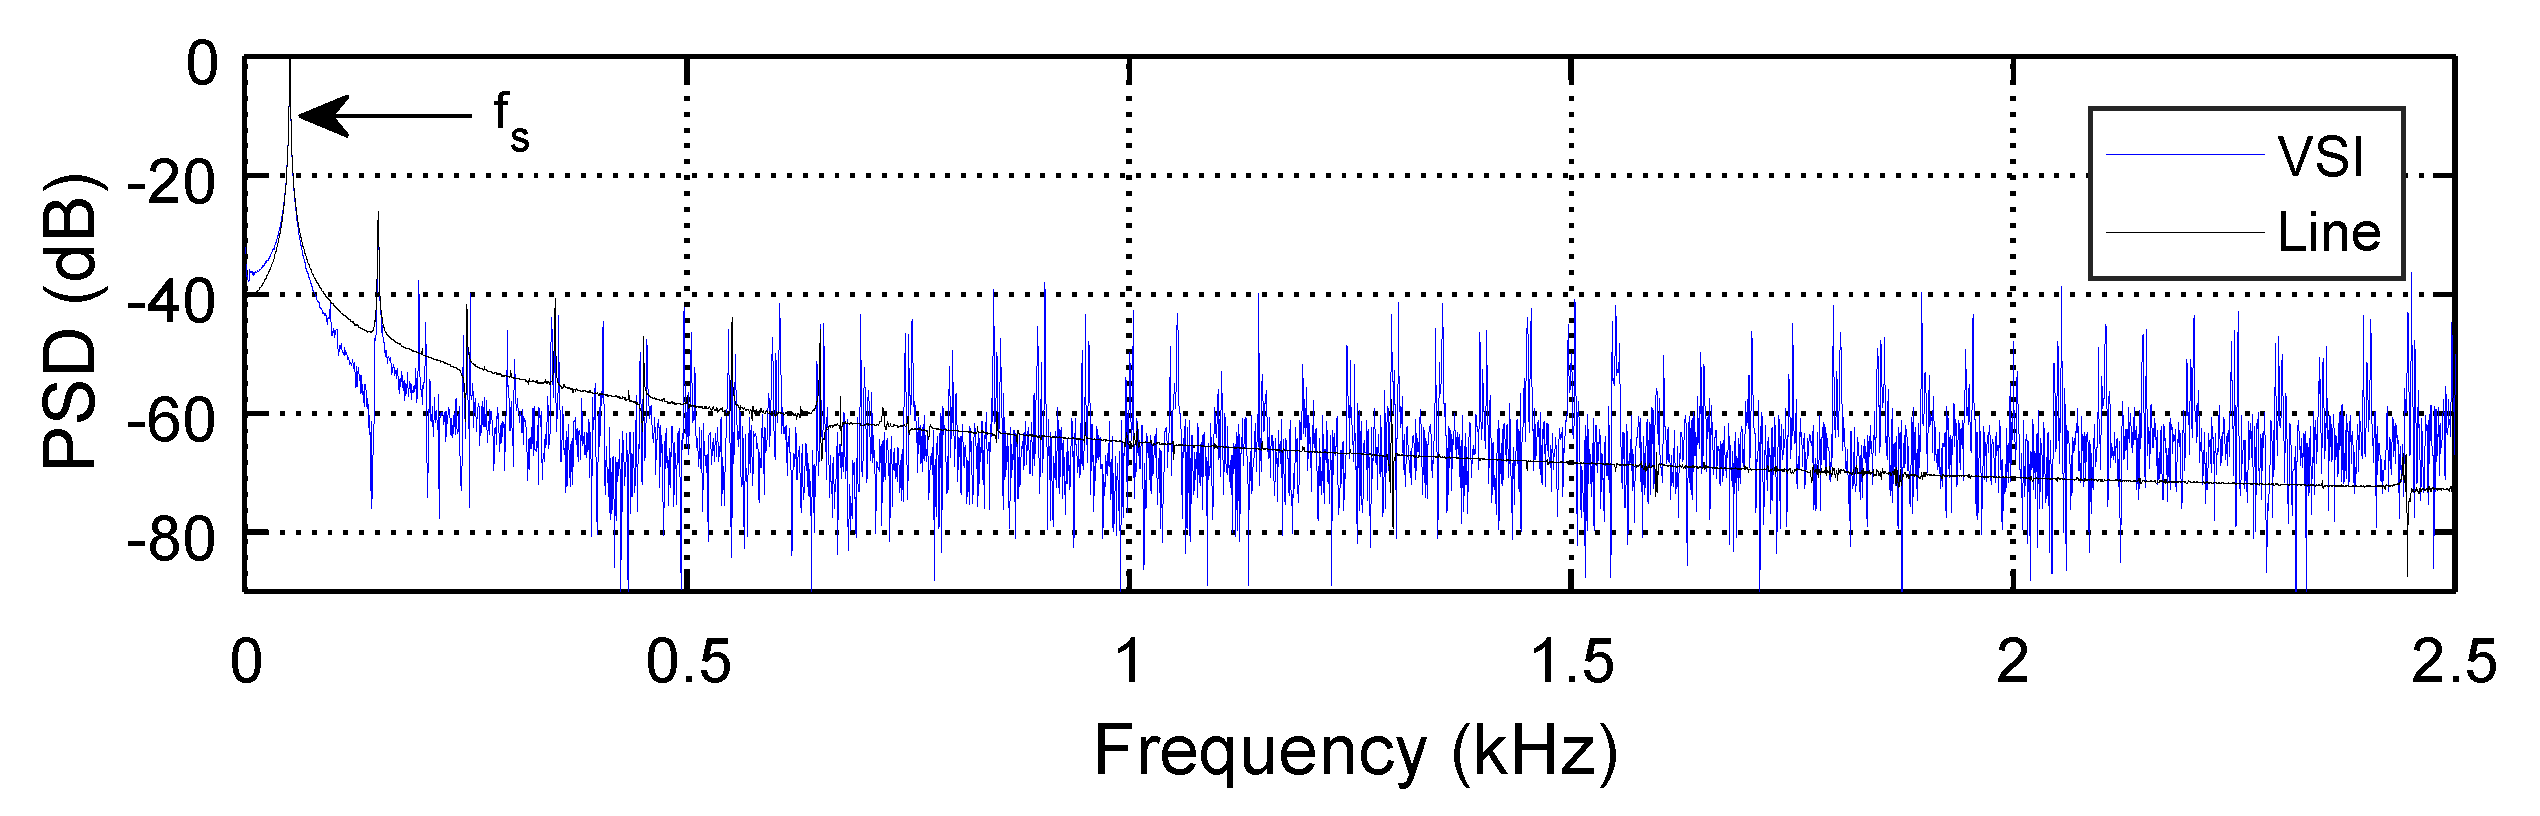
3. Experimental Setup

A laboratory test bench that emulates a typical VSI-fed induction motor system was used for experimental investigation. The laboratory setup consists of a 0.75 kW three-phase induction motor (Model D-91056 by Siemens) fed by a voltage source PWM inverter (Model ACS355-03E-15A6-4 by ABB). Appendix A and Appendix B summarize the technical parameters and specifications. The mechanical load was provided by an electro-magnetic powder brake (Model SE2662-5R by Lucas-Nülle).
Five cases of a rotor bar condition were studied, including the healthy status and four different broken bar severity degrees (from an incipient fault condition to a full broken rotor bar). In the healthy case, all bars of the rotor are in healthy condition. For the first fault status, the damage degree was simulated by drilling a 2 mm-diameter hole in a rotor bar, the depth of the hole ( d p ) was 1 4 of the bar height. In the second fault severity condition, the depth of the hole in the bar was increased to 1 2 of the bar height. In the third fault severity condition, the depth of the hole was increased to 3 4 of the bar height. Finally, the last fault severity condition was the fully broken rotor bar, where the depth of the hole was equal to the bar height, which is h = 13 mm. This results in five fault severity conditions, where s1 represents a healthy condition of the rotor, s2 a low level of degradation ( d p = 3.25 mm), s3 the half-broken bar ( d p = 6.5 mm), s4 a high level of degradation ( d p = 9.75 mm), and s5 a fully broken rotor bar ( d p = 13 mm). Figure 2a shows a cross-sectional view of the rotor cage with details of the different depth levels drilled into the bar and Figure 2b shows the drilled rotor bar.
The machine speed n r was provided by a tachogenerator (Model SE2672-5U by Lucas-Nülle) with an output voltage range of 0–10 V proportional to its rotation speed. One phase current i a was also measured for comparison purposes using a Hall effect transducer by LEM, model LV-25NP. A compact data acquisition system (NI cDAQ-9147) was used for data acquisition. This incorporated an analog input module, NI 9215, with 16 bits of resolution, and two independent input channels to capture the speed signal and stator current. The input scale of these two channels was 10 V. Therefore, the quality and reliability of the speed and stator current signals capture was the highest possible, as those signals were recorded using the high range of the input scale. Every isolated analog to digital converter was pre-programmed with a sampling frequency f n = 50 kHz based on the Nyquist theorem (higher than twice of the highest PWM switching frequency) to prevent unrealistic alias frequency components in the measured signals at the acquisition stage. Figure 3 shows a photograph of the test ring.

4. Experimental Results

The startup transient analysis examined the five case studies of different severity levels from healthy s 1 to the faulty case s 5 , as explained in Section 3. The healthy case s 1 and faulty case s 5 were already analyzed in Section 2 (see Figure 1), but with the motor operating in a stationary regime. For every case study, low load and high load operation tests are studied. All the acquired signals were processed and plotted by the Matlab® software. The digital sequences of n r and i a are first decimated from the original f n to a new sampling frequency f n / M in a pre-processing stage for selecting the frequency band analysis [0 − f n / M ) Hz and to decrease the computing requirements. The decimation is carried out by means of a low-pass filter and a sample rate compressor with the down-sample factor M. The Parks–MacClellan [39] algorithm was used to design the low-pass filter; its parameters are cutoff frequency ω c = π M , pass-band attenuation A p = 0 dB, and stop-band attenuation A s = 100 dB. The filter design was chosen to provide an adequate response in the pass-band while limiting the high-frequency components. The decimation factor M is selected according to the spectral behavior of the fault signature. In the case of the stator current, the bandwidth of analysis (0, 62.5 Hz)contains the main spectral components and the fault-related side-band harmonics. In the case of speed signal, the bandwidth of analysis (0, 31.25 Hz)contains all the desired information for rotor fault diagnosis purposes. The decimation is processed with a multi-stage approach to avoid measurement errors and spectral aliasing at the signal processing stage. The decimation factors are M = 5 × 4 × 5 × 4 and M = 5 × 4 × 5 × 4 × 2 for the stator current and rotor speed, respectively. Figure 4 illustrates the proposed methodology.
The measured signals consisted of a 10 s startup transient followed by 1 s of steady-state operation. During all the tests, n r ( t ) and i a ( t ) were recorded simultaneously to make a fair comparison between the stator current and the speed analysis. The precision and resolution of data acquisition are comparable to those used in industrial practice. Two series of tests were carried out at two different constant load torques, 2.6 and 3.8 Nm—low level (LL) and high level (HL), respectively. The VSI was programmed to provide a linear startup following a ramp from 0 Hz to the motor-rated frequency ( f b = 50 Hz) with a constant d f d t during the first 10 s. Figure 5a presents the voltage and current waveforms of a startup transient (10 s) followed by steady-state operation (1 s); the signal amplitudes are normalized by their corresponding maximum value. As expected, i a ( t ) and v a ( t ) exhibit a larger harmonic content than a line-fed system.
In Figure 5b, the pulse-width-modulated waveform of v a ( t ) and the switching effect produced by the VSI can be seen, and the highest electrical magnitude of the stator current during the startup transient occurs around 2 s after energization. Figure 6 presents the spectral characteristics of a line-fed and VSI-fed motor; the comparison of these plots shows the harmonics and inter-harmonics injected by the VSI in the system.
The measured rotor speed waveforms for a healthy and faulty case ( s 5 ) under LL and HL are shown in Figure 7. The figure presents the time-varying synchronous speed n s = 120 f s ( t ) /p when the motor is supplied by a linear ramp of frequency voltage v/f (0–50 Hz/0–10 s).
The rotor speed is closer to the synchronous speed (dashed line) when the motor load is low due to the reduced motor slip. When the mechanical load is high, the slip also increases, and the rotor speed separates more from the synchronous speed. Between second 1 and 2.5, a dead zone is observed after starting due to the time the motor takes to overcome the load inertia at standstill.

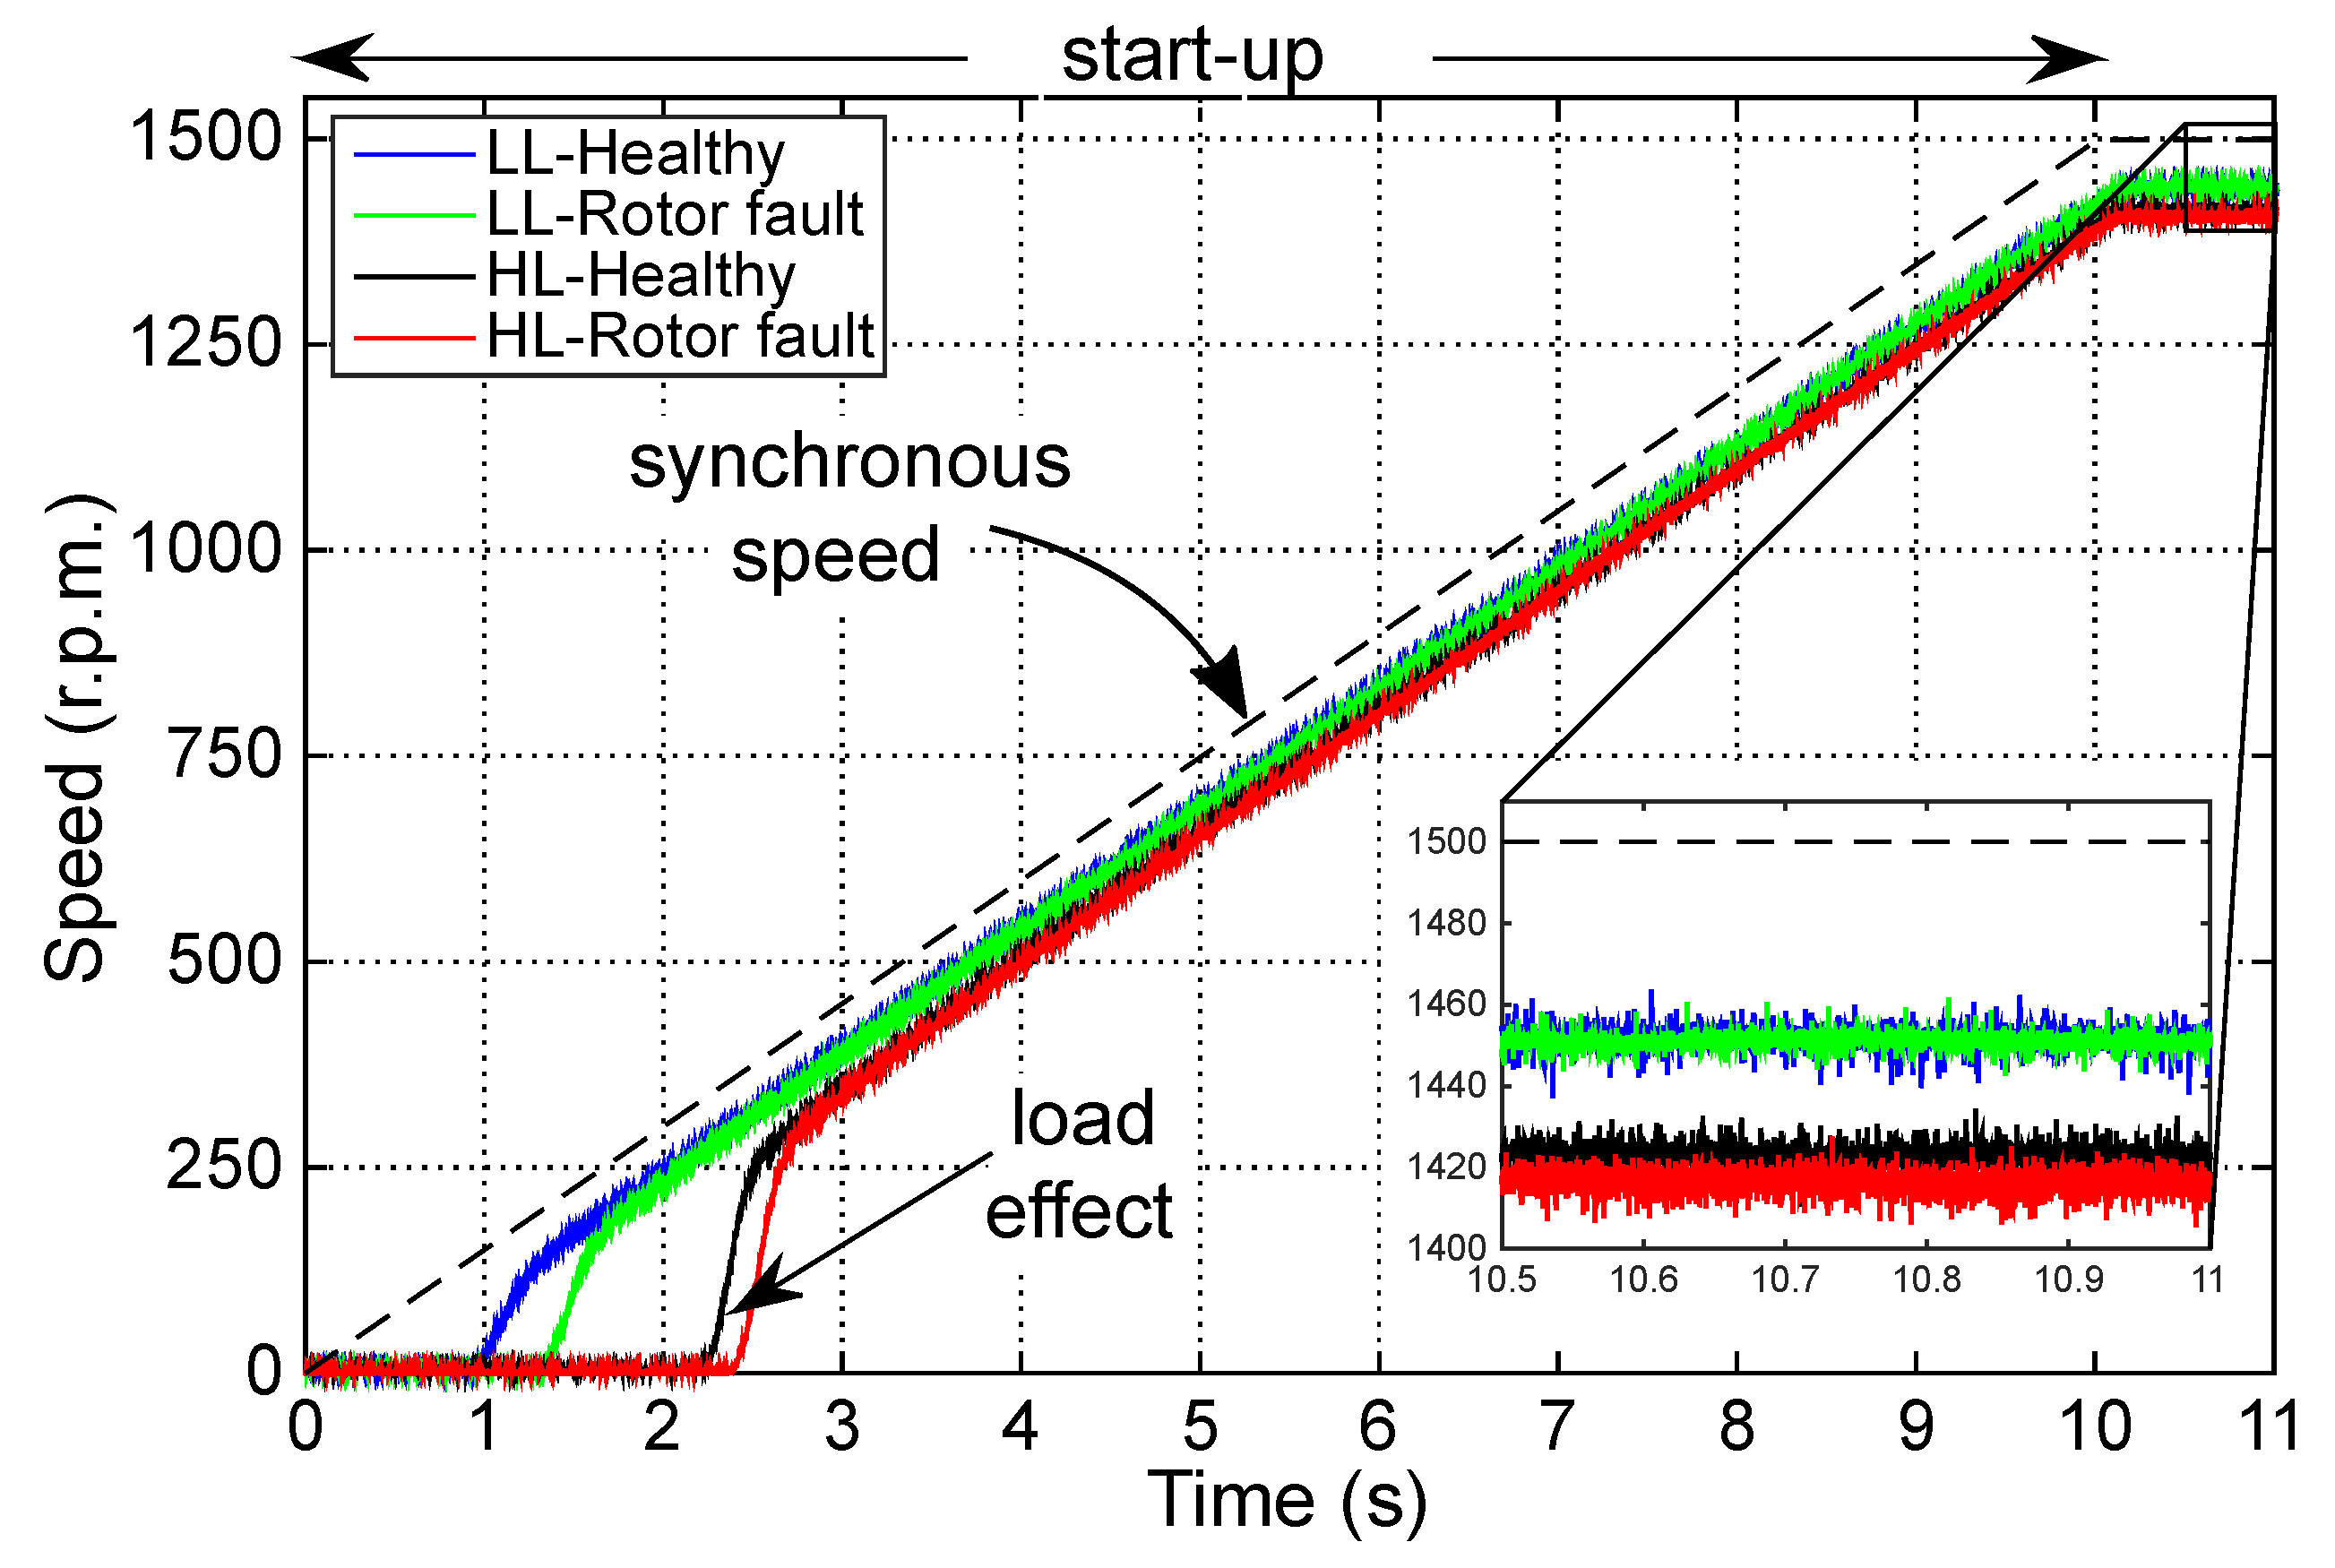
4.1. Time-Frequency Analysis of Startup

Time-frequency analyses for healthy and faulty tests are computed using the high-resolution estimation MUSIC; the PSD magnitude is presented in the z-axis of the ( t , f ) plane in a relative scale 20 l o g 10 P x x e j ω 2 . Rotor speed and stator current ( t , f ) decompositions are produced by applying a 81-point rectangular window with a 49 percent overlap.

4.1.1. Induction Motor under High-Load Condition

The time-frequency decompositions of stator current and rotor speed for a high-loaded motor are displayed in Figure 8 and Figure 9, respectively. Figure 8a illustrates the application of the stator current analysis for the healthy motor ( s 1 ) , and Figure 8b presents the stator current analysis for the motor with a broken rotor bar ( s 5 ) . The high-resolution technique is capable of realizing very sharp ( t , f ) spectral analyses, allowing the observation of individual spectral components. In both cases, Figure 8a,b, the maximum energy concentrations take place at the linear frequency variation f s ( t ) = 5 t as a result of the dominant component of the voltage supply. The spectral harmonics of winding, eccentricity, and other components introduced by the VSI are also observed in the ( t , f ) decompositions. For non-sinusoidal voltage supplies, triplen harmonics are seldom present in three-phase induction motors; conversely, 2nd and 4th harmonics can be observed in the stator current analysis. In Figure 8b, the time-varying spectrum of the faulty motor is presented and shows the appearance of the fault sidebands ( 1 ± 2 s ) f s , which are close to the fundamental component and can be observed evolving with a positive slope. Although a visual comparison between Figure 8a,b shows the existence of the fault components in the vicinity of f s in Figure 8b, a precise identification, isolation, and quantification of LSH or RSH is complicated, as its trajectories are partly overlapped with f s .
The proposed motor speed signature analysis is presented in Figure 9 for the same experimental tests of Figure 8. As envisioned in Equation (4), Figure 9a shows that for a healthy motor the dominant spectral component in n r is n m and there is absence of a fault harmonic component. In contrast, Figure 9b clearly exposes the presence of a speed oscillation at the twice slip frequency during the startup transient, revealing a rotor defect in the motor. Notice that even though the electrical starting point is at t = 0 when the VSI energizes the induction motor, the fault oscillation 2 s f s rises about two seconds later when the shaft starts rotating. This is because the fault signature is directly related to the slip and consequently to the rotor movement. This speed oscillation trajectory can be easily tracked in the ( t , f ) domain; the average speed value does not produce a signature in the time-frequency domain and the trajectory of the speed oscillations are easily observed.

4.1.2. Induction Motor under Low-Load Condition

Time-varying analyses resulting from the stator current for healthy s 1 and a faulty s 5 cases are compared in Figure 10, when the motor is operating under low-slip condition. Figure 10a illustrates the application of current signature analysis to the healthy motor; apart from noise, Figure 8a and Figure 10a present a similar time-varying spectra, and both LL and HL condition (from a healthy machine) exhibit the presence of even harmonics, eccentricity harmonics, and the main energy component in the t-f decomposition concentrated at f s . Conversely, Figure 10b shows a different energy distribution and depicts the appearance of the symmetrical fault-components (LSH and RSH), which are separated from the fundamental component and can be observed only after the second 10 at 45 and 55 Hz. However, its energy cannot be tracked in the startup transient (0 to 10 s), since they are very close to f s and its trajectories are indistinguishable. The results presented in Figure 10 illustrate the main limitation of the motor current signature analysis to detect fault-harmonics when induction motors are operating under light load conditions. When the motor is operating under light load conditions, the slip approaches zero and the stator current analysis experience troubles in fault signature identification.
The proposed methodology, motor speed signature analysis, is presented in Figure 11 for the same experimental tests of Figure 10. In this case, the spectrum for the healthy motor with a constant mechanical load of 2.6 Nm is shown in Figure 11a. Although the result belongs to a startup transient under variable-frequency supply, it is found that n r is composed only for a constant component n m embedded in noise. On the other hand, the result shown in Figure 11b is different because the ( t , f ) analysis reveals a new harmonic component related to the broken rotor bar fault, now clearly the component appears at frequency 2 s f s . One can also observe a frequency decrement in the separation between n m and the fault-component trajectory due to the lower slip than when the motor load was high (in Figure 9b).
If Figure 9b and Figure 11b are compared, in the latter in Figure 9b the fault-related component is far separated from the dominant component because the motor slip is higher due to a high load: The greater the load level, the greater the rotor slip and, in consequence, the higher the frequency speed fluctuation.
The results show that the fault components are better detected using the motor speed analysis, which gives a clear separation of the spectral components at the ( t , f ) plane and permits the extraction of the speed oscillation amplitude at the fault frequency. In the speed analyses given for a healthy and faulty cases, it can be observed that the dominant spectral components in the ( t , f ) decompositions are the constant trajectories n m (Figure 9 and Figure 11). Results of the stator current decompositions (Figure 8a and Figure 10) are clearly different, where the dominant component is the frequency modulated component f s (from 0 to 50 Hz). The low-frequency variation in n m and 2 s f s in the motor speed spectrum improves the PSD estimation by reducing bias and leakage in the ( t , f ) decompositions, thus giving an accurate localization and quantification of the fault signature.

4.2. Early Fault Detection

In addition to the fault detection analysis, the amplitude of the fault component is isolated and extracted from the ( t , f ) domain for diagnosis purposes. Figure 12 presents the results of the 2 s f s amplitude for the five severity levels from s 1 to s 5 . The amplitudes evolution for HL and LL conditions are shown in Figure 12a,b, respectively. In the case of healthy condition s 1 and the s 2 severity level, the speed oscillation is small and it is difficult to determine any difference. However, the amplitude of the fault signatures for the cases s 3 , s 4 , and s 5 expose a clear increment in the speed fluctuation at 2 s f s as the severity of the fault increases.

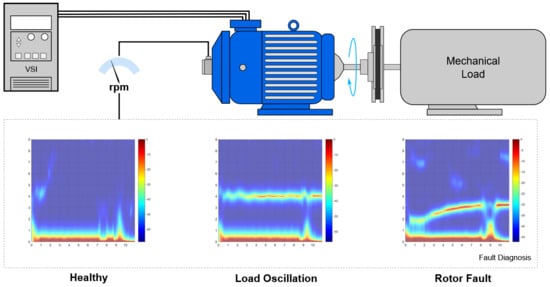
4.3. Induction Motor under Load Oscillations

To study the performance of the proposed methodology, the ( t , f ) analysis is used to process the rotor speed of an IM under load oscillations. In particular, the low-frequency load oscillation phenomenon is interesting to consider because it is a common root cause of rotor fault false alarms when the classical steady-state analysis is performed. The oscillation in the load was produced by feeding the controller of a magnetic powder break with a low-frequency sinusoid, which is provided by a programmable function generator. This time the motor startup was programmed in the VSI with 5 s, to verify and validate the effectiveness of the analysis under short transient startup. Figure 13a shows the result of the healthy motor case under a normal condition without load oscillation, where there are not low-frequency trajectories present in the ( t , f ) decomposition. In Figure 13b, the result of the same healthy motor is shown but with a load oscillating by 4 Hz. A clear frequency component is present during the transient and the steady state at 4 Hz. The 2 s f s pattern induced by a rotor fault is shown in Figure 13c; with the measured speed signal, it is easy to corroborate that the slip at the stationary regime is s = 0.032, allowing the method to confirm that the trajectory which converge to 3.28 Hz corresponds to a rotor fault component. The ( t , f ) decomposition of the speed signal for the faulty motor operating under the oscillating load is shown in Figure 13d, where not only the oscillation component of the load at 4 Hz is observed in the ( t , f ) plane but also the presence of the rotor fault trajectory with different direction can be noticed. These experimental results show that the speed analysis of the startup transient is effective to identify rotor fault components and load oscillation components, even when in stationary regime they overlap at the same frequency.
In this work, a tachogenerator was used to measure the speed, but in real applications other speed sensors can be used with a better reliability, robustness, and accuracy, such as optical encoders or speed resolvers. It should not be forgotten that a reliable and effective analysis of the stator current for fault detection is also based on a good estimate or accurate measurement of the motor speed, which is necessary for the location of fault-related components. The proposed method is a good complement to the analysis of the stator current and can help to avoid false alarms.

5. Conclusions

This paper presents a new methodology for the early detection of broken rotor bars in VSI-fed induction motors based on the analysis of motor speed in the time-frequency domain. Although speed monitoring has been considered in stationary conditions, it has not received attention under transient conditions. The proposed method has two advantages with respect to stator current analysis: the rotor speed shows fewer spectral components than the stator current and the average value of the rotor speed does not produce a frequency pattern. The study confirms the existence of the fault pattern 2 s f s in the speed during the startup transient and reports the diagnostic capabilities of the method to detect and distinguish between load oscillation components and rotor fault signatures during non-stationary conditions. The results prove that: (i) speed analysis under startup transients can be used as an effective and reliable technique for the diagnosis of broken rotor bars in inverter-fed induction motors during startups compared to the analysis of the stator current; (ii) broken rotor bars can be detected at early stages of the fault; (iii) the proposed analysis technique avoids false positives by low-frequency oscillations, as their trajectories in the time-frequency plane are different from those related to the fault. The analysis of the speed signal was carried using a high-resolution technique, MUSIC. However, much simpler techniques, such as short-time Fourier transform, can also be used if an appropriate window length is chosen to avoid spectral leakage around the average value of speed. As the development of a broken rotor bar is slow over time, this methodology can be incorporated into an on-line condition monitoring system. The computational burden of the proposed analysis is also low, so this is not an impediment either. One disadvantage of the proposed technique, compared to stator current monitoring, is the sensor used, which is not usually available in many adjustable speed drives. In future works, the authors will study if this methodology can be applied to the detection of other kinds of faults or machines.

Author Contributions

Conceptualization, T.A.G.-C., D.M.-S., and R.d.J.R.-T.; data curation, R.d.J.R.-T. and A.G.-P.; methodology, T.A.G.-C. and D.M.-S.; software, T.A.G.-C. and A.G.-P.; validation, A.G.-P. and V.F.-C.; writing—original draft, T.A.G.-C. and V.F.-C.; writing—reviewing and editing, D.M.-S., V.F.-C., and R.d.J.R.-T. All authors have read and agreed to the published version of the manuscript.

Funding

This work was supported in part by the Mexican Council of Science and Technology (CONACYT) by the scholarship 487058, Mexico City, Mexico.

Institutional Review Board Statement

Not applicable.

Informed Consent Statement

Not applicable.

Data Availability Statement

Not applicable.

Conflicts of Interest

The authors declare no conflict of interest.The funders had no role in the design of the study; in the collection, analyses, or interpretation of data; in the writing of the manuscript, or in the decision to publish the results.

Abbreviations

The following abbreviations are used in this manuscript:
BRBBroken rotor bar
f s Fundamental frequency
f b Motor rated frequency
f n Sampling frequency
FTFourier Transform
HLHigh-load level
IMInduction Motor
LLLow-load level
LSHLeft Side Harmonic
MCSAMotor current signature analysis
MUSICMultiple signal classification
PSDPower spectral density
PWMPulse width modulation
RSHRight side-band harmonic
s f s Slip frequency
t , f time-frequency
VSIVoltage source inverter

Appendix A

Three-phase induction motor rated characteristics: Rated power = 0.75 kW, Rated voltage = 230/460 V, Rated current = 3.2/1.86, Synchronous speed = 1500 r.p.m.

Appendix B

Voltage source inverter characteristics: Rated output voltage = 220/240 V, Rated power: 4 kW, Start-up mode = Linear, Control mode: scalar ( v / f ), Commutation method = pulse width modulation.

References

  1. Tan, C.; Feng, Z.; Liu, X.; Fan, J.; Cui, W.; Sun, R.; Ma, Q. Review of variable speed drive technology in beam pumping units for energy-saving. Energy Rep. 2020, 6, 2676–2688. [Google Scholar] [CrossRef]
  2. Park, Y.; Yang, C.; Kim, J.; Kim, H.; Lee, S.B.; Gyftakis, K.N.; Panagiotou, P.A.; Kia, S.H.; Capolino, G. Stray Flux Monitoring for Reliable Detection of Rotor Faults Under the Influence of Rotor Axial Air Ducts. IEEE Trans. Ind. Electr. 2019, 66, 7561–7570. [Google Scholar] [CrossRef]
  3. Gyftakis, K.N.; Antonino-Daviu, J.A.; Garcia-Hernandez, R.; McCulloch, M.D.; Howey, D.A.; Marques-Cardoso, A.J. Comparative Experimental Investigation of Broken Bar Fault Detectability in Induction Motors. IEEE Trans. Ind. Appl. 2016, 52, 1452–1459. [Google Scholar] [CrossRef] [Green Version]
  4. Hassan, H.; Mahmood, F.; Akmal, M.; Nasir, M. Optimum operation of low voltage variable-frequency drives to improve the performance of heating, ventilation, and air conditioning chiller system. Int. Trans. Electr. Energy Syst. 2020, 30, 188–199. [Google Scholar] [CrossRef]
  5. Martin-Diaz, I.; Morinigo-Sotelo, D.; Duque-Perez, O.; Arredondo-Delgado, P.A.; Camarena-Martinez, D.; Romero-Troncoso, R.J. Analysis of various inverters feeding induction motors with incipient rotor fault using high-resolution spectral analysis. Electr. Power Syst. Res. 2017, 152, 18–26. [Google Scholar] [CrossRef]
  6. Lee, S.B.; Stone, G.C.; Antonino-Daviu, J.A.; Gyftakis, K.N.; Strangas, E.G.; Maussion, P.; Platero, C.A. Condition Monitoring of Industrial Electric Machines: State of the Art and Future Challenges. IEEE Ind. Electron. Mag. 2020, 14, 158–167. [Google Scholar] [CrossRef]
  7. Gyftakis, K.N.; Cardoso, A.J.M. Reliable Detection of Stator Interturn Faults of Very Low Severity Level in Induction Motors. IEEE Trans. Ind. Electr. 2020, 68, 3475–3484. [Google Scholar] [CrossRef]
  8. Antonino-Daviu, J.A.; Riera-Guasp, M.; Pons-Llinares, J.; Park, J.; Lee, S.B.; Yoo, J.; Kral, C. Detection of Broken Outer-Cage Bars for Double-Cage Induction Motors Under the Startup Transient. IEEE Trans. Ind. Appl. 2012, 48, 1539–1548. [Google Scholar] [CrossRef]
  9. Elbouchikhi, E.; Choqueuse, V.; Amirat, Y.; Benbouzid, M.E.H.; Turri, S. An Efficient Hilbert–Huang Transform-Based Bearing Faults Detection in Induction Machines. IEEE Trans. Energy Convers. 2017, 32, 401–413. [Google Scholar] [CrossRef]
  10. Chen, X.; Feng, Z. Time-frequency space vector modulus analysis of motor current for planetary gearbox fault diagnosis under variable speed conditions. Mech. Syst. Signal Process. 2019, 121, 636–654. [Google Scholar] [CrossRef]
  11. Riera-Guasp, M.; Antonino-Daviu, J.A.; Capolino, G.A. Advances in Electrical Machine, Power Electronic, and Drive Condition Monitoring and Fault Detection: State of the Art. IEEE Trans. Ind. Electr. 2015, 62, 1746–1759. [Google Scholar] [CrossRef]
  12. Chen, S.; Yang, Y.; Peng, Z.; Dong, X.; Zhang, W.; Meng, G. Adaptive chirp mode pursuit: Algorithm and applications. Mech. Syst. Signal Process. 2019, 116, 566–584. [Google Scholar] [CrossRef]
  13. Fernandez-Cavero, V.; Morinigo-Sotelo, D.; Duque-Perez, O.; Pons-Llinares, J. A Comparison of Techniques for Fault Detection in Inverter-Fed Induction Motors in Transient Regime. IEEE Access 2017, 5, 8048–8063. [Google Scholar] [CrossRef]
  14. Hmida, M.A.; Braham, A. Fault Detection of VFD-Fed Induction Motor Under Transient Conditions Using Harmonic Wavelet Transform. IEEE Trans. Instrum. Meas. 2020, 69, 8207–8215. [Google Scholar] [CrossRef]
  15. Pons-Llinares, J.; Riera-Guasp, M.; Antonino-Daniu, J.A.; Hableter, T.G. Pursuing optimal electric machines transient diagnosis: The adaptive slope transform. Mech. Syst. Signal Process. 2016, 80, 553–569. [Google Scholar] [CrossRef]
  16. Yu, K.; Lin, T.R.; Tan, J.; Ma, H. An adaptive sensitive frequency band selection method for empirical wavelet transform and its application in bearing fault diagnosis. Measurement 2019, 134, 375–384. [Google Scholar] [CrossRef]
  17. EMD-Based Analysis of Industrial Induction Motors With Broken Rotor Bars for Identification of Operating Point at Different Supply Modes. IEEE Trans. Ind. Inform. 2014, 10, 957–966. [CrossRef]
  18. Rosero, J.A.; Romeral, L.; Ortega, J.A.; Rosero, E. Short-Circuit Detection by Means of Empirical Mode Decomposition and Wigner–Ville Distribution for PMSM Running Under Dynamic Condition. IEEE Trans. Ind. Electr. 2009, 56, 4534–4547. [Google Scholar] [CrossRef]
  19. Garcia-Calva, T.A.; Morinigo-Sotelo, D.; Garcia-Perez, A.; Camarena-Martinez, D.; Romero-Troncoso, R.J. Demodulation Technique for Broken Rotor Bar Detection in Inverter-Fed Induction Motor Under Non-Stationary Conditions. IEEE Trans. Energy Convers. 2019, 34, 1496–1503. [Google Scholar] [CrossRef]
  20. Mendes, A.M.S.; Abadi, M.B.; Cruz, S.M.A. Fault diagnostic algorithm for three-level neutral point clamped AC motor drives, based on the average current Park’s vector. IET Power Electron. 2014, 7, 1127–1137. [Google Scholar] [CrossRef]
  21. Zhao, D.; Wang, T.; Gao, R.X.; Chu, F. Signal optimization based generalized demodulation transform for rolling bearing nonstationary fault characteristic extraction. Mech. Syst. Signal Process. 2019, 134. [Google Scholar] [CrossRef]
  22. Duque-Perez, O.; Garcia-Escudero, L.A.; Morinigo-Sotelo, D.; Gardel, P.E.; Perez-Alonso, M. Condition monitoring of induction motors fed by Voltage Source Inverters. Statistical analysis of spectral data. In the Proceedings of the XXth International Conference on Electrical Machines, Marseille, France, 2–5 September 2012; IEEE: Danvers, MA, USA, 2012; pp. 2479–2484. [Google Scholar] [CrossRef]
  23. Bazan, G.H.; Scalassara, P.R.; Endo, W.; Goedtel, A. Information Theoretical Measurements From Induction Motors Under Several Load and Voltage Conditions for Bearing Faults Classification. IEEE Trans. Ind. Inform. 2020, 16, 3640–3650. [Google Scholar] [CrossRef]
  24. Bazan, G.H.; Scalassara, P.R.; Endo, W.; Goedtel, A.; Palacios, R.H.C.; Godoy, W.F. Stator Short-Circuit Diagnosis in Induction Motors Using Mutual Information and Intelligent Systems. IEEE Trans. Ind. Electron. 2019, 66, 3237–3246. [Google Scholar] [CrossRef]
  25. Lei, Y.; Yang, B.; Jiang, X.; Jia, F.; Li, N.; Nandi, A.K. Applications of machine learning to machine fault diagnosis: A review and roadmap. Mech. Syst. Signal Process. 2020, 138. [Google Scholar] [CrossRef]
  26. Liu, R.; Yang, B.; Zio, E.; Chen, X. Artificial intelligence for fault diagnosis of rotating machinery: A review. Mech. Syst. Signal Process. 2018, 108, 33–47. [Google Scholar] [CrossRef]
  27. Burriel-Valencia, J.; Puche-Panadero, R.; Martinez-Roman, J.; Sapena-Bano, A.; Pineda-Sanchez, M.; Perez-Cruz, J.; Riera-Guasp, M. Automatic Fault Diagnostic System for Induction Motors under Transient Regime Optimized with Expert Systems. Electronics 2019, 8, 6. [Google Scholar] [CrossRef] [Green Version]
  28. Valtierra-Rodriguez, M.; Rivera-Guillen, J.R.; Basurto-Hurtado, J.A.; De-Santiago-Perez, J.J.; Granados-Lieberman, D.; Amezquita-Sanchez, J.P. Convolutional Neural Network and Motor Current Signature Analysis during the Transient State for Detection of Broken Rotor Bars in Induction Motors. Sensors 2020, 20, 3721. [Google Scholar] [CrossRef]
  29. Redon, P.; Rodenas, M.P.; Antonino-Daviu, A. Development of a diagnosis tool, based on deep learning algorithms and infrared images. In Proceedings of the IECON 2020, The 46th Annual Conference of the IEEE Industrial Electronics Society, Singapore, 18–21 October 2020; IEEE: Danvers, MA, USA, 2020; pp. 2505–2510. [Google Scholar] [CrossRef]
  30. Glowacz, A. Fault diagnosis of electric impact drills using thermal imaging. Measurement 2021, 171. [Google Scholar] [CrossRef]
  31. Mohammed, A.; Melecio, J.I.; Djurović, S. Stator Winding Fault Thermal Signature Monitoring and Analysis by In Situ FBG Sensors. IEEE Trans. Ind. Electr. 2019, 66, 8082–8092. [Google Scholar] [CrossRef]
  32. Garcia-Calva, T.A.; Morinigo-Sotelo, D.; Garcia-Perez, A.; Romero-Troncoso, R.J. Rotor Fault Detection in Inverter-Fed Induction Motors Using Speed Analysis of Startup Transient. In Proceedings of the 12th International Symposium on Diagnostics for Electrical Machines, Power Electronics and Drives (SDEMPED), Toulouse, France, 27–30 August 2019; IEEE: Danvers, MA, USA, 2019; pp. 297–302. [Google Scholar] [CrossRef]
  33. Elbouchikhi, E.; Choqueuse, V.; Auger, F.; Benbouzid, M.E. Motor Current Signal Analysis Based on a Matched Subspace Detector. IEEE Trans. Instrum. Meas. 2017, 66, 3260–3270. [Google Scholar] [CrossRef] [Green Version]
  34. Nandi, S.; Toliyat, H.A.; Li, X. Condition Monitoring and Fault Diagnosis of Electrical Motors—A Review. IEEE Trans. Energy Convers. 2005, 20, 719–729. [Google Scholar] [CrossRef]
  35. Filippetti, F.; Franceschini, G.; Tassoni, C.; Vas, P. AI techniques in induction machines diagnosis including the speed ripple effect. IEEE Trans. Ind. Appl. 1998, 34, 98–108. [Google Scholar] [CrossRef]
  36. Romero-Troncoso, R.J. Multirate Signal Processing to Improve FFT-Based Analysis for Detecting Faults in Induction Motors. IEEE Trans. Ind. Inform. 2017, 13, 1291–1300. [Google Scholar] [CrossRef]
  37. Morinigo-Sotelo, D.; Romero-Troncoso, R.J.; Panagiotou, P.A.; Antonino-Daviu, J.A.; Gyftakis, K.N. Reliable Detection of Rotor Bars Breakage in Induction Motors via MUSIC and ZSC. IEEE Trans. Ind. Appl. 2018, 54, 1224–1234. [Google Scholar] [CrossRef]
  38. Garcia-Calva, T.A.; Morinigo-Sotelo, D.; Romero-Troncoso, R.J. Non-Uniform Time Resampling for Diagnosing Broken Rotor Bars in Inverter-Fed Induction Motors. IEEE Trans. Ind. Electr. 2017, 64, 2306–2315. [Google Scholar] [CrossRef]
  39. McClellan, J.H.; Parks, T.W. A personal history of the Parks-McClellan algorithm. IEEE Signal Process. Mag. 2005, 22, 82–86. [Google Scholar] [CrossRef]
Figure 1. Spectra of the (a) stator current and (b) mechanical rotor speed of the motor supplied from the voltage source inverter and in stationary operation.
Energies 14 01469 g001
Figure 2. View of the rotor employed in the tests: (a) side view schematic for the transverse section of the squirrel cage rotor, and (b) squirrel cage rotor with a complete broken rotor bar condition.
Energies 14 01469 g002
Figure 3. Experimental test ring configuration: (1) asynchronous motor, (2) electro-magnetic powder brake, (3) powder brake control, (4) voltage source inverter, (5) signal condition stage, (6) data acquisition system, (7) PC, and (8) programmable function generator.
Energies 14 01469 g003
Figure 4. Simplified block diagram of the decimation process.
Energies 14 01469 g004
Figure 5. Voltage ( v a ) and current ( i a ) waveforms in the induction motor fed by the voltage source inverter during: (a) 10 s of startup transient and 1 s of steady state, and (b) close up of the steady state.
Energies 14 01469 g005
Figure 6. Spectra of the motor supply voltage when fed from the line or from the voltage source inverter and under stationary conditions.
Energies 14 01469 g006
Figure 7. Startup transients performance of the speed in an induction motor fed by an inverter for healthy and faulty cases under low (LL) and high (HL) levels of mechanical load.
Energies 14 01469 g007
Figure 8. Time-frequency analyses of the IM stator current under startup transient and high-load level for: (a) healthy motor and (b) rotor with one full broken rotor bar.
Energies 14 01469 g008
Figure 9. Time-frequency analyses of the motor speed under startup transient and high-load level for: (a) healthy motor and (b) rotor with one full broken rotor bar.
Energies 14 01469 g009
Figure 10. Time-frequency analyses of the IM stator current under startup transient and low load level for: (a) healthy motor and (b) a rotor with one full broken rotor bar.
Energies 14 01469 g010
Figure 11. Time-frequency analyses of the motor speed under startup transient and low load level for: (a) healthy motor and (b) a rotor with one full broken rotor bar.
Energies 14 01469 g011
Figure 12. Time evolution of the 2 s f s amplitude during the startup transient for multiple severity cases under: (a) high load condition and (b) low load condition.
Energies 14 01469 g012
Figure 13. Time-frequency decomposition of the rotor speed under startup transient and high load level for: (a) healthy motor, (b) healthy motor and load oscillation, (c) rotor with a broken rotor bar without load oscillation, and (d) rotor with a broken rotor bar with load oscillation.
Energies 14 01469 g013
Publisher’s Note: MDPI stays neutral with regard to jurisdictional claims in published maps and institutional affiliations.

