Article

Hydrolysis-Based Hydrogen Generation Investigation of Aluminum System Adding Low-Melting Metals

1
School of Materials Science and Engineering, Henan Polytechnic University, Jiaozuo 454003, China
2
School of Materials Science and Engineering, Harbin Institute of Technology, Harbin 150001, China
3
Faculty of Engineering, University of Rijeka, 51000 Rijeka, Croatia
*
Author to whom correspondence should be addressed.
Energies 2021, 14(5), 1433; https://doi.org/10.3390/en14051433
Submission received: 7 February 2021 / Revised: 27 February 2021 / Accepted: 2 March 2021 / Published: 5 March 2021
(This article belongs to the Special Issue Advances in Hydrogen Energy)

Abstract

:
In this age of human civilization, there is a need for more efficient, cleaner, and renewable energy as opposed to that provided by nonrenewable sources such as coal and oil. In this sense, hydrogen energy has been proven to be a better choice. In this paper, a portable graphite crucible metal smelting furnace was used to prepare ten multi-element aluminum alloy ingots with different components. The microstructure and phase composition of the ingots and reaction products were analyzed by X-ray diffraction (XRD), scanning electron microscopy (SEM), and differential scanning calorimetry (DSC). The reaction was carried out in a constant temperature water bath furnace at 60 °C, and the hydrogen production performance of the multi-element aluminum alloys in different proportions was compared by the drainage gas collection method. The experimental results show that the as-cast microstructure of Al–Ga–In–Sn aluminum alloy is composed of a solid solution of Al and part of Ga, and a second phase of In3Sn. After the hydrolysis reaction, the products were dried at 150 °C and then analyzed by XRD. The products were mainly composed of AlOOH and In3Sn. Alloys with different compositions react at the same hydrolysis temperature, and the hydrogen production performance is related to the ratio of low-melting-point metal elements. By comparing two different ratios of Ga–In–Sn (GIS), the hydrogen production capacity and production rate when the ratio is 6:3:1 are generally higher than those when the ratio is 7:2:1. The second phase content affects the hydrogen production performance.

1. Introduction

With progress in science and technology, energy comes into focus for society in terms of quality of life. As the carrier of carbon-free energy, hydrogen is not only the lightest element but also the most abundant resource in nature. Hydrogen has a very high calorific value of combustion and is a clean and efficient ideal energy source [1,2,3,4,5,6,7,8,9]. The hydrolysis of aluminum is an environmentally friendly reaction, and the products are pollution-free. However, it is very easy to form a compact oxide film on the surface of aluminum. Breaking the oxide film becomes a key breakthrough point for hydrogen production [10,11,12,13,14,15,16,17]. Common methods include dissolving the oxide film in an acid alkaline and neutral solution, and preparing an aluminum alloy by ball milling and by activating it [18,19,20,21,22]. A common chemical hydrogen production method is to store the hydrogen in a hydrogen storage tank and to then transport it. The quality of hydrogen accounts for 5–7% of the quality of the storage tank [23]. Hydrogen production from a metal ingot reaction is not only more efficient but also more convenient for transportation and storage. As one of the most common metal elements, aluminum has many advantages such as low cost, abundant reserves, and good preservation. In particular, the alumina hydroxide generated after an aluminum hydrolysis reaction not only is pollution-free but also can be reused [24]. Therefore, metal aluminum is the preferred raw material for hydrogen production by hydrolysis.
A.V. Ilyukhina et al. [16] used a series of low-melting-point alloys based on the metal gallium, such as Ga70-In30, Ga70-In25-Zn3, and Ga62-In25-Sn13, in an aluminum powder alloying treatment. When the content of the liquid alloy in the alloy was 5–10 wt.%, the hydrogen production performance of aluminum powder in 25 °C water had a small relationship with the contents of the activator. However, the hydrogen production rate decreased significantly when its content continued to decrease. The hydrolysis rate of aluminum powder depends on the hydrolysis temperature. Fan et al. [18] prepared a type of Al-Li powder alloy by mechanical ball milling. The maximum hydrogen production rate of the alloy at room temperature was 233 mL/(min·g) and the maximum hydrogen production was 743 mL/g. After that, the Al-5.3Ga-5.4Sn-2In-7.3Zn alloy was prepared by ball milling. The hydrogen production of aluminum alloy powder reached 770 mL/(g·Al) within 7 min, and the hydrogen production rate reached 77.3%. Gai et al. [22] studied the reaction of pure aluminum with different particle sizes and water at different temperatures. For a certain reaction temperature, the smaller the particle size, the greater the possibility of reaction. M.C Roul [19] proposed an activation mechanism of Al-X alloy (X = Zn, Hg, or In) that is the well-known aluminum alloy dissolution–redeposition mechanism, which became the theoretical basis of aluminum alloy activation mechanisms.
This experiment mainly uses alloying to treat metal aluminum. This method is based on adding low-melting-point metals, such as Ga, In, Sn, Ca, Mg, Zn, Bi, etc. The main reason for choosing an alloying method is that this method can hydrolyze metal aluminum in neutral solution or aqueous solution with a pH value close to neutral, which can significantly improve the activity of aluminum. For alloying methods, common treatment methods are ball milling and the smelting method; this experiment chooses the smelting method because the smelting method has the following advantages over the ball mill method: 1. The operational method is simple. 2. It has a small material loss during the experiment. 3. The precision of alloy composition is easy to control. 4. It is easier to control the hydrolysis speed during the hydrolysis process. 5. An alloy produced after ball milling is not easy to preserve and even has safety risks [25,26,27,28]. The alloy block after smelting and casting is easier to preserve. Only aluminum itself participates in the reaction, and the low-melting-point metal can be collected and reused after the reaction. This method greatly reduces the cost of preparing hydrogen, which is of great help to the development of hydrogen production by aluminum hydrolysis and has more scientific and practical value.
This article is improved based on the above research. The experiment uses a portable graphite crucible metal melting furnace, and continuously inert gas is introduced into the melting furnace to prevent oxidation. In such experimental conditions, to achieve a high rate of hydrogen production and to obtain ideal hydrogen production, a multi-element aluminum alloy was formed by adding low-melting-point metals (Ga, In, and Sn) in different proportions. Then, the content of aluminum in the alloy is changed to compare the influence of alloy composition on hydrogen production. Then, X-ray diffraction (XRD), differential scanning calorimetry (DSC), scanning electron microscopy (SEM), and other characterization methods are used for correlation analysis and to further study the phenomena involved.

2. Materials and Methods

2.1. Alloy Preparation

This study used a portable graphite crucible metal smelting furnace to prepare multiple aluminum alloys. The raw materials were industrial pure Al plates (99.99%), Ga blocks (99.99%), In particles (99.99%), and Sn particles (99.99%). The melting points of the metals are shown in Table 1.
In the experiment, 10 types of Al-Ga-In-Sn aluminum alloy ingots with different composition ratios were prepared using the metal smelting method (sample numbers 1–10). We weighed a total of 20 g of different alloying elements and mixtures of different mass ratios into a custom-sized cylindrical quartz crucible and then put the quartz crucible into the melting furnace, continued to pass CO2 into the furnace, and set the melting temperature of the melting furnace to 850 °C. The smelted alloy ingots were placed in sealed sample bags, and these sample bags were placed in a large amount of discolored silica gel particles to reduce oxidation. If necessary, we cut the ingot appropriately to obtain the appropriate size for later experiments. The alloy chemical compositions for experiment are shown in Table 2.

2.2. Observation of Phase Structure and Microstructure

The Merlin Compact scanning electron microscope (SEM) and the OXFOFD energy spectrometer (EDS) attached to a microscope were used to analyze the microstructure and composition of the alloy ingot and the product after the hydrolysis reaction. In addition, SmartLab (9 kW) X-ray diffraction for phase analysis was used, with Cu Kα as the radiation source, while other details were as follows: the scanning speed was 10–80°, the step size was 0.2°, and the acquisition and scanning speed was 10°/min. The thermodynamic monitoring and analysis of alloy ingots were analyzed by a Setaram Evolution 2400 thermal analyzer (TG-DSC). The measurement temperature range was 23–615 °C, and the scanning speed was 5 °C/min.

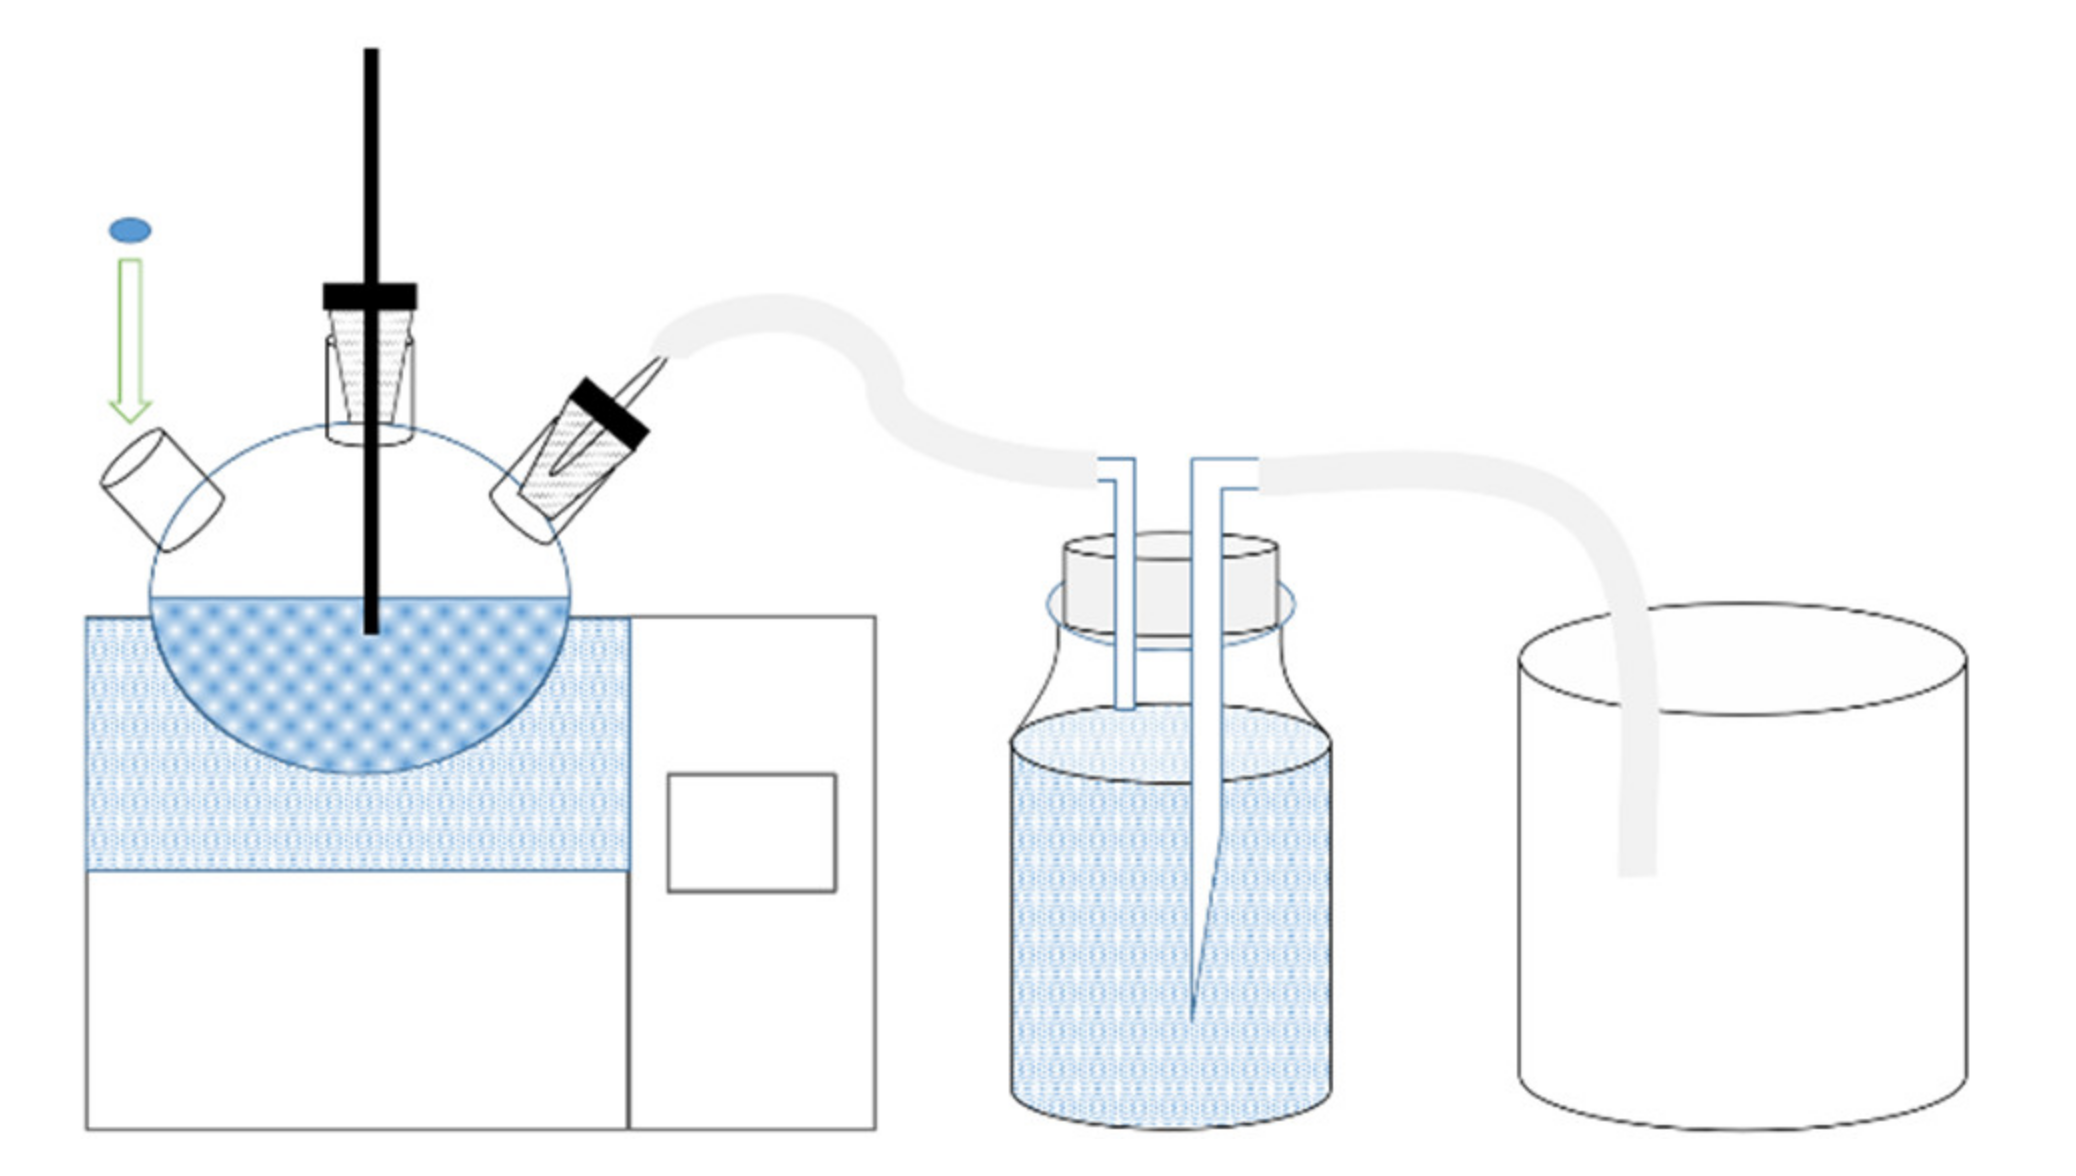
2.3. Test on Hydrolysis Performance of Aluminum Alloy

The test can be described as follows. We put 200 mL of tap water into a three-necked flask with a volume of 500 mL, placed it in an electronic constant temperature water bath furnace, and set the temperature of the water bath furnace to 60 °C. We cut out a 1 g sample and put it in the flask, then used the drainage method to calculate the amount of hydrogen generated, used an electronic weighing accuracy of 0.01 g to weigh the collected water, and used Equation (1) to convert the volume of hydrogen. The proportion of the sample was measured 3 times under certain conditions, and the final average value was taken. A schematic diagram of the hydrogen production reaction device is shown in Figure 1.
In reaction Equation (1), V is the volume of hydrogen generated, m is the mass of discharged water, and ρ is the density of water. We used Equation (2) to calculate the hydrogen production conversion rate of the alloy at different ratios. In the formula, R1 is the hydrogen production conversion rate, V is the actual hydrogen production volume, and VT is the theoretically calculated hydrogen production volume. The volume of 1 mol H2 in standard state is 22.4 L, and the volume of H2 produced by 1 g of aluminum is 1245 mL. The experiment was carried out at room temperature and atmospheric pressure (1 atm and 25 °C), and the volume of 1 mol H2 under this condition was 24.45 L. The theoretical volume was 1358.4 mL of H2 produced by 1 g of aluminum.
V = m/ρ,
R1 = V/VT × 100%,
The hydrogen production performance data were taken from the average of three experimental data, and the changes in hydrogen production and hydrogen production rate of multi-element aluminum alloys under different proportions were explored and rationally analyzed. After the reaction, the reactant obtained was dried in a drying oven at 150 °C before proceeding to the next step of analysis.

3. Results and Discussion

3.1. SEM Observation and Analysis

In order to study the microstructure of the alloy ingots, scanning electron microscopy and energy spectrum tests were carried out on the multi-element aluminum alloy ingots with different proportions. The sample was highly active and easily oxidized, so it needed to be quickly put into the sample table and vacuumed. It can be seen from Figure 2 that, under the microscopic conditions, when the proportion of Ga-In-Sn (GIS) is 50 wt.%, the surface structure appears granular. As the proportion of low-melting-point metals in the alloy decreases, the alloy surface becomes less grainy and the surface becomes smoother dense and slatted. As the alloy is solidified and formed after natural cooling in the molten state, a large amount of internal stress in the alloy leads to a fracture of the alloy during the nucleation process, resulting in a large number of voids and cracks in the alloy.
It can be seen from the EDS surface scan results in Figure 3 that a large amount of off-white low-melting alloy phases are scattered on the grain boundary surface of the alloy. Its main component is composed of low-melting-point metal Ga, followed by a small amount of In, Sn, and Al. Combined with the EDS surface scan, it can be observed that the distribution of elements in the alloy is relatively uniform, but there is still a certain degree of segregation. One of the main reasons for this phenomenon is that the solubility of the alloy decreases in the solid state. According to the alloy phase diagram, the degree of intermetallic compound formation is limited. Therefore, segregation occurs in a local area of the alloy. The second reason is that only a small amount of low-melting-point metal forms a solid solution with Al when the temperature drops. Large amounts of Ga, In, and Sn exist in the α-Al phase as segregation. According to Figure 2d, in addition to the spherical low-melting-point alloy phase, there are other alloy phases with different sizes. There are also a lot of low-melting metals in the gap. The main reason for the above phenomenon is that the metal aluminum solidifies in the form of dendrite during solidification. At the same time, the low-melting-point metal has limited solid solubility in aluminum, which leads to the liquid low-melting-point metal being squeezed into the cracks of aluminum grain. With the continuous decrease in temperature, the gap phases of different sizes are solidified and precipitated out. The size and shape of the gap phase are related to the proportion of low-melting-point metal in the alloy. The larger the proportion is, the more brittle the alloy, the more easily it is broken, and the larger the size of the gap phase.
The microstructure of the reaction product after the hydrolysis reaction is shown in Figure 4. Observation at 1000× times shows that the morphology of the hydrolyzed product is lamellar, agglomerating together in a massive form. Compared with the alloy particles before the reaction, the degree of fragmentation is increased and a large amount of the internal structure of the particles is dispersed due to progress in the hydrolysis reaction, showing the shape of needles and phosphorus flakes. At a high magnification of 10,000×, it can be observed that the hydrolyzed product has a large number of pores, which may be due to the release of a large amount of hydrogen from the aluminum–water reaction.

3.2. XRD Examination

Figure 5 is the XRD pattern of two groups of ingots with different GIS ratios. It can be seen from the figure that there are three characteristic peaks, and the four sharper characteristic peaks are characteristic peaks of Al, the strength of which is significantly higher than that of other phases. There is no obvious characteristic peak of Ga because Ga enters into the lattice of Al to form a solid solution. The characteristic peak is covered by the characteristic peak of Al. With the increase in Ga content, the characteristic peak of Al has an obvious phenomenon of left deviation. The peaks of In3Sn and In are relatively weak. When the ratio degree of In-Sn is 3:1, it is concluded that there are more second phases on the alloy surface according to SEM diagram observation and EDS component analysis, and the second phase is In3Sn combined with the XRD results. When the ratio of In-Sn is 2:1, the characteristic peak of In3Sn cannot be detected but the characteristic peak of weak In can be detected. After hydrolysis reaction, some spherical droplets can be observed after the hydrolysate is dried. Therefore, the hydrolysate was further analyzed by X-ray diffraction, and the results are shown in Figure 6. The obvious characteristic peak of In3Sn can be seen in the figure, which proves that the liquid alloy phase does exist in this aluminum alloy. It is because of this liquid alloy phase that aluminum can be continuously solvated in liquid phase. Finally, it can diffuse freely and be transported to the surface of the alloy to make contact with water to produce hydrogen by hydrolysis reaction.
Different drying products were generated from aluminum alloy hydrolyzed products at different drying temperatures. Al(OH)3 was generated when the drying temperature was lower than 72 °C. The drying product is AlOOH in the range of 72–172 °C. When the drying temperature is greater than 172 °C, the hydrolysis product is Al2O3. In this experiment, the drying temperature was 150 °C, so the characteristic peak detected by X-ray diffraction was AlOOH.

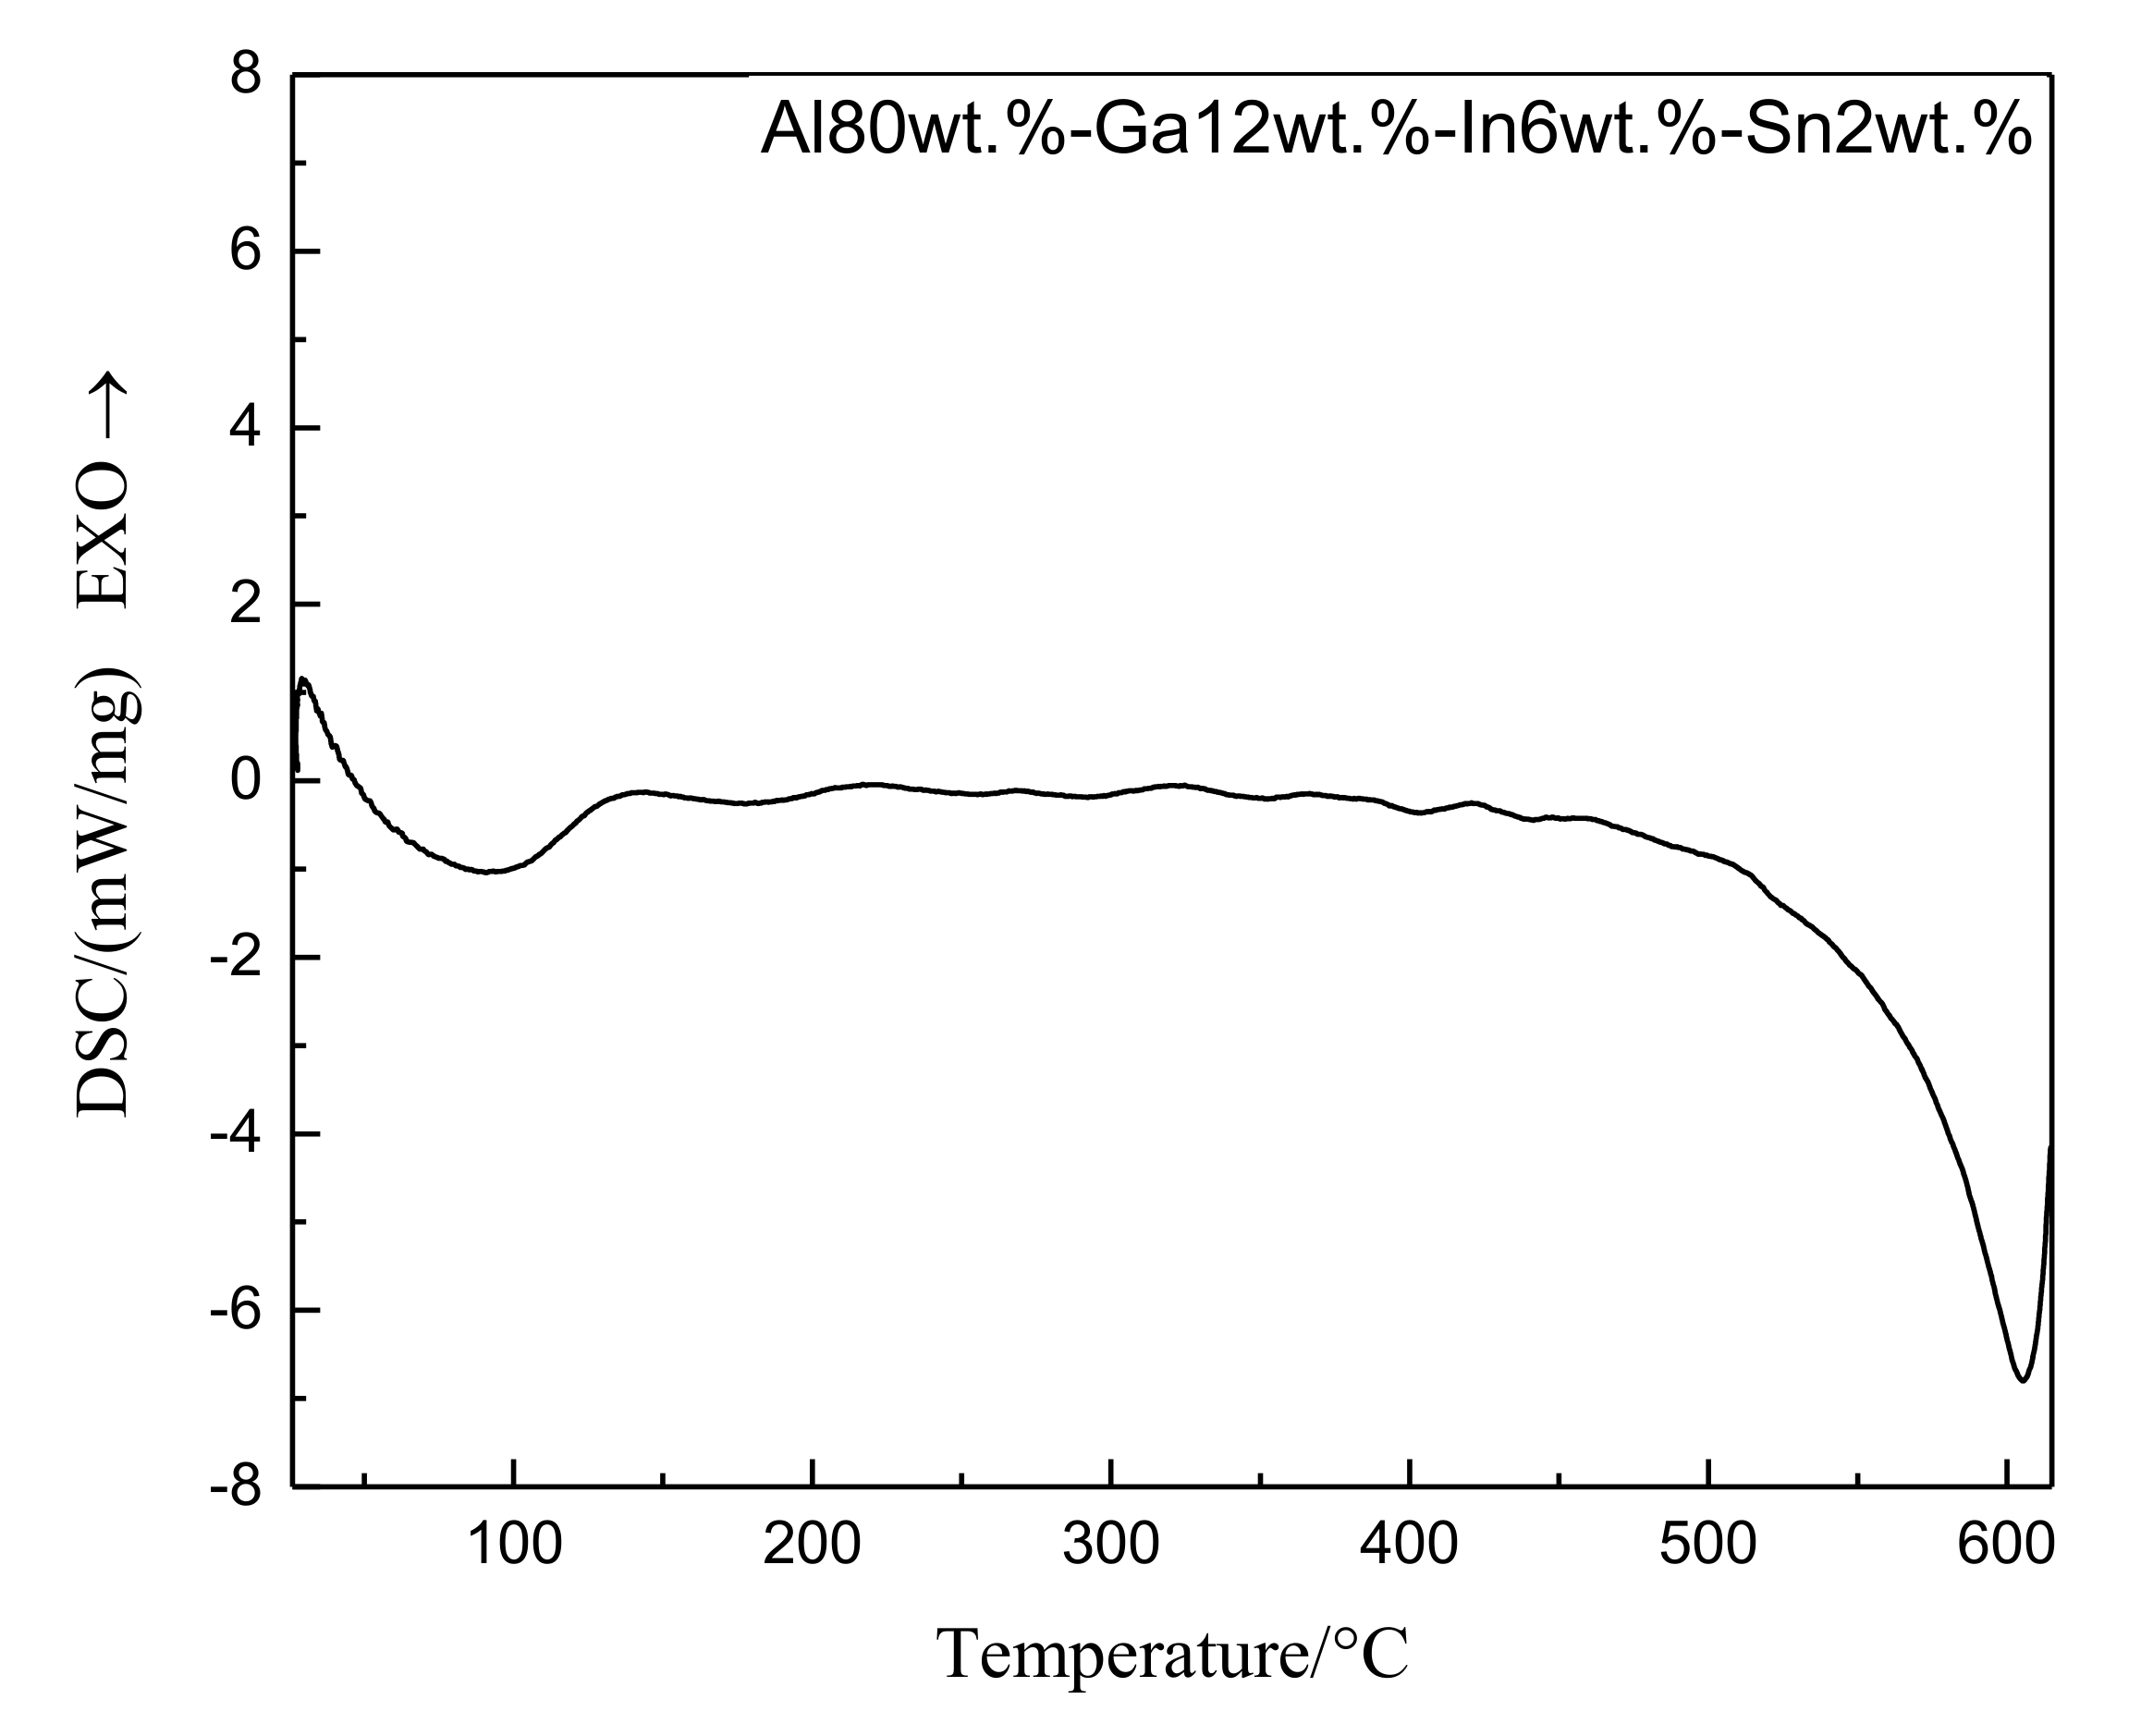
3.3. DSC Analysis of Alloy Ingot

Figure 7 shows the DSC heating curve of Sn alloy samples with the ratio of 80 wt.%Al-12 wt.% Ga-6 wt.%In-2 wt.%Sn alloy. The test temperature range was 23–615 °C, and the heating rate was 20 °C/min. During the heating process, the alloy has an endothermic peak due to melting at the melting point. In the figure, a small endothermic peak can be observed around 30 °C. According to the Al-Ga binary phase diagram, the eutectic temperature of the Al-Ga binary alloy is 26.6 °C. The temperature here is close to the eutectic temperature of the Al-Ga binary alloy. The phase transition occurred in 46 °C alloy, and it is speculated that the liquid phase is eutectic formed by gallium, indium, and tin alloy with a low melting point. After that, there is a weak characteristic peak at 142 °C. According to a In-Sn binary phase diagram, the melting point range of In3Sn is relatively large, which is about 120–143 °C. Combined with EDS component analysis and XRD analysis, it is concluded that the characteristic peak should be caused by the formation of intermetallic compound In3Sn. As the temperature rises, there is no obvious change from 200 °C to 500 °C until an obvious endothermic peak appears at 605 °C. A more sharp peak corresponds to the melting point value of the alloy, which should be the melting point of the aluminum-based solid solution.

3.4. Analysis of Alloy Hydrogen Production Performance

Woodall et al. [29] first studied the optimization of the hydrogen production performance of aluminum alloys using low-melting point metals and proposed the diffusion activation mechanism of aluminum alloy ingot hydrolyzed to produce hydrogen. The essence of the mechanism is the eutectic reaction between the low-melting-point metal, with aluminum as the driving force. The aluminum atoms at the grain boundaries are wrapped by the liquid metal, resulting in the rupture of the dense oxide film, which can contact water and undergo a hydrolysis reaction. The low-melting-point metal does not participate in this process. The hydrolysis reaction produces a concentration difference with the continuous consumption of aluminum, and the unreacted aluminum atoms continue to diffuse from the aluminum lattice into the liquid alloy until the aluminum is basically consumed by the hydrolysis reaction. The quantity and rate of hydrogen production are two important indexes to measure the hydrogen production performance of alloys.
In order to test the effect of changing the ratio degree of low-melting alloy and increasing the content of the second-phase In3Sn on the hydrogen production performance, the hydrolytic hydrogen production test was carried out on the multi-component aluminum alloy with different contents in a constant temperature water bath at 60 °C. Figure 8 is the comparison diagram of the hydrogen production performance of aluminum alloy under different metal ratios at low melting points.
Figure 8a–d show the hydrogen yield and hydrogen production rate curves of different Al contents hydrolyzed in water at 60 °C when the ratios of GIS (Ga-In-Sn) are 7:2:1 and 6:3:1. As can be seen from Figure 8a,c, when GIS is 7:2:1, hydrogen production and hydrogen production rate are the highest when Al content is 80%, and only when Al content is 80% and 90%, the reaction is basically complete within 20 min while the reaction time of other contents is relatively long. In Figure 8b,d, the GIS is 6:3:1. According to previous detection and analysis, when In and Sn exist in the alloy at a ratio of 3:1, the possibility and content of the second-phase In3Sn are improved. It can be clearly observed in the figure that, although the change in Al content in the alloy affects the proportion of low-melting-point alloy in the multi-alloy, the alloy basically reacts completely within about 20 min. Compared with the influence of the proportions of two different low-melting metals on Al content of 90%, the low-melting metals only accounted for 10% at this time. When the GIS was 7:2:1, the hydrogen production was reduced and the hydrogen production rate was only 80.96% due to the decrease in low-melting metal content. The maximum hydrogen production rate was up to 157 mL/g min and the hydrogen production rate was up to 97.99% when GIS was 6:3:1.
Figure 9a,b are the comparison diagrams of hydrogen production and hydrogen production rate when the Al content is 50% and the Al content is 90% under different GIS ratios. It can be seen from the figure that the hydrogen production, hydrogen production rate, and maximum hydrogen production rate when the GIS ratio is 6:3:1 are significantly higher than those when GIS ratio is 7:2:1, regardless of the proportion of low-melting point metal in the alloy being the highest (50 wt.%) or the lowest (10 wt.%). Considering the improvement in hydrogen production performance and the reduction in production cost, In and Sn can be used to share the cost of expensive Ga when the GIS ratio is 6:3:1. Under these conditions, aluminum can be hydrolyzed sufficiently even if the content of low-melting-point metal is reduced, so that the whole reaction can reach a faster reaction rate and can obtain the ideal hydrogen production rate.

4. Conclusions

It is a safer and more environmentally friendly hydrogen production technology to hydrolyze aluminum after alloying. High purity hydrogen is not only a good alternative to fossil fuels but also an ideal hydrogen source for fuel cells. It is an important research direction to produce hydrogen immediately and to supply hydrogen on demand. In this work, multi-element aluminum alloy was smelted in a portable metal smelting furnace with CO2 continuously introduced, in which the ratios of low-melting-point metals Ga, In, and Sn were 7:2:1 and 6:3:1. The alloy ingot was hydrolyzed in a constant temperature water bath furnace at 60 °C within 24 h after melting and casting. The hydrogen production properties of the alloys with different proportions were compared. Combined with SEM, EDS, XRD, and DSC for further analysis, the observation results are as follows:
(1)
While using low-melting-point metals Ga, In, and Sn to improve the hydrogen production performance of aluminum hydrolysis, changing the proportion degree of low-melting-point metals can effectively improve the hydrogen production amount and rate.
(2)
Combining the results of scanning electron microscopy and X-ray diffraction, the following conclusions can be drawn: when the ratio of In and Sn in the alloy is 3:1, the occurrence probability and content of the alloy phase In3Sn can be effectively improved.
(3)
When GIS is 7:2:1, because of the decrease in metal content at low melting point, the alloy phase that can promote hydrolysis reaction cannot be formed better, resulting in a reduction in hydrogen production far below the theoretical value. However, when GIS is 6:3:1, the maximum instantaneous hydrogen production rate is up to 157 mL/(g min) and the hydrogen production efficiency is very close to the theoretical value.

Author Contributions

Conceptualization, Z.G.; methodology, F.J. and C.Y.; investigation, Z.G., F.J., and D.C.; writing—original draft preparation, F.J.; writing—review and editing, Z.G. and J.B.; supervision, J.N. and J.B. All authors have read and agreed to the published version of the manuscript.

Funding

This research was funded by the National Natural Science Foundation of China (grant No. 51245008) and by the Science and Technology Project of Henan Province, China (No. 202102210036).

Institutional Review Board Statement

Not applicable.

Informed Consent Statement

Not applicable.

Data Availability Statement

Not applicable.

Conflicts of Interest

The authors declare no conflict of interest.

References

  1. Sun, H. Hydrogen energy is arousing great attention all over the world. Int. J. Hydrogen Energy 2020. [Google Scholar] [CrossRef]
  2. Von Jouanne, A.; Brekken, T.K.A. Ocean and Geothermal Energy Systems. Proc. IEEE 2017, 105, 2147–2165. [Google Scholar] [CrossRef]
  3. Srinivasan, M.; Velu, A.; Madhubabu, B. The Potential Impact of Solar Technology on the Environment. J. Energy Chem. 2019, 1. [Google Scholar]
  4. Dawood, F.; Anda, M.; Shafiullah, G.M. Hydrogen production for energy: An overview. Int. J. Hydrogen Energy 2020, 45, 3847–3869. [Google Scholar] [CrossRef]
  5. Dincer, I.; Acar, C. Innovation in hydrogen production. Int. J. Hydrogen Energy 2017, 42, 14843–14864. [Google Scholar] [CrossRef]
  6. Momirlan, M.; Veziroǧlu, T. Recent directions of world hydrogen production. Renew. Sust. Energ. Rev. 1999, 3, 219–231. [Google Scholar] [CrossRef]
  7. Mayakrishnan Gopiraman, D.D.S.G. Sustainable and Versatile CuO/GNS Nanocatalyst for Highly Efficient Base Free Coupling Reactions. ACS Sustain. Chem. Eng. 2015, 3, 150904102130008. [Google Scholar]
  8. Sathiskumar, C.; Ramakrishnan, S.; Vinothkannan, M.; Kim, A.R.; Karthikeyan, S.; Yoo, D.J. Nitrogen-Doped Porous Carbon Derived from Biomass Used as Trifunctional Electrocatalyst toward Oxygen Reduction, Oxygen Evolution and Hydrogen Evolution Reactions. Nanomaterials 2019, 10, 76. [Google Scholar] [CrossRef] [PubMed] [Green Version]
  9. Yaqiong, Z.; Jiawei, C.; Qiang, P.; Lingzhi, S.; Zhigang, W.; Zhongkai, W. Hydrogen bonding assisted toughness enhancement of poly(lactide blended with a bio-based polyamide elastomer of extremely low amounts. Appl. Surf. Sci. 2020, 506, 144684. [Google Scholar]
  10. Zhiznin, S.Z.; Vassilev, S.; Gusev, A.L. Economics of secondary renewable energy sources with hydrogen generation. Int. J. Hydrogen Energy 2019, 44, 11385–11393. [Google Scholar] [CrossRef]
  11. Irankhah, A.; Fattahi, S.M.S.; Salem, M. Hydrogen generation using activated aluminum/water reaction. Int. J. Hydrogen Energy 2018, 43, 15739–15748. [Google Scholar] [CrossRef]
  12. Dupiano, P.; Stamatis, D.; Dreizin, E.L. Hydrogen production by reacting water with mechanically milled composite aluminum-metal oxide powders. Int. J. Hydrogen Energy 2011, 36, 4781–4791. [Google Scholar] [CrossRef]
  13. Czech, E.; Troczynski, T. Hydrogen generation through massive corrosion of deformed aluminum in water. Int. J. Hydrogen Energy 2010, 35, 1029–1037. [Google Scholar] [CrossRef]
  14. Choi, G.; Ziebarth, J.T.; Woodall, J.M.; Kramer, R.; Allen, C.R. Mechanism of Hydrogen Generation via Water Reaction with Aluminum Alloys. In Proceedings of the 2010 18th Biennial University/Government/Industry Micro/Nano Symposium, West Lafayette, IN, USA, 28 June–1 July 2010; pp. 1–4. [Google Scholar]
  15. Saluena Berna, X.; Martinez Maezlu, R.; Borge Bravo, G.; Daga Monmany, J.M.; Martinez Lopez, J. Generating Hydrogen by Means of Reaction with Aluminium. U.S. Patent Application 14/765,062, 17 December 2015. [Google Scholar]
  16. Ilyukhina, A.V.; Ilyukhin, A.S.; Shkolnikov, E.I. Hydrogen generation from water by means of activated aluminum. Int. J. Hydrogen Energy 2012, 37, 16382–16387. [Google Scholar] [CrossRef]
  17. Parmuzina, A.V.; Kravchenko, O.V. Activation of aluminium metal to evolve hydrogen from water. Int. J. Hydrogen Energy 2008, 33, 3073–3076. [Google Scholar] [CrossRef]
  18. Fan, M.Q.; Sun, R.X.; Xu, R. Study of the controllable reactivity of aluminum alloys and their promising application for hydrogen generation. Energy Convers. Manag. 2010, 51, 594–599. [Google Scholar] [CrossRef]
  19. Reboul, M.C.; Gimenez, P.; Rameau, J.J. A Proposed Activation Mechanism for Al Anodes. Corrosion 2012, 40, 366–371. [Google Scholar] [CrossRef]
  20. Huang, X.N.; Wu, Z.H.; Cao, K.; Zeng, W.; Lv, C.J.; Huang, Y.X. Hydrogen Generation by Hydrolysis of the Ball Milled Al-C-KCl Composite Powder in Distilled Water. Key Eng. Mater. 2012, 519, 87–91. [Google Scholar] [CrossRef]
  21. Razali, H.; Sopian, K.; Mat, S. The Application of Aluminum and Hydrochloric Acid to Produce Hydrogen for Internal Combustion Engine Via Hydrogen Mixture with Gasoline based on Specific Fuel Consumption. In Advanced Materials Research; Trans Tech Publications Ltd.: Bäch, Switzerland, 2012; Volume 875, pp. 1804–1811. [Google Scholar]
  22. Gai, W.Z.; Fang, C.S.; Deng, Z.Y. Hydrogen generation by the reaction of Al with water using oxides as catalysts. Int. J. Energy Res. 2014, 38, 918–925. [Google Scholar] [CrossRef]
  23. Kunowsky, M.; Suárez García, F.; Linares Solano, Á. High pressure hydrogen storage. Investigació 2013. [Google Scholar] [CrossRef] [Green Version]
  24. Qiao, D.; Lu, Y.; Tang, Z.; Fan, X.; Wang, T.; Li, T.; Liaw, P.K. The superior hydrogen-generation performance of multi-component Al alloys by the hydrolysis reaction. Int. J. Hydrogen Energy 2019, 44, 3527–3537. [Google Scholar] [CrossRef]
  25. Wang, C.; Yang, T.; Liu, Y.; Ruan, J.; Yang, S.; Liu, X. Hydrogen generation by the hydrolysis of magnesium-aluminum-iron material in aqueous solutions. Int. J. Hydrogen Energy 2014, 39, 10843–10852. [Google Scholar] [CrossRef]
  26. Wang, D. Analyzing the Feasibility of Generating Hydrogen Al-Ga Alloy using Fly Ash as Raw Materials. Shenhua Sci. Technol. 2016, 14, 7–10. [Google Scholar]
  27. Yoo, H.; Ryu, H.; Cho, S.; Han, M.; Bae, K.; Lee, J. Effect of Si content on H 2 production using Al–Si alloy powders. Int. J. Hydrogen Energy 2011, 36, 15111–15118. [Google Scholar] [CrossRef]
  28. Evans, D.S.; Prince, A. Thermal analysis of Ga-In-Sn system. Met. Sci. 2013, 12, 411–414. [Google Scholar] [CrossRef]
  29. Woodall, J.M.; Ziebarth, J.; Allen, C.R. The Science and Technology of Al-Ga Alloys as a Material for Energy Storage, Transport and Splitting Water. In Proceedings of the Asme Energy Nanotechnology International Conference, Santa Clara, CA, USA, 5–7 September 2007. [Google Scholar]
Figure 1. Schematic diagram of hydrogen production performance test device.
Energies 14 01433 g001
Figure 2. Scanning electron microscopy (SEM) image at 5000× of the aluminum alloy when the ratio of Ga-In-Sn is 7:2:1 and 6:3:1: (a) 50 wt.%Al-50 wt.%Ga-In-Sn (GIS) (7:2:1), (b) 50 wt.%Al-50 wt.%GIS (6:3:1), (c) 80 wt.%Al-20 wt.%GIS (7:2:1), and (d) 80 wt.%Al-20 wt.%GIS (6:3:1)).
Energies 14 01433 g002
Figure 3. Scans of 80 wt.%Al-20 wt.%GIS (6:3:1) EDS surface of the alloy: (a) SEM diagram of the aluminum alloy at 10,000×, (b) EDS hierarchical image, (c) Al layer, (d) Ga layer, (e) In layer, and (f) Sn layer.
Energies 14 01433 g003
Figure 4. SEM images of the 50 wt.%Al-50 wt.%GIS (6:3:1) reaction product at (a) 1000× and (b)10,000×.
Energies 14 01433 g004
Figure 5. Alloy ingot X-ray diffraction (XRD) with different GIS contrasts.
Energies 14 01433 g005
Figure 6. GIS XRD map of hydrolysate at 6:3:1.
Energies 14 01433 g006
Figure 7. Temperature rise curve of differential scanning calorimetry (DSC) of alloy samples.
Energies 14 01433 g007
Figure 8. Comparison of the hydrogen generation performance of Al-Ga-In-Sn alloys: (a) hydrogen production comparison with GIS ratio 7:2:1, (b) hydrogen production comparison with GIS ratio 6:3:1, (c) hydrogen production rate comparison with GIS ratio 7:2:1, and (d) hydrogen production rate comparison with GIS ratio 6:3:1.
Energies 14 01433 g008
Figure 9. Comparison of hydrogen production performance of Al50 and Al90 at different GIS ratios: (a) hydrogen production comparison chart and (b) hydrogen production rate comparison chart.
Energies 14 01433 g009
Table 1. The melting points of the metals.
MaterialsAlGaInSn
melting point (°C)660.0029.76156.61231.89
Table 2. Alloy compositions used for experiments.
Specimen No.Element (wt.%)
AlGaInSn
1#5035105
2#602884
3#702163
4#801442
5#90721
6#5030155
7#6024124
8#701893
9#801262
10#90631
Publisher’s Note: MDPI stays neutral with regard to jurisdictional claims in published maps and institutional affiliations.

