Abstract
Settings of protection are essential to ensure the sensitivity and selectivity needed to detect defects. Making the correct settings requires the calculation of the fault currents with as little error as possible. Fault currents are influenced by the parameters of the electrical networks, including the state of the insulation and the Petersen coil, which changes during their operation electrical networks. This paper analyzes how the insulation parameters of medium voltage power lines, the parameters of the Petersen coil used to treat the neutral of the medium voltage electrical network and the value of the resistance at the fault location influence the fault current in the case of a single-phase fault. The large number of single-phase faults that occur in medium voltage electrical networks justifies this analysis. The symmetrical components method was used to calculate the fault current. The results obtained by calculation were verified experimentally by causing a single-phase-to-ground fault in a real medium voltage network. The paper presents the situations in which the analytical calculation of the single-phase-to-ground fault current can lead to inadmissibly large errors, even over 50%, but also the situations in which the errors fall below 3%.
1. Introduction
Single-phase-to-ground faults are most commonly encountered in the operation of medium voltage electrical networks [1,2,3], which is why it is necessary to develop protection systems that allow for the selective detection of these faults [4,5,6,7,8,9,10,11]. For the correct adjustment of the protective relays, it is important that the analytical determination of the single-phase-to-ground fault current is made with the best possible accuracy. In the analysis of the protective relay settings, it must be taken into account that in the case of medium voltage networks with a resonant ground system, the current intensity values when the fault is single phase are low, which is the reason why unbalanced three-phase loads can significantly influence the value of these currents [5,6,12,13,14,15,16,17,18,19]. Ensuring the resonance regime of medium voltage networks with a resonant ground system requires the need to make coils with controllable parameters [20,21,22] which can be changed depending on the characteristics of the medium voltage network. The high-precision determination of the single-phase fault current requires the knowledge of how various parameters specific to medium voltage electrical networks influence the fault current as a complex quantity (effective value and phase). This paper analyzes the influence of the insulation state of medium voltage networks, and particularly, the characteristics of the Petersen coil on the single-phase-to-ground fault current. In the literature it is usually considered that the Petersen coil is ideal (the electrical resistance of the coil is zero) and the network insulation is perfect (the electrical resistance of the insulation is infinite). The mathematical model for calculating the single-phase fault current is presented in the literature, but the insulation of the medium voltage network is usually considered to be ideal, i.e., the losses of active power in the insulation are neglected, and in the equivalent scheme it is considered that the electrical resistance of the insulation (Riz) has infinite value. It is also considered that the Petersen coil is ideal, i.e., in the equivalent scheme of the coil only its reactance occurs, and that the electrical resistance (RPC) equivalent to the coil has the value zero. The paper shows that accepting these simplifications using the mathematical model to calculate the single-phase fault current can lead to unacceptable errors. Very large errors can be made even if the Riz and RPC parameters are not neglected in the mathematical model, but the values considered for them are far from reality. As a result, the phase angle between the current through the Petersen coil () and its voltage () is less than 90°. The phase difference between the voltage and the current is denoted by . Thus, in the equivalent scheme the coil also intervenes in the electrical resistance, and not only the inductive reactance. Furthermore, the capacitive current of the medium voltage network () has an active component, which causes an electrical resistance to intervene in the equivalent scheme in parallel with the capacitive reactance. The phase difference between the zero-sequence voltage of the medium voltage bus bars in the transformer substation () and the total capacitive current of electrical networks must be less than 90°. The phase difference between the zero-sequence voltage of the medium voltage bus bars in the transformer substation () and the total capacitive current of electrical networks is denoted by . In the paper, it is considered that these phase angles vary in the range [83°–90°]. This paper also analyzes the influence of the resistance at the fault location Rt on the single-phase fault current. For this parameter, the values 8 Ω, 100 Ω, 268 Ω, 575 Ω and 1100 Ω were considered.
The analytical results were verified experimentally in a real medium voltage network by causing single-phase-to-ground faults. The 20 kV electrical network in which the experimental determinations were performed is in the city of Calan in the Hunedoara region of Romania. Figure 1 shows the diagram of the medium voltage network in which the single-phase fault was analyzed. Single-phase faults were caused in the same medium voltage network to verify the results obtained using the analytical model for the calculation of the fault current in the case of the single-phase fault. The notations used in the scheme in Figure 1 have the following meanings:
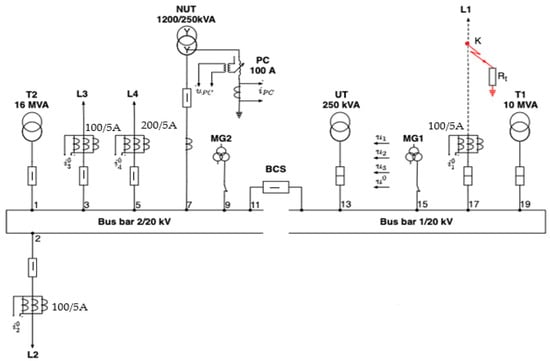
Figure 1.
The scheme of the substation and the medium voltage electrical network.
- T1 and T2 power transformers with apparent powers 10 MVA and 16 MVA, respectively, and voltages of 110/20 kV. Transformer T1 is not connected to bus bar 1 (this results from Figure 1), so it does not influence the fault;
- NUT utility transformer of 20/0.4 kV having the connection of the primary winding in a zig-zag, and which is used to achieve the artificial neutral. The nominal apparent power is 1200/250 kVA (NUT has different apparent powers for the primary and secondary winding, because the 20 kV winding of the transformer is also used to create the null point of the 20 kV grid, to which the Petersen coil is connected, and the apparent power of the primary winding is higher than of the secondary winding. This solution is used in most 110/20 kV substations in Romania.);
- UT—utility transformer, at 20/0.4 kV with an apparent power of 250 kVA;
- L1—the 20 kV line on which the single-phase fault occurs, having practically zero capacitive current, with the fault being caused in the line cell, and the line separator open;
- L2—the 20 kV line whose capacitive current is 6.9 A and is out of phase before the zero-sequence voltage by 75° (1.31 radians);
- L3—the 20 kV line whose capacitive current is 20.5 A and is out of phase before the zero-sequence voltage by 88° (1.54 radians);
- L4—the 20 kV line whose capacitive current is 21.1 A, and is out of phase before the zero-sequence voltage by 86° (1.5 radians);
- Rt—the resistance at the fault location;
- BCS—the bus coupler switch;
- MG1—the measuring group of bus bar system 1;
- MG2—the measuring group of bus bar system 2.
The method of symmetrical components was used to calculate the single-phase fault current. The use of the symmetrical components method assumes that the quantities have sinusoidal variation over time, so the aperiodic component that intervenes in the fault current is assumed to be amortized. This simplification is accepted in the literature [23,24,25].
2. The Mathematical Model for the Analysis of a Single-Phase-to-Ground Fault
Figure 2 shows an asymmetric three-phase element in which U1, U2 and U3 are the phase voltages represented in the complex, are the phase currents represented in the complex, and are the phase impedances represented in the complex. The sequence voltages as a function of the phase voltages are expressed by the relations [23,24,25],
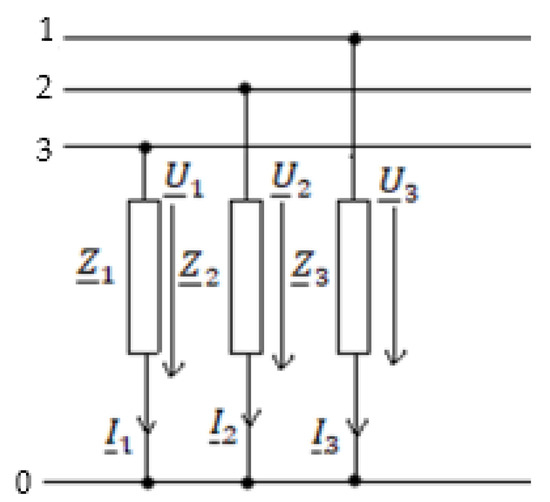
Figure 2.
Unbalanced three-phase element.
In the particular case where the three-phase element is balanced () the relations (1) become,
Relationships (2) show that in the case of a balanced three-phase element, the sequence schemes become independent.
The fault current in the case of a single-phase fault is calculated by applying the Thévenin theorem. Since the calculation of the parameters of the Thévenin generator is done with it operating without load, it results that the parameters of the Thévenin generator are determined in the absence of the single-phase fault. Considering that the phase parameters of the medium voltage network constitute a balanced three-phase circuit, the sequence schemes are independent. If the single-phase fault is on phase 1, the currents of phase 2 and 3 are zero, i.e., the following relations are satisfied,
It follows from relations (3) that the sequence components of the currents in the case of a single-phase fault satisfy the relation.
From relation (4) it results that the sequence schemes, in the case of a single-phase defect, are connected in series (Figure 3).
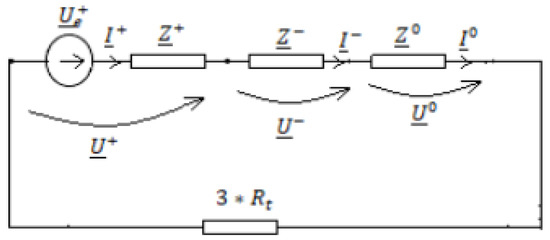
Figure 3.
Connecting sequence diagrams for a single-phase fault.
The significance of the sizes in Figure 3 is as follows: —the plus-sequence components of the three-phase voltages system at the fault site before the fault occurs; —the plus-sequence voltage at the fault location; —the minus-sequence voltage at fault location; —the zero-sequence voltage at the fault location; —the plus-sequence current at fault location; —the minus-sequence current at fault location; —the zero-sequence current at the fault location; —the plus-sequence impedance of the passivated circuit seen from the fault location (positive-sequence network); —the minus-sequence impedance of the passivated circuit seen from the fault location (negative-sequence network); —the zero-sequence impedance of the passivated circuit seen from the fault location (zero-sequence network).
From the scheme shown in Figure 3 for the sequence currents, the following relation results,
Respectively, the single-phase fault current is expressed by the relation,
If it is accepted that the three-phase system of phase voltages at the fault location, before the fault occurs, is symmetrically the minus- and zero-sequence components of the Thévenin generator, and the voltages become zero, the current at the fault location can be expressed by the relation,
3. Computing of Single-Phase-to-Ground Fault Current
For the calculation of the single-phase fault current it is considered that, in the 20 kV network of the diagram in Figure 1, a single-phase defect occurs at the beginning of line L1 (point K in Figure 1). The sequence schemes corresponding to this defect are shown in Figure 4.
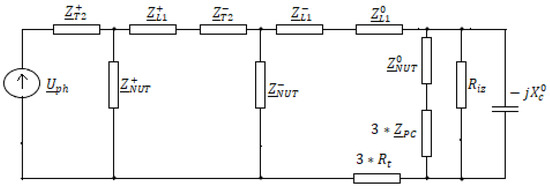
Figure 4.
Equivalent sequence scheme for the single-phase fault in the 20 kV line.
The parameters involved in the scheme diagram in Figure 4 have the following meanings:
- —the electromotive forces of Thévenin equivalent generators, of the plus sequence and of the network of 20 kV as seen from the place of fault (the phase voltage of the faulty phase before causing the fault);
- —the plus-sequence impedance of the transformer T2 in Figure 1;
- —the minus-sequence impedance of the transformer T2 in Figure 1;
- —the plus-sequence impedance from the substation bars to the fault location of the fault line (L1 in Figure 1);
- —the minus-sequence impedance from the substation bars to the fault location of the fault line (L1 in Figure 1);
- —the zero-sequence impedance from the substation bars to the fault location of the fault line (L1 in Figure 1);
- —the plus-sequence impedance of the own service transformer used to achieve the artificial neutral of the 20 kV network (transformer NUT in Figure 1);
- —the minus-sequence impedance of the own service transformer used to achieve the artificial neutral of the 20 kV network (transformer NUT in Figure 1);
- —the zero-sequence impedance of the own service transformer used to achieve the artificial neutral of the 20 kV network (transformer NUT in Figure 1);
- —the impedance of the Petersen coil;
- —the zero-sequence capacitive reactance of the electrical network with voltage 20 kV;
- —the equivalent electrical resistance corresponding to active power losses in the insulation of the electrical network with a voltage of 20 kV;
- —the resistance at the fault location.
In the scheme in Figure 4, the plus-sequence and minus-sequence impedances of own service transformer (UT in Figure 1) were neglected because they had values much higher than the zero-sequence impedance (Table 1). Additionally, the ground impedances (transverse impedances) on the plus and minus sequences of the 20 kV network were neglected because they had much higher values than the longitudinal ones.

Table 1.
The values of the sequence impedances of the elements in the scheme shown in Figure 1.
Given the relation (7), the current at the fault (Ifc) place is computing with the relation,
The values of the sequence impedances of the electrical equipment from the scheme in Figure 1 are presented in Table 1 and Table 2.

Table 2.
The parameters of the 20 kV network without fault lines were determined experimentally.
In Table 2, represents the phase difference between the zero-sequence voltage of the transformer substation bars and the capacitive current of the without fault line (L2, L3 and L4 in Figure 1).
The single-phase-to-ground fault was considered to occur at the beginning of line L1, in the cell of the line in the transformer station. Because of this, the plus-sequence and minus-sequence impedances of the L1 line in relation (8) had values equal to zero. The phase shift angle between the zero-sequence voltage of the substation bars and the total capacitive current of the 20 kV network was denoted by φc.
From the measurements made in the real 20 kV network, it resulted that the phase shift between the total capacitive current () of the 20 kV network and the zero-sequence voltage () of the 20 kV bars in the transformer station was 85.3°, and the phase shift between the current through the compensation coil and the zero-sequence voltage of the 20 kV bars in the transformer station was 86.6°.
The values of the phase electrical resistance to earth of the zero-sequence capacitive reactance, if the phase shift values were between and , were 86°, 87°, 88°, 89°and 90°, respectively, which are presented in Table 3.

Table 3.
The values of the insulation parameters of the electrical network 20 kV.
Table 4 shows the values of the Petersen coil parameters as a function of the phase shift between the coil voltage and the current through the coil, , which represents the resistance of the Petersen coils, and , which represents the reactance of the Petersen coil.

Table 4.
Petersen coil parameters depending on the phase shift between and .
The module in which the insulation characteristics of the 20 kV network, the characteristics of the Petersen coil and the value of the switching resistance at the fault location influence the value of the fault current, when the 20 kV network operates in resonance regime, was analyzed. The results obtained are presented in Table 5, Table 6, Table 7, Table 8, Table 9 and Table 10. The calculation of the fault current was performed considering that the three-phase system of phase voltages, in the absence of the fault, is symmetrical. In this situation , and , respectively are equal to zero.

Table 5.
Effective value of the fault current depending on , when = 85.3° (experimentally determined angle value in the real network 20 kV).

Table 6.
Effective value of the fault current depending on , when = 86.

Table 7.
Effective value of the fault current depending on , when = 87.

Table 8.
Effective value of the fault current depending on , when = 88.

Table 9.
Effective value of the fault current depending on , when = 89.

Table 10.
Effective value of the fault current depending on , when = 90.
4. Experimental Results
The results obtained by calculation were experimentally verified in a real 20 kV mains. Figure 5 shows the diagram of the 20 kV network, the transformer substation and the parameters recorded using a data acquisition system. Figure 5 shows how the data acquisition system and the recording equipment were connected to the measuring groups in the substation. The following parameters were recorded during the fault:
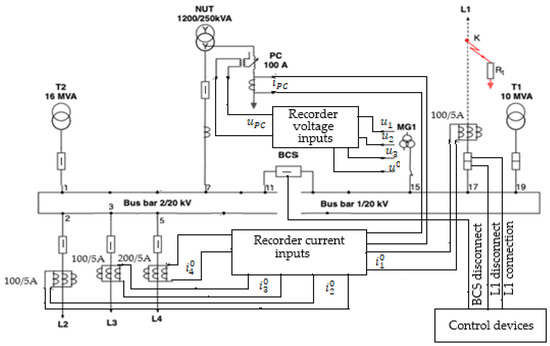
Figure 5.
Wiring diagram of the data acquisition equipment and recording of the measured parameters.
- —the zero-sequence current (fault current) of the line L1 on which the fault occurred;
- —the zero-sequence currents of the non-fault lines;
- —the current through the Petersen coil;
- —the phase voltages of the medium voltage bars in the transformer substation;
- —the zero-sequence voltage of the medium voltage bars in the transformer substation;
- —the Petersen coil voltage.
The parameters were recorded with a digital recorder (CDR-10 in Figure 5).
For the measurements taken in the real networks of 20 kV, command and control equipment was designed and made (control devices in Figure 5). This equipment allows you to perform the following operations: control the start and stop of the recording equipment; adjust the time interval from the start of the recording equipment to the connection of the source to the faulty line; adjust the length of time the faulty line is connected to the source; command to close and disconnect the faulty line switch; command to disconnect the BCS switch (Figure 5) when the faulty line switch does not open. In the real 20 kV network, single-phase defects were made in which the resistance at the fault site had the values: 8 Ω, 100 Ω, 268 Ω, 575 Ω and 1100 Ω.
Figure 6 shows the oscillogram obtained for Rt = 8 Ω, and Figure 7 shows the oscillogram obtained for Rt = 1100 Ω.
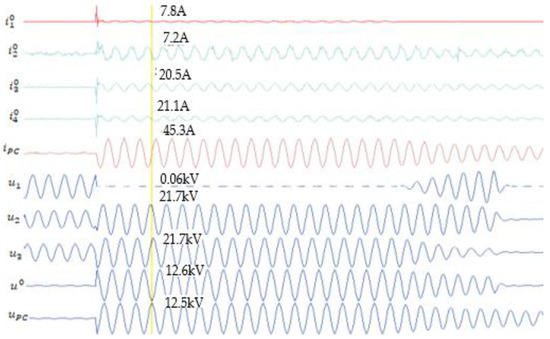
Figure 6.
The waveform of currents and voltages during the single-phase fault when Rt = 8 Ω and the network operates in resonance regime.
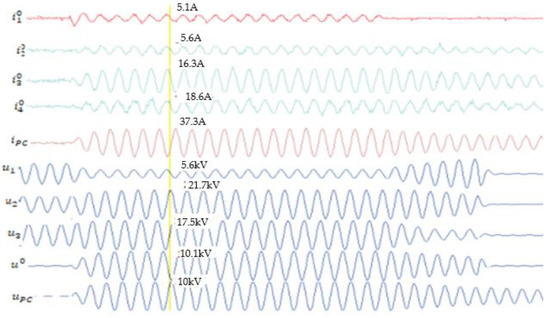
Figure 7.
The waveform of currents and voltages during the single-phase fault when Rt = 1100 Ω and the network operates in resonance regime.
From the oscillogram shown in Figure 6, when the resistance at the edict site was 8 Ω, it was found that the waveform of the current through the fault line was far from the sinusoidal variation. This current contained an important transient component. The transient component also intervened in the capacitive currents of the without fault lines. The Petersen coil current did not contain the transient component.
From the oscillogram shown in Figure 7, when Rt = 1100 Ω, the transient component, both in the current line with fault and in the currents of the lines without defect, was much smaller. For this reason the waveforms of currents were practically sinusoidal. The voltage waveform, both in the oscillogram from Figure 6 when Rt = 8 Ω, as well as in the oscillogram in Figure 7 when Rt = 1100 Ω, was sinusoidal, a hypothesis that was accepted in the analytical calculation of the fault current. The values of currents and voltages during the single-phase-to-ground fault obtained from the measurements in the real network of 20 kV are presented in Table 11.

Table 11.
The values effective of currents and voltages during the single-phase-to-ground fault.
5. Discussion
The assessment of the degree of accuracy of the calculation of the fault current using the mathematical model presented in the paper was made by calculating the difference Ɛ%, between the actual values of the fault current obtained experimentally (Ife) and those obtained by analytical calculation (Ifc). The difference in the percentages of the effective values of the fault current obtained experimentally and analytically was calculated with the relation,
The difference between the effective values of the fault current obtained experimentally and analytically was calculated for the case when the phase shift between voltage u0 and current ic was 85.3, when the insulation of the 20 kV network was ideal (phase shift between u0 and ic is 90). The phase differences between the voltage and the current were 83°, 84°, 85°, 86°, 87°, 88°, 89° and 90°, and the values of the resistance at the fault location were 8 Ω, 100 Ω, 268 Ω, 575 Ω and 1100 Ω. The results obtained are presented in Table 12 and Table 13, respectively.

Table 12.
The difference between the effective values of the fault current determined experimentally and analytically (φc = 85.3°).

Table 13.
The difference between the effective values of the fault current determined experimentally and analytically (φc = 90°).
Figure 8 shows the difference between the measured value () and the calculated value () of the fault current, depending on the phase difference between the voltage and current () of the Petersen coil (), considering the real insulation for electrical networks was 20 kV and the difference phase between and was 85.3°. In this case, the active component of the total capacitive current was no longer zero.
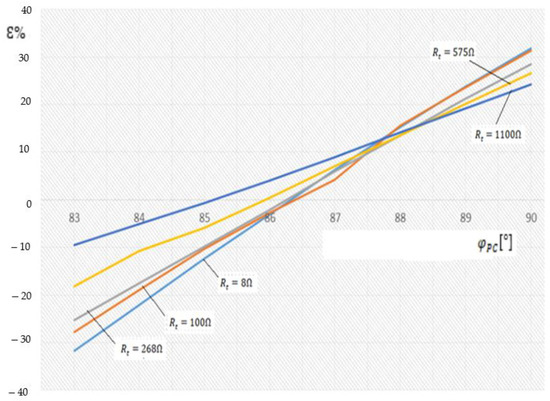
Figure 8.
The dependence of difference between the effective values of the fault current, determined experimentally and analytically, and function on the difference phase between and , when .
Figure 9 shows the difference between the measured value () and the calculated value () of the fault current, depending on the phase difference between the voltage and current () of the Petersen coil (), considering the ideal insulation for electrical networks was 20 kV and the difference phase between and was 90°.
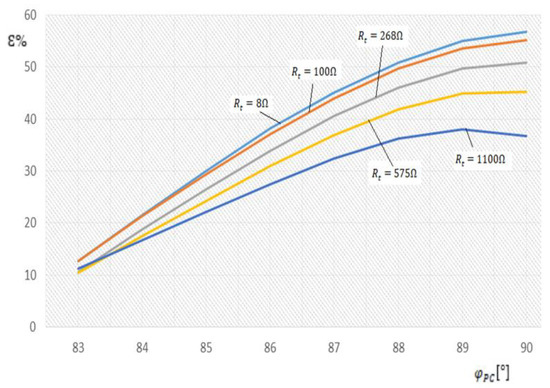
Figure 9.
The dependence of difference between the effective values of the fault current, determined experimentally and analytically, and function on the difference phase between and , when .
The results from Figure 9 show that when considering the insulation of the perfect medium voltage network (the active component of the capacitive current is zero) when the Petersen coil was considered ideal, the errors in determining the single-phase fault current became very large, reaching 56.8% if the resistance value at the fault location was 8 Ω, and 36.7% if the resistance value at the fault location was 1100 Ω.
The smallest errors for determining the single-phase fault current, if the 20 kV mains insulation was considered to be perfect, were obtained when the phase shift between the Petersen coil voltage and the current through it was 85.3°. In this case, the error became 12.6% if the fault resistance at the fault location was 8 Ω and 11.2% if the fault resistance at the fault location was 1100 Ω.
The data from Table 12 and Figure 8 show that the calculation error of the fault current using the analytical method decreased with the increase of the resistance of passage to the fault place. When the Petersen coil was ideal, the maximum value of the error was 31.8% if Rt = 8 Ω and the minimum value of error was 24.3% if Rt = 1100 Ω.
The lowest values of the analytical determination errors of the single-phase fault current were obtained if the insulation of the 20 kV network was considered as imperfect, when the phase shift between the Petersen coil voltage and the current through it was 86°, if the resistance values switching locations are 8 Ω, 100 Ω, 268 Ω and 575 Ω, respectively, and when the phase shift was 85° if the resistance at the fault location was 1100 Ω.
The error obtained by analytically calculating the single-phase-to-ground fault current when the phase shift between and was 86° obtained the values: −2.95% if the resistance at the fault location was 8 Ω and −2.64% if the resistance at the fault location was 100 Ω; −2.02% if the resistance at the fault site was 268 Ω; 0.5% if the resistance at the fault site was 575 Ω. If the phase shift between and was 85°, the analytical calculation error of the single-phase fault current was −0.59% if the resistance at the fault location was 1100 Ω.
6. Conclusions
As the insulation of electrical networks deteriorates over time, its parameters are modified, the active component of the total capacitive current of the medium voltage network changes, and as a result, the value of the single-phase-to-ground fault current changes, which can cause the wrong operating on protective relays. Avoiding the malfunction of the protective relays requires correcting their settings according to the values of the insulation parameters of the medium voltage power lines.
The change in time of the parameters of the Petersen coil, used to treat the neutral of the medium voltage electrical networks, determines the change of the difference phase between the coil voltage and the current through the coil. The electrical resistance value of the coil depends on the electrical resistance of the winding and the losses of active power in the ferromagnetic core of the coil. The non-sinusoidal variation of the current through the coil leads to the increase of the active power losses in the ferromagnetic core, and thus to the increase of the electrical resistance of the coil. The use of a ferromagnetic core with low losses through hysteresis and eddy currents, leads to a decrease in the resistance of the coil, and thus to an increase in the differnce phase between the voltage and the current.
For the Petersen coil to ensure the break of the electric arc from the single-phase-to-ground fault location, the effective value of the fault current must not be higher than 5 A. Table 3, Table 4, Table 5, Table 6, Table 7, Table 8, Table 9 and Table 10 show that the effective value of the single-phase-to-ground fault current is less than 5 A if the resistance of the electric arc is low (<10 Ω), only if the difference phase between and is greater of 86° and if the insulation of the medium voltage network is perfect (the active component of the capacitive current is zero, ). If the insulation of the medium voltage electrical network deteriorates (if decreases) the effective value of the single-phase-to-ground fault current increases, so the conditions of the break of the electric arc at the fault location worsen (Table 5, Table 6, Table 7, Table 8, Table 9 and Table 10).
The results obtained from the measurements performed in the real 20 kV network showed that the mathematical model used to calculate the single-phase fault current led to correct results if the corresponding values of the medium voltage grid parameters were used in the calculation relations.
If we consider both the insulation of the medium voltage network and the Petersen coil as perfect (), the errors involved in the calculation of the single-phase-to-ground fault current are very large, exceeding 50%, so they become unacceptable.
The very large differences between the effective values of the single-phase-to-ground fault current obtained by calculation and determined experimentally are due to the fact that in the calculation used, the values of the parameters Riz and RPC do not correspond to reality. In order to reduce these differences, it is necessary to know the more precise values of the mentioned parameters.
Author Contributions
Conceptualization, D.T. and M.G.; methodology, D.T. and D.V.; software, D.T., M.V. and C.S.; validation, D.T., M.V., C.S. and M.G.; formal analysis, M.G. and D.V.; investigation, D.T. and M.V.; resources, D.T. and M.G.; data curation, D.T.; writing—original draft preparation, C.S.; writing—review and editing, D.T.; visualization, M.G.; supervision, D.T.; project administration, D.T.; funding acquisition, M.G. All authors have read and agreed to the published version of the manuscript.
Funding
This research received no external funding.
Institutional Review Board Statement
Not applicable.
Informed Consent Statement
Informed consent was obtained from all subjects involved in the study.
Data Availability Statement
The data presented in the paper, obtained by calculation, respectively experimentally were not published, which is why data sharing is not applicable to this article.
Conflicts of Interest
The authors declare no conflict of interest.
References
- Gao, Y.; Lin, X.; Liu, P.; Bo, Z. A generalized morphological transform based faulty feeder selector suitable for the non-effectively grounded power systems. In Proceedings of the 2007 IEEE Power Engineering Society General Meeting, Tampa, FL, USA, 24–28 June 2007; pp. 1924–1929. [Google Scholar]
- Li, J.; Wang, G.; Zeng, D.; Li, H. High-impedance ground faulted line-section location method for a resonant grounding system based on the zero-sequence current’s declining periodic component. Int. J. Electr. Power Energy Syst. 2020, 119, 105910. [Google Scholar] [CrossRef]
- Toader, D.; Ruset, P.; Hategan, I.; Deaconu, I.; Pinte, N. Selective detection of simple and double grounding with in the medium voltage electrical networks with compensated null. In Proceedings of the 2009 IEEE Bucharest PowerTech, Bucharest, Romania, 28 June–3 July 2009; pp. 1–9. [Google Scholar]
- Fan, B.; Yao, G.; Wang, W.; Yang, X.; Ma, H.; Yu, K.; Zhuo, C.; Zeng, X. Faulty phase recognition method based on phase-to-ground voltages variation for neutral ungrounded distribution networks. Electr. Power Syst. Res. 2021, 190, 106848. [Google Scholar] [CrossRef]
- Li, Z.; Ye, Y.; Ma, X.; Lin, X.; Xu, F.; Wang, C.; Ni, X.; Ding, C. Single-phase-to-ground fault section location in fexible resonant grounding distribution networks using soft open points. Int. J. Electr. Power Energy Syst. 2020, 122, 106198. [Google Scholar] [CrossRef]
- Liu, Z.; Deng, C. Single-phase ground fault line selection method in active distribution networks based on high-voltage inverter injected signals. DYNA 2019, 94, 1–7. [Google Scholar] [CrossRef]
- Guo, Z.; Yao, J.; Yang, S.; Zhang, H.; Mao, T.; Duong, T. A new method for non-unit protection of power transmission lines based on fault resistance and fault angle reduction. Int. J. Electr. Power Energy Syst. 2014, 55, 760–769. [Google Scholar] [CrossRef]
- Ukrainicev, A.; Nagy, V.; Nagy, I.; Sarry, S.; Chmihaloy, G. Analysis of the functioning of the earth fault protection with active influence on electrical grid. In Proceedings of the 9th International Scientific Symposium on Electrical Power Engineering, Stara Lesna, Slovakia, 12–14 September 2017; pp. 418–421. [Google Scholar]
- Pang, Z.; Du, J.; Jiang, F.; He, L.; Li, Y.L.; Qin, L.; Li, Y. A fault section location method based on energy remainder of generalized S- transform for single-phase ground fault of distribution networks. In Proceedings of the 2018 IEEE 3rd Advanced Information Technology, Electronic and Automation Control Conference (IAEAC 2018), Chongqing, China, 12–14 October 2018; pp. 1511–1515. [Google Scholar]
- Meng, J.; Wang, W.; Tang, X.; Xu, X.Y. Zero-sequence voltage trajectory analysis for unbalanced distribution networks on single-line-to-ground fault condition. Electr. Power Syst. Res. 2018, 161, 17–25. [Google Scholar] [CrossRef]
- Tang, T.; Huang, C.; Li, Z.X.; Yuan, X.G. Identifying faulty feeder for single-phase high impedance fault in resonant grounding distribution System. Energies 2019, 12, 598. [Google Scholar] [CrossRef]
- Zeng, X.J.; Li, K.K.; Chan, W.L.; Yin, X.G. Novel techniques for earth faul feeder detection on negative sequence current in industry power systems. In Proceedings of the Conference Record of the 2001 IEEE Industry Applications Conference. 36th IAS Annual Meeting (Cat. No.01CH37248), Chicago, IL, USA, 30 September–4 October 2001; Volume 1–4, pp. 1831–1837. [Google Scholar]
- Tang, T.; Huang, C.; Hua, L.; Zhu, J.R.; Zhang, Z.D. Single-phase high-impedance fault protection for low-resistance grounded distribution network. IET Gener. Transm. Distrib. 2018, 12, 2462–2470. [Google Scholar] [CrossRef]
- Abdel-Akher, M.; Nor, K.M. Fault analysis of multiphase distribution systems using symmetrical components. IEEE Trans. Power Deliv. 2010, 25, 2931–2939. [Google Scholar] [CrossRef]
- Shi, F.F.; Cong, W. Methodology to differentiate type of single-phase line break fault in 10 kV ungrounded distribution networks. In Proceedings of the 2014 IEEE PES Asia-Pacific Power and Energy Engineering Conference (APPEEC), Hong Kong, China, 7–10 December 2014. [Google Scholar]
- Liu, Q.; Fan, C.J.; Tai, N.L.; Shang, J. A new decupling method for asymmetry-parameter quadripole-circuit lines on same tower. IEEJ Trans. Electr. Electron. Eng. 2016, 11, 23–29. [Google Scholar] [CrossRef]
- Kalyuzhny, A.; Kushnir, G. Analysis of current unbalance in transmission systems with short lines. IEEE Trans. Power Deliv. 2007, 22, 1040–1048. [Google Scholar] [CrossRef]
- Bellan, D.; Furga, G.S. Modified sequence circuits for asymmetrical three-phase loads. In Proceedings of the 2014 6th IEEE Power India International Conference (PIICON), Delhi, India, 5–7 December 2014. [Google Scholar]
- Hel, Y.S.; Yang, Y.B.; Zhong, K.; Wang, D. An improved three-phase power method for distribution network. In Proceedings of the International Conference on Electrical and Control Engineering (ICEE 2015), Boumerdes, Algeria, 13–15 December 2015; pp. 112–116. [Google Scholar]
- Toader, D.; Blaj, C.; Ruset, P.; Hategan, I.; Pinte, N.; Arvinti, B. Device for automatic control of the Petersen coil. In Soft Computing Applications; Springer: Berlin/Heidelberg, Germany, 2016; pp. 1121–1137. [Google Scholar]
- Yu, K.; Liu, Z.L.; Zeng, X.J.; Li, J.Z.; Yang, L. A novel full compensation method for the ground fault current of resonant grounded systems. Electr. Eng. 2021. [Google Scholar] [CrossRef]
- Wang, P.; Chen, B.C.; Tian, C.H.; Sun, B.; Zhou, M.; Yuan, J.X. A novel neutral electromagnetic hybrid flexible grounding method in distribution networks. IEEE Trans. Power Deliv. 2017, 32, 1350–1358. [Google Scholar]
- Buta, A. Neutral grounding of electrical networks. In Electric Power Systems. Electric Networks; Eremia, M., Ed.; Romania Academy: Bucharest, Romania, 2006; pp. 327–334. [Google Scholar]
- Gomez-Exposito, A.; Conejo, A.; Canizaris, C. Symmetrical Components Electric Energy Systems. In Analysis and Operation, 2nd ed.; CRC Press Taylor & Francisc Grup: Boca Raton, FL, USA, 2018; pp. 421–471. [Google Scholar]
- El-Hawary, M.E. Chapter VIII Fault on Electric Energy Systems. In Electrical Power Systems: Design and Analysis; IEEE Press Power Systems Engineering Series; John Wiley & Sons Inc.: New York, NY, USA, 1995; pp. 474–507. [Google Scholar]
Publisher’s Note: MDPI stays neutral with regard to jurisdictional claims in published maps and institutional affiliations. |
© 2021 by the authors. Licensee MDPI, Basel, Switzerland. This article is an open access article distributed under the terms and conditions of the Creative Commons Attribution (CC BY) license (http://creativecommons.org/licenses/by/4.0/).