Article

Application of the Vortex Search Algorithm to the Phase-Balancing Problem in Distribution Systems

by
Brandon Cortés-Caicedo
1,
Laura Sofía Avellaneda-Gómez
1,
Oscar Danilo Montoya
2,3,
Lazaro Alvarado-Barrios
4 and
Harold R. Chamorro
5,*
1
Estudiantes de Ingeniería Eléctrica, Universidad Distrital Francisco José de Caldas, Bogotá 11021, Colombia
2
Facultad de Ingeniería, Universidad Distrital Francisco José de Caldas, Bogotá 11021, Colombia
3
Laboratorio Inteligente de Energía, Universidad Tecnológica de Bolívar, Cartagena 131001, Colombia
4
Department of Engineering, Universidad Loyola Andalucía, 41704 Sevilla, Spain
5
Department of Electrical Engineering at KTH, Royal Institute of Technology, SE-100 44 Stockholm, Sweden
*
Author to whom correspondence should be addressed.
Energies 2021, 14(5), 1282; https://doi.org/10.3390/en14051282
Submission received: 18 January 2021 / Revised: 11 February 2021 / Accepted: 18 February 2021 / Published: 26 February 2021
(This article belongs to the Special Issue Computational Intelligence in Electrical Systems)

Abstract

:
This article discusses the problem of minimizing power loss in unbalanced distribution systems through phase-balancing. This problem is represented by a mixed-integer nonlinear-programming mathematical model, which is solved by applying a discretely encoded Vortex Search Algorithm (DVSA). The numerical results of simulations performed in IEEE 8-, 25-, and 37-node test systems demonstrate the applicability of the proposed methodology when compared with the classical Cuh & Beasley genetic algorithm. In addition, the computation times required by the algorithm to find the optimal solution are in the order of seconds, which makes the proposed DVSA a robust, reliable, and efficient tool. All computational implementations have been developed in the MATLAB® programming environment, and all the results have been evaluated in DigSILENT© software to verify the effectiveness and the proposed three-phase unbalanced power-flow method.

1. Introduction

1.1. General Context

Energy has become a fundamental base for society, covering the basic needs of people, contributing to technological development and making a change to how people work and live in their houses [1]. Initially, it was necessary to look for a method to deliver energy from generation to consumption locations (end users) in an efficient form using equipment and devices to generate, transport, distribute, and commercialize energy, all of these encompassing the well-known electric power system [1]. One of the fundamental components for power systems is distribution systems, which are defined as, according to [2], the set of elements that transport electric energy from a power substation to an end user. Generally, distribution systems are formed of a power substation, subtransmission substation, distribution substation, primary feeders, distribution transformers, and secondary and auxiliary transformers [3]. The distribution system is entrusted to supplying safe and reliable high-quality energy economically to end users [1].
With technological development and population growth, unbalanced power systems have taken up a prominent role within studies of power distribution systems, given that these generally have unbalanced operation due to the load nature and network configuration, with one-phase distribution transformers connected arbitrarily at the power-system phases [4]. This is consistent since it is more economic to implement branches from one or two phases of the trunk circuit than installing three-phase circuits directly to the end users [5]. The load unbalance in the power distribution systems creates undesirable scenarios, such as current increase at some of the phases of the system, current through the neutral wire, and over-voltage on the least-loaded phases [6] which, consequently, will increase power loss, an inappropriate operation for protection and creating negative effects on power quality [6].
Power loss in distribution systems accounts for the difference between power provided by utility and power consumed by end users [7]. These are classified as technical and non-technical loss [3]. Non-technical loss is not associated with the physical characteristics of the power system [3], and technical loss is caused by energy dissipation in system components, such as lines, transformers, and electric connections [3]. Power loss in distribution systems can be significant, contingent upon unbalancing along loads. Let us suppose that there is a pure resistive load fed by a transmission line, modeled with a value of 1 Ω per phase, where the current flowing through the phases is 50 A\100 A\150 A. For this case, the power loss will be 35 kW [3]. If the phases are balanced, i.e., the current per phase is 100 A\100 A\100 A, power loss will be reduced to 30 kW [3]. Power loss caused by phase-unbalancing in distribution systems can exceed the capacity required to meet demand, equipment deterioration (reducing useful life), and the increase of investment and operation costs on behalf of the network operators [4,8]. Therefore, to reduce technical power loss, it is necessary to make an operation towards phase-balancing in distribution systems.
This balance can be done from three different focuses, which are: (i) distribution system reconfiguration; (ii) phase-swapping, [3]; and (iii) distributed generation DG implementation [9]. The first of these is hard to implement due to a reduced number of sectionalizers available in distribution systems [3]. On the other hand, the problem presented in implementing DG is the impossibility of controlling the active power injection due to the dependence on resource availability (in the case of the use of renewable generation sources); consequently, an exaggerated power injection could have a negative effect on the system [10]. Finally, phase-swapping presents a low-cost, suitable and effective alternative for phase-balancing [3].

1.2. Motivation

When power loss is reduced, power-supply service provided by utilities will be more efficient [11,12], complying with energy, power and service-quality parameters, meeting end user needs, according to guidelines of regulatory entities [1]. For the Colombian case, the Energy and Gas Regulation Commission (CREG) states that voltage profiles should be within ±10% of nominal operation voltage [13] and frequency within ±3% of nominal operation frequency of the system [14]. If these variables are not in compliance with operation limits, network operators incur financial penalties. In this manner, distribution companies will benefit from system-balancing, with a consequent reduction to operation and investment cost, since less energy has to be purchased to meet user demand and there will be no investment to implement other higher-cost solutions, such as capacitors and DG installation, which can be more expensive than phase-balancing [15]. For this reason, the present research shows the minimization of power loss caused by the unbalance of three-phase power distribution systems. For this purpose, the optimization algorithm known as Discrete Vortex Search Algorithm (DVSA) is used, combined with a three-phase version of the backward–forward sweep iterative method, with which the set of optimal connections for the loads that are part of the system will be determined, with an optimal point of operation, decreasing the phase-unbalancing.

1.3. Review of the State of the Art

In the specialized literature, several methods and proposals have been proposed for phase-balancing (PB). This problem was introduced for the first time in 1998 by [16], who formulated PB via mixed-integer programming with linear constraints, seeking to reduce current unbalancing in distribution system lines. Likewise, power loss is reduced, and voltage profiles and power quality are improved, in such a way that the service provided to end users is efficient and of good quality. In [17] PB was developed through a metaheuristic algorithm known as simulated annealing, which minimized the total cost of operation. Voltage drops on the network segments were reduced, therefore reducing energy loss in the system, and the power-supply service to end users less expensive, since less energy was required to meet demand.
In [18], PB is proposed using a Genetic Algorithm (GA), designed to minimize phase-unbalancing of the system and reduce voltage drops on the network segments, power loss, and current through the neutral wire. It is determined that with correct phase reorganization, service quality is significantly improved. In [11], PB was developed via GA, in which power loss is reduced in distribution systems, with an improvement to the line transportation capacity, and decrease to both the voltage drop on the network segments and energy consumption price, in such a way that network operators and end users can be benefit from an economic and reliable power-supply service.
The authors in [19] formulated PB via the backward recurrence search heuristic algorithm, which minimized phase-unbalancing of the system such that neutral current is reduced. It was concluded that a more reliable system was obtained, since the likelihood of overcurrent protection devices actuation was decreased in the neutral. In [20], PB was developed through ant colony optimization, where energy loss was minimized over a 24 h interval for distribution systems, which reduced the neutral current and energy consumption price on the side of the end user. With this methodology, it was concluded that the proposed algorithm is beneficial for power systems with limited economic resources, since the configurations for phase reorganization are at the optimal during the period under study.
In [21], a particle swarm optimization PSO algorithm for the PB was proposed, in which power loss is decreased, and voltage profiles are improved. The right phase reorganization significantly improves the quality of the power-supply service to end users. In [22] PB was formulated through an expert system based on heuristic rules, which had the purpose of minimizing operative costs of the system. The objective function was formulated considering the cost of power loss and cost of service interruption due to the work for phase-swapping, which reduces both system-unbalancing and current flowing through the neutral and energy losses over a 24 h period. The authors concluded that the current of the neutral wire was significantly reduced, enhancing power-system reliability; moreover, transportation capacity of the network segments was improved, decreasing power loss.
In [23], PB was developed via an immune algorithm where the operative costs of the system were reduced over a 24 h interval. The objective function was formulated considering current flowing through the neutral (adding a penalization cost if this exceeds a predetermined value), service interruption cost, and the cost due to phase reorganization, in such a way that service quality provided to end users can be improved, since the reduction of system-unbalancing means a reduction of power loss. In [24], the problem of PB is addressed with automatic phase-swapping via information system-mapping, taking into account the technical characteristics and the load flow, to decide the best phase reorganization that provides the lowest power loss. In this sense, the algorithm developed is a useful tool for power distribution engineers in the direction and maintenance of systems, since the automatic feature allows operation of the system in an efficient and effective manner.
The authors of [25,26] formulated PB using a fuzzy geek hybrid heuristic algorithm and an auto-adaptive hybrid differential evolution algorithm to minimize the system phase-unbalancing based on power-flow equations and capacity and voltage constraints, seeking to balance the current flowing through the system phases and decreasing the neutral current. With the correct phase reorganization, the service quality is considerably improved, and the energy invoice is decreased for end users, since when system is balanced, power loss is also reduced.
In [27], a bacterial foraging optimization algorithm oriented by a PSO algorithm was proposed, which had the objective of minimizing the operative costs of the system, whether it was radial or meshed. The objective function was formulated considering the current flowing through the neutral wire, voltage drop on the network segments, system power losses (adding a penalization cost if this exceeded a set value), and the cost due to phase-swapping, in such a way that the system balance is improved, making as similar as possible both the voltage between phases and the current flowing through the lines, in this way reducing the neutral current and the system power loss.
In [3], PB through a GA was formulated with the objective of minimizing energy loss in distribution systems, and consequently, voltage profiles were improved and the congestion of the system lines was reduced, which had direct effects on investment costs, with optimal system operation points and reduced unbalance factor, power loss, and neutral current. In [28], the PB problem was addressed with a heuristic method based on phase-swapping for load-balancing, minimizing the degree of system-unbalancing. With this, voltage profiles were improved, and energy losses decreased over 7-day period for the implemented test systems. In this manner, the systems were taken to an optimal operation point.
In [8], PB was formulated in the 13-node IEEE test system with a balancing algorithm based on verifying at each candidate node the possible combinations for phase-swapping until the option that balanced the system was obtained. In this manner, a configuration was obtained that reduced the neutral current and power loss, and improved the voltage profiles in the test system. In [29], PB was developed via PSO, which sought to minimize the phase-unbalancing of the system. Likewise, power loss was reduced, and voltage profile and energy efficiency were improved for a good-quality and economic power-supply service to end users.
To address the PB problem in [30], the minimization of the unbalancing in distribution systems was proposed, using a search heuristic algorithm that defined how to perform phase-swapping with load contactors. This method decreased power loss and provided better results depending on the number of contactors used; furthermore, this increased the operation cost of the system. The authors of [31] proposed PB with a GA that used a codification based on group theory that minimized power losses in distribution systems and reduced the existing unbalancing between the phases of the system.
In [32], PB was developed through an analytic approach, taking into consideration that phase-swapping must be minimal. (This was done via the implementation of a search vector that selected the priority nodes considering the load connected at each phase and voltage unbalancing), to reduce the distribution system-unbalancing and therefore the power losses. Finally, in [33], PB implementing a GA was developed which had the objective of reducing energy loss over a 24 h interval and decreased the phase-unbalancing in the system.
As observed in the above review of the state of the art, PB, regardless of the objective and the solution techniques mentioned, seeks to improve the quality of power and energy so that the service provided by network operators to end users is efficient and economic, resulting in a beneficial situation for customers and utilities. Table 1 and Table 2 show a summary of the works consulted for the state of the art, with the solution method and objective function employed.
For the development of this research paper, an optimization metaheuristic technique will be used called Vortex Search Algorithm (VSA), as it has not been applied for the PB problem, as observed in Table 1. This technique is used for the solution of problems in the continuous domain [34]. In this case, a discrete version of the VSA, known as DVSA, is proposed, since the optimal combination for load connection must be selected. The objective function to minimize is the power loss in the distribution system, because this has been the least researched variable within the references consulted, as shown in Table 2, to the extent that only the 14% of the authors had it as the main purpose of their research.

1.4. Contributions

This study addresses the solution of the optimal PB problem in unbalanced distribution networks. After doing a review of the state of the art, a master–slave optimization is proposed as follows: in the master stage of the DVSA, the set of connections for loads presented in the system is defined; in the slave stage, the solution for the power flow is established via the three-phase sweep iterative method, which will determine the power loss for the set of solutions defined in the master stage. Thus far, this solution method for PB has not been reported in the specialized literature. The contributions of this research work are presented as follows:
It is possible to obtain a global optimal solution for the PB problem via the parameterization solution method with a sensitivity analysis between the number of candidate solutions and the number of iterations.
The solution developed from the interaction of the DVSA and the three-phase iterative sweep method can be implemented for any radial or meshed unbalanced distribution system. Likewise, the set of optimal connections for loads in the system is not limited by the number of nodes.
Finally, it is important to mention that, while the PB problem has been widely studied and reported in the specialized literature, as shown in the state-of-the-art review, a discrete codification for the VSA that uses integer decision variables will simplify the binary vector dimensions commonly used for the solution of this problem, decreasing the processing time [35]. In addition, to present the effectiveness and robustness of the proposed discrete VSA approach, numerical comparisons are included with the classical Chu & Beasley genetic algorithm to determine the final phase configuration and the total amount of power-loss reduction.

1.5. Document Organization

The rest of this document is organized as follows: Section 2 presents the mathematical formulation of the optimal phase-balancing problem in unbalanced distribution systems. Section 3 shows the proposed master–slave methodology, where the DVSA is presented integrated with the three-phase iterative sweep power flow. Section 4 describes the test systems used in this study with their main characteristics. Section 5 shows the results of the operative state of the system (nodal voltage per phase) and the active power loss for a given demand condition, using the three-phase iterative sweep power flow. Section 6 shows the results obtained for the set of connections and the power losses in each of the cases proposed by the master–slave methodology. Section 7 gives conclusions and proposes future works.

2. Mathematical Formulation

The optimal phase-balancing problem in unbalanced distribution systems can be represented via a mixed-integer non-linear programming (MINLP) model. The integer variables (binary type) represent the decision variables, which are associated with the selection of connection type for each load presented in the system. On the other hand, the continuous variables are associated with the classic power-flow formulation, which uses magnitude and angle voltage per node [36]. Finally, the non-linear nature is due to the trigonometric functions in the power-balance equations and the products between the magnitudes of the nodes [35].
The MINLP formulation is presented below, as an adaptation of the models in [3,37].

2.1. Objective Function

The objective function corresponds to total active power loss of the unbalanced distribution system, as presented in (1).
m i n z = p ϵ Ω P i ϵ Ω N j ϵ Ω N V i p V j p Y i j p c o s ( δ i p δ j p θ i j p )
where z represents the value of the objective function. Ω P is the set associated with the system phases. Ω N is the set associated with the system nodes. V i p and V j p are the voltage magnitudes in the phase p in the nodes i and j, respectively. δ i p and δ j p are voltage angles in the phase p in the nodes i and j, respectively. Y i j p , is the magnitude of the admittance associated with the line connected between the nodes i and j of the phase p with an angle nominated as θ i j p .

2.2. Constraints

The set of constraints corresponds to the operative limitations that can be found in any unbalanced distribution system. These are shown in (2) to (11).
P i g A h ϵ Ω H X i h P i h d A = j ϵ Ω N V i A Y i j A V j A c o s ( δ i A δ j A θ i j A )
P i g B h ϵ Ω H X i h P i h d B = j ϵ Ω N V i B Y i j B V j B c o s ( δ i B δ j B θ i j B )
P i g C h ϵ Ω H X i h P i h d C = j ϵ Ω N V i C Y i j C V j C c o s ( δ i C δ j C θ i j C )
i Ω N
where Expressions (2)–(4) represent the active power balance per phase at each node of the system. P i g A , P i g B and P i g C are the active power due to a conventional generator in the phases A, B, and C, respectively, at the node i. P i h d A , P i h d B and P i h d C are the active powers demanded, as per the type of connection h, in the phases A, B, and C, respectively, in the node i. X i h represents the binary decision variable, which takes the value of 1 if connection h is selected for a node i, and 0 otherwise.
The binary variable X i h will have to select among h possible connections for the loads of the nodes of demand i presented in the distribution system, as shown in Table 3. It must be considered that in the case of having inductive loads (motors), the phase sequence should not be swapped, to prevent damage to the equipment [3]. An example of this situation is that if there is a three-phase motor connected in phases A, B, and C, this can only be connected as follows: BCA or CAB, making sure it has the same sequence.
As a result, it is proposed that each load connected to the nodes of demand i is associated with a type of connection, which will represent a possible phase-swapping [3]. The type of connections vary from 1 to 6. Type 1 indicates that there was no phase-swapping (default setting); the remaining five types of connection indicate a phase-swapping that may or may not involve a sequence change [3], i.e., if there is a load initially connected in ABC sequence and a Type 6 is required, phase connection will change to BAC [3], as shown in Figure 1.
This research work is focused on three-phase loads; however, if there are two-phase or one-phase loads, the type of connections of Table 3 are applied accordingly. In the first case, it is assumed that the power of the phase where the load is not connected is equal to zero, and in the second case it is assumed that the power of the two phases where the load is not connected is equal to zero [3].
Q i g A h ϵ Ω H X i h Q i h d A = j ϵ Ω N V i A Y i j A V j A s i n ( δ i A δ j A θ i j A )
Q i g B h ϵ Ω H X i h Q i h d B = j ϵ Ω N V i B Y i j B V j B s i n ( δ i B δ j B θ i j B )
Q i g C h ϵ Ω H X i h Q i h d C = j ϵ Ω N V i C Y i j C V j C s i n ( δ i C δ j C θ i j C )
i Ω N
where Expressions (5)–(7) represent the reactive power balance per phase at each node of the system. Q i g A , Q i g B , and Q i g C are the reactive power generated by a conventional generator, in the phases A, B, and C, respectively, in the node i. Q i h d A , Q i h d B , and Q i h d C , are the reactive powers demanded, as per the type of connection h, in the phases A, B, and C, respectively, in the node i.
V min V i A V max , i Ω N
V min V i B V max , i Ω N
V min V i C V max , i Ω N
where Expressions (8)–(10) correspond to the constraints of voltage regulation per phase in the node i. Voltage per phase in the node i can take any value as long as this is within V min and V max .
h ϵ Ω H X i h = 1 , i Ω N
where the expression (11) is limited to one, the number of possible connections presented in each demand node i.
The model described in (1) to (11) represents the optimal phase-balancing problem in unbalanced distribution systems. This model is based on minimizing the power losses in unbalanced distribution systems, where the binary variable X i h will determine the set of connections for the demand nodes that allows the system to find an operation point to reduce phase-unbalancing. The solution for the model described in (1) to (11) requires numeric optimization techniques, since the active and reactive power-balance equations, defined in (2) to (7), are non-linear and non-convex [34]. For this reason, in Section 3 a master–slave methodology is proposed to solve the optimal phase-balancing problem. This calls for combining the DVSA and the three-phase version of the power flow, which is known as the iterative sweep method.

3. Methodology Proposed

For the solution of the optimal phase-balancing problem in unbalanced distribution systems, to minimize power loss for a given demand condition, in this document the VSA is proposed in its discrete version [35] to be used in the master stage, and in the three-phase iterative sweep power-flow method in the slave stage. In the master stage, the phase connections will be defined in each demand node of the system, which allows balancing, while in the slave stage the constraints will be assessed for the power flow defined in (2) to (7). Each component of the master–slave methodology proposed is described as follows.

3.1. Master Stage: Vortex Search Algorithm

VSA is a metaheuristic technique used to solve problems in the continuous domain, and it is based on the behavior of vortex created in agitated fluids [38]. A significant advantage of this optimization method is that candidate solutions are generated around the best current solution via a Gaussian distribution at each iteration [38] and have variable radii that allows the exploration and exploitation of the solution space [34]. When this method is applied to power-flow problems, it is warrantied to reach an optimal global solution with the minimum of standard deviation [39].
As mentioned before, the VSA works with continuous variables. In this paper, a discrete version is employed when these variables are rounded to the closest integer, as proposed in [35], which will allow the slave stage to evaluate a set of connections for the loads that are part of the system, exploring and exploiting the solution space in a proper manner.

3.1.1. Initial Solution

VSA works with non-concentric hyperspheres, where the radius of the external hypersphere represents the size of the solution space, and the center represents the best current solution [34]. The initial center of the hypersphere is defined in (12):
μ 0 = x max + x min 2
where x max and x min are d × 1 vectors that define the upper and lower limits of the decision variables of the optimization problem in a dimensional space d.

3.1.2. Candidate Solutions

The set of candidate solutions is represented as C t ( s ) , where t is the number of iterations. Initially t = 0 and the set of solutions C 0 ( s ) is generated through a random process using a Gaussian distribution in the dimensional space d, where C 0 ( s ) = s 1 , s 2 , , s n , n being the number of candidate solutions. To generate the Gaussian distribution in a multidimensional space, Expression (13) is used:
p ( x | μ , Σ ) = 1 ( 2 π ) d | Σ | ) exp 1 2 ( x μ ) T Σ 1 ( x μ )
where d is the dimension of the solution space, x ϵ R d × 1 correspond to the vector of random variables, μ ϵ R d × 1 represent the center vector that contains the best solution and Σ ϵ a n d R d × d corresponds to the covariance matrix.
If in Σ the diagonal elements (variance) are equal, and if the elements out of the diagonal (covariance) are zero, then the Gaussian distribution will create hyperspheres in the dimensional space d [38]. An easy way to calculate Σ , considering the covariance and the variances are the same, is shown in (14):
Σ = σ 2 I d × d
where σ is the variance of the Gaussian distribution and I d × d is an identity matrix. Notice how the standard deviation of the Gaussian distribution can be defined as shown in (15):
σ 0 = max x max min x min 2
where σ 0 can also be considered to be the initial radius r 0 of the hypersphere in the dimensional space d [38]. To reach a proper exploration of the solution space, initially, σ 0 is the largest possible hypersphere. During the search process, the radius decreases to zero and contains the optimal solution [35].

3.1.3. Replacement of the Current Solution

In the solution stage, the best solution of s 0 ϵ C 0 ( s ) is selected and memorized from C 0 ( s ) to replace the current center of the hypersphere μ 0 . Furthermore, before the selection stage, it must be checked that the candidate solutions can be found within the limits of the solution space. For this it is employed (16), which will adjust within the limits the solutions s k l that are not found in the solution space.
s k l = ( x l max x l min ) r l + x l min , s k l < x l min s k l , x l min s k l x l max ( x l max x l min ) r l + x l min , s k l > x l max
where k = 1 , 2 , , n , l = 1 , 2 , , d and r l represent a uniform random distribution of an integer number from 0 to 1. Later, the best solution s t ϵ C t ( s ) is taken as the best solution, if and only if it is better than the previous solution, which will create an update in the center of the hypersphere μ t and in its radius r t , this latter being reduced. Finally, a new set of solutions C t ( s ) is generated around the new center.

3.1.4. Process of Radius Reduction

The most important process of the VSA is the adaptive adjustment of the radius of the hypersphere, which is done using a variable step approach [38]. For this, the incomplete gamma function is used, as recommended by [38]. The incomplete gamma function can be appreciated in (17).
γ ( x , a ) = 0 x e t t a 1 d t
where a > 0 is known as a shape parameter and x 0 as a random parameter. However, to determine the adaptive size of the radius in each iteration the inverse incomplete gamma function will be used, as reported in [34], shown in (18).
r t = σ 0 γ 1 ( x , a t )
In MATLAB®,(2020a, Natick, MA, USA) the inverse incomplete gamma function for the calculation of the variable radius can be computed as observed in (19) [38].
r t = σ 0 1 x g a m m a i n c i n v ( x , a t )
where a t is a parameter defined as a t = 1 t t max , t max being the total number of iterations. Additionally, the parameter x is selected as 0.1, as reported in [38].
To exemplify the proposed codification that represents the problem of optimal phase-balancing in unbalanced distribution systems, the following solution vector s k taken from the candidate set of solutions C t ( s ) is supposed.
s k = 1 , , u , , m
This vector is formed by integer numbers that represent the load connection at each demand node (i.e., from demand node 1 to demand node m), in which the values vary from 1 to u, with u = 6 , the maximum number of available connections for the loads, as shown in Section 2.
In Algorithm 1, a summary of the VSA implementation is presented, to solve the PB problem in unbalanced distribution systems.
For the solution of the PB problem, using Algorithm 1, it is recommended to set x max in 6.5 and x min in 0.5. Likewise, d is the number of demand nodes presented in the system.

3.1.5. Evaluation of Fitness Function

For the correct exploration and exploitation of the solution space during the iterative process of the DVSA, it is necessary to rewrite the objective function shown in (1). It is proposed that the fitness function takes the following form, shown in (20):
z f = z + α max i Ω N 0 , max j A , B , C v i j v max + max i Ω N 0 , v min min j A , B , C v i j
where α is the penalization factor and v i is the nodal voltage obtained in (55) when the three-phase power flow is solved in the slave stage.
When a candidate solution is not in compliance with the voltage constraints, established in (8) to (10), the penalization factor will affect the objective function, discarding this solution as a possible best solution.
Algorithm 1 Master–slave optimization proposed.
Energies 14 01282 i001

3.2. Slave Stage: Three-Phase Iterative Sweep Method

The iterative seep method, according to [40], is based on graph theory where an incidence matrix represents the network topology relating to the nodes with the branches of the system. Kirchhoff laws are also used, to calculate the currents of the system nodes, beginning from the terminal nodes towards the slack node (backward sweep), and compute the voltage drops on the network segments from the slack node towards the terminal nodes (forward sweep) [41]. This solution method is commonly known as backward–forward sweep method [42].
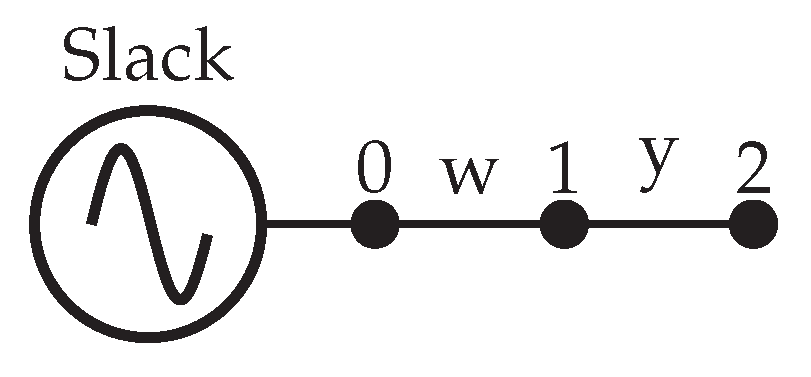
Let us suppose an unbalanced distribution system as shown in Figure 2, where nodes and branches are defined.
The direction of the currents flowing through the lines and the net injected currents of the system are arbitrarily defined. To represent the topology, the relation between the nodes and the phases of the system branches via the three-phase incidence matrix is used, which is shown in (21):
A ip , jk = + 1 , If   the   current   leaves   from node   i   phase   p 1 , I f   t h e   c u r r e n t   e n t e r s n o d e   i   p h a s e   p 0 , I f   b r a n c h   j   p h a s e   k   i s   n o t c o n n e c t e d   t o   n o d e   i   p h a s e   p
where i corresponds to the system nodes, p the phase of the nodes, j the system branches, and k the branches phases, for which the incidence matrix of the example shown in Figure 2 is defined in (22):
A ip , jk = 1 0 0 0 0 0 0 1 0 0 0 0 0 0 1 0 0 0 1 0 0 1 0 0 0 1 0 0 1 0 0 0 1 0 0 1 0 0 0 1 0 0 0 0 0 0 1 0 0 0 0 0 0 1 A 3 ɶ = A 03 ɶ A d 3 ɶ
The three-phase incidence matrix is divided in terms of the generation and demand as shown in (22); the voltage drop per phase through the branches is defined as the difference between the voltage nodes per phase that are connected to each other. The equations that represent the voltage drop in the branches per phase are written as follows:
V a A = V 0 A V 1 A
V a B = V 0 B V 1 B
V a C = V 0 C V 1 C
V b A = V 1 A V 2 A
V b B = V 1 B V 2 B
V b C = V 1 C V 2 C
Writing from (23) to (28) in matrix form, (29) is obtained:
V a A V a B V a C V b A V b B V b C = 1 0 0 1 0 0 0 0 0 0 1 0 0 1 0 0 0 0 0 0 1 0 0 1 0 0 0 0 0 0 1 0 0 1 0 0 0 0 0 0 1 0 0 1 0 0 0 0 0 0 1 0 0 1 V 0 A V 0 B V 0 C V 1 A V 1 B V 1 C V 2 A V 2 B V 2 C
V r 3 ɶ = A 3 ɶ T V N 3 ɶ
Notice how (30) can be written in terms of generation and demand, as shown in (31):
V r 3 ɶ = A 03 ɶ T V 03 ɶ + A d ɶ T V d 3 ɶ
On the other hand, summing currents per phase in the nodes, we obtain:
Node 1:
I 1 A + I a A I b A = 0
I 1 B + I a B I b B = 0
I 1 C + I a C I b C = 0
Node 2:
I 2 A + I b A = 0
I 2 B + I b B = 0
I 2 C + I b C = 0
Writing (32) to (37) in matrix form, (38) is obtained:
I 1 A I 1 B I 1 C I 2 A I 2 B I 2 C = 1 0 0 1 0 0 0 1 0 0 1 0 0 0 1 0 0 1 0 0 0 1 0 0 0 0 0 0 1 0 0 0 0 0 0 1 I a A I a B I a C I b A I b B I b C
I d 3 ɶ = A d 3 ɶ I r 3 ɶ
Likewise, the voltage drop per phase in the branches can be defined via the three-phase impedance matrix for distribution lines and Ohm’s law [43], as shown in (40) and (41):
V a A V a B V a C = Z a A A Z a A B Z a A C Z a B A Z a B B Z a B C Z a C A Z a C B Z a C C I a A I a B I a C
V b A V b B V b C = Z b A A Z b A B Z b A C Z b B A Z b B B Z b B C Z b C A Z b C B Z b C C I b A I b B I b C
Writing (40) and (41) in matrix form, (42) is obtained:
V a A V a B V a C V b A V b B V b C = Z a A A Z a A B Z a A C 0 0 0 Z a B A Z a B B Z a B C 0 0 0 Z a C A Z a C B Z a C C 0 0 0 0 0 0 Z b A A Z b A B Z b A C 0 0 0 Z b B A Z b B B Z b B C 0 0 0 Z b C A Z b C B Z b C C I a A I a B I a C I b A I b B I b C
V r 3 ɶ = Z r 3 ɶ I r 3 ɶ
From the theoretical development, results (31), (39), and (43) show the equations that will permit the solution of the three-phase power flow. The objective is to reach an equation of the form V d 3 ɶ = f ( I d 3 ɶ ) that relates to the three-phase voltage demanded with the three-phase current demanded; moreover, it has to be taken into account that matrix A d 3 ɶ cannot be inverted, while Z r 3 ɶ can be inverted. From (43), I r 3 ɶ can be obtained and replaced in (39), reaching (44):
I d 3 ɶ = A d 3 ɶ Z r 3 ɶ 1 V r 3 ɶ
Equation (31) is replaced in (44) obtaining (47):
I d 3 ɶ = A d 3 ɶ Z r 3 ɶ 1 ( A 03 ɶ T V 03 ɶ + A d 3 ɶ T V d 3 ɶ )
I d 3 ɶ = A d 3 ɶ Z r 3 ɶ 1 A 03 ɶ T V 03 ɶ + A d 3 ɶ Z r 3 ɶ 1 A d ɶ T V d 3 ɶ
I d 3 ɶ = Y d 03 ɶ V 03 ɶ + Y dd 3 ɶ V d 3 ɶ
where Y d 03 ɶ = A d 3 ɶ Z r 3 ɶ 1 A 03 ɶ T y Y dd 3 ɶ = A d 3 ɶ Z r 3 ɶ 1 A d ɶ T . In addition, if we organize for V d 3 ɶ from (47), then we find (48): Moreover, isolating V d 3 ɶ from (47), Expression (48) is obtained:
V d 3 ɶ = Y dd 3 ɶ 1 ( I d 3 ɶ + Y d 03 ɶ V 03 ɶ )
Furthermore, from (48) I d 3 ɶ , the three-phase demanded current, is not known. This current will depend on the type of load that is connected, i.e., Wye (Y) or Delta ( Δ ) connection.
For the Wye load the Figure 3 is taken as reference, deducting (49)–(51).
I i A = S i A V i A *
I i B = S i B V i B *
I i C = S i C V i C *
where i is the number of the node.
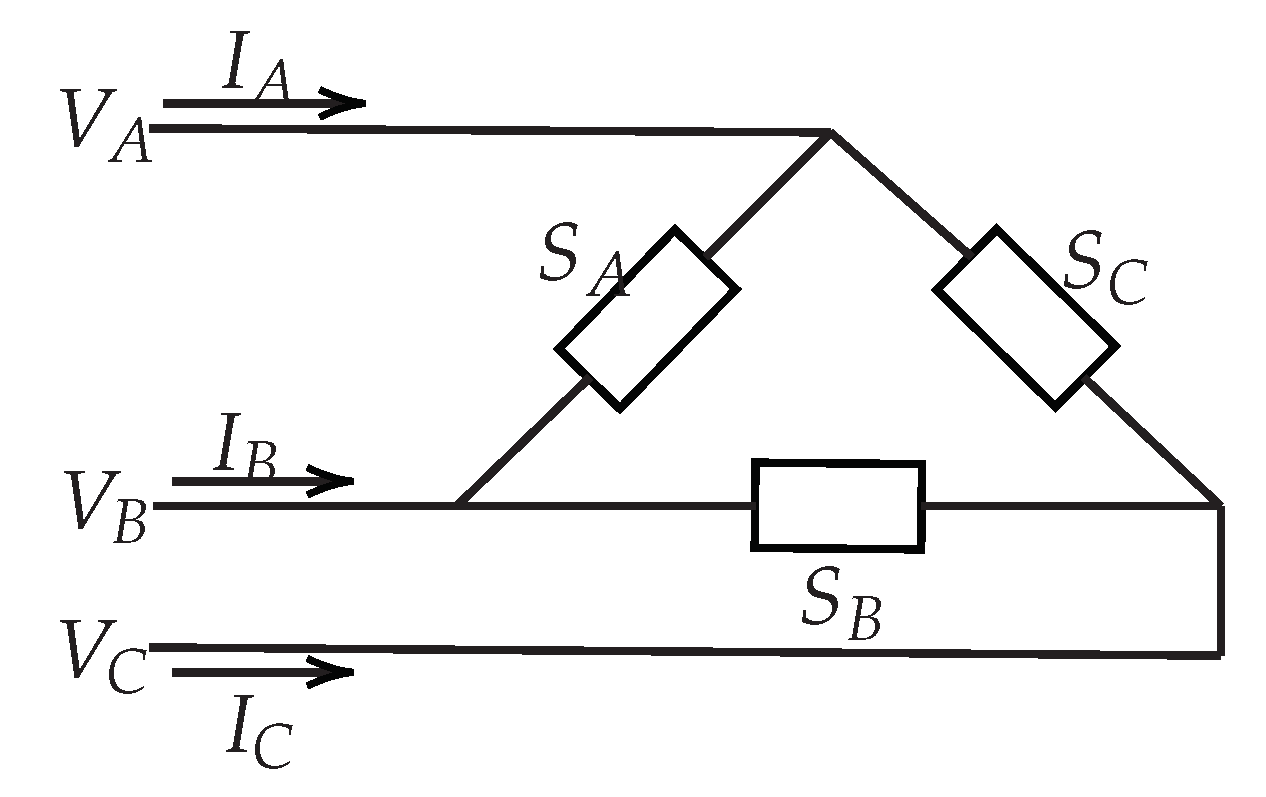
For the Δ load, Figure 4 is taken as reference, deducting (52)–(54).
I i A = S i A V i A V i B * S i C V i C V i A *
I i B = S i B V i B V i C * S i A V i A V i B *
I i C = S i C V i C V i A * S i B V i B V i C *
Finally, using an iterative counter resolves (48), as shown in (55):
V d 3 ɶ t + 1 = Y dd 3 ɶ 1 I d 3 ɶ t + Y d 03 ɶ V 03 ɶ
where t is the iteration counter.
The solution of (55) is given if and only if it is fulfilled that | V d 3 ɶ t + 1 V d 3 ɶ t | ϵ , with ϵ being the maximum acceptable error, which is recommended in the specialized literature as 1 × 10 10 [35].
To determine three-phase power loss, i.e., Joule effect, (56) is used.
P l o s s 3 Φ = R e sum Z r 3 ɶ | I d 3 ɶ | 2
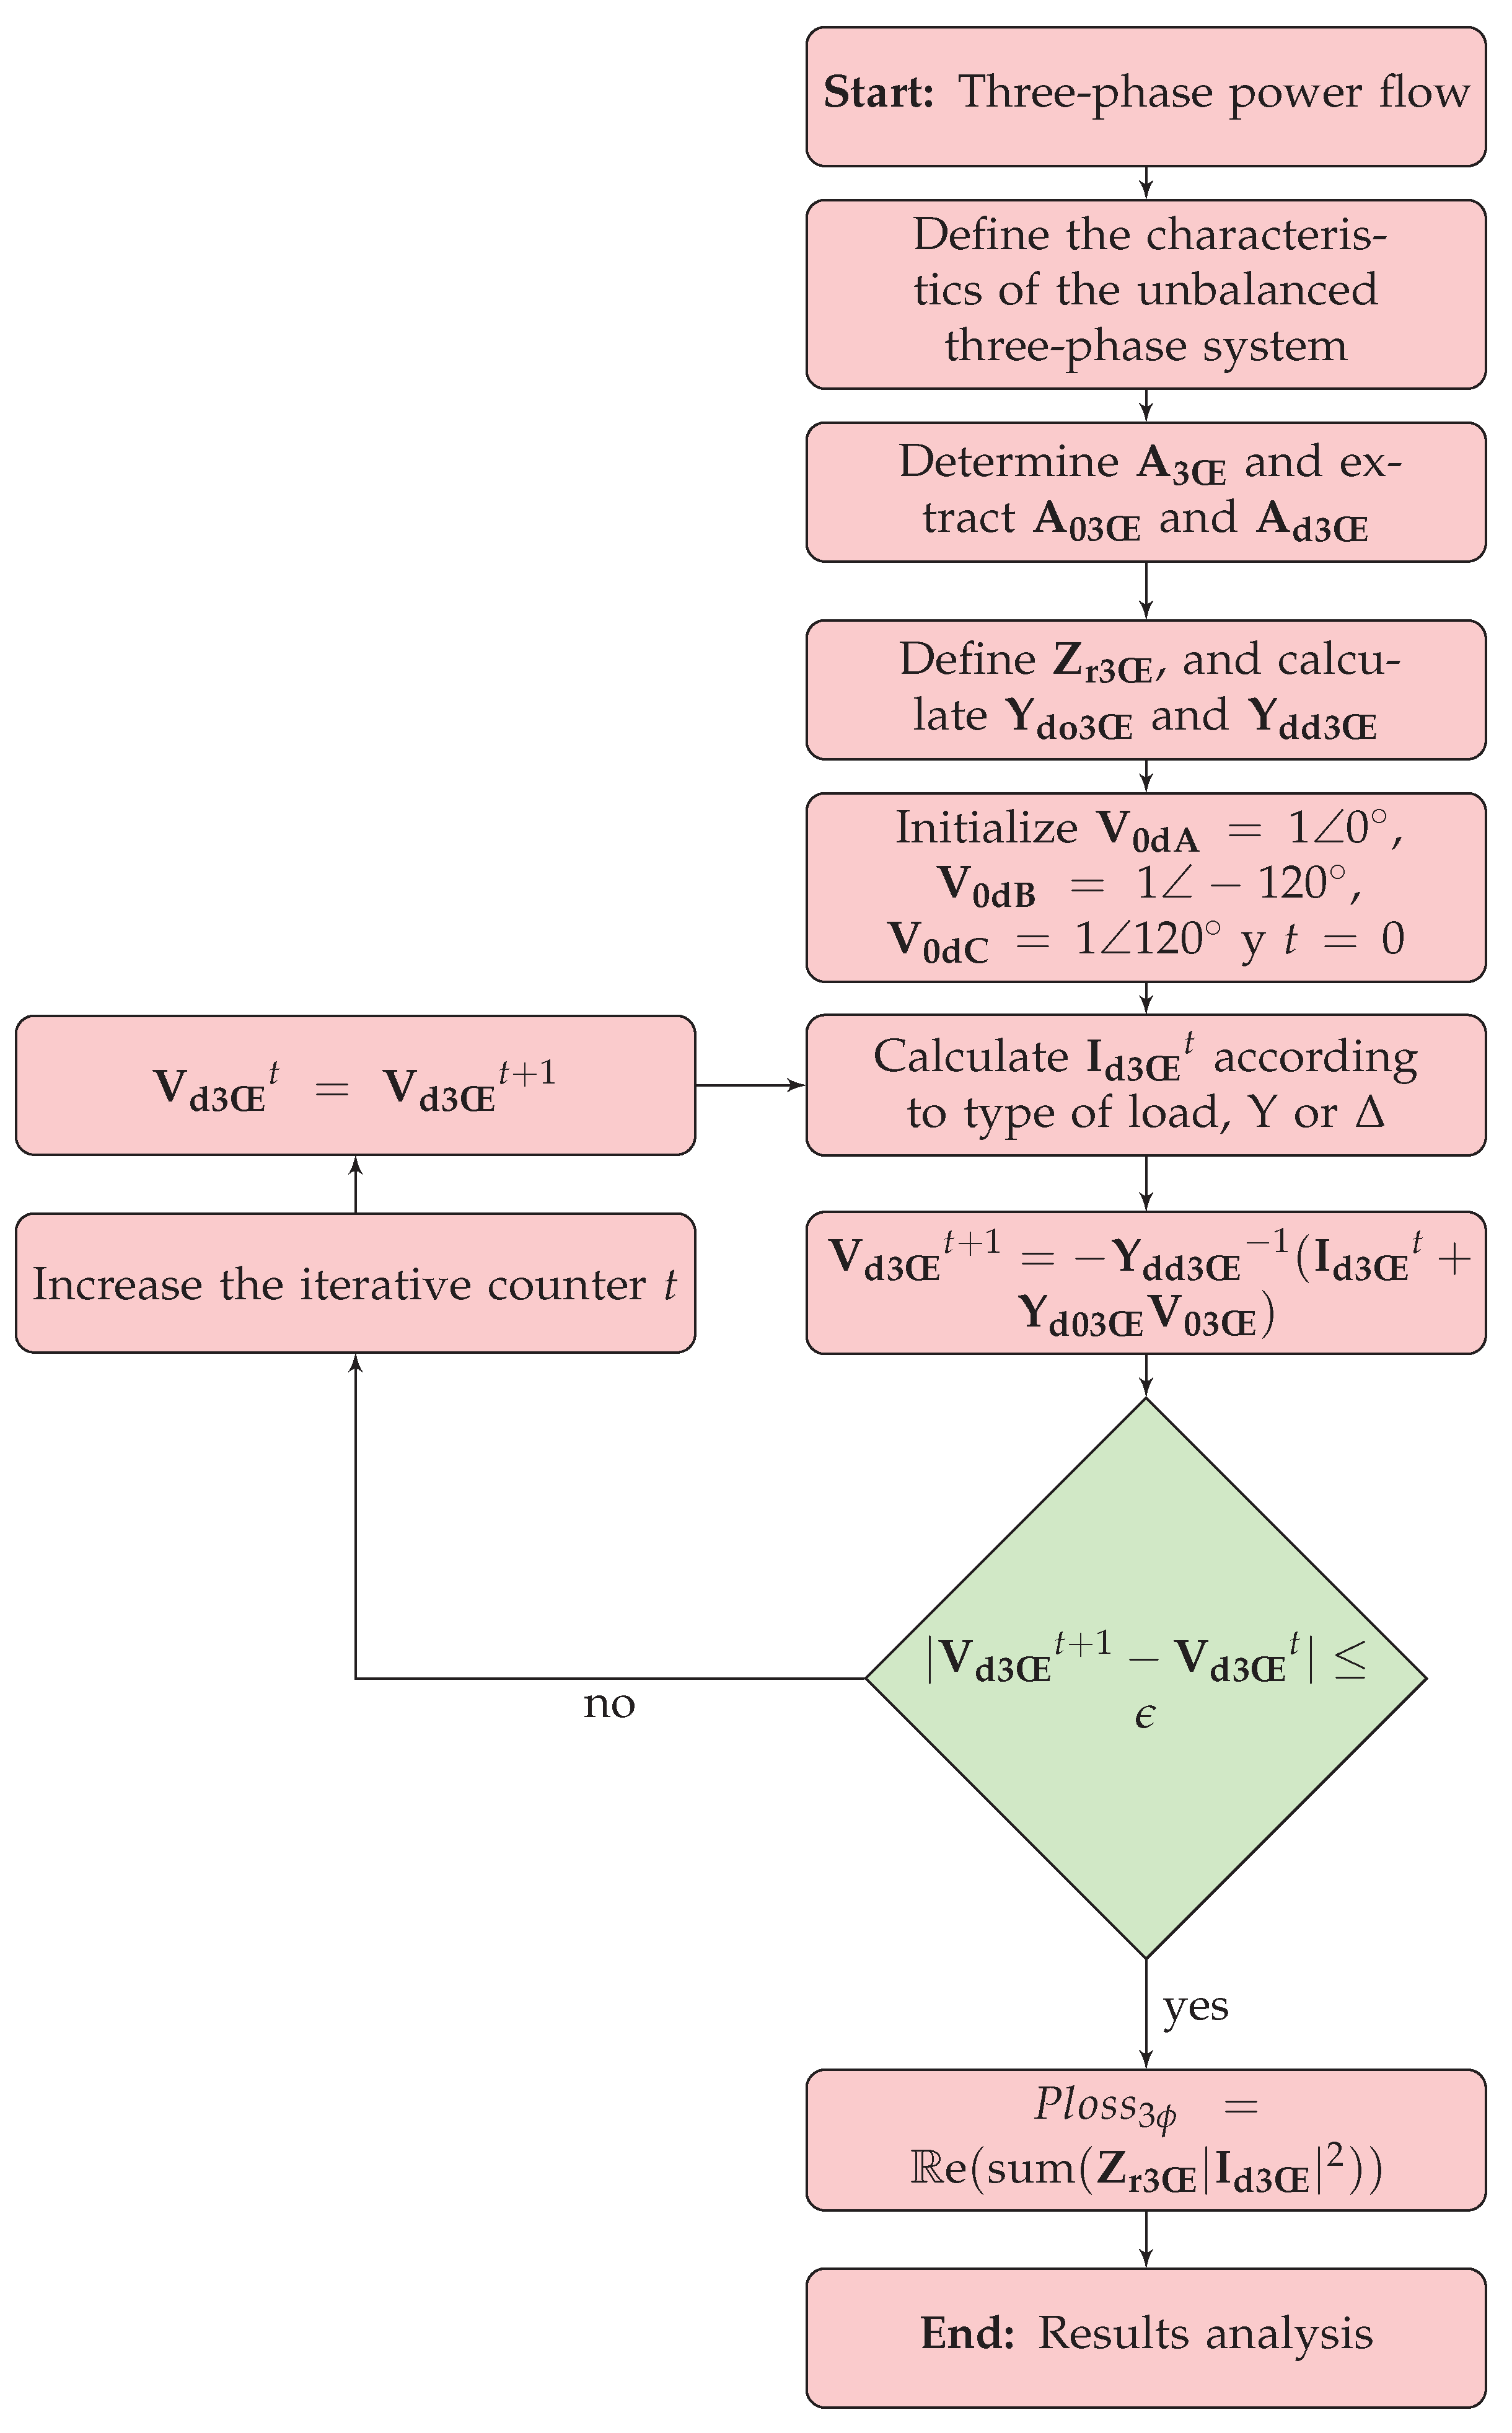
Finally, Figure 5 presents the flowchart of the three-phase iterative sweep method with which the electrical variables required to evaluate the adaptive function z f will be determined.

4. Test Systems

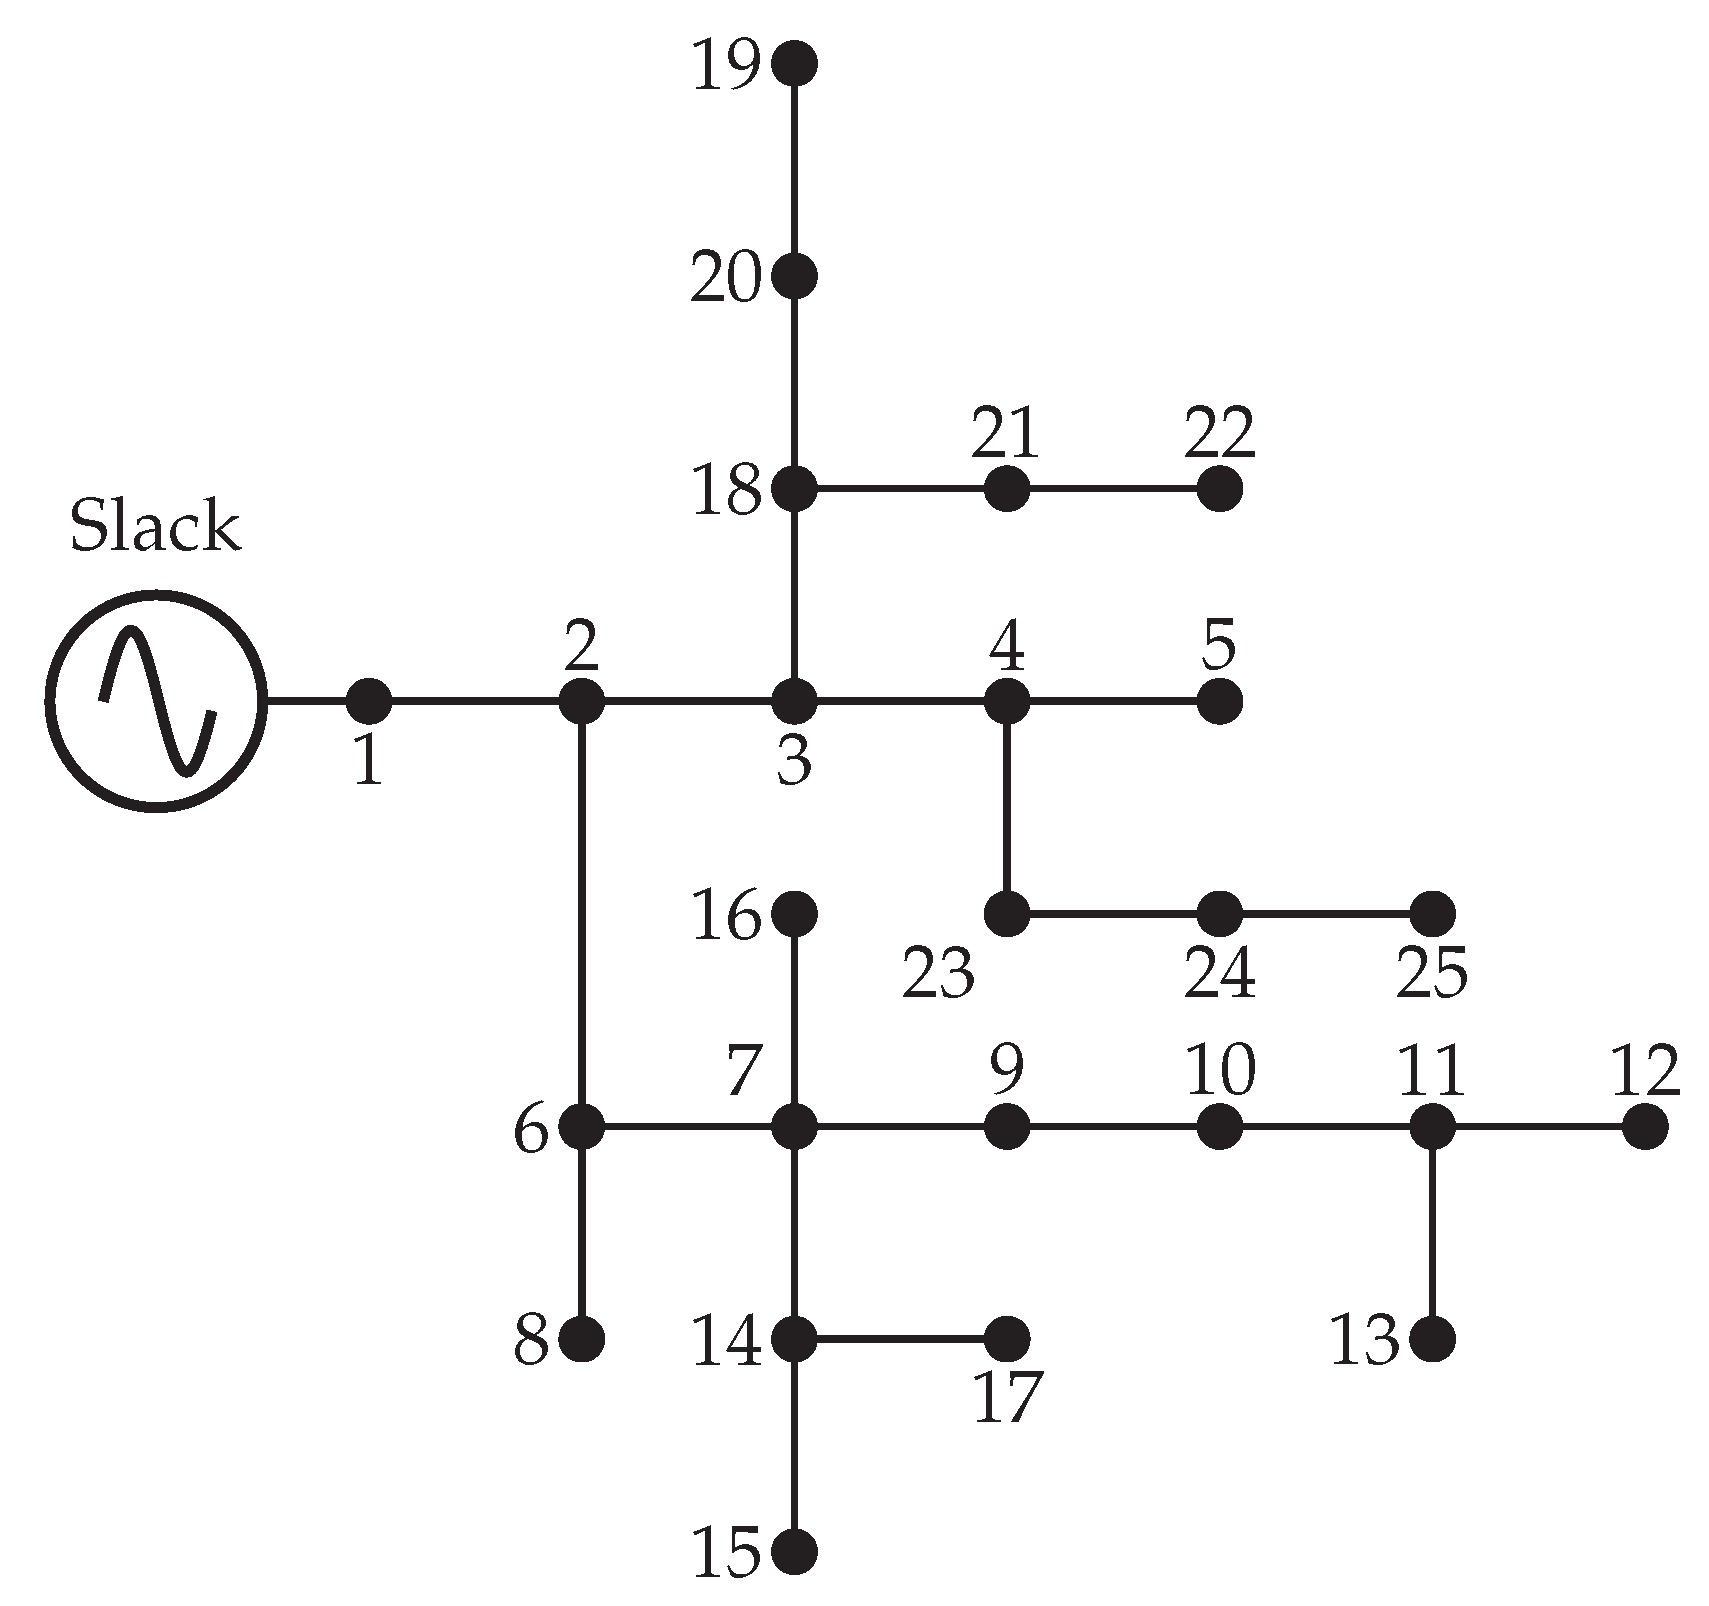
In this section, the information of the three-phase radial unbalanced distribution test systems is used to show the efficiency of the optimization method proposed in Section 3. Test systems correspond to the IEEE 8-, 25-, and 37-node radial distribution networks.

4.1. 8-Node Test System

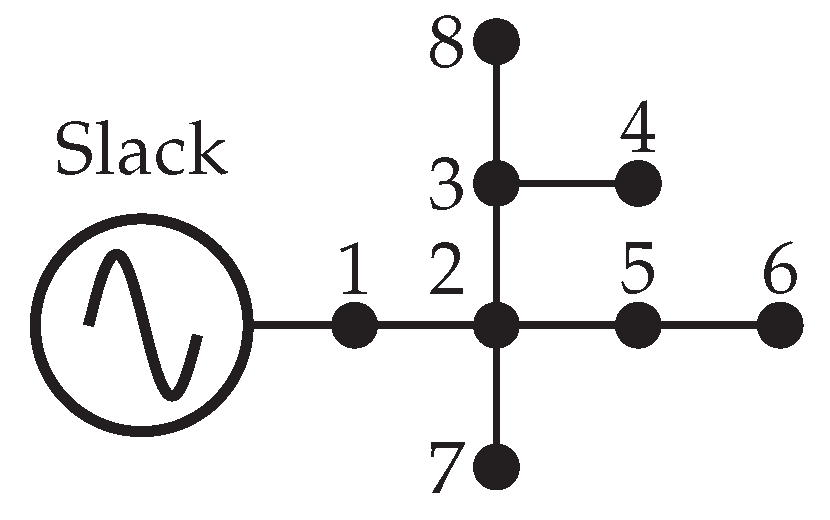
This is an unbalanced radial distribution system with 8 nodes, with the slack node located at node 1, 7 lines, and 7 demand nodes, with a nominal voltage of 11 kV [44]. The electrical configuration of this system can be appreciated in Figure 6. The total active and reactive power consumption is 1005 kW and 485 kvar for phase A, 785 kW and 381 kvar for phase B, and 1696 kW and 821 kvar for phase C [44].
For the purpose of this research paper, impedance matrices are modified per type of conductor, given by [44], as shown in Table A2, to properly apply PB. Load consumption per phase is shown in Appendix A in Table A1.

4.2. 25-Node Test System

This is a radial unbalanced distribution system with 25 nodes, 24 lines, and 22 loads. The source is located at node 1 and the nominal voltage is 4.16 kV [45]. The electrical configuration of this system can be seen in Figure 7. The total active and reactive power consumption is 1073 kW and 792 kvar for phase A, 1083.3 kW and 801 kvar for phase B, and 1083.3 kW and 800 kvar for phase C.
For this research, the information of load consumption per phase adopted was that proposed by the authors in [46]. The load consumption per phase and impedance matrix information per type of conductor are shown in Table A3 and Table A4 from Appendix A, respectively.

4.3. IEEE 37-Node Test System

The IEEE 37-node test system is a real radial unbalanced distribution system located in California, totally composed of underground lines [47]. It has 37 nodes, node 1 being the source, 35 lines, and 25 loads. It has a transformer that operates in an unbalanced form and a voltage regulator [47]. The nominal voltage is 4.8 kV [47]. The electric configuration of this system can be appreciated in Figure 8, the nodes being numbered the same as that considered in [3]. The total active and reactive power consumption is 727 kW and 357 kvar for phase A, 639 kW and 314 kvar for phase B, and 1091 kW and 530 kvar for phase C. Initially, this system has total active power losses of 60.563 kW [47].
It is important to mention that in this research neither the transformer with unbalanced operation nor the voltage regulator is considered, as proposed by [3]. The transformer located at nodes 10 and 24 is removed, including node 24 [3]. The voltage regulator located between nodes 1 and 2 is replaced by a type 1 conductor with a length of 1850 feet, as proposed by [47]. Likewise, for the development of this work, it is established that the system loads correspond to a constant power model and the capacitive effect of the lines is neglected, due to the length and voltage level [48].
Load consumption per phase and impedance matrix information per type of conductor are shown in Table A1, Table A2, Table A3, Table A4, Table A5 and Table A6.

5. Evaluation of the Initial Configurations

Due to the modifications posed in Section 4 for the IEEE 8-, 25-, and 37-node test systems, it is necessary to determine the new operative state of the systems (nodal voltage per phase) and the active power losses for the demand conditions given in Table A1, Table A3, and Table A5, respectively. To do this, the power flow presented in Section 3 is evaluated and the results are compared with the software DigSILENT© (Version 15.1, Gomaringen, Germany).

5.1. Computational Validation

To validate the developed three-phase iterative sweep power flow, the results obtained will be compared with DigSILENT©, the power-system analysis software. With the purpose of providing a solution to the three-phase power-flow method, MATLAB® version 2020 a is employed in a laptop with an Intel(R) Core(TM) i5-7200U CPU @2.50 GHz processor, with 8.00 GB of RAM memory running Windows 10 Home Single Language operating system of 64 bits. Notice that to determine the run-time, a maximum of 1000 iterations and a maximum tolerance of 1 × 10 10 was considered.

5.2. 8-Node Test System

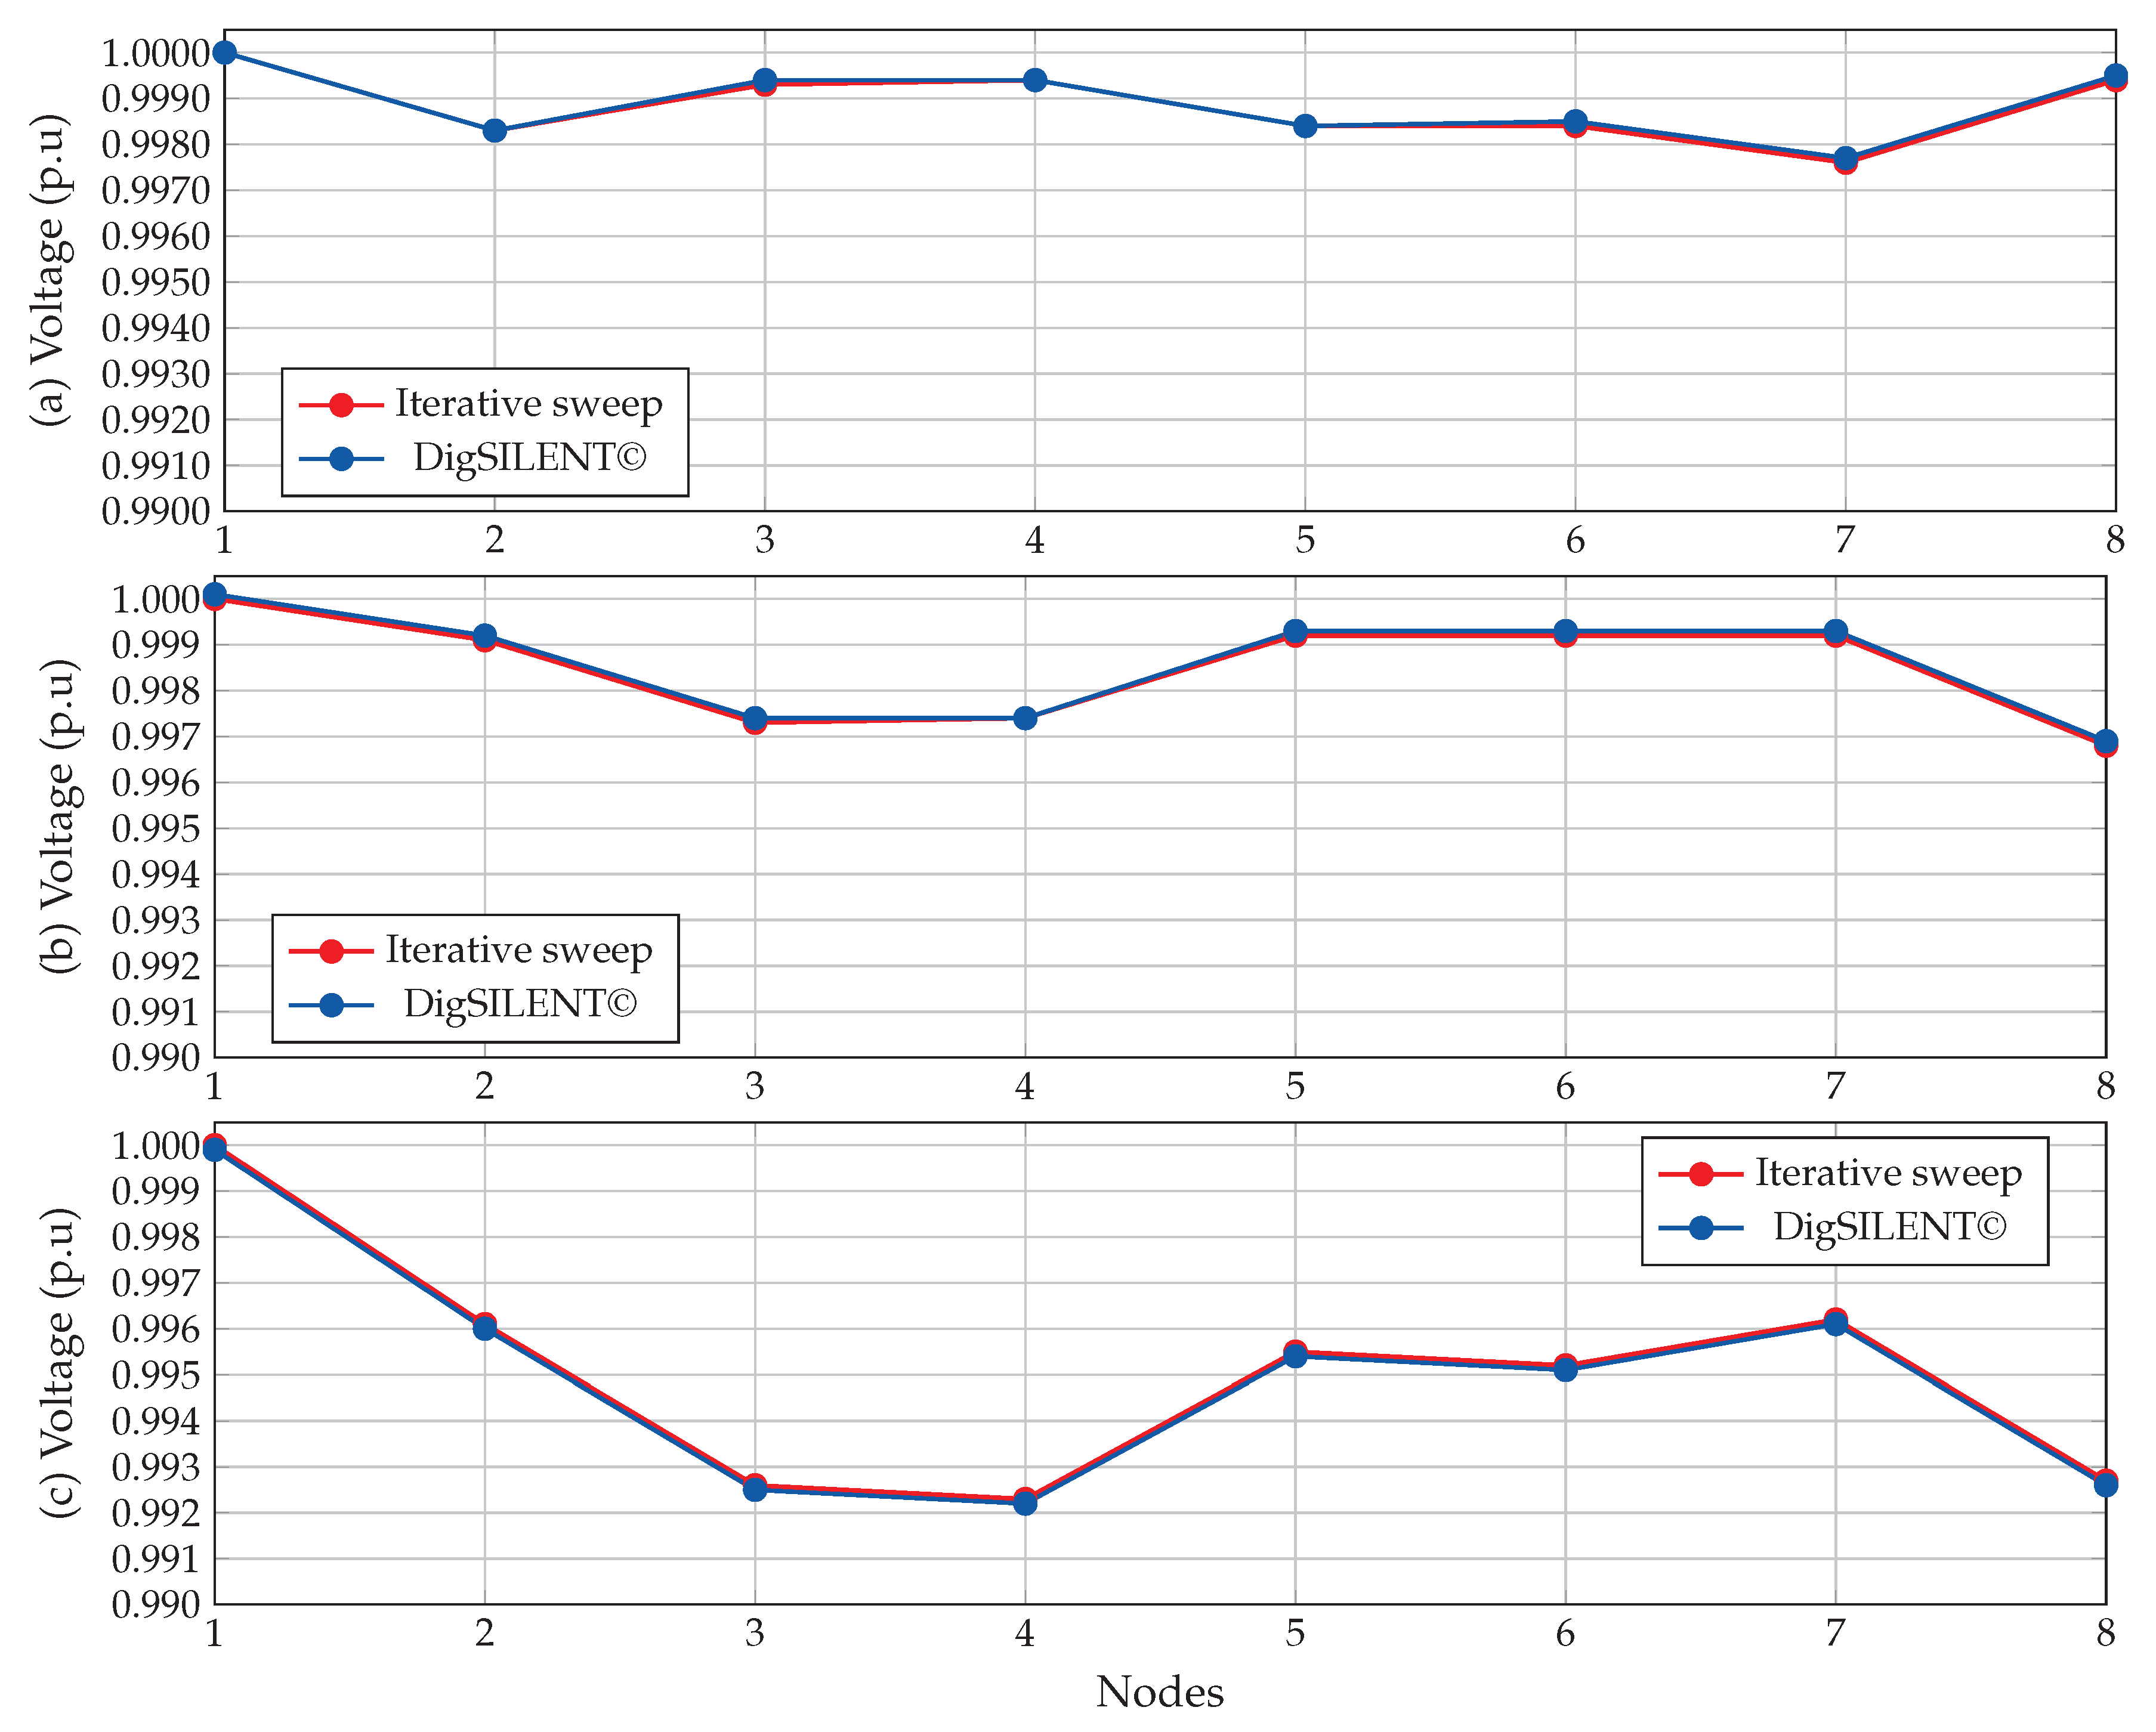
In Table 4, nodal voltages are shown, obtained with the proposed three-phase iterative sweep method, using the software DigSILENT© in relation to the unbalanced three-phase power-flow solution. Moreover, in Figure 9 voltage profiles are presented for each phase, which have been obtained with the three-phase iterative sweep method using the software DigSILENT©.
In Table 5 the numerical results of this test system related to time processing, number of iterations, and power loss per phase of the three-phase iterative sweep method proposed and those obtained with the DigSILENT© simulation can be appreciated.
From the results obtained from Table 4 and Table 5 it is observed that:
The proposed three-phase iterative sweep method with an error of 1 × 10 10 takes 5 iterations and a run-time of 0.0905 s to obtain similar results to those reached by DigSILENT©. In Figure 9 it is shown that the behavior in terms of voltage per phase is the same for both solution methods.
From Table 4 it is determined that the maximum error between the data acquired by the three-phase iterative sweep method and DigSILENT© for the voltage profiles at each phase are 0.0073% for phase A, 0.0114% for phase B, and 0.0144% for phase C. On the other hand, from Table 5 the maximum errors for active power loss are 0.0007% for phase A, 0.0436% for phase B, 0.0250% for phase C, and 0.0104% for total loss, which demonstrates that the results obtained with the three-phase iterative sweep method are reliable, since these are comparable with specialized software, such as DigSILENT©.

5.3. 25-Node Test System

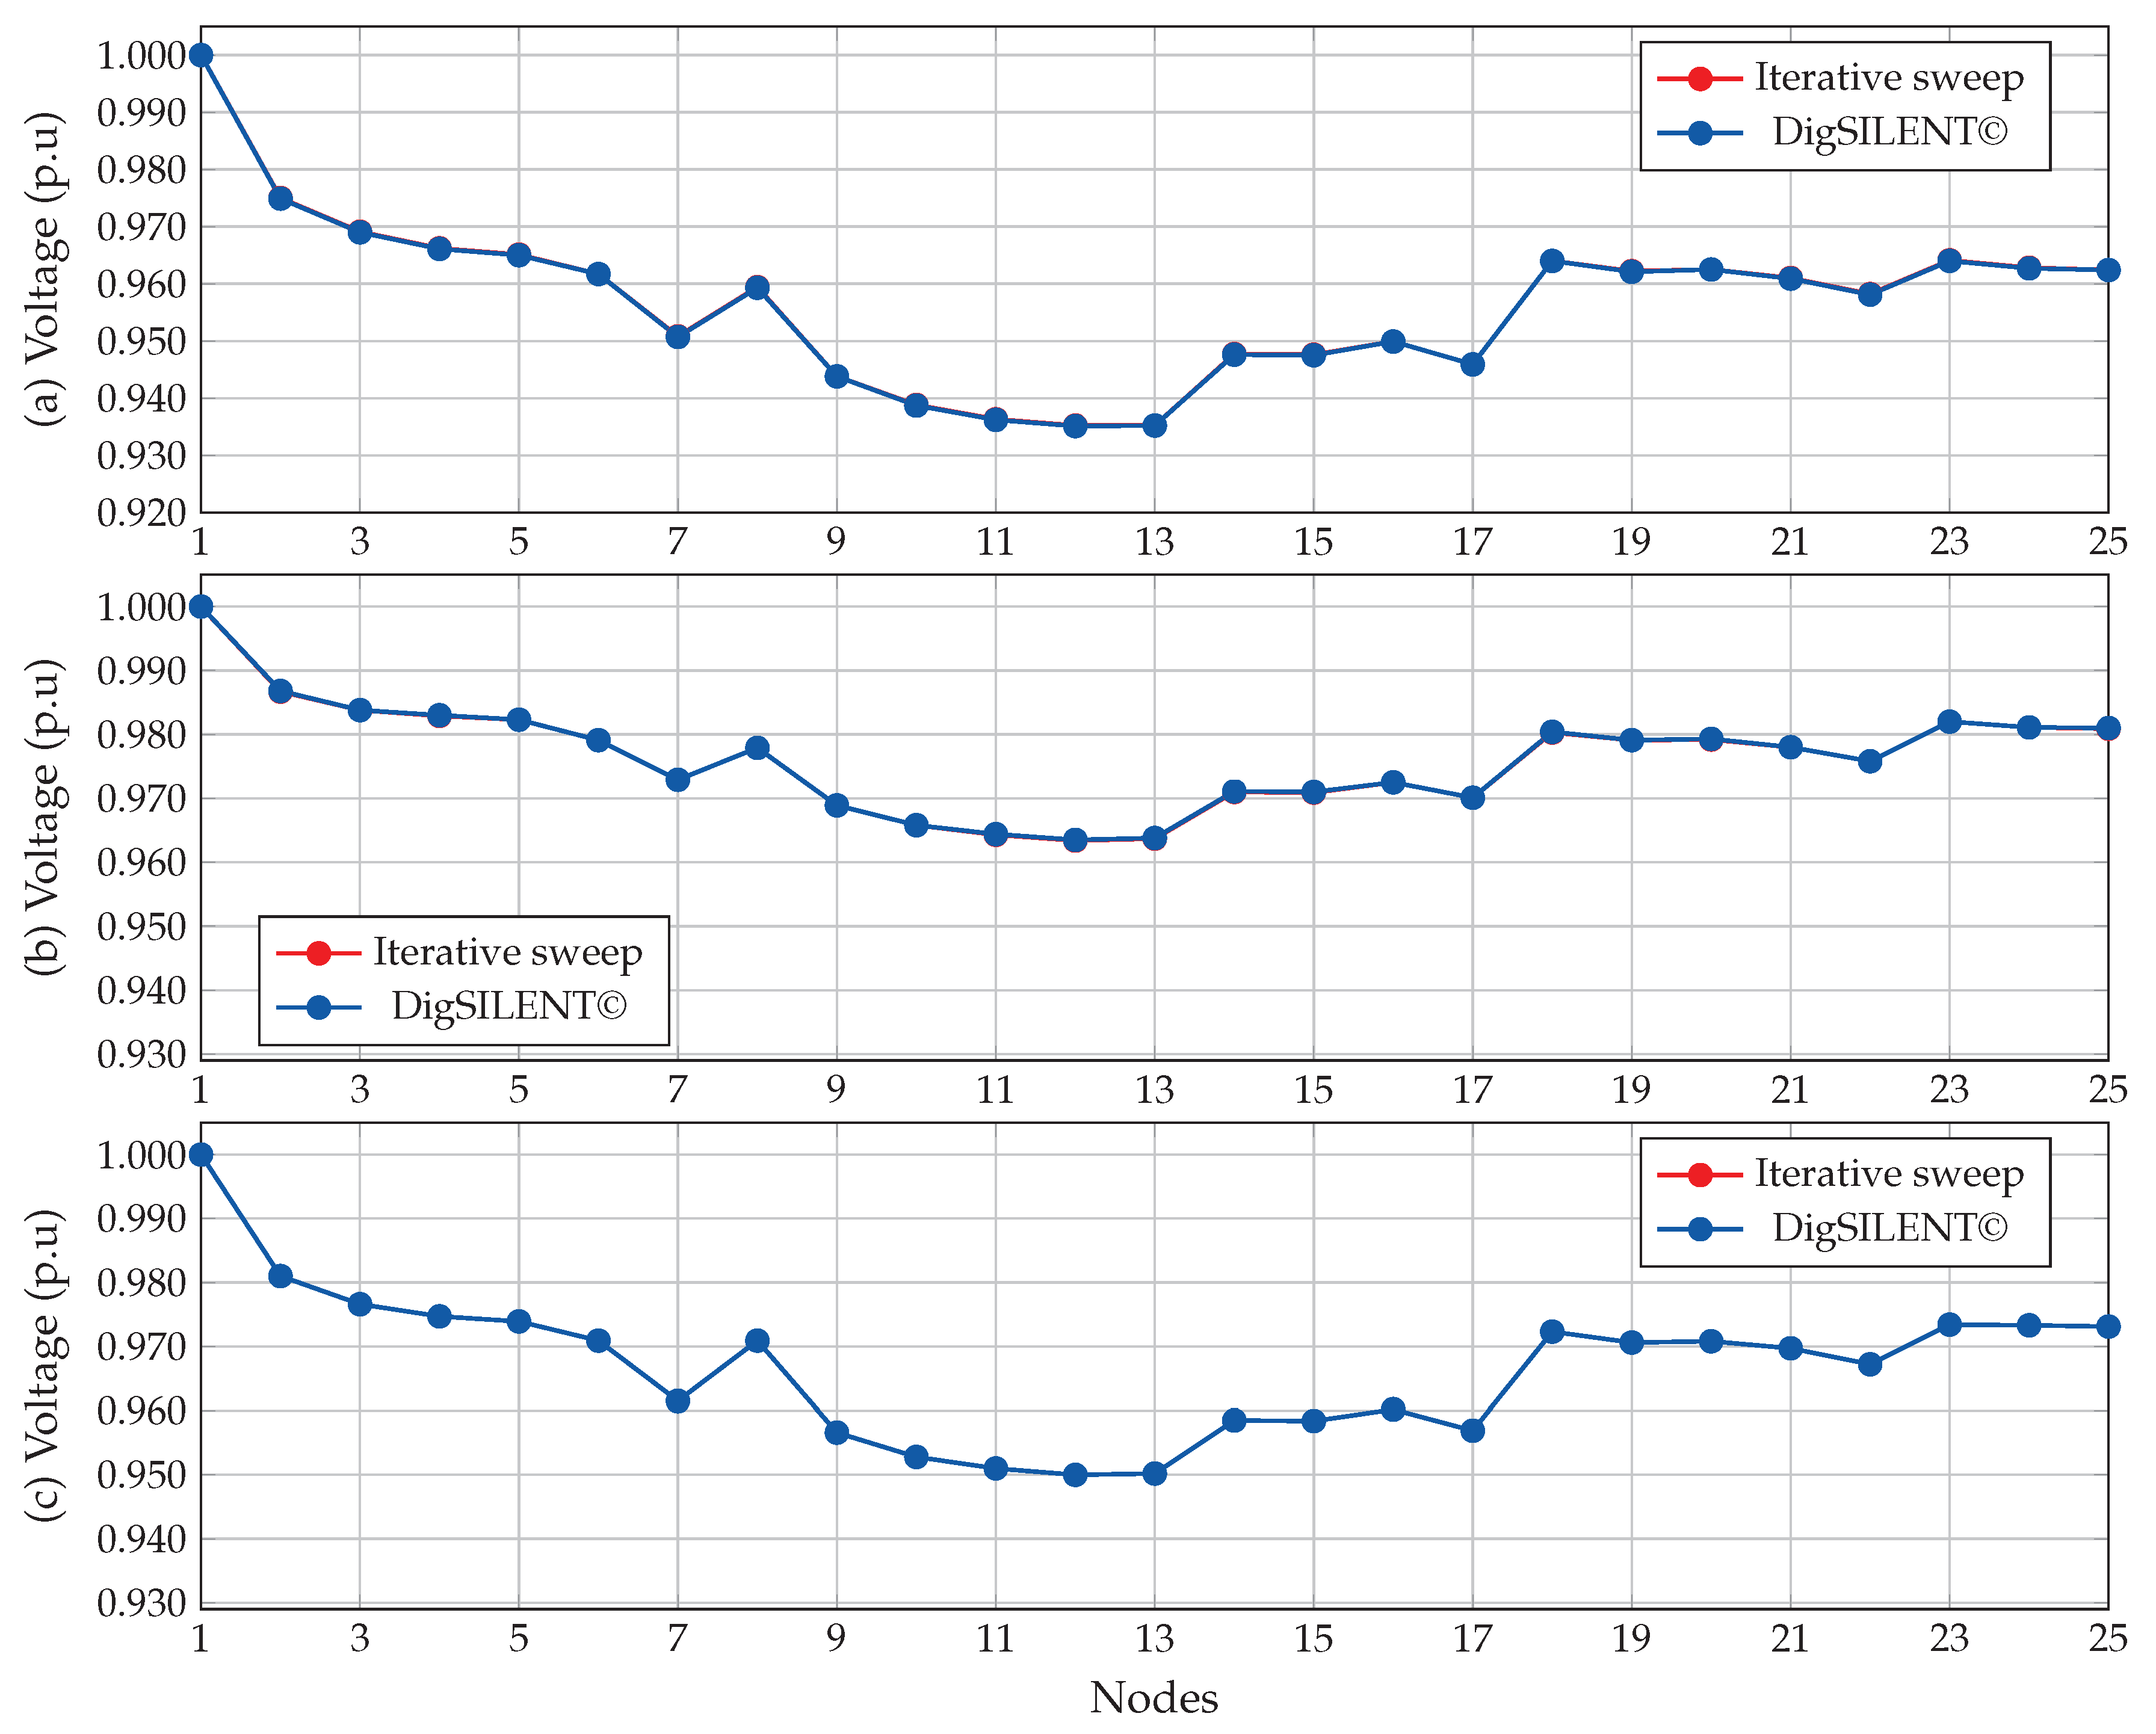
Table 6 shows the nodal voltages per phase obtained with the three-phase iterative sweep method proposed with software DigSILENT©. In Figure 10 the voltage profiles are presented for phase A, phase B, and phase C, respectively, obtained with the three-phase iterative sweep method and DigSILENT©.
In Table 7, the numerical results are appreciated in terms of processing time, the number of iterations, and the power losses per phase of the three-phase iterative sweep method proposed, and those obtained with DigSILENT© simulation.
From the results obtained in Table 6 and Table 7, it can be confirmed that:
The three-phase iterative sweep method proposed with an error of 1 × 10 10 takes 9 iterations and 0.1882 s of processing time to obtain similar results to those reached with the power-system software DigSILENT©. In Figure 10, it is shown that the behavior in terms of voltage per phase is the same for both solution techniques.
From Table 6 it is determined that the maximum error of the results obtained between the three-phase sweep iterative method and DigSILENT© for the voltage profiles at each phase are 0.0098% for phase A, 0.0104% for phase B, and 0.0051% for phase C, respectively. By the other side from Table 7 the maximum error for the active power loss per phase are 0.0115% for phase A, 0.0015% for phase B, 0.0071% for phase C, and 0.0032% for the total loss, which demonstrates that the results obtained with the developed three-phase iterative sweep method are reliable, since they can be compared with the specialized software for power systems DigSILENT©.

5.4. IEEE 37-Node Test System

In Table 8 the nodal voltage can be appreciated per phase obtained with the three-phase iterative sweep method and software DigSILENT©.
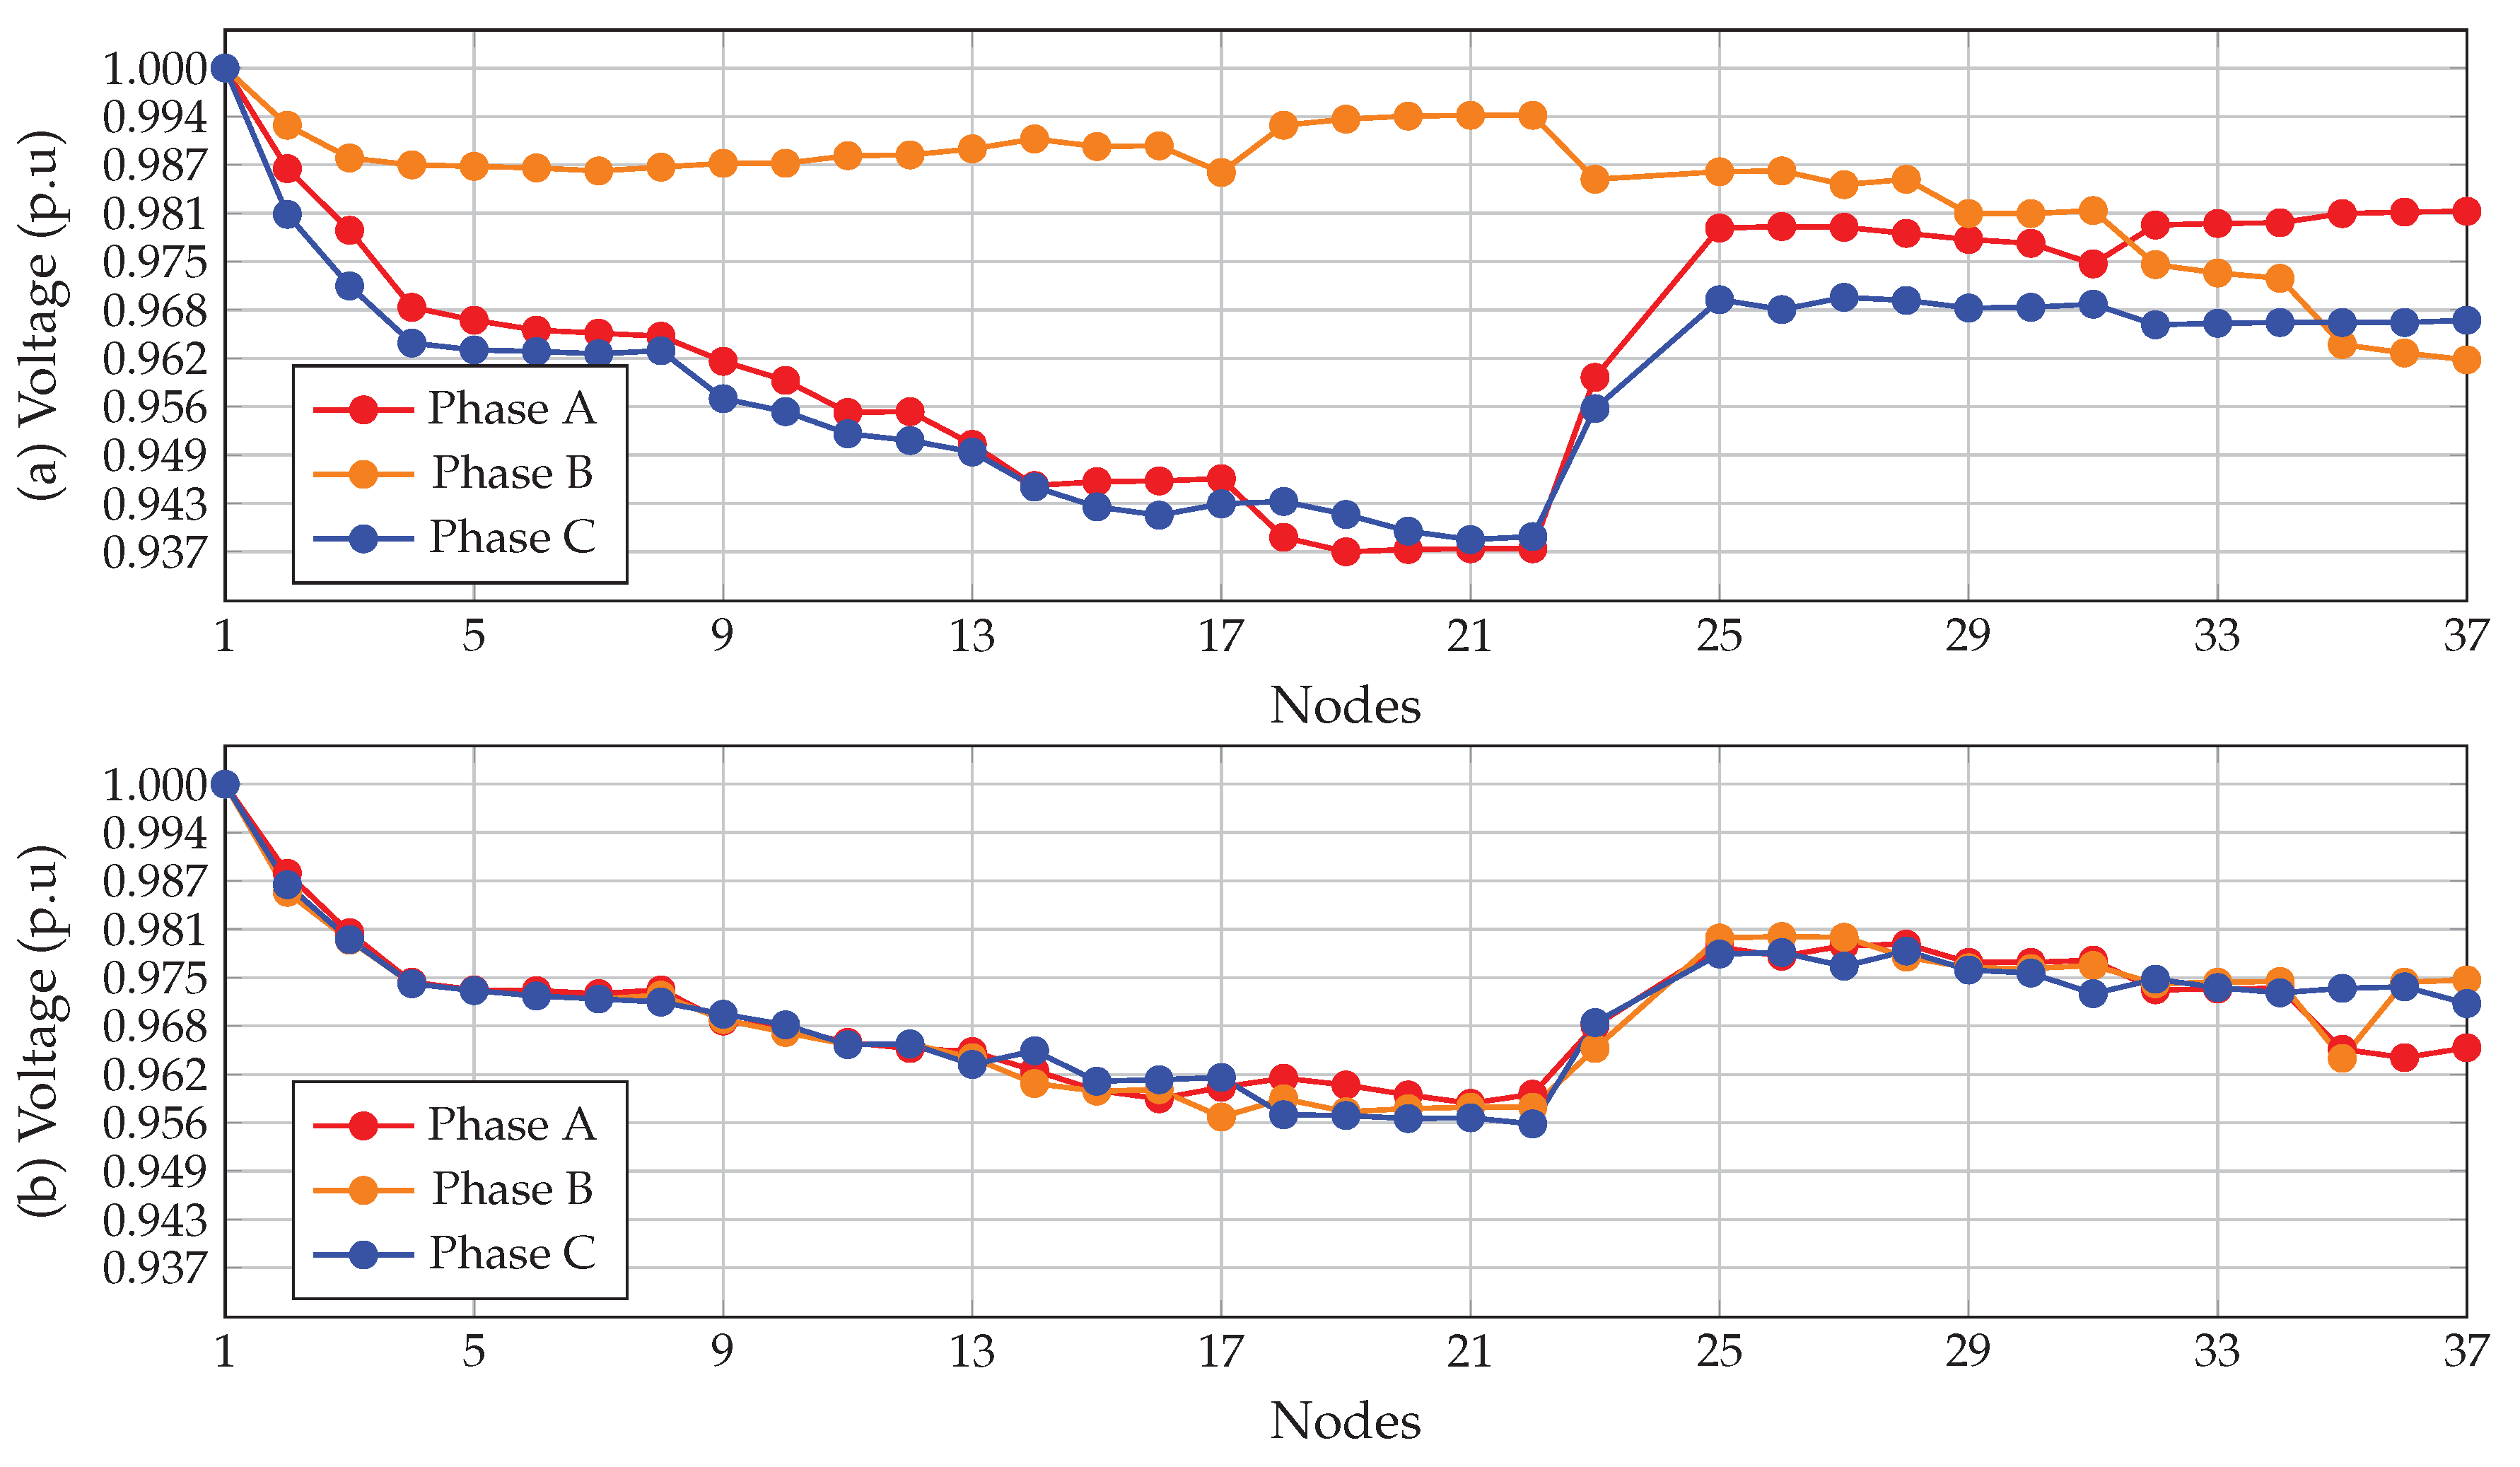
In Figure 11, the voltage profiles are presented for phases A, B, and C, obtained with the three-phase iterative sweep method and DigSILENT©.
In Table 9, the numerical results can be appreciated, with the processing time, number of iterations and power losses per phase of the proposed three-phase iterative sweep method and the specialized software DigSILENT©.
From the results obtained in Table 8 and Table 9 it is observed that:
The proposed three-phase iterative sweep method with an error of 1 × 10 10 takes 9 iterations and a processing time of 0.2919 s to obtain similar results to those reached with the specialized software DigSILENT©. In Figure 11, it is shown that the behavior in terms of voltage per phase is the same for both solution methods.
From Table 8 it is determined that the maximum error for the voltage profiles obtained between the three-phase iterative sweep method and DigSILENT© at each phase are 0.0068% for phase A, 0.091% for phase B, and 0.0110% for phase C. On the other hand, from Table 8 the maximum error for the active power losses are 0.0003% for phase A, 0.0185% for phase B, 0.0131% for phase C, and 0.0038% for the total loss. This demonstrates that the results obtained with the developed three-phase iterative sweep method are reliable, since these are comparable with the specialized power-system software DigSILENT©.

6. Results Obtained: Methodology Proposed

With knowledge of the new operative state and the power losses per phase and total losses of the IEEE 8-, 25-, and 37-node test systems, the master–slave optimization is performed to determine the new set of connections for the demand nodes, the reduction of active power losses and reduction on the unbalanced percentage of the test systems proposed.

6.1. Computational Validation

To solve the MINLP optimization model shown in (1) to (11) that represents the optimal balancing problem of phases for distribution systems, MATLAB® V2020a is employed in a laptop with an Intel(R) Core(TM) i5-7200U CPU @2.50 GHz processor, with 8.00 GB of RAM memory running Windows 10 Home Single Language operating system of 64 bits.
To implement the proposed master–slave optimization for the PB problem in unbalanced distribution systems, the information presented in Table 10 is used.
Notice that for the selection of the parameters shown in Table 10 a sensitivity analysis was done between the number of candidate solutions and the number of iterations employed by the DVSA for the proposed cases in Section 4. For that, the solution space was explored between 8 and 15 candidate solutions, and from 500 to 2000 iterations, which confirmed the proposal of [35]: (i) for a reduced number of iterations and candidate solutions, the optimization process is faster but the chance of reaching an optimal global solution significantly decreases; (ii) for a large number of candidate solutions and iterations, the optimization process is slower, but there is greater chance of obtaining an optimal global solution; and (iii) several iterations between 500 and 1000 with several candidate solutions between 8 and 12 allows a balance between processing time and the possibility of finding the optimal global solution. Therefore, the number of candidate solutions is selected as 10, and the number of iterations is set as 800, for the parameters in the proposed DVSA.
On the other hand, from this sensitivity analysis it was observed that for the number of candidate solutions and selected iterations, after reaching a certain number of iterations, the possible global optimal solution does not change in value. Due to this, it is proposed that after 250 iterations the search process be terminated, when the objective function value is not modified, and the best solution of the current population is reported. This will allow a decrease of the processing time of the algorithm.
Due to the candidate solutions being generated through a random process using a normal distribution (i.e., Gaussian distribution), it is recommended to do 100 of consecutive evaluations to determine the average processing time algorithm and the number of times the optimal solution of the problem is reached.
Finally, for comparative purposes, we contrasted the proposed discrete VSA approach for the solution of the phase-balancing problem with the classical Chu & Beasley genetic algorithm (CBGA) [3] using the same size of the initial populations and the number of generations assigned for the VSA for all the test feeders.

6.2. 8-Node Test System

In Table 11, the results obtained for the DVSA are shown, for the 8-node tests system. Since there were modifications in the benchmark case, the results reported by the set of connections are compared with CBGA and the specialized power-system software DigSILENT©.
From Table 11, the following situations can be observed: (i) the proposed DVSA reduces the total power loss by 24.34%, i.e., from 13.9925 kW to 10.5869 kW. Moreover, it is observed that the power loss is increased by 59.08% for phase A and 75.74% for phase B, but is reduced in 62.1795% for phase C, making the loss per phase to be similar to each other, reducing the system-unbalancing; (ii) the proposed DVSA reaches an optimal global solution by connection change only at 3 demand nodes of the system, i.e., nodes 2, 4, and 6, which represent 42.86% of the demand nodes; and (iii) the errors for the active power loss are 0% for phases A, B, and C, respectively, and the total loss in comparison with CBGA; in the same way, the maximum errors for the active power loss are 0.0052% for phase A, 0.0005% for phase B, 0.0051% for phase C, and 0.0003% for total loss, respectively, in comparison with DigSILENT©, which validates the connections for the loads obtained by the DVSA, since the results are comparable with CBGA and the specialized power-system software DigSILENT©.
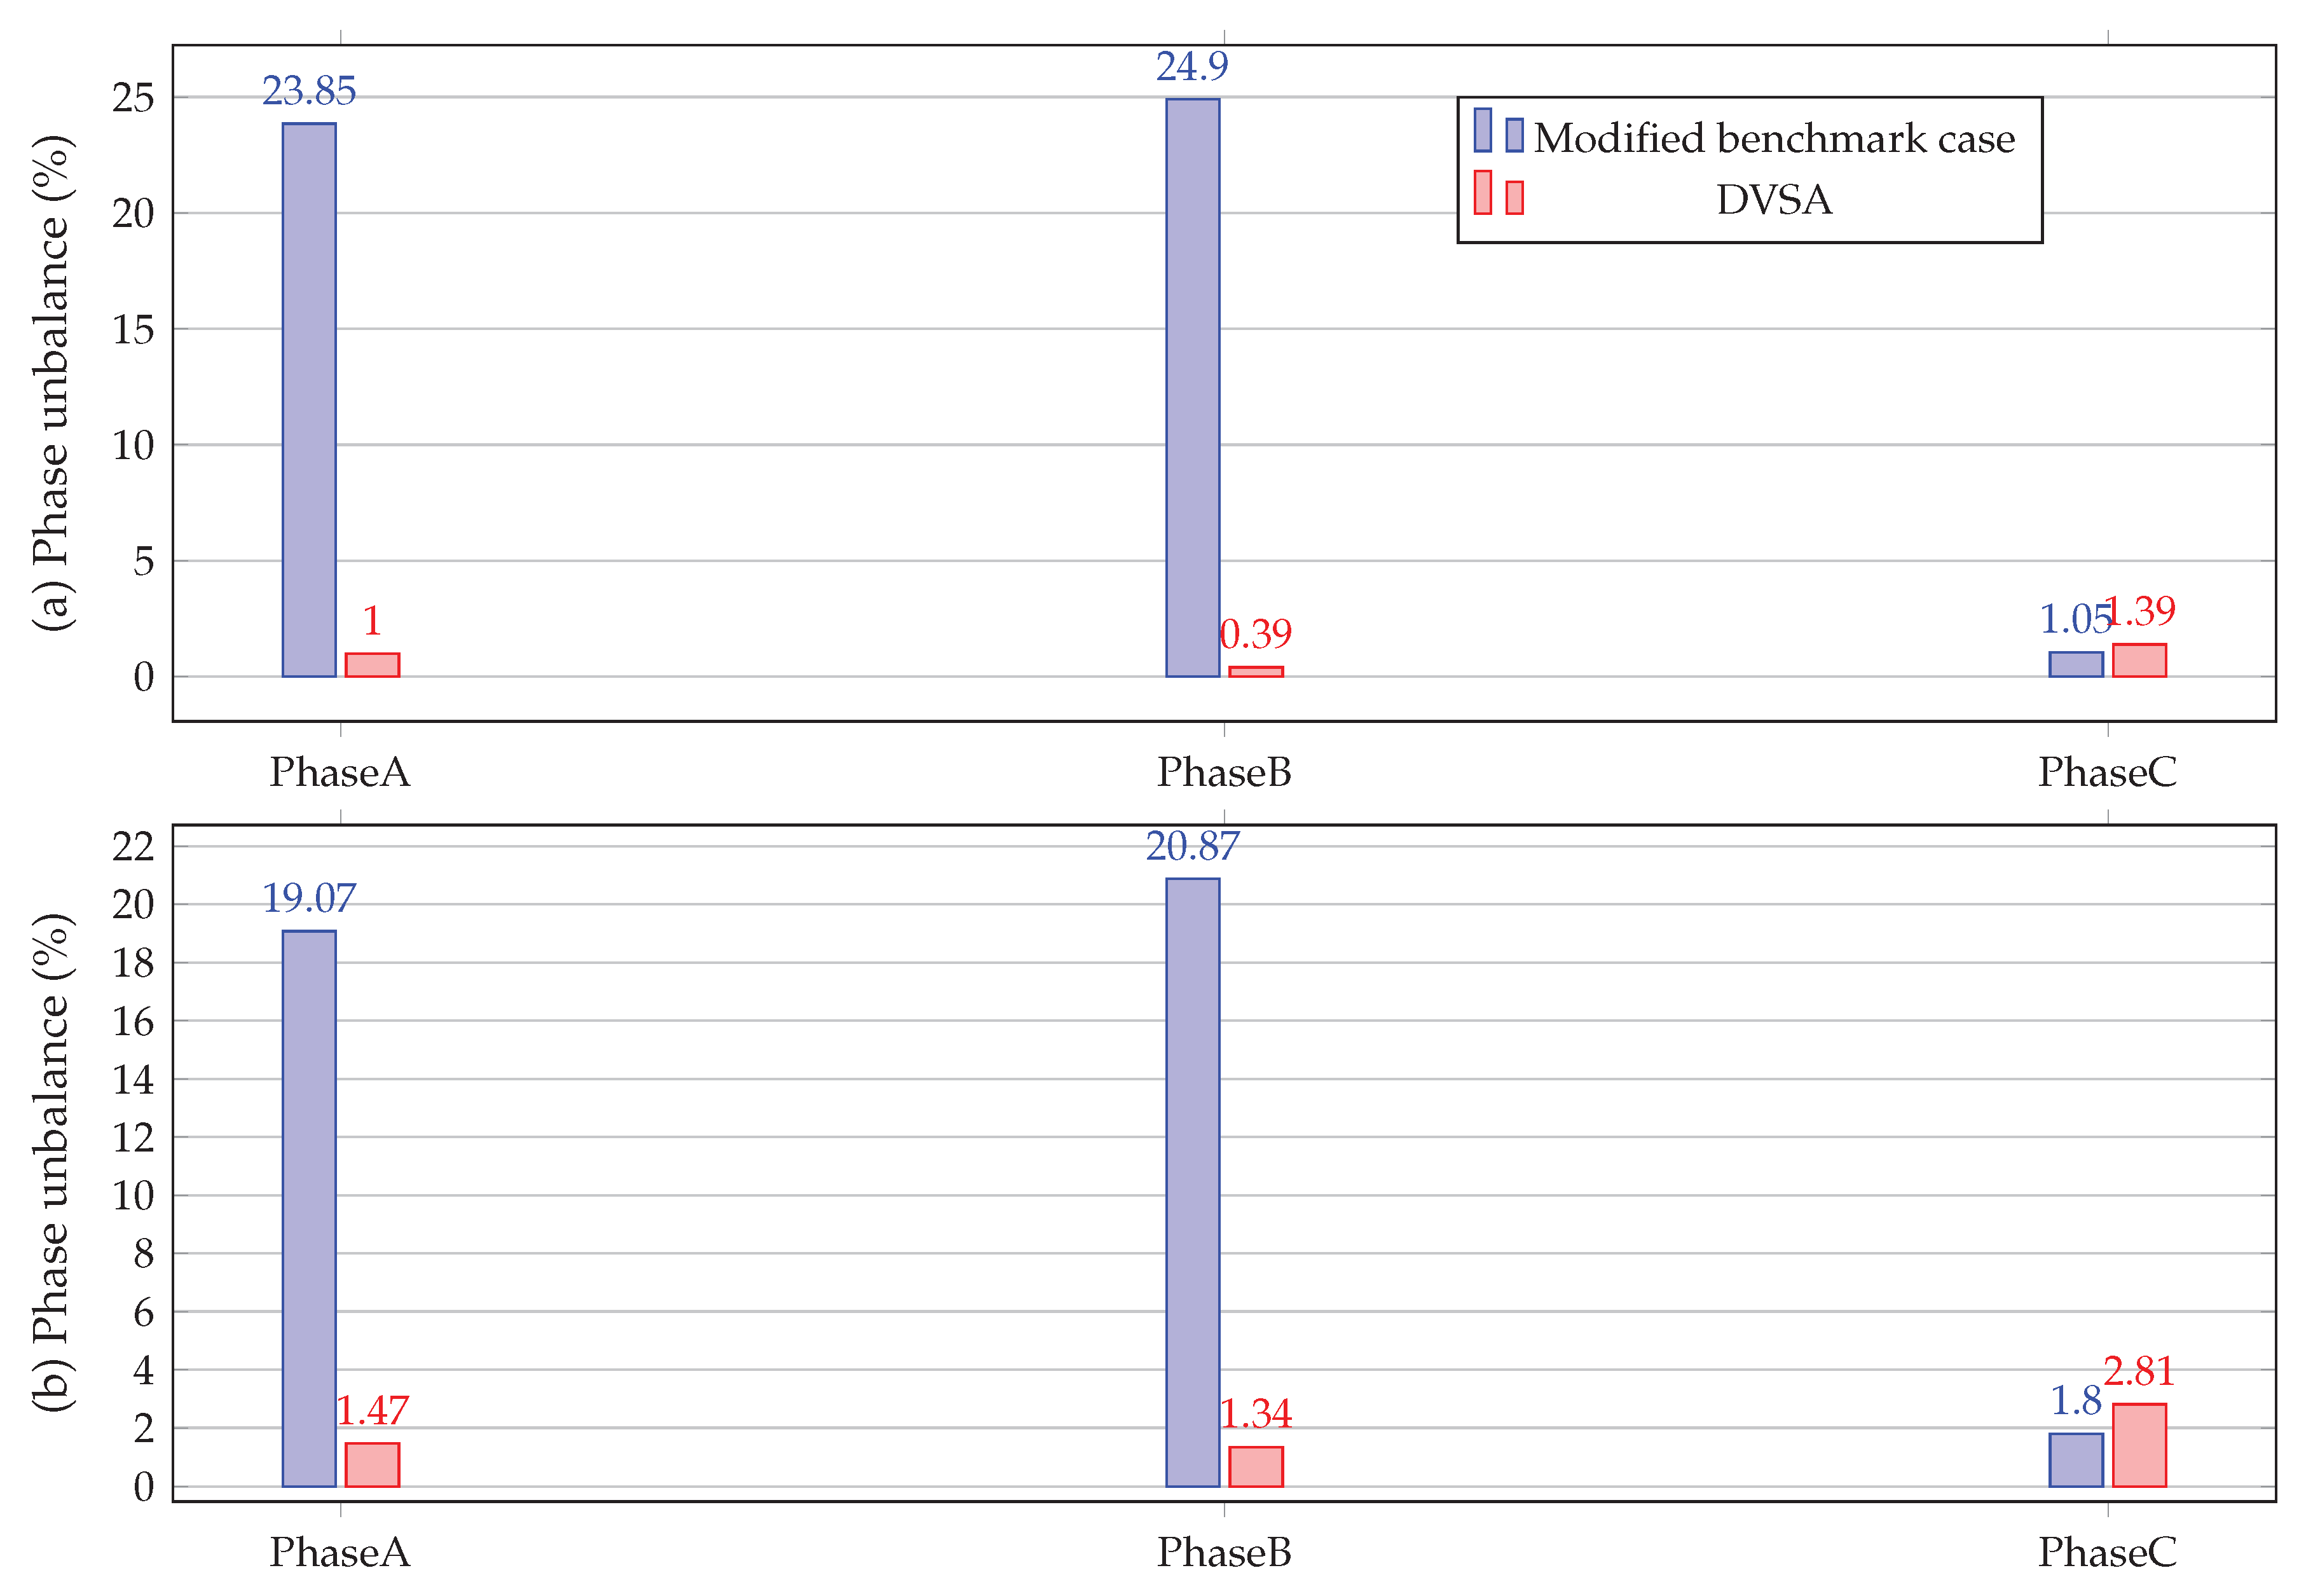
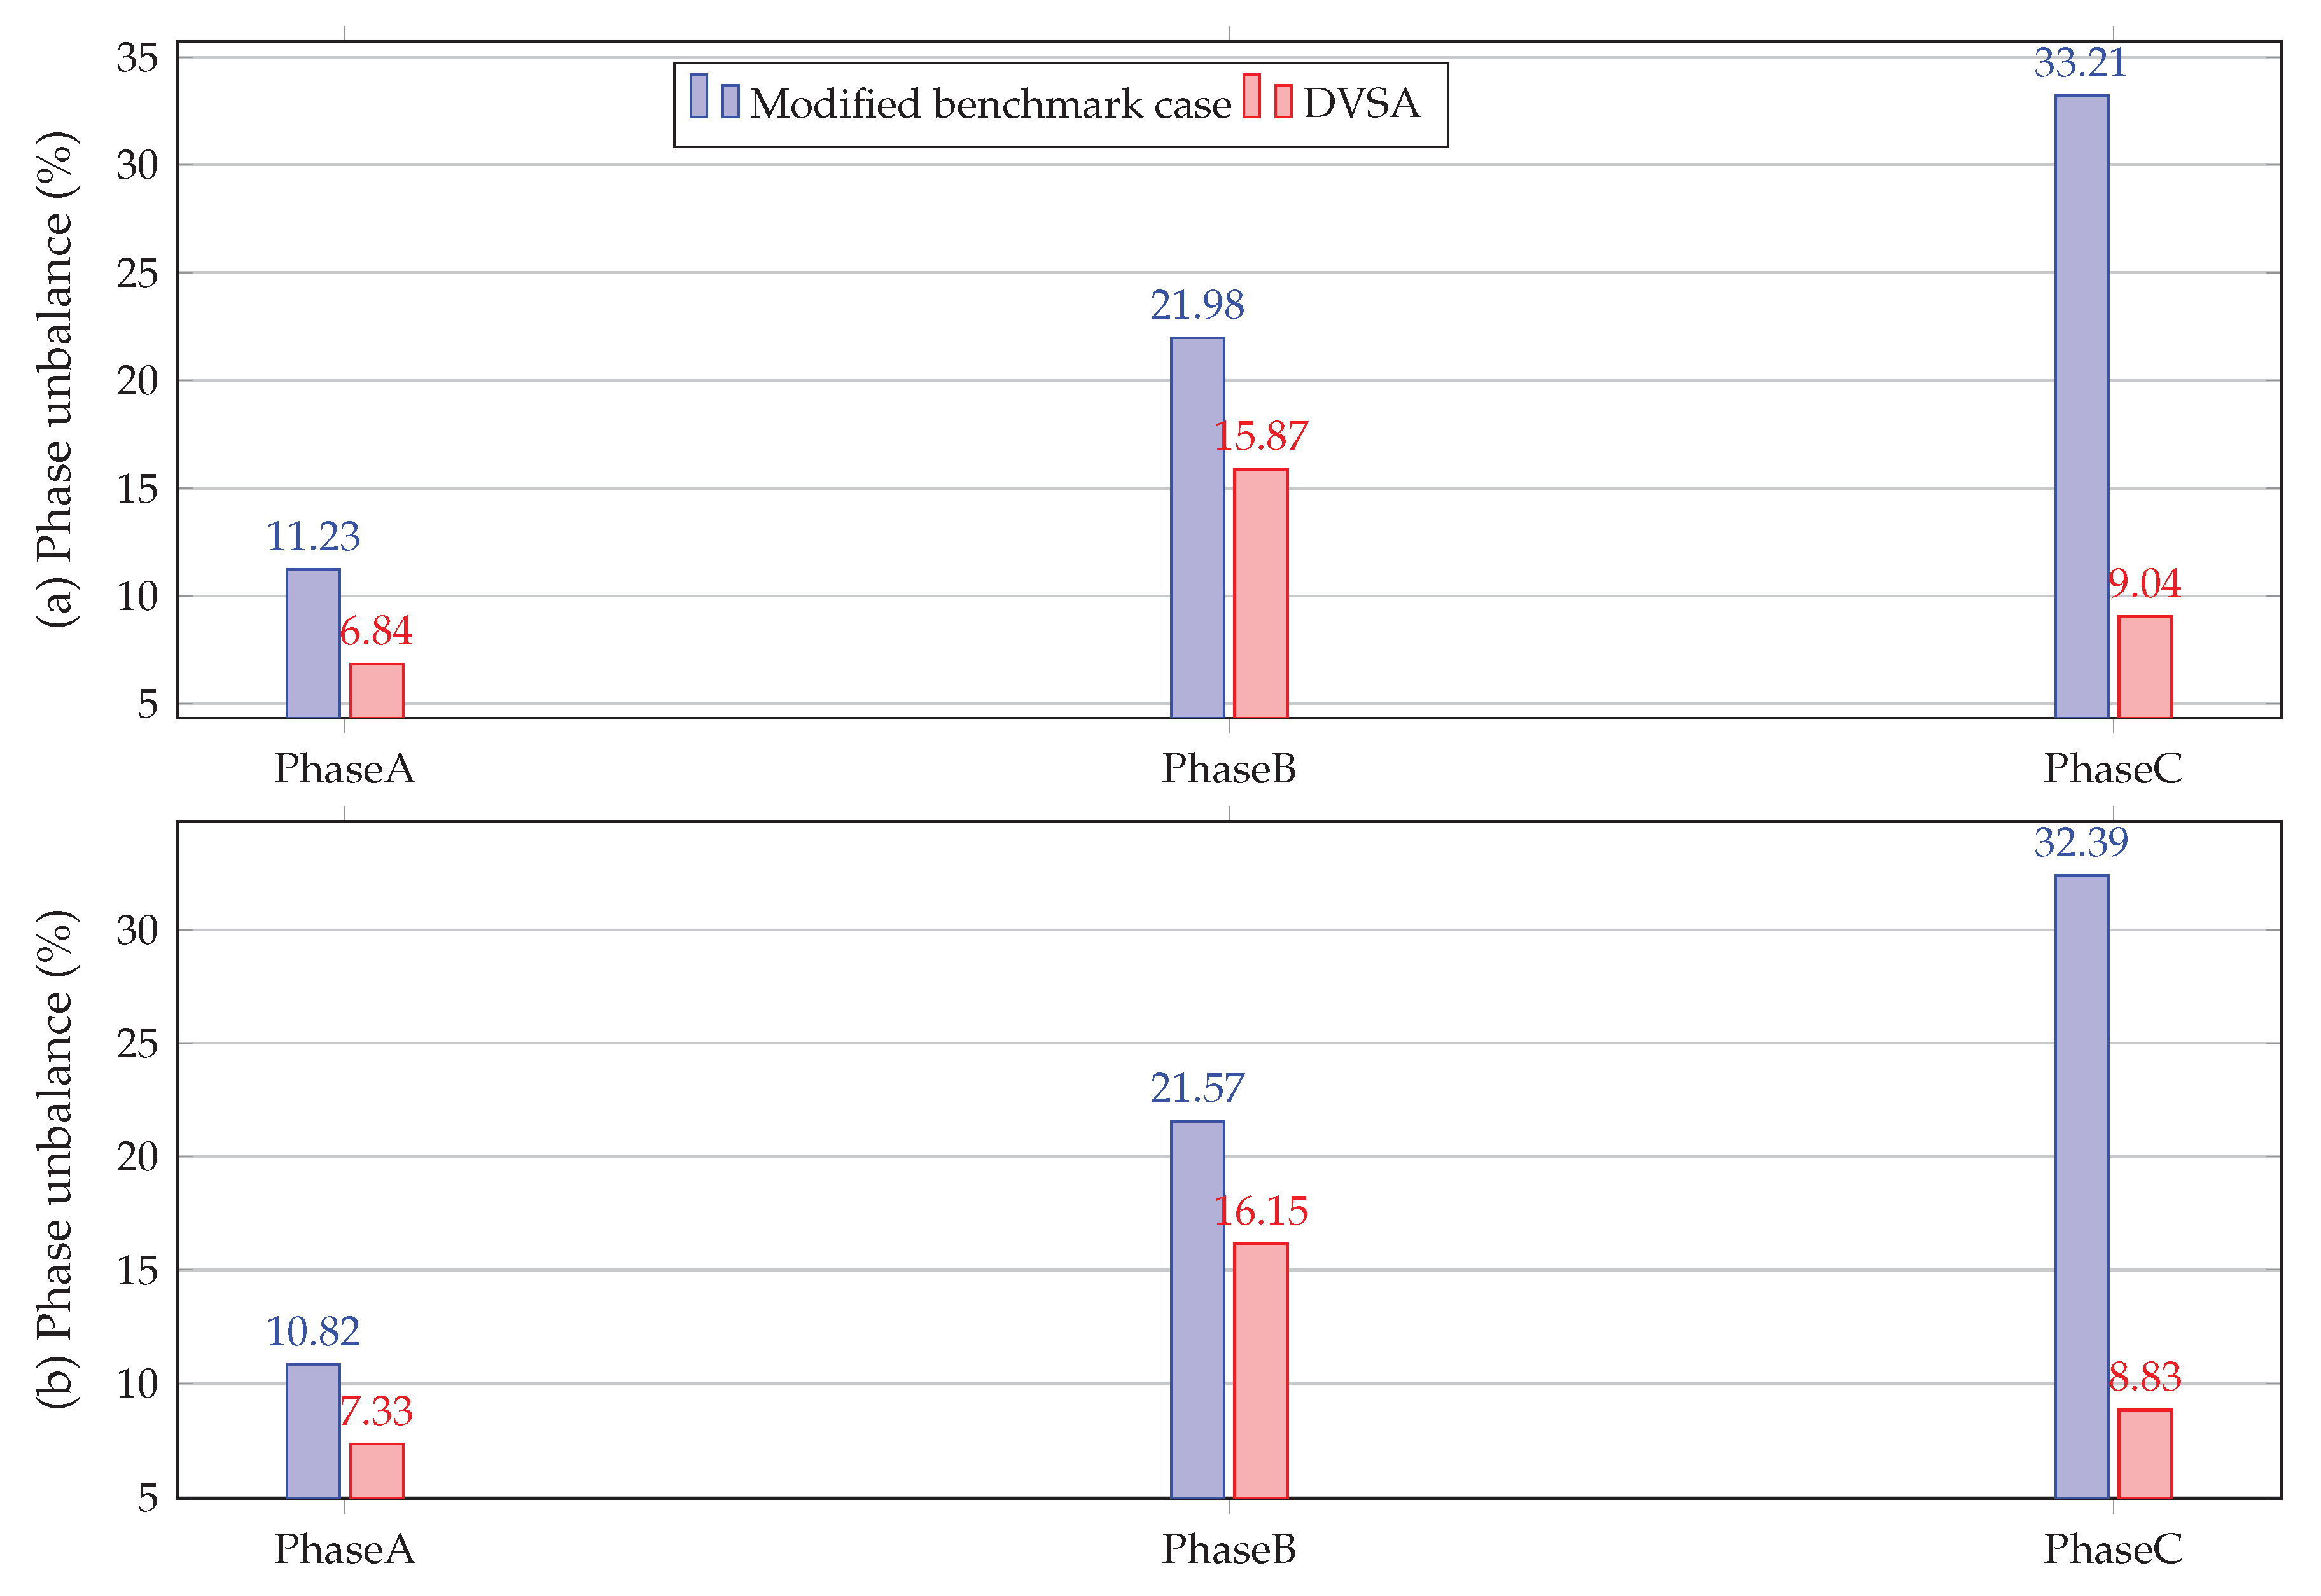
In Figure 12, the active and reactive power unbalance percentage is presented for the modified benchmark case and those obtained by the DVSA. In Figure 12a, a reduction on the active power unbalance can be appreciated of 5.51% for phase A, 30.03% for phase B, and 40.36% for phase C. In Figure 12b, a reduction of the reactive power unbalance can be appreciated of 5.87% for phase A, 29.99% for phase B, and 40.36% for phase C. Likewise, the results obtained for the active and reactive power unbalance per phase are very similar to each other.
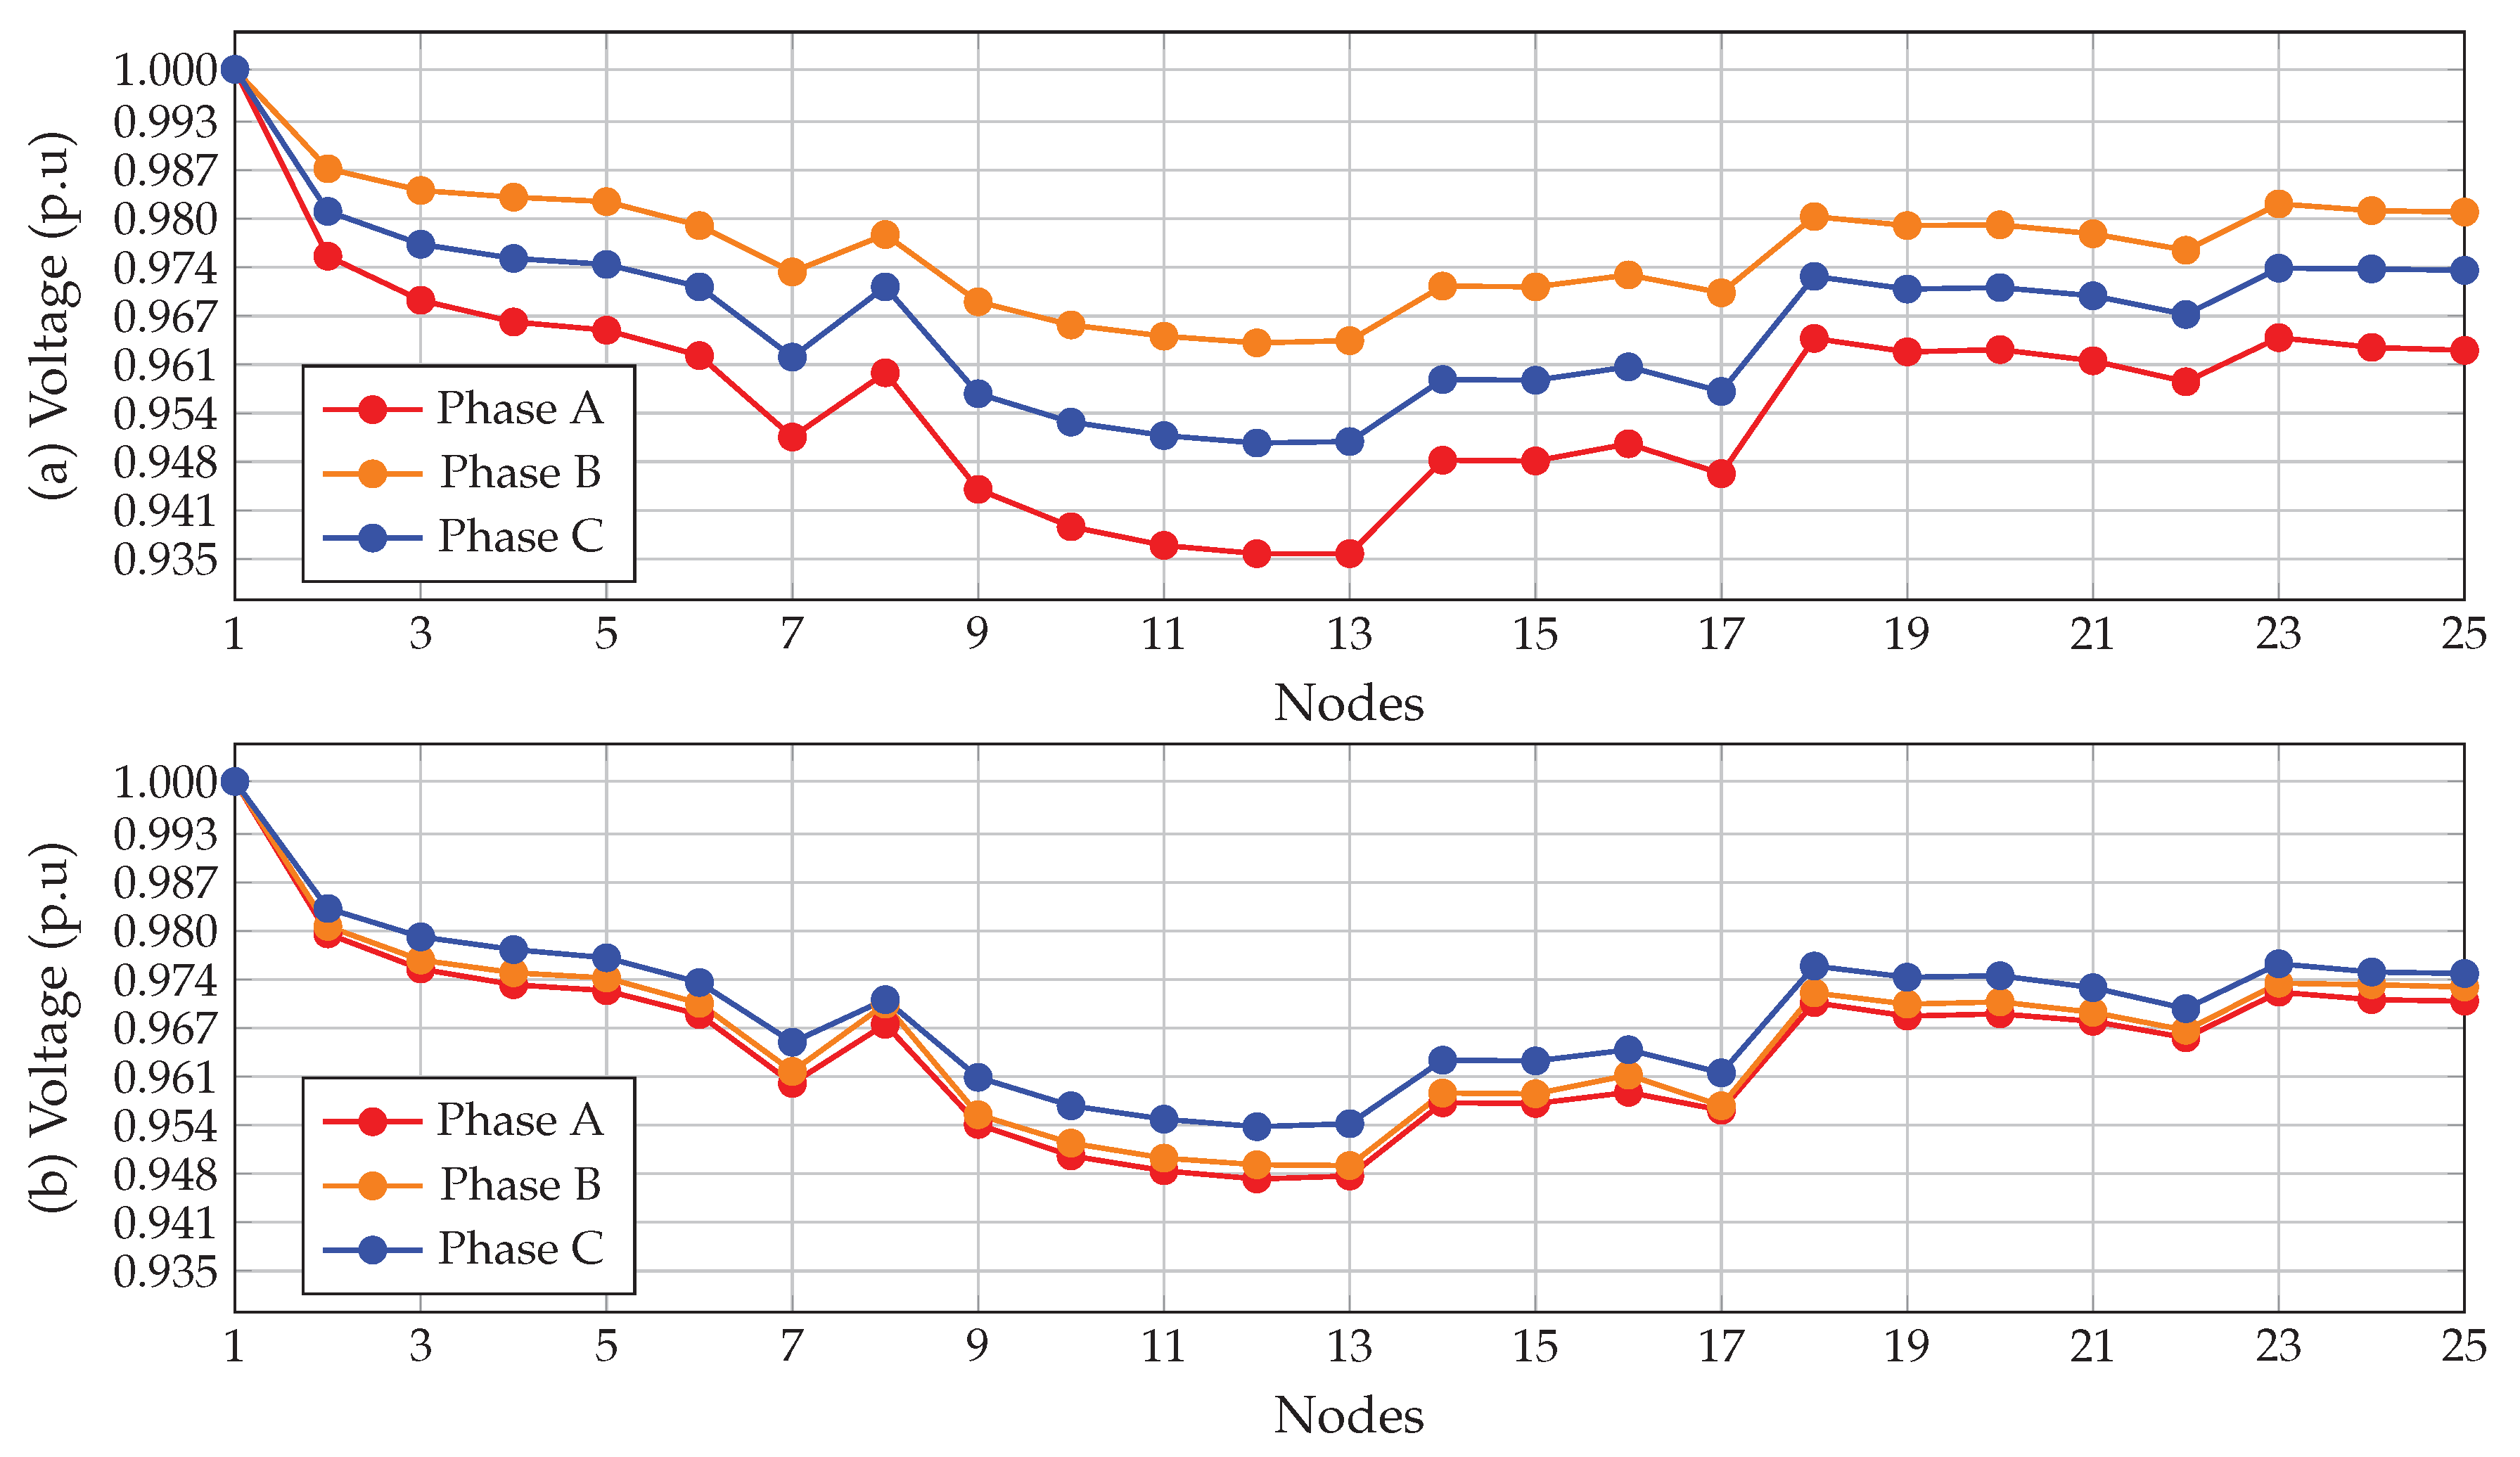
Figure 13a shows the voltage profiles per phase for the modified benchmark case, while Figure 13b shows the PB effect with the methodology proposed for the 8-node test system. Graphically, it can be appreciated that when reducing the phase unbalance, the voltage profile behaviors are similar. Additionally, before performing PB, the lowest value of voltage was 0.9923 pu, corresponding to node 4 at phase C; after the PB, this value is 0.9960 pu, which indicates an improvement of 0.3730%.
On the other hand, after doing 100 consecutive evaluations of the DVSA proposed for the 8-node test system, it is found that the best solution is 10.5869 kW, which is repeated in 92% of the evaluations performed, while CBGA got the same solution but in 70% of the evaluations. It is also observed that only one evaluation obtains this solution in one iteration with DVSA proposed and only one evaluation obtains this solution in three iteration with CBGA. Likewise, for the 8-node test system, the standard deviation for the DVSA proposed is 0.40 W for the objective function and 80.6 for the iterations performed; on the other hand, the results are 89.7 W for the objective function and 137.7 for the iterations performed with CBGA. In terms of processing time, DVSA proposed takes on average 6.059 s and CBGA takes on average 2.8137 s to reach the global optimal.

6.3. 25-Node Test System

In Table 12, the results obtained are shown for the DVSA proposed in the 25-node test system, and the respective comparison with CBGA and the software DigSILENT©.
From Table 12, the following situations can be observed: (i) the proposed DVSA reduces the total power losses by 4.1526%, i.e., from 75.4207 kW to 72.2888 kW. It is observed that the power loss is reduced by 30.41% for phase A, and 13.8654% for phase C; however, there is an increase of 76.9604% for phase B, making the power losses per phase similar, reducing the system unbalance; (ii) in comparison with the CBGA, the proposed DVSA reduces the total power loss by 0.005%; (iii) the proposed DVSA reaches a global optimal solution via connection changing on 21 demand nodes of the system, which represents 87.50% of the demand nodes; and (iv) it can be appreciated that the maximum errors for the active power loss are 0.0003% for phase A, 0.0110% for phase B, 0.0144% for phase C, and 0.0002% for the total loss, respectively, which validates the load connections for the DVSA, since the results are comparable with the specialized power-system software DigSILENT©.
In Figure 14 the active and reactive power unbalancing percentage is presented for the modified benchmark case and those obtained for the DVSA. In Figure 14a, a reduction of the active power unbalance by 22.86% can be appreciated for phase A and 24.51% for phase B, and an increase of 0.34% for phase C. In Figure 14b a reduction of the reactive power unbalance is shown of 17.60% for phase A, 19.53% for phase B, and an increase of 1.01% for phase C. Although the unbalanced percentage increases for phase C, for both active and reactive power, this increase can neglected in comparison with the unbalanced percentage reduction of the phases A and B for active and reactive power. In the same sense, the results obtained for the active and reactive power unbalance per phase are very similar to each other.
Figure 15a shows the voltage profiles per phase for the modified benchmark case, while Figure 15b shows the PB effect with the methodology proposed for the 25-node test system. Graphically it can be noted that when there is a reduction of unbalance for phases A and B, the voltage profiles have similar behavior; conversely, when there is an unbalance for phase C, the voltage profiles diverge. Additionally, before PB, the lowest voltage value was 0.9352 pu, corresponding to node 13 in phase A; after the PB this value is 0.9472 pu, which indicates an improvement of 1.28%.
On the other hand, after doing 100 consecutive evaluations of the proposed DVSA for the 25-node test system, it is found that the best solution is 72.2888 kW, which is repeated only once in the evaluations performed. It is also observed that this value is obtained in 395 iterations. Although CBGA found that the best solution is 72.2919 kW, which is repeated only once in evaluations performed, it is also observed that this value is obtained in 550 iterations. Likewise, it is found that for the 25-node test system the standard deviation of the proposed DVSA is 0.0233 kW for the objective function and 126.71 for the iterations performed; moreover, the standard deviation of the CBGA is 0.03669 kW for the objective function and 167.8619 for the iterations performed. Regarding the processing time, DVSA proposed takes an average of 39.69 s and CBGA takes on average 18.6683 s to reach the global optimum.

6.4. 37 Nodes Test System

In Table 13, the results obtained for the proposed DVSA are found for the IEEE 37-node test system and the comparison with CBGA and the specialized power-system software DigSILENT©.
From Table 13, the following situations can be observed: (i) the proposed DVSA reduces the total power losses by 19.2493%, i.e., from 76.136 kW to 61.4801 kW. Moreover, it is observed that the power losses are reduced by 22.4195% for phase A and 49.5108% for phase C; however, there is an increase of 82.1248% for phase B, making the losses per phase similar to each other, reducing the system unbalance; (ii) in comparison with the CBGA, the proposed DVSA reduces the total power losses by 0.16%; (iii) the proposed DVSA reaches a global optimal solution, making the change of connection of 25 demand nodes of the system, which represents 71.43% of the demand nodes; and (iv) it is appreciated that the largest error for the active power loss is 0.0058% for phase A, 0.0071% for phase B, 0.0008% for phase C, and 0.0001% for the total loss, which validates the load connections obtained by the DVSA, since the results are comparable to the specialized power-system software DigSILENT©.
In Figure 16 the unbalanced percentage of active and reactive power is presented for the modified benchmark case and those obtained by the DVSA. In Figure 16a, a reduction of the active power unbalance is appreciated of 4.40% for phase A, 6.11% for phase B, and 24.18% for phase C. In Figure 16b, a reduction of the reactive power unbalance is appreciated of 3.50% for phase A, 5.41% for phase B, and 23.56% for phase C.
Figure 17a shows the voltage profiles per phase for the modified benchmark case, while Figure 17b shows the PB effect with the methodology proposed for the IEEE 37-odes test system. Graphically, it is shown that when the phase unbalance is reduced, the voltage profiles have a similar behavior. Additionally, before PB, the lowest voltage value was 0.9369 pu, corresponding to node 22 in phase A; after PB, this value is 0.9593 pu, which shows an improvement of 2.39%.
On the other hand, after doing 100 consecutive evaluations of the proposed DVSA for the IEEE 37-node test system, it is found that the best solution is 61.4801 kW, which is repeated only once in the evaluations performed. It is also observed that this value is obtained in 387 iterations. Although CBGA found that the best solution is 61.5785 kW, which is repeated only once in the evaluations performed, it is also observed that this value is obtained in 427 iterations. Likewise, for this test system, the standard deviation of the proposed DVSA is 0.3286 kW for the objective function, and 149.68 for the iterations performed; by comparison with CBGA, the standard deviation is 0.4274 kW for the objective function and 532.934 for the iterations performed. Regarding the processing time, the proposed DVSA takes 50.0262 s and CBGA takes on average 14.1816 s to reach the global optimum.
All the solutions obtained by the DVSA proposed for the IEEE 8-, 25-, and 37-node test systems require a longer computing time compared to the results obtained with the CBGA. However, when the proposed methodology is applied, an improvement in the results is evident compared with the CBGA, it can be observed that the proposed DVSA requires a smaller number of iterations to reach the best solution.

7. Conclusions and Future Works

In this research paper, an optimization algorithm is presented to solve the optimal phase-balance problem in radial and meshed unbalanced distribution systems. This algorithm uses a master–slave optimization methodology. In the master stage, a discrete version of the Vortex Search Algorithm is used, which determines the set of phase connections for the demand nodes of the system; in the slave stage, a three-phase version of the classic method of iterative sweep power flow is implemented, which determines the operative state of the system including the active power total losses. The objective function under analysis is focused on active power-loss minimization in unbalanced distribution systems. The numerical results show the applicability and the efficiency of the optimization method developed for the proposed test systems. In the 8-node test system a 24.34% reduction in total power loss is reached; in the 25nodes system the reduction accounts for 4.1526% of the total power loss, and in the IEEE 37-node test system this reduction is 19.2483% of total power loss. In the same manner, in the methodology proposed, a reduced processing time is shown to determine the global optimal solution. For the 8-node system, the average processing time is 6.059 s, for the 25-node test system the average processing time is 39.69 s, while for the IEEE 37-node test system the processing time is 50.026 s, on average.
One of the main characteristics of the developed DVSA is that a discrete codification is employed, using integer numbers as decision variables, which allows the representation of the problem of optimal phase-balancing. This avoids the excessive use of large-size binary vectors, and consequently the processing time is reduced. Additionally, after 100 consecutive evaluations, the proposed optimization algorithm reaches a possible global optimal solution for the 8-node test system in one iteration, for the 25-node system in 395 iterations, and for the 37-node test system in 387 iterations, which confirms that a sensitivity analysis for setting the DVSA allows the reaching of a global optimal solution with a minimum of iterations. Likewise, it is appreciated that all the solutions obtained by the DVSA for the IEEE 8-, 25-, and 37-node test systems are similar to each other, since the standard deviation is 0.4 W, 0.023 kW, and 0.32 kW, respectively. Finally, it is noted that the application for optimal phase-balancing in unbalanced distribution systems reduces the unbalanced percentage, which leads to an improvement of the system voltage profiles and therefore the total power loss is reduced accordingly, in such a way that the system finds its best operation point.
Numerical comparisons with the CBGA demonstrated that the proposed discrete VSA approach can find the best objective function values when the same number of iterations and population sizes are used during the comparison process. It was observed that the CBGA required lower processing times to reach the solution of the problem when compared with the proposed VSA; however, for planning purposes, computational times lower than 60 s reported by the proposed approach can be considered extremely efficient (i.e., negligible) for solving the problem of phase-balancing in distribution grids.
In future works, it will be possible to address the following problems: (i) extend the problem presented in this work with typical demand curves using the master–slave methodology to reduce the energy losses through the determination of the set of phase connections for the demand nodes of the system; (ii) use the proposed master–slave methodology to determine the siting and sizing of AC three-phase distributed generators to balance the system using a discrete codification of integer number; and (iii) employ the proposed master–slave methodology to determine the optimal wire gauge per phase for each network segment of an unbalanced three-phase distribution system and, accordingly, reduce total active power loss.

Author Contributions

Conceptualization, methodology, software, and writing—review and editing, B.C.-C., L.S.A.-G., O.D.M.; H.R.C.; and L.A.-B. All authors have read and agreed to the published version of the manuscript.

Funding

This work was supported in part by the Laboratorio de Simulación Hardware-in-the-loop para Sistemas Ciberfísicos under Grant TEC2016-80242-P (AEI/FEDER), in part by the Spanish Ministry of Economy and Competitiveness under Grant DPI2016-75294-C2-2-R.

Institutional Review Board Statement

Not applicable.

Informed Consent Statement

Not applicable.

Data Availability Statement

No new data were created or analyzed in this study. Data sharing is not applicable to this article.

Acknowledgments

This work was supported in part by the Centro de Investigación y Desarrollo Científico de la Universidad Distrital Francisco José de Caldas under grant 1643-12-2020 associated with the project: “Desarrollo de una metodología de optimización para la gestión óptima de recursos energéticos distribuidos en redes de distribución de energía eléctrica.” and in part by the Dirección de Investigaciones de la Universidad Tecnológica de Bolívar under grant PS2020002 associated with the project: “Ubicación óptima de bancos de capacitores de paso fijo en redes eléctricas de distribución para reducción de costos y pérdidas de energía: Aplicación de métodos exactos y metaheurísticos.”

Conflicts of Interest

The authors declare no conflict of interest.

Appendix A. Electrical Parameters

Table A1, Table A3, and Table A5 show the parameters for the loads and lines of the IEEE 8-, 25-, and 37-node test systems, respectively. Table A2, Table A4 and Table A6 show the impedance matrices for the type of conductor of the IEEE 8-, 25-, and 37-node test systems, respectively.
Table A1. Loads and lines parameters of the 8-node test system.
LineNode iNode jConductorLength (ft) P jA (kW) Q jA (kvar) P jB (kW) Q jB (kvar) P jC (kW) Q jC (kvar)
11215280519250259126515250
2232528000259126486235
325352800000226109
427352804862350000
534452800000324157
638552800026712900
75665280000014570
Table A2. Impedance matrix for the type of conductors in the 8-node test system.
Type of Conductor
(Ω/mi)
0.093654 + 0.040293i0.031218 + 0.013431i0.031218 + 0.013431i
10.031218 + 0.013431i0.093654 + 0.040293i0.031218 + 0.013431i
0.031218 + 0.013431i0.031218 + 0.013431i0.093654 + 0.040293i
0.15609 + 0.067155i0.05203 + 0.022385i0.05203 + 0.022385i
20.05203 + 0.022385i0.15609 + 0.067155i0.05203 + 0.022385i
0.05203 + 0.022385i0.05203 + 0.022385i0.15609 + 0.067155i
0.046827 + 0.0201465i0.015609 + 0.0067155i0.015609 + 0.0067155i
30.015609 + 0.0067155i0.046827 + 0.0201465i0.015609 + 0.0067155i
0.015609 + 0.0067155i0.015609 + 0.0067155i0.046827 + 0.0201465i
0.031218 + 0.013431i0.010406 + 0.004477i0.010406 + 0.004477i
40.010406 + 0.004477i0.031218 + 0.013431i0.010406 + 0.004477i
0.010406 + 0.004477i0.010406 + 0.004477i0.031218 + 0.013431i
0.062436 + 0.026862i0.020812 + 0.008954i0.020812 + 0.008954i
50.020812 + 0.008954i0.062436 + 0.026862i0.020812 + 0.008954i
0.020812 + 0.008954i0.020812 + 0.008954i0.062436 + 0.026862i
0.078045 + 0.0335775i0.026015 + 0.0111925i0.026015 + 0.0111925i
60.026015 + 0.0111925i0.078045 + 0.0335775i0.026015 + 0.0111925i
0.026015 + 0.0111925i0.026015 + 0.0111925i0.078045 + 0.0335775i
Table A3. Loads and lines parameters of the 25-node test system.
LineNode iNode jConductorLength (ft) P jA (kW) Q jA (kvar) P jB (kW) Q jB (kvar) P jC (kW) Q jC (kvar)
11211000000000
22315003621.628.819.24226.4
326250043.228.833.6243030
434150057.643.24.83.44830
5318250057.643.238.428.84836
645250043.228.828.819.23624
742324008.664.84.83.86042
8672500000000
9682100043.228.828.819.23.62.4
107925007250.438.428.84830
11714250057.63638.428.86042
12716250057.64.33.828.84836
1391025003621.628.819.23226.4
141011230050.431.72414.43624
151112320057.6364833.64836
161113320064.821.633.621.13624
17141523007.24.34.82.963.6
181417330057.643.233.6245438.4
191820250050.43638.428.85438.4
20182134005.84.33.42.45.43.8
21201934008.66.54.83.464.8
22212234007250.457.643.26048
232324240050.43643.230.74.83.6
24242534008.66.54.82.964.2
Table A4. Impedance matrix for the type of conductor in the 25-node test system.
Type of Conductor
(Ω/mi)
0.3686 + 0.6852i0.0169 + 0.1515i0.0155 + 0.1098i
10.0169 + 0.1515i0.3757 + 0.6715i0.0188 + 0.2072i
0.0155 + 0.1098i0.0188 + 0.2072i0.3723 + 0.6782i
0.9775 + 0.8717i0.0167 + 0.1697i0.0152 + 0.1264i
20.0167 + 0.1697i0.9844 + 0.8654i0.0186 + 0.2275i
0.0152 + 0.1264i0.0186 + 0.2275i0.981 + 0.8648i
1.928 + 1.4194i0.0161 + 0.1183i0.0161 + 0.1183i
30.0161 + 0.1183i1.9308 + 1.4215i0.0161 + 0.1183i
0.0161 + 0.1183i0.0161 + 0.1183i1.9337 + 1.4236i
Table A5. Loads and lines parameters of the IEEE 37-node test system.
LineNode iNode jConductorLength (ft) P jA (kW) Q jA (kvar) P jB (kW) Q jB (kvar) P jC (kW) Q jC (kvar)
112118501407014070350175
2232960000000
33244400000000
4327336000008540
53421320000000
645424000004221
749360000008540
856328042210000
9674200422142214221
1068428042210000
119103200000000
121023360000854000
1310113320000000
141113332085400000
151112432000004221
161314356000004221
1714183640140700000
1814154520000000
191516420000008540
2015174128000422100
2118193400126620000
2219203400000000
232022340000004221
242021420000008540
252426432084854000
262425424000008540
2727283520000000
282829480178211000
292831380000008540
302930452085400000
3131344920000000
3231323600000000
333233428000422100
343436476000422100
353435412000140702110
Table A6. Impedance matrix for the type of conductors in the IEEE 37-node system.
Type of Conductor
(Ω/mi)
0.2926 + 0.1973i0.0673 − 0.0368i0.0337 − 0.0417i
10.0673 − 0.0368i0.2646 + 0.19i0.0673 − 0.0368i
0.0337 − 0.0417i0.0673 − 0.0368i0.2926 + 0.1973i
0.4751 + 0.2973i0.1629 − 0.0326i0.1234 − 0.0607i
20.1629 − 0.0326i0.4488 + 0.2678i0.1629 − 0.0326i
0.1234 − 0.0607i0.1629 − 0.0326i0.4751 + 0.2973i
1.2936 + 0.6713i0.4871 + 0.2111i0.4585 + 0.1521i
30.4871 + 0.2111i1.3022 + 0.6326i0.4871 + 0.2111i
0.4585 + 0.1521i0.4871 + 0.2111i1.2936 + 0.6713i
2.0952 + 0.7758i0.5204 + 0.2738i0.4926 + 0.2123i
40.5204 + 0.2738i2.1068 + 0.7398i0.5204 + 0.2738i
0.4926 + 0.2123i0.5204 + 0.2738i2.0952 + 0.7758i

References

  1. Montoya, O.D.; Serra, F.M.; Angelo, C.H.D. On the Efficiency in Electrical Networks with AC and DC Operation Technologies: A Comparative Study at the Distribution Stage. Electronics 2020, 9, 1352. [Google Scholar] [CrossRef]
  2. Montoya, O.D.; Gil-González, W. On the numerical analysis based on successive approximations for power flow problems in AC distribution systems. Electr. Power Syst. Res. 2020, 187, 106454. [Google Scholar] [CrossRef]
  3. Granada-Echeverri, M.; Gallego-Rendón, R.A.; López-Lezama, J.M. Optimal Phase Balancing Planning for Loss Reduction in Distribution Systems using a Specialized Genetic Algorithm. Ing. Cienc. 2012, 8, 121–140. [Google Scholar] [CrossRef] [Green Version]
  4. Alvarado-Barrios, L.; Alvarez-Arroyo, C.; Escano, J.M.; Gonzalez-Longatt, F.M.; Martinez-Ramos, J.L. Two-Level Optimisation and Control Strategy for Unbalanced Active Distribution Systems Management. IEEE Access 2020, 8, 197992–198009. [Google Scholar] [CrossRef]
  5. Beig, A.R. Three-phase AC supply. In Electric Renewable Energy Systems; Elsevier: Amsterdam, The Netherlands, 2016; pp. 183–208. [Google Scholar] [CrossRef]
  6. Laconico, K.C.C.; Aguirre, R.A. Optimal Load Balancing and Capacitor Sizing and Siting of an Unbalanced Radial Distribution Network. In Proceedings of the 2019 IEEE PES GTD Grand International Conference and Exposition Asia (GTD Asia), Bangkok, Thailand, 19–23 March 2019. [Google Scholar] [CrossRef]
  7. Montoya, O.D.; Molina-Cabrera, A.; Chamorro, H.R.; Alvarado-Barrios, L.; Rivas-Trujillo, E. A Hybrid Approach Based on SOCP and the Discrete Version of the SCA for Optimal Placement and Sizing DGs in AC Distribution Networks. Electronics 2020, 10, 26. [Google Scholar] [CrossRef]
  8. Swapna, M.; Udaykumar, R.Y. An algorithm for optimal phase balancing of secondary distribution systems at each node. In Proceedings of the 2016 IEEE PES 13th International Conference on Transmission & Distribution Construction, Operation & Live-Line Maintenance (ESMO), Columbus, OH, USA, 12–15 September 2016. [Google Scholar] [CrossRef]
  9. Soltani, S.; Rashidinejad, M.; Abdollahi, A. Stochastic Multiobjective Distribution Systems Phase Balancing Considering Distributed Energy Resources. IEEE Syst. J. 2018, 12, 2866–2877. [Google Scholar] [CrossRef]
  10. Omran, W.A.; Kazerani, M.; Salama, M.M.A. Investigation of Methods for Reduction of Power Fluctuations Generated From Large Grid-Connected Photovoltaic Systems. IEEE Trans. Energy Convers. 2011, 26, 318–327. [Google Scholar] [CrossRef]
  11. Gandomkar, M. Phase balancing using genetic algorithm. In Proceedings of the 39th International Universities Power Engineering Conference, UPEC 2004, Bristol, UK, 6–8 September 2004; Volume 1, pp. 377–379. [Google Scholar]
  12. Riaño, F.E.; Cruz, J.F.; Montoya, O.D.; Chamorro, H.R.; Alvarado-Barrios, L. Reduction of Losses and Operating Costs in Distribution Networks Using a Genetic Algorithm and Mathematical Optimization. Electronics 2021, 10, 419. [Google Scholar] [CrossRef]
  13. Comisiǿn de Regulaciǿn de Energía y Gas. Resolución 025 de 1995; CREG: Bogotá, Colombia, 1995. Available online: http://apolo.creg.gov.co/Publicac.nsf/Indice01/Resoluci%C3%B3n-1995-CRG95025 (accessed on 10 February 2021).
  14. Comisiǿn de Regulaciǿn de Energía y Gas. Resolución 023 de 2001; CREG: Bogotá, Colombia, 2001. Available online: http://apolo.creg.gov.co/Publicac.nsf/Indice01/Resoluci%C3%B3n-2001-CREG023-2001?OpenDocument (accessed on 10 February 2021).
  15. Fahim, M.; Hassan, M.E.; Najjar, M.B.E. Single phase load balancing in a three phase system at distribution and unit level. In Proceedings of the 2018 IEEE International Conference on Industrial Technology (ICIT), Lyon, France, 20–22 February 2018. [Google Scholar] [CrossRef]
  16. Zhu, J.; Chow, M.Y.; Zhang, F. Phase balancing using mixed-integer programming [distribution feeders]. IEEE Trans. Power Syst. 1998, 13, 1487–1492. [Google Scholar] [CrossRef]
  17. Zhu, J.; Bilbro, G.; Chow, M.Y. Phase balancing using simulated annealing. IEEE Trans. Power Syst. 1999, 14, 1508–1513. [Google Scholar] [CrossRef] [Green Version]
  18. Chen, T.H.; Cherng, J.T. Optimal phase arrangement of distribution transformers connected to a primary feeder for system unbalance improvement and loss reduction using a genetic algorithm. In Proceedings of the 21st International Conference on Power Industry Computer Applications. Connecting Utilities. PICA 99. To the Millennium and Beyond (Cat. No.99CH36351), Santa Clara, CA, USA, 21 May 1999; pp. 145–151. [Google Scholar] [CrossRef]
  19. Lin, C.H.; Chen, C.S.; Chuang, H.J.; Ho, C.Y. Heuristic rule-based phase balancing of distribution systems by considering customer load patterns. IEEE Trans. Power Syst. 2005, 20, 709–716. [Google Scholar] [CrossRef]
  20. Garcés-Ruiz, A.; Granada-Echeverri, M.; Gallego, R.A. Balance de fases usando colonia de hormigas. Ing. Compet. 2005, 7, 43–52. [Google Scholar]
  21. Tuppadung, Y.; Kurutach, W. The Modified Particle Swarm Optimization for Phase Balancing. In Proceedings of the TENCON 2006 IEEE Region 10 Conference, Hong Kong, China, 14–17 November 2006. [Google Scholar] [CrossRef]
  22. Lin, C.H.; Chen, C.S.; Chuang, H.J.; Huang, M.Y.; Huang, C.W. An Expert System for Three-Phase Balancing of Distribution Feeders. IEEE Trans. Power Syst. 2008, 23, 1488–1496. [Google Scholar] [CrossRef]
  23. Huang, M.Y.; Chen, C.S.; Lin, C.H.; Kang, M.S.; Chuang, H.J.; Huang, C.W. Three-phase balancing of distribution feeders using immune algorithm. IET Gener. Transm. Distrib. 2008, 2, 383. [Google Scholar] [CrossRef]
  24. Kuo, C.C.; Chao, Y.T. Energy management based on AM/FM/GIS for phase balancing application on distribution systems. Energy Convers. Manag. 2010, 51, 485–492. [Google Scholar] [CrossRef]
  25. Sathiskumar, M.; Thiruvenkadam, S. Phase balancing of unbalanced distribution network through hybrid greedy-fuzzy algorithm. Int. J. Comput. Appl. 2011, 34, 38–45. [Google Scholar] [CrossRef]
  26. Sathiskumar, M.; Kumar, A.N.; Lakshminarasimman, L.; Thiruvenkadam, S. A self adaptive hybrid differential evolution algorithm for phase balancing of unbalanced distribution system. Int. J. Electr. Power Energy Syst. 2012, 42, 91–97. [Google Scholar] [CrossRef]
  27. Hooshmand, R.A.; Soltani, S. Fuzzy Optimal Phase Balancing of Radial and Meshed Distribution Networks Using BF-PSO Algorithm. IEEE Trans. Power Syst. 2012, 27, 47–57. [Google Scholar] [CrossRef]
  28. Grigoras, G.; Gavrilas, M. Phase swapping of lateral branches from low-voltage distribution networks for load balancing. In Proceedings of the 2016 International Conference and Exposition on Electrical and Power Engineering (EPE), Iasi, Romania, 20–22 October 2016. [Google Scholar] [CrossRef]
  29. Toma, N.; Ivanov, O.; Neagu, B.; Gavrila, M. A PSO Algorithm for Phase Load Balancing in Low Voltage Distribution Networks. In Proceedings of the 2018 International Conference and Exposition on Electrical And Power Engineering (EPE), Iasi, Romania, 18–19 October 2018. [Google Scholar] [CrossRef]
  30. Handhal, F.K.; Rashid, A.T. Load balancing in distribution system using heuristic search algorithm. In Proceedings of the 2018 International Conference on Advance of Sustainable Engineering and Its Application (ICASEA), Wasit-Kut, Iraq, 14–15 March 2018. [Google Scholar] [CrossRef]
  31. Rios, M.A.; Castano, J.C.; Garces, A.; Molina-Cabrera, A. Phase Balancing in Power Distribution Systems: A heuristic approach based on group-theory. In Proceedings of the 2019 IEEE Milan PowerTech, Milano, Italy, 23–27 June 2019. [Google Scholar] [CrossRef]
  32. Gangwar, P.; Singh, S.N.; Chakrabarti, S. An Analytical Approach for Phase Balancing Considering Customer Load Profile. In Proceedings of the 2019 IEEE PES Innovative Smart Grid Technologies Europe (ISGT-Europe), Bucharest, Romania, 29 September–2 October 2019. [Google Scholar] [CrossRef]
  33. Ivanov, O.; Neagu, B.C.; Gavrilas, M.; Grigoras, G.; Sfintes, C.V. Phase Load Balancing in Low Voltage Distribution Networks Using Metaheuristic Algorithms. In Proceedings of the 2019 International Conference on Electromechanical and Energy Systems (SIELMEN), Craiova, Romania, 9–11 October 2019. [Google Scholar] [CrossRef]
  34. Montoya, O.D.; Grisales-Noreña, L.F.; Amin, W.T.; Rojas, L.A.; Campillo, J. Vortex Search Algorithm for Optimal Sizing of Distributed Generators in AC Distribution Networks with Radial Topology. In Communications in Computer and Information Science; Springer International Publishing: Berlin/Heidelberg, Germany, 2019; pp. 235–249. [Google Scholar] [CrossRef]
  35. Gil-González, W.; Montoya, O.D.; Rajagopalan, A.; Grisales-Noreña, L.F.; Hernández, J.C. Optimal Selection and Location of Fixed-Step Capacitor Banks in Distribution Networks Using a Discrete Version of the Vortex Search Algorithm. Energies 2020, 13, 4914. [Google Scholar] [CrossRef]
  36. Montoya, O.D.; Gil-González, W.; Grisales-Noreña, L. An exact MINLP model for optimal location and sizing of DGs in distribution networks: A general algebraic modeling system approach. Ain Shams Eng. J. 2020, 11, 409–418. [Google Scholar] [CrossRef]
  37. Montoya, O.D.; Gil-González, W.; Hernández, J.C.; Giral-Ramírez, D.A.; Medina-Quesada, A. A Mixed-Integer Nonlinear Programming Model for Optimal Reconfiguration of DC Distribution Feeders. Energies 2020, 13, 4440. [Google Scholar] [CrossRef]
  38. Doğan, B.; Ölmez, T. A new metaheuristic for numerical function optimization: Vortex Search algorithm. Inf. Sci. 2015, 293, 125–145. [Google Scholar] [CrossRef]
  39. Özkış, A.; Babalık, A. A novel metaheuristic for multi-objective optimization problems: The multi-objective vortex search algorithm. Inf. Sci. 2017, 402, 124–148. [Google Scholar] [CrossRef]
  40. Shen, T.; Li, Y.; Xiang, J. A Graph-Based Power Flow Method for Balanced Distribution Systems. Energies 2018, 11, 511. [Google Scholar] [CrossRef] [Green Version]
  41. Garces, A. A Linear Three-Phase Load Flow for Power Distribution Systems. IEEE Trans. Power Syst. 2016, 31, 827–828. [Google Scholar] [CrossRef]
  42. Montoya, O.D.; Gil-González, W.; Giral, D.A. On the Matricial Formulation of Iterative Sweep Power Flow for Radial and Meshed Distribution Networks with Guarantee of Convergence. Appl. Sci. 2020, 10, 5802. [Google Scholar] [CrossRef]
  43. Elsaiah, S.; Benidris, M.; Mitra, J. A three-phase power flow solution method for unbalanced distribution networks. In Proceedings of the 2011 North American Power Symposium, Boston, MA, USA, 4–6 August 2011. [Google Scholar] [CrossRef]
  44. Broadwater, R.; Chandrasekaran, A.; Huddleston, C.; Khan, A. Power flow analysis of unbalanced multiphase radial distribution systems. Electr. Power Syst. Res. 1988, 14, 23–33. [Google Scholar] [CrossRef]
  45. Ramana, T.; Ganesh, V.; Sivanagaraju, S. Distributed Generator Placement And Sizing in Unbalanced Radial Distribution System. Cogener. Distrib. Gener. J. 2010, 25, 52–71. [Google Scholar] [CrossRef]
  46. Singh, D.; Misra, R.K.; Mishra, S. Distribution system feeder re-phasing considering voltage-dependency of loads. Int. J. Electr. Power Energy Syst. 2016, 76, 107–119. [Google Scholar] [CrossRef]
  47. Kersting, W.H. Radial distribution test feeders. IEEE Trans. Power Syst. 1991, 6, 975–985. [Google Scholar] [CrossRef]
  48. Panesso-Hernández, A.F.; Mora-Flórez, J.J. Single Phase Fault Location in Power Distribution Systems Considering Capacitive Effect and Not Homogeneous Lines (In Spanish). Sci. Tech. 2012, 1, 189–197. [Google Scholar] [CrossRef]
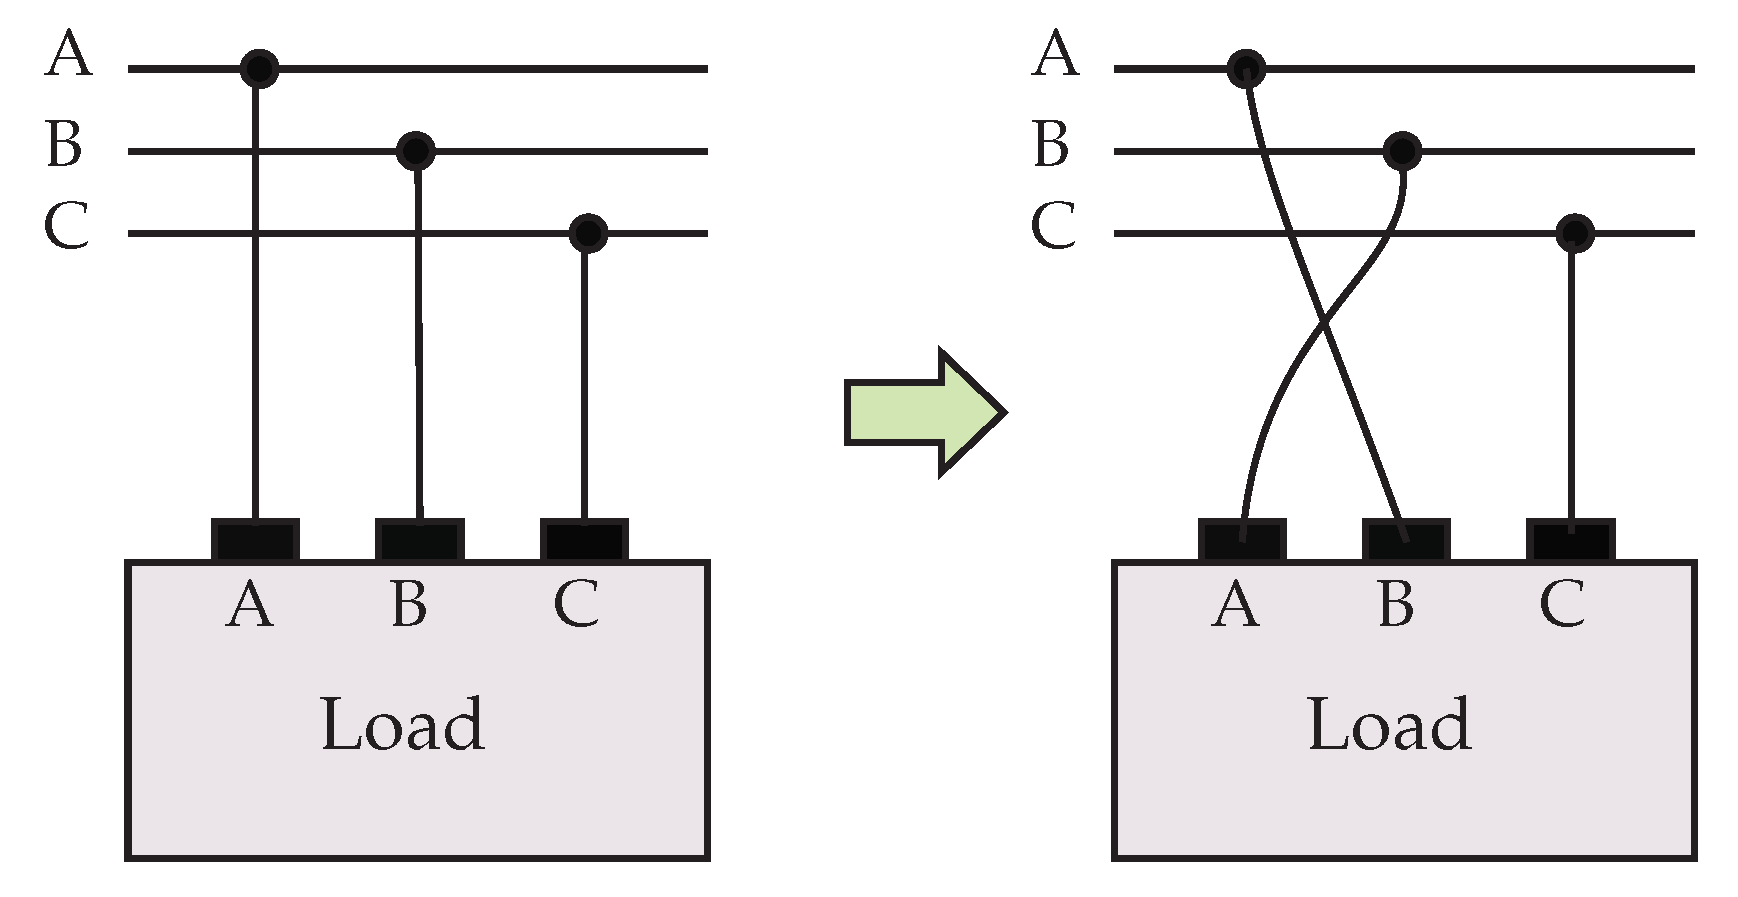
Figure 1. Phase-swapping according to type of connection
Energies 14 01282 g001
Figure 2. Unbalanced distribution system for the application example.
Energies 14 01282 g002
Figure 3. Wye connection.
Energies 14 01282 g003
Figure 4. Delta connection.
Energies 14 01282 g004
Figure 5. Flow diagram of the three-phase iterative sweep method used in the slave stage of the methodology proposed.
Energies 14 01282 g005
Figure 6. Electrical configuration of the 8-node system.
Energies 14 01282 g006
Figure 7. Electrical configuration of the 25-node system.
Energies 14 01282 g007
Figure 8. Electrical configuration of the 37-node system.
Energies 14 01282 g008
Figure 9. Voltage profiles in the 8-node test system: (a) phase A, (b) phase B, and (c) phase C.
Energies 14 01282 g009
Figure 10. Voltage profiles in the 25-node test system: (a) phase A, (b) phase B, and (c) phase C.
Energies 14 01282 g010
Figure 11. Voltage profiles in the 37 nodes test system: (a) phase A, (b) phase B, and (c) phase C.
Energies 14 01282 g011
Figure 12. Unbalanced percentage for the 8-node test system: (a) active power and (b) reactive power.
Energies 14 01282 g012
Figure 13. Voltage profiles in the 8-node test system: (a) modified benchmark case and (b) proposed DVSA.
Energies 14 01282 g013
Figure 14. Unbalanced percentage of the 25-node test system: (a) active power and (b) reactive power.
Energies 14 01282 g014
Figure 15. Voltage profiles for the 25-node test system: (a) modified benchmark case and (b) proposed DVSA
Energies 14 01282 g015
Figure 16. Unbalanced percentage of the 37-node test system: (a) active power and (b) reactive power.
Energies 14 01282 g016
Figure 17. Voltage profiles for the IEEE 37-node test system: (a) modified benchmark case and (b) DVSA proposed.
Energies 14 01282 g017
Table 1. Summary of the algorithms presented in the state of the art.
ReferenceMethod/Algorithm
[16]Mixed-integer programming
[17]Simulated Annealing
[3,11,18,31,33]Genetic Algorithm
[19,30]Backward recurrence search heuristic algorithm
[20]Ant colony optimization algorithm
[21,27,29]Particle Swarm Optimization Algorithm
[22]Heuristic rules
[23]Immune Algorithm
[24]Automatic System-Mapping
[25,26]Hybrid Heuristic Algorithm
[8,28]Heuristic Method
[32]Analytic approach
Table 2. Summary of the objective functions presented in the state of the art.
ReferenceObjective Function
[8,16,18,19,21,25,26,28,29,30,32]Minimize system-unbalancing
[17,22,23,27]Minimize operative costs
[11,24,31]Minimize power losses
[3,20,33]Minimize energy losses
Table 3. Possible types of connections for the loads presented in the system [3].
Type of Connection (h)ConnectionSequence
1ABC
2BCANo change
3CAB
4ACB
5CBAChange
6BAC
Table 4. Nodal voltage per phase in the 8-node test system.
MATLAB®DigSILENT©
NodePhase APhase BPhase CPhase APhase BPhase C
V A δ i A V B δ i B V C δ i C V A δ i A V B δ i B V C δ i C
11.00000.00001.0000−120.00001.0000120.00001.00000.00291.0001−119.99320.9999119.9903
20.9983−0.03850.9991−119.96510.9961120.02030.9983−0.03570.9992−119.95840.9960120.0107
30.9993−0.06350.9973−119.89730.9926119.98810.9994−0.06060.9974−119.89050.9925119.9785
40.9994−0.06860.9974−119.89240.9923119.98890.9994−0.06580.9974−119.88560.9922119.9793
50.9984−0.04740.9992−119.95670.9955120.02160.9984−0.04460.9993−119.94990.9954120.0120
60.9984−0.05320.9992−119.95120.9952120.02250.9985−0.05030.9993−119.94440.9951120.0128
70.9976−0.03680.9992−119.97670.9962120.03140.9977−0.03400.9993−119.97000.9961120.0217
80.9994−0.05540.9968−119.89600.9927119.97950.9995−0.05250.9969−119.88920.9926119.9699
Table 5. Numerical results for the 8-node test system.
ParameterMATLAB® DigSILENT©Units
Iterations53-
Proc. time0.0905-s
Losses phase A1.71581.7158kW
Losses phase B2.33052.3295kW
Losses phase C9.94629.9487kW
Total losses13.992513.9940kW
Table 6. Nodal voltage per phase in the 25-node test system.
MATLAB®DigSILENT©
NodePhase APhase BPhase CPhase APhase BPhase C
V A δ i A V B δ i B V C δ i C V A δ i A V B δ i B V C δ i C
11.00000.00001.0000−120.00001.0000120.00001.0000−0.00341.0000−119.99651.0000119.9999
20.9750−0.65010.9867−120.13610.9810119.56390.9749−0.65360.9868−120.13240.9810119.5638
30.9691−0.76370.9838−120.17320.9766119.45720.9690−0.76720.9838−120.16950.9766119.4572
40.9662−0.80260.9829−120.18710.9747119.41520.9661−0.80610.9830−120.18340.9747119.4151
50.9651−0.80770.9823−120.18540.9739119.41290.9650−0.81120.9823−120.18170.9739119.4128
60.9617−0.77790.9791−120.07240.9709119.55940.9617−0.78140.9791−120.06880.9709119.5593
70.9508−0.89950.9729−120.00390.9615119.54210.9507−0.90300.9729−120.00020.9615119.5420
80.9594−0.78650.9779−120.08550.9709119.56830.9593−0.79000.9779−120.08190.9709119.5683
90.9438−0.96330.9689−119.99150.9566119.53860.9438−0.96690.9689−119.98780.9566119.5385
100.9388−1.02060.9658−119.98300.9528119.53850.9387−1.02410.9658−119.97940.9528119.5385
110.9363−1.05120.9643−119.97930.9510119.53710.9362−1.05470.9644−119.97570.9510119.5370
120.9352−1.05440.9634−119.97850.9500119.54020.9351−1.05800.9635−119.97480.9500119.5402
130.9352−1.07130.9637−119.98000.9502119.53760.9352−1.07490.9638−119.97630.9502119.5376
140.9477−0.91390.9710−119.98860.9585119.53490.9476−0.91740.9711−119.98490.9585119.5348
150.9476−0.91470.9709−119.98860.9584119.53440.9475−0.91830.9710−119.98500.9584119.5344
160.9499−0.94470.9725−119.96260.9602119.53520.9499−0.94820.9725−119.95890.9602119.5352
170.9459−0.91110.9701−119.98630.9569119.53780.9459−0.91470.9701−119.98260.9569119.5377
180.9640−0.77420.9803−120.15330.9723119.45750.9640−0.77770.9804−120.14950.9723119.4574
190.9622−0.77700.9791−120.14540.9706119.45610.9621−0.78050.9791−120.14170.9706119.4560
200.9625−0.77760.9792−120.14560.9708119.45460.9625−0.78110.9793−120.14190.9708119.4545
210.9610−0.77350.9780−120.14670.9697119.47010.9609−0.77700.9780−120.14290.9697119.4700
220.9582−0.77300.9758−120.14030.9672119.48250.9581−0.77650.9758−120.13660.9672119.4824
230.9641−0.75900.9820−120.18900.9734119.41630.9640−0.76260.9820−120.18530.9734119.4163
240.9628−0.75990.9811−120.19540.9733119.42040.9627−0.76340.9811−120.19170.9733119.4203
250.9624−0.75930.9809−120.19600.9731119.42100.9624−0.76280.9810−120.19220.9731119.4209
Table 7. Numerical results for the 25-node test system.
ParameterMATLAB® DigSILENT©Units
Iterations94
Proc. time.0.1882-s
Losses on phase A36.880136.8844kW
Losses on phase B14.783714.7835kW
Losses on phase C23.757023.7553kW
Total losses75.420775.4232kW
Table 8. Nodal voltage per phase in the IEEE 37-node test system.
MATLAB®DigSILENT©
NodePhase APhase BPhase CPhase APhase BPhase C
V A δ i A V B δ i B V C δ i C V A δ i A V B δ i B V C δ i C
11.00000.00001.0000−120.00001.0000120.00001.00000.00161.0000−119.99650.9999119.9949
20.9868−0.20740.9925−120.23200.9808119.67100.9868−0.20570.9925−120.22860.9808119.6659
30.9787−0.35960.9882−120.34450.9714119.48340.9787−0.35800.9882−120.34100.9714119.4783
40.9686−0.52600.9873−120.46850.9639119.37640.9686−0.52440.9873−120.46510.9638119.3713
50.9669−0.52140.9871−120.47190.9630119.39940.9669−0.51970.9871−120.46850.9629119.3943
60.9656−0.52300.9869−120.49060.9628119.41250.9656−0.52140.9870−120.48720.9628119.4074
70.9652−0.51920.9865−120.48660.9625119.41530.9652−0.51760.9866−120.48320.9624119.4102
80.9648−0.51820.9870−120.50040.9629119.42140.9648−0.51650.9871−120.49700.9629119.4164
90.9615−0.65320.9875−120.46560.9566119.43660.9615−0.65160.9876−120.46220.9566119.4315
100.9590−0.68320.9875−120.47740.9549119.45850.9590−0.68160.9875−120.47400.9548119.4534
110.9548−0.75190.9885−120.49530.9520119.51490.9549−0.75030.9886−120.49190.9519119.5098
120.9549−0.76310.9886−120.48370.9511119.52060.9549−0.76140.9887−120.48030.9510119.5155
130.9506−0.81070.9894−120.52330.9496119.57210.9506−0.80910.9895−120.51990.9495119.5671
140.9452−0.90990.9907−120.53510.9450119.64110.9452−0.90830.9907−120.53170.9450119.6361
150.9457−0.92730.9897−120.48650.9424119.63720.9457−0.92570.9897−120.48310.9423119.6322
160.9458−0.94130.9898−120.47170.9413119.64290.9459−0.93970.9898−120.46830.9412119.6379
170.9461−0.88020.9863−120.46210.9428119.59120.9462−0.87860.9864−120.45870.9428119.5862
180.9384−0.98140.9925−120.61040.9431119.74870.9384−0.97980.9926−120.60700.9430119.7437
190.9365−1.02430.9933−120.61230.9414119.77850.9365−1.02270.9933−120.60890.9413119.7735
200.9368−1.06440.9937−120.57380.9392119.77440.9368−1.06280.9937−120.57040.9392119.7694
210.9369−1.07860.9938−120.55890.9381119.78020.9370−1.07700.9939−120.55550.9381119.7752
220.9369−1.07790.9938−120.56110.9385119.77380.9369−1.07630.9939−120.55770.9384119.7688
230.9594−0.64510.9854−120.47880.9553119.41890.9594−0.64350.9855−120.47540.9552119.4139
250.9790−0.35610.9864−120.30580.9696119.46900.9790−0.35450.9864−120.30240.9695119.4639
260.9792−0.37200.9865−120.28840.9683119.47550.9792−0.37040.9866−120.28500.9683119.4704
270.9791−0.33210.9847−120.29790.9699119.44900.9791−0.33040.9848−120.29450.9698119.4439
280.9783−0.34790.9854−120.32030.9695119.43090.9783−0.34630.9854−120.31690.9694119.4258
290.9775−0.29860.9809−120.31780.9685119.35910.9775−0.29700.9809−120.31440.9685119.3540
300.9770−0.29470.9809−120.32380.9686119.36390.9770−0.29310.9809−120.32030.9686119.3588
310.9743−0.28090.9813−120.35950.9690119.39730.9743−0.27930.9813−120.35610.9689119.3922
320.9794−0.22760.9742−120.25090.9663119.20860.9794−0.22600.9742−120.24750.9663119.2035
330.9796−0.20900.9731−120.25020.9665119.18870.9797−0.20740.9732−120.24680.9664119.1836
340.9797−0.19900.9724−120.24470.9666119.17880.9797−0.19740.9724−120.24130.9665119.1737
350.9809−0.09840.9637−120.15530.9666119.07320.9809−0.09680.9637−120.15190.9665119.0682
360.9811−0.08590.9626−120.14510.9666119.05990.9811−0.08430.9627−120.14160.9665119.0548
370.9812−0.07080.9617−120.14000.9669119.04620.9812−0.06920.9617−120.13660.9668119.0411
Table 9. Numerical results for the IEEE 37-node test system.
ParameterMATLAB® DigSILENT©Units
Iterations94-
Proc. time0.2919-s
Losses on phase A27.153227.1533kW
Losses on phase B11.914311.9121kW
Losses on phase C37.068337.0732kW
Total losses76.135776.1386kW
Table 10. Parameters used to implement the DVSA proposed.
Discrete Vortex Search Algorithm
Number of candidate solutions10
Number of iterations800
Iterations to stop the process250
Generation of the candidate solutionGaussian distribution
Three-Phase Iterative Sweep Power Flow
Number of iterations1000
Tolerance 1 × 10 10
Tests per System
Number of evaluations100
Table 11. Optimal phase-balancing results in the 8-node test system.
MethodConnectionsPhase A (kW)Phase B (kW)Phase C (kW)Total (kW)
Mod. benchmark case 1 , 1 , 1 , 1 , 1 , 1 , 1 1.71582.33059.946213.9925
CBGA 6 , 1 , 5 , 1 , 4 , 4 , 1 2.72954.09573.761710.5869
DVSA 6 , 1 , 5 , 1 , 2 , 1 , 1 2.72954.09573.761710.5869
DigSILENT© 6 , 1 , 5 , 1 , 2 , 1 , 1 2.72944.09573.761910.5869
Table 12. Results of the optimal phase-balancing for the 25-node test system.
MethodConnectionsPh. A (kW)Ph. B (kW)Ph. C (kW)Total (kW)
Mod. benchmark case{1,1,1,1,1,1,1,1,1,1,1,1,1,1,
1,1,1,1,1,1,1,1,1,1}
36.880114.783723.75775.4207
CBGA{1,1,3,5,2,1,1,1,2,6,5,1,5,3,
6,6,3,3,1,3,5,2,4,3}
25.762625.951020.578272.2919
DVSA{1,2,4,5,6,1,2,3,1,5,4,3,3,5,
5,2,3,3,5,4,2,2,2,3}
25.664526.161320.463072.2888
DigSILENT©{1,2,4,5,6,1,2,3,1,5,4,3,3,5,
5,2,3,3,5,4,2,2,2,3}
25.664426.164220.460172.2887
Table 13. Results of the optimal phase-balancing in the 37-node test system.
MethodConnectionsPh. A (kW)Ph. B (kW)Ph. C (kW)Total (kW)
Mod. benchmark case{1,1,1,1,1,1,1,1,1,1,1,1,1,1,
1,1,1,1,1,1,1,1,1,1,1,1,1,1,
1,1,1,1,1,1,1}
27.153211.914337.068376.1357
CBGA{4,1,1,6,4,4,6,4,1,1,6,5,2,1,
2,3,1,5,1,4,3,2,6,5,3,2,1,6,
5,2,1,4,1,2,3}
19.943420.895720.73961.5785
DVSA{4,1,1,5,3,4,2,3,1,1,3,2,2,1,
3,5,2,3,1,3,6,1,2,3,3,2,1,1,
2,4,1,4,1,2,4}
21.065621.698918.715561.4801
DigSILENT©{4,1,1,5,3,4,2,3,1,1,3,2,2,1,
3,5,2,3,1,3,6,1,2,3,3,2,1,1,
2,4,1,4,1,2,4}
21.064421.700518.715361.4802
Publisher’s Note: MDPI stays neutral with regard to jurisdictional claims in published maps and institutional affiliations.